mackay city flood study
TRANSCRIPT
Mackay City Flood Study
Mackay Regional Council 0500-47-K1, 22 October 2021
wrmwater.com.au 0500-47-K1| 22 October 2021 | Page 2
Report Title Mackay City Flood Study
Client Mackay Regional Council 73 Gordon St, Mackay QLD 4740
Report Number 0500-47-K1
Revision Number Report Date Report Author Reviewer
0500-17-I_DRAFT 6 November 2017 BC/GR GR
0500-17-I1 18 February 2019 BC/GR GR
0500-17-I2 8 July 2019 BC/GR GR
0500-47-F 24 July 2020 AN/RN/GR GR
0500-47-K 9 April 2021 BC/RN GR
0500-47-K1 22 October 2021 BC/RN GR
For and on behalf of WRM Water & Environment Pty Ltd Level 9, 135 Wickham Tce, Spring Hill PO Box 10703 Brisbane Adelaide St Qld 4000 Tel 07 3225 0200
Greg Roads Principal Engineer
NOTE: This report has been prepared on the assumption that all information, data and reports provided to us by our client, on behalf of our client, or by third parties (e.g. government agencies) is complete and accurate and on the basis that such other assumptions we have identified (whether or not those assumptions have been identified in this advice) are correct. You must inform us if any of the assumptions are not complete or accurate. We retain ownership of all copyright in this report. Except where you obtain our prior written consent, this report may only be used by our client for the purpose for which it has been provided by us.
wrmwater.com.au 0500-47-K1| 22 October 2021 | Page 3
Contents
1 Introduction ________________________________________________________ 5 1.1 Overview _____________________________________________________________ 5 1.2 Adopted approach _____________________________________________________ 5 1.3 Report structure ______________________________________________________ 5
2 Background ________________________________________________________ 7 2.1 Catchment characteristics ______________________________________________ 7
2.1.1 Pioneer River ___________________________________________________ 7 2.1.2 Mackay City _____________________________________________________ 7
2.2 Previous flood studies __________________________________________________ 7 2.2.1 Pioneer River ___________________________________________________ 7 2.2.2 Shellgrit Creek Catchment ________________________________________ 8 2.2.3 Mackay CBD _____________________________________________________ 8 2.2.4 Mackay Storm Tide Study _________________________________________ 8
3 Model configuration and calibration _____________________________________ 9 3.1 Overview _____________________________________________________________ 9 3.2 Model configuration____________________________________________________ 9 3.3 Pipe Network _________________________________________________________ 9 3.4 Manning’s ‘n’ values __________________________________________________ 11 3.5 Model boundary conditions _____________________________________________ 11 3.6 2008 event Calibration ________________________________________________ 11
3.6.1 Overview ______________________________________________________ 11 3.6.2 Model results___________________________________________________ 13
4 Design discharges ___________________________________________________ 15 4.1 Overview ____________________________________________________________ 15 4.2 Mackay City design discharge ___________________________________________ 15
4.2.1 Design rainfalls _________________________________________________ 15 4.2.2 Areal reduction factor ___________________________________________ 16
5 Design flood levels __________________________________________________ 17 5.1 Overview ____________________________________________________________ 17 5.2 Mackay City model____________________________________________________ 17
5.2.1 General _______________________________________________________ 17 5.2.2 Adopted tailwater conditions _____________________________________ 17 5.2.3 Design flood levels, depths and extents ____________________________ 17 5.2.4 Comparison to previous studies ___________________________________ 18 5.2.5 Storm tide inundation mapping ___________________________________ 18 5.2.6 Pioneer River overflow flood mapping _____________________________ 21
6 Effects of climate change ____________________________________________ 22
wrmwater.com.au 0500-47-K1| 22 October 2021 | Page 4
6.1 General _____________________________________________________________ 22
6.2 Adopted design rainfall and boundary conditions __________________________ 22
6.3 Model results ________________________________________________________ 23
6.3.1 Mackay City stormwater inundation _______________________________ 23
6.3.2 Mackay City storm tide inundation ________________________________ 23
6.3.3 Mackay City Pioneer River overflows_______________________________ 23
7 Provisional hydraulic hazard classification _______________________________24
7.1 Flood hazard classification_____________________________________________ 24
7.2 Flood hazard Mapping _________________________________________________ 25
8 References ________________________________________________________26
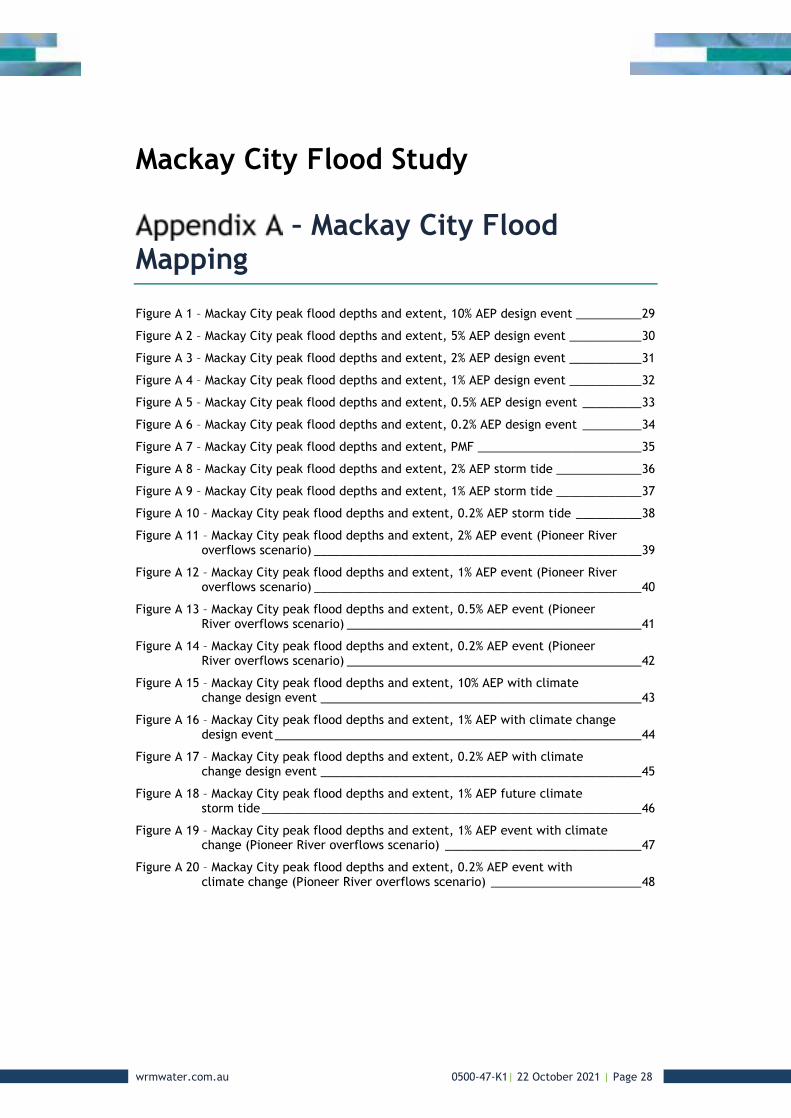
– Mackay City Flood Mapping ____________________________________28
- Provisional flood hazard categories for Mackay City_________________49
List of Figures
Figure 1.1 – Pioneer River catchment ______________________________________________6
Figure 3.1 – Mackay City Model configuration ______________________________________10
Figure 3.2 – Mackay City Model landuse map _______________________________________12
Figure 3.3 – Mackay City Model 2008 calibration event ______________________________14
Figure 5.1 – Longitudinal section of design flood levels along Shellgrit Creek ___________19
Figure 5.2 – 1% AEP Peak Flood Level Difference between the Mackay City model, Shellgrit Creek and Sandfly Creek models _______________________________20
Figure 7.1 – General flood hazard vulnerability curves (Source: AIDR, 2017) ____________24
List of Tables
Table 3.1 – Manning’s ‘n’ parameters_____________________________________________11
Table 4.1 – Mackay City catchment design rainfall depths, ARR 2019 rainfalls __________15
Table 4.2 – Mackay City catchment design rainfall growth factors_____________________15
Table 4.3 – ARR 1987 and BOM 2016 rainfalls comparison, Mackay City catchment_______16
Table 5.1 – Wet Tropics temporal pattern number used for design event modelling, Mackay City ________________________________________________________17
Table 5.2 – Predicted peak storm tide levels_______________________________________18
Table 5.3 – Peak overflow discharges overtopping the Pioneer River levee _____________21
Table 7.1 - Combined hazard curves – vulnerability thresholds _______________________25
Table 7.2 - Combined hazard curves – vulnerability thresholds classification limits ______25
wrmwater.com.au 0500-47-K1| 22 October 2021 | Page 5
1 Introduction
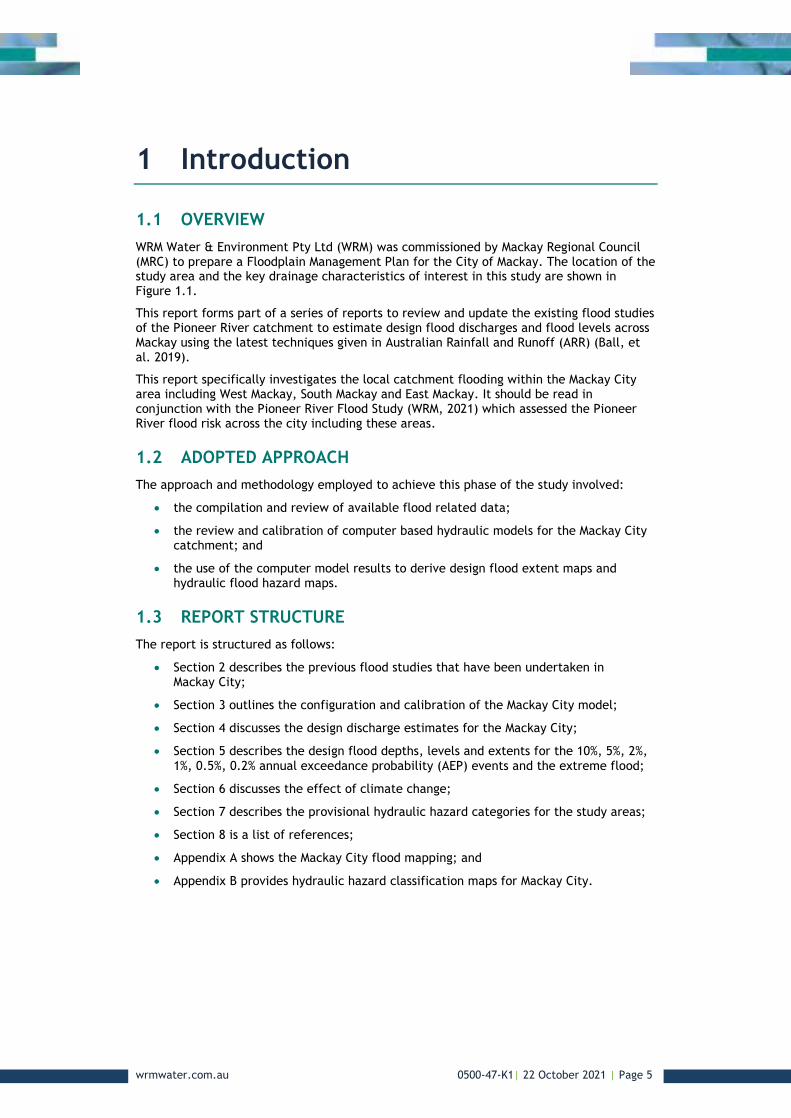
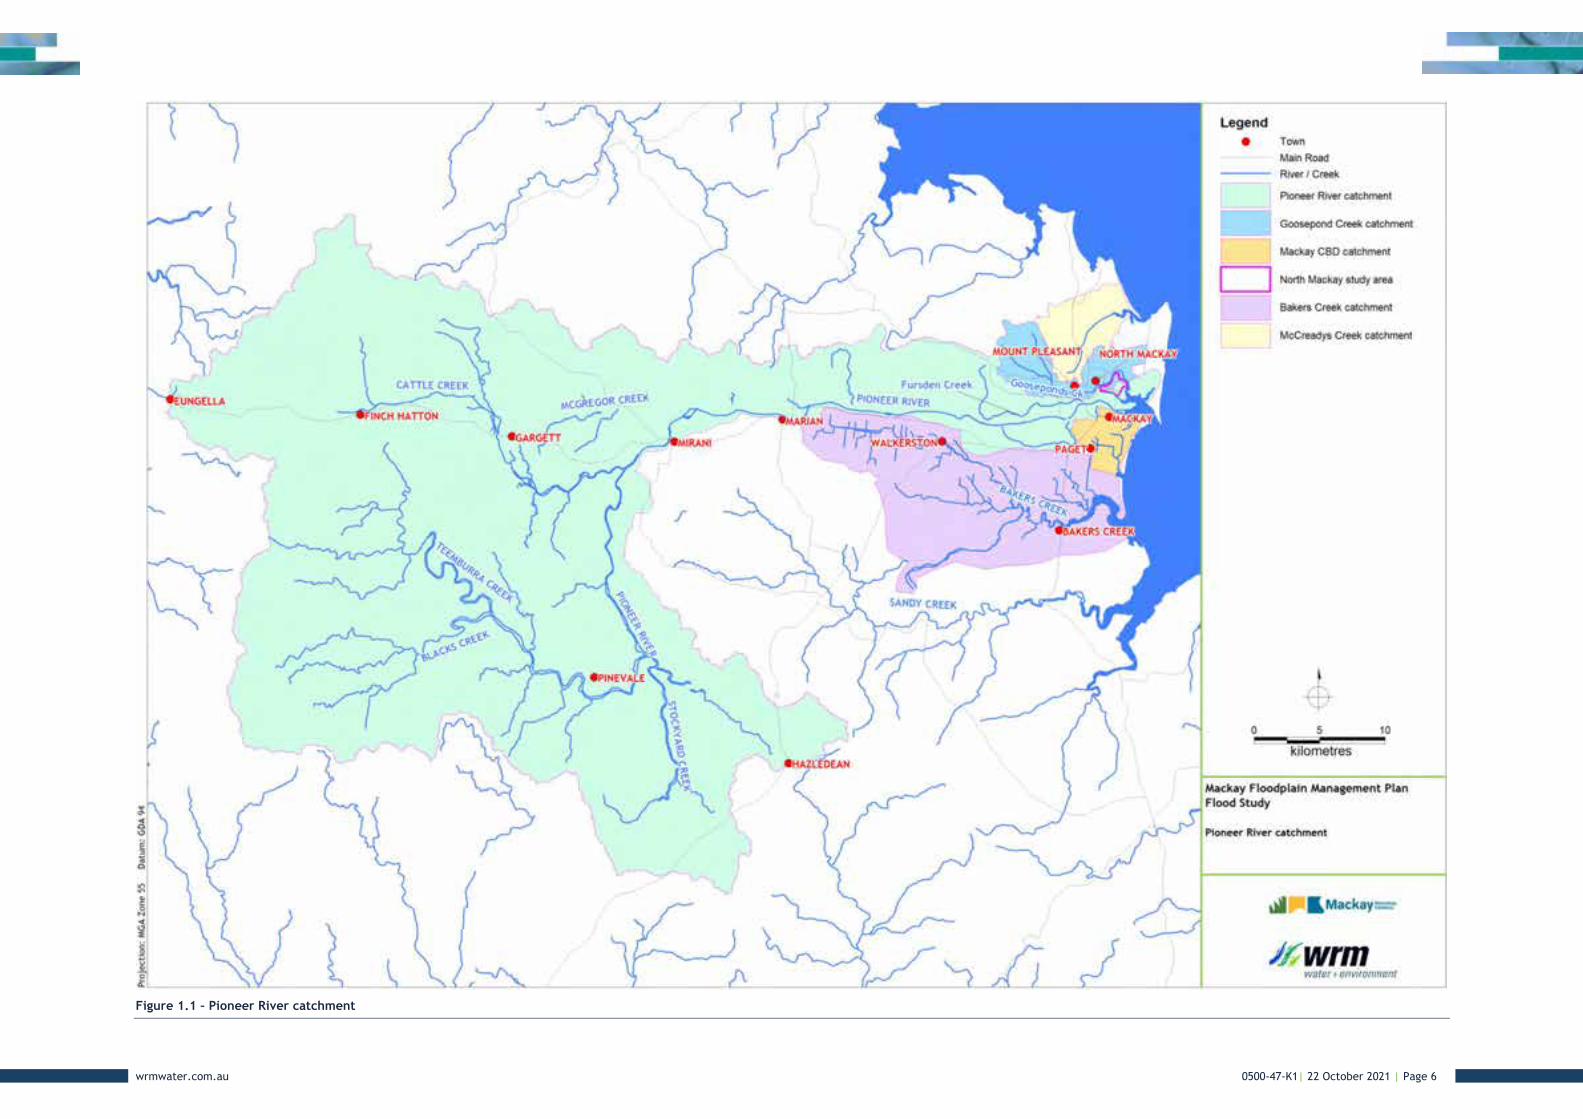
1.1 OVERVIEW WRM Water & Environment Pty Ltd (WRM) was commissioned by Mackay Regional Council (MRC) to prepare a Floodplain Management Plan for the City of Mackay. The location of the study area and the key drainage characteristics of interest in this study are shown in Figure 1.1.
This report forms part of a series of reports to review and update the existing flood studies of the Pioneer River catchment to estimate design flood discharges and flood levels across Mackay using the latest techniques given in Australian Rainfall and Runoff (ARR) (Ball, et al. 2019).
This report specifically investigates the local catchment flooding within the Mackay City area including West Mackay, South Mackay and East Mackay. It should be read in conjunction with the Pioneer River Flood Study (WRM, 2021) which assessed the Pioneer River flood risk across the city including these areas.
1.2 ADOPTED APPROACH The approach and methodology employed to achieve this phase of the study involved:
• the compilation and review of available flood related data;
• the review and calibration of computer based hydraulic models for the Mackay City catchment; and
• the use of the computer model results to derive design flood extent maps and hydraulic flood hazard maps.
1.3 REPORT STRUCTURE The report is structured as follows:
• Section 2 describes the previous flood studies that have been undertaken in Mackay City;
• Section 3 outlines the configuration and calibration of the Mackay City model;
• Section 4 discusses the design discharge estimates for the Mackay City;
• Section 5 describes the design flood depths, levels and extents for the 10%, 5%, 2%, 1%, 0.5%, 0.2% annual exceedance probability (AEP) events and the extreme flood;
• Section 6 discusses the effect of climate change;
• Section 7 describes the provisional hydraulic hazard categories for the study areas;
• Section 8 is a list of references;
• Appendix A shows the Mackay City flood mapping; and
• Appendix B provides hydraulic hazard classification maps for Mackay City.
wrmwater.com.au 0500-47-K1| 22 October 2021 | Page 6
Figure 1.1 – Pioneer River catchment
wrmwater.com.au 0500-47-K1| 22 October 2021 | Page 7
2 Background
2.1 CATCHMENT CHARACTERISTICS Figure 1.1 shows the key catchments and drainage features across the greater Pioneer River catchment. The Mackay City study area within the Pioneer River catchment is drained by the following watercourses and drainage features:
• the Pioneer River;
• Shellgrit Creek and Sandfly Creek within the Mackay City.
Brief descriptions of these catchments are given below.
2.1.1 Pioneer River
The main drainage feature in the study area is the Pioneer River. The Pioneer River catchment extends from the Connors Range to the west and is bordered by the Leila Creek and Murray Creek catchments to the north, the Bowen River catchment to the west and Sandy Creek, Bakers Creek and the Isaac River catchments to the south (see Figure 1.1). It includes the major tributaries of Cattle Creek, Teemburra Creek, Blacks Creek, Stockyard Creek and Macgregor Creek in the upper catchment and the floodplain channels of Fursden Creek, Goosepond Creek and Lagoon Creek in the lower catchment in the vicinity of Mackay. The total catchment area of the Pioneer River is approximately 1,560 km2.
Near Mackay, the Pioneer River consists of a main channel that is some 400 m wide and 8 m to 10 m deep. It has a highly mobile sandy bed and the water levels are controlled by the ocean tides during non-flood river flows. Major remnant channels of the Pioneer River exist across the lower floodplain with Fursden Creek located to the north and Lagoon Creek to the south. The Pioneer River overflows into these two remnant channels during moderate sized flood events and ‘back flows’ into the creeks during smaller events. Flood levees are currently in place to protect much of the Mackay CBD and North Mackay areas.
2.1.2 Mackay City
The Mackay City is drained via two urbanised creek catchments named Shellgrit Creek and Sandfly Creek. Sandfly Creek drains Mackay City and Mackay East to the northeast towards the Pioneer River. A gated pipe drains Sandfly Creek through a levee to the Pioneer River. Shellgrit Creek drains much of South and West Mackay to the southeast around the Mackay Airport to the Coral Sea. The lower reach of Shellgrit Creek is tidally affected and is not protected by a flood levee. However, tide gates are used to prevent high tides from draining into the city area channels.
Both of the catchments have been fully urbanised with runoff draining via a combination of stormwater pipes and constructed channels. Runoff in excess of the stormwater drainage system flows along the roadways.
2.2 PREVIOUS FLOOD STUDIES
2.2.1 Pioneer River
WRM completed a flood study of the Pioneer River in 2011 for MRC. An URBS rainfall-runoff-routing model of the Pioneer River catchment was developed to estimate design discharges. The model was calibrated to six historical flood events (1958, 1970, 1990, 2000, 2007 and 2008) and then validated against annual series flood frequency analyses at five stream gauges throughout the catchment.
wrmwater.com.au 0500-47-K1| 22 October 2021 | Page 8
Design flood levels were estimated using a TUFLOW two-dimensional hydrodynamic model that extended from Mirani Weir to the Coral Sea. The model was calibrated to recorded water levels for four historical flood events (1958, 1970, 2007 and 2008). The main river channel upstream of the Dumbleton Weir was modelled in the one-dimensional domain and the downstream river and overbank areas were modelled within the two-dimensional domain using a 20 m grid. For all events, it was assumed that the flood event coincided with the HAT level of 3.64 mAHD.
WRM (2021) has updated the Pioneer River Flood Study to include the updated ARR (Ball et. al, 2019) hydrology and an update to the TUFLOW hydraulic model.
2.2.2 Shellgrit Creek Catchment
Cardno (QLD) Pty Ltd (2014) was commissioned by Mackay Regional Council to prepare a flood study of the Shellgrit Creek catchment. A rain-on-grid TUFLOW two-dimensional hydraulic model was developed for the Shellgrit Creek catchment in South Mackay to derive flood levels across the catchment and investigate relief drainage options.
The Shellgrit Creek model to the west of Paradise Street was defined using a 8 m grid and the area to the east of Paradise Street was represented using a 4 m grid. Underground pipes within Shellgrit Creek catchment were included as 1D elements in the Shellgrit Creek hydraulic model. An outflow boundary was included at the northern extent of the model (along Evan Street) to allow outflows into the Sandfly Creek catchment to the north. The Shellgrit Creek TUFLOW model was calibrated to the 2008 flood event at 8 locations.
The Shellgrit Creek model did not include interaction of flooding from the Sandfly Creek catchment and as such potentially underestimated design flood levels along the northern boundary of the model area. Also, the Shellgrit Creek model (Cardno, 2014) did not include the Pioneer River overflows which potentially has significant impacts on design flood levels during large flood event.
2.2.3 Mackay CBD
AECOM Australia Pty Ltd (2015) was commissioned by Mackay Regional Council and Queensland Government to prepare a flood study of the Mackay CBD area, which drains to Sandfly Creek. A rain-on-grid TUFLOW two-dimensional hydraulic model was developed for the Sandfly Creek catchment in Mackay CBD to derive flood levels across the catchment and investigate structural mitigation options.
The Sandfly Creek model was defined using a 4 m grid size and covered Mackay CBD, East Mackay and part of West Mackay. An outflow boundary was included at the southern extent of the model (near McKenney Street) to allow outflows into the Shellgrit Creek catchment to the south. Underground pipes within Sandfly Creek catchment were included as 1D elements in the Sandfly Creek hydraulic model. The Sandfly Creek model was calibrated to the 2008 flood event at 44 surveyed locations.
The study includes the investigation of the Pioneer River overflows during 1% AEP flood event. However, the Sandfly Creek model did not include interaction of flooding from the Shellgrit Creek catchment and as such potentially underestimated design flood levels along the southern boundary of the model area.
2.2.4 Mackay Storm Tide Study
BMT WBM Pty Ltd was commissioned by Mackay Regional Council to undertake a storm tide study in the Mackay region. The storm tide study involved a numerical modelling system to predict tropical cyclone generated storm tide inundation and estimate various Annual Exceedance Probability (AEP) storm tide levels.
Based on the Mackay Storm Tide Study (2013), BMT WBM Pty Ltd (2017) also provided time series of surge plus tide levels for the 2%, 1%, 0.2%, 0.1% AEP and the future climate 1% AEP to determine storm tide flooding in the Mackay CBD. Details of the surge plus tide time series was provided in Section 5.2.5.
wrmwater.com.au 0500-47-K1| 22 October 2021 | Page 9
3 Model configuration and calibration
3.1 OVERVIEW The Mackay CBD model (AECOM, 2015) and Shellgrit Creek model (Cardno, 2014) were integrated to form a complete model of the Mackay City area. These models were combined to allow flows to pass between the Sandfly Creek and Shellgrit Creek catchments for events from the local catchment, Pioneer River overflows and storm surge.
The combined Mackay City model adopts the same rain–on–grid modelling approach as the Mackay CBD and Shellgrit Creek models and uses the same grid size (4 m). The modelling approach and underground pipe network configuration in each model were also adopted effectively unaltered. Minor refinement of the underground pipe network and surface channels were made only where two models overlapped. This model was recalibrated to the 2008 event flood data.
For all design events, the Mackay City model was updated with the latest stormwater network data provided by MRC on 19 December 2018 and Cod Hole Outlet design drawings provided by MRC on 12 October 2018. The model was run using the HPC solver (2020-10-AB) with sub-grid-sampling.
The following section describes the combined model and the model results for the 2008 calibration event.
3.2 MODEL CONFIGURATION Figure 3.1 shows the Mackay City model configuration. The model covers a catchment area of approximately 16 km² and uses a 4 m grid. The Mackay CBD grid alignment was adopted for the Mackay City model. The sub-grid sampling (SGS) approach with a 1 m sample distance was adopted for this study.
The 2009 LiDAR was used for the 2008 event model calibration and the 2015 LiDAR was adopted for all design events. Review of the 2009 and 2015 LiDAR showed ground levels generally within ± 0.15 m between the two surveys across the model area with the exception of areas where obvious roadworks or infrastructure had been undertaken between these periods. All other surveyed digital elevation model (DEM) corrections used in the Mackay CBD and Shellgrit Creek models were used to overwrite the 2015 LiDAR. Further DEM modifications of the Cod Hole Outlet provided in October 2018 was included in the design event model.
3.3 PIPE NETWORK Figure 3.1 shows the locations of the one-dimensional pipe network used in the model. Pipe network information was obtained from the Mackay CBD and Shellgrit Creek models. All pits in the Mackay CBD model (AECOM, 2015) were assumed to be 0.9 m x 0.6 m channels. This assumption was made to not limit runoff entering the pipe network. Pits in the Shellgrit Creek model (Cardno, 2014) were modelled using depth-discharge relationship. The modelling approach of pits was adopted effectively unaltered.
The latest stormwater network data provided by MRC in December 2018 was included in the design event model. Details of the pipe network used is given in the Addendum Report (WRM, 2019b).

wrmwater.com.au 0500-47-K1| 22 October 2021 | Page 10
Figure 3.1 – Mackay City Model configuration
wrmwater.com.au 0500-47-K1| 22 October 2021 | Page 11
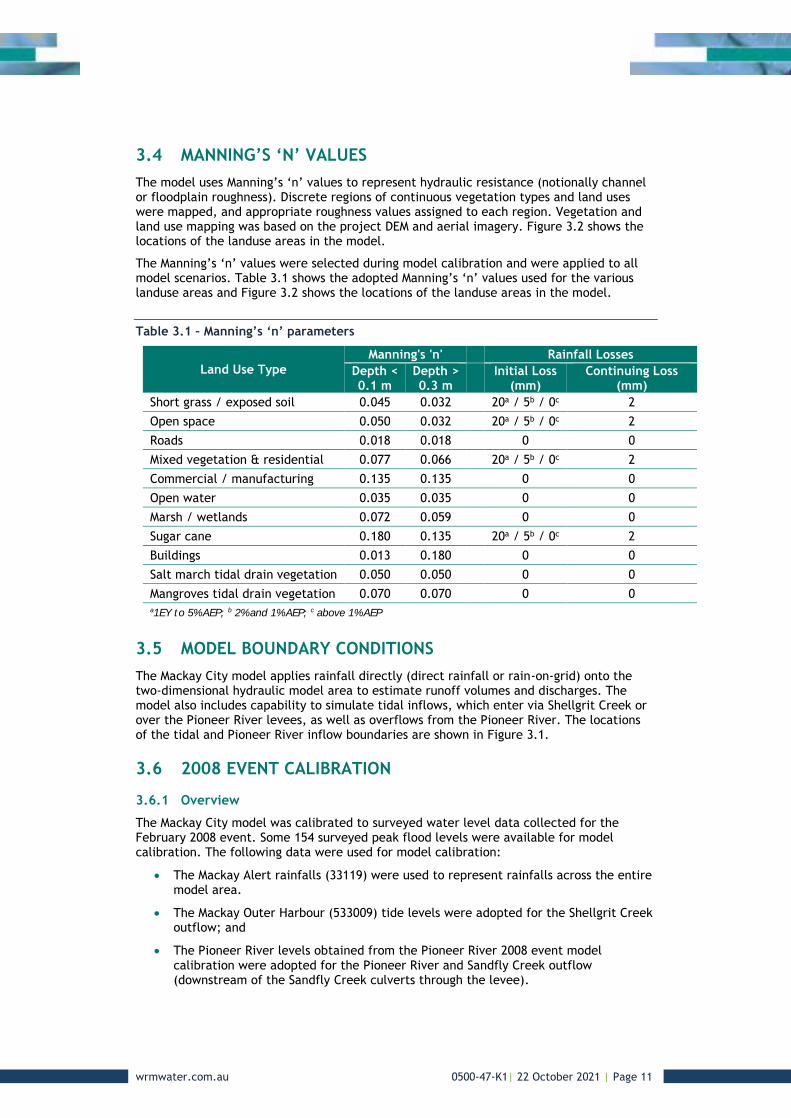
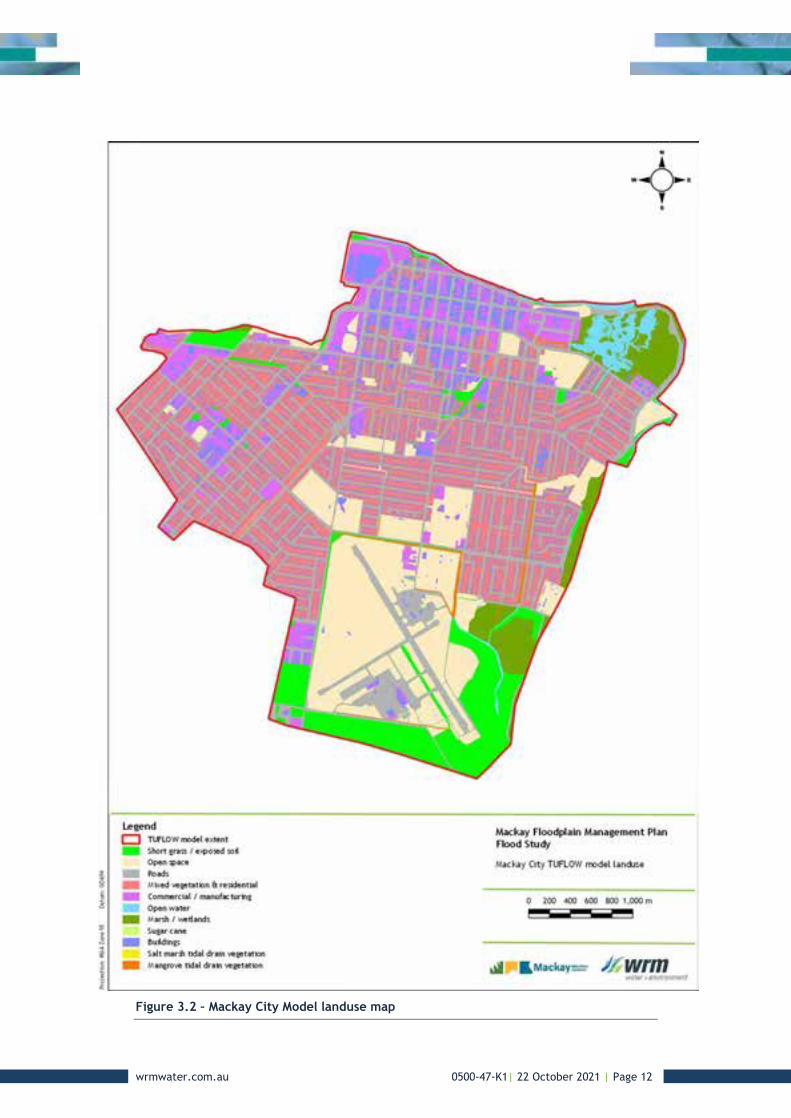
3.4 MANNING’S ‘N’ VALUES The model uses Manning’s ‘n’ values to represent hydraulic resistance (notionally channel or floodplain roughness). Discrete regions of continuous vegetation types and land uses were mapped, and appropriate roughness values assigned to each region. Vegetation and land use mapping was based on the project DEM and aerial imagery. Figure 3.2 shows the locations of the landuse areas in the model.
The Manning’s ‘n’ values were selected during model calibration and were applied to all model scenarios. Table 3.1 shows the adopted Manning’s ‘n’ values used for the various landuse areas and Figure 3.2 shows the locations of the landuse areas in the model.
Table 3.1 – Manning’s ‘n’ parameters
Land Use Type Manning's 'n' Rainfall Losses
Depth < 0.1 m
Depth > 0.3 m Initial Loss
(mm) Continuing Loss
(mm) Short grass / exposed soil 0.045 0.032 20a / 5b / 0c 2 Open space 0.050 0.032 20a / 5b / 0c 2 Roads 0.018 0.018 0 0 Mixed vegetation & residential 0.077 0.066 20a / 5b / 0c 2 Commercial / manufacturing 0.135 0.135 0 0 Open water 0.035 0.035 0 0 Marsh / wetlands 0.072 0.059 0 0 Sugar cane 0.180 0.135 20a / 5b / 0c 2 Buildings 0.013 0.180 0 0 Salt march tidal drain vegetation 0.050 0.050 0 0 Mangroves tidal drain vegetation 0.070 0.070 0 0 a1EY to 5% AEP; b 2% and 1% AEP; c above 1% AEP
3.5 MODEL BOUNDARY CONDITIONS The Mackay City model applies rainfall directly (direct rainfall or rain-on-grid) onto the two-dimensional hydraulic model area to estimate runoff volumes and discharges. The model also includes capability to simulate tidal inflows, which enter via Shellgrit Creek or over the Pioneer River levees, as well as overflows from the Pioneer River. The locations of the tidal and Pioneer River inflow boundaries are shown in Figure 3.1.
3.6 2008 EVENT CALIBRATION
3.6.1 Overview
The Mackay City model was calibrated to surveyed water level data collected for the February 2008 event. Some 154 surveyed peak flood levels were available for model calibration. The following data were used for model calibration:
• The Mackay Alert rainfalls (33119) were used to represent rainfalls across the entire model area.
• The Mackay Outer Harbour (533009) tide levels were adopted for the Shellgrit Creek outflow; and
• The Pioneer River levels obtained from the Pioneer River 2008 event model calibration were adopted for the Pioneer River and Sandfly Creek outflow (downstream of the Sandfly Creek culverts through the levee).
wrmwater.com.au 0500-47-K1| 22 October 2021 | Page 12
Figure 3.2 – Mackay City Model landuse map

wrmwater.com.au 0500-47-K1| 22 October 2021 | Page 13
3.6.2 Model results
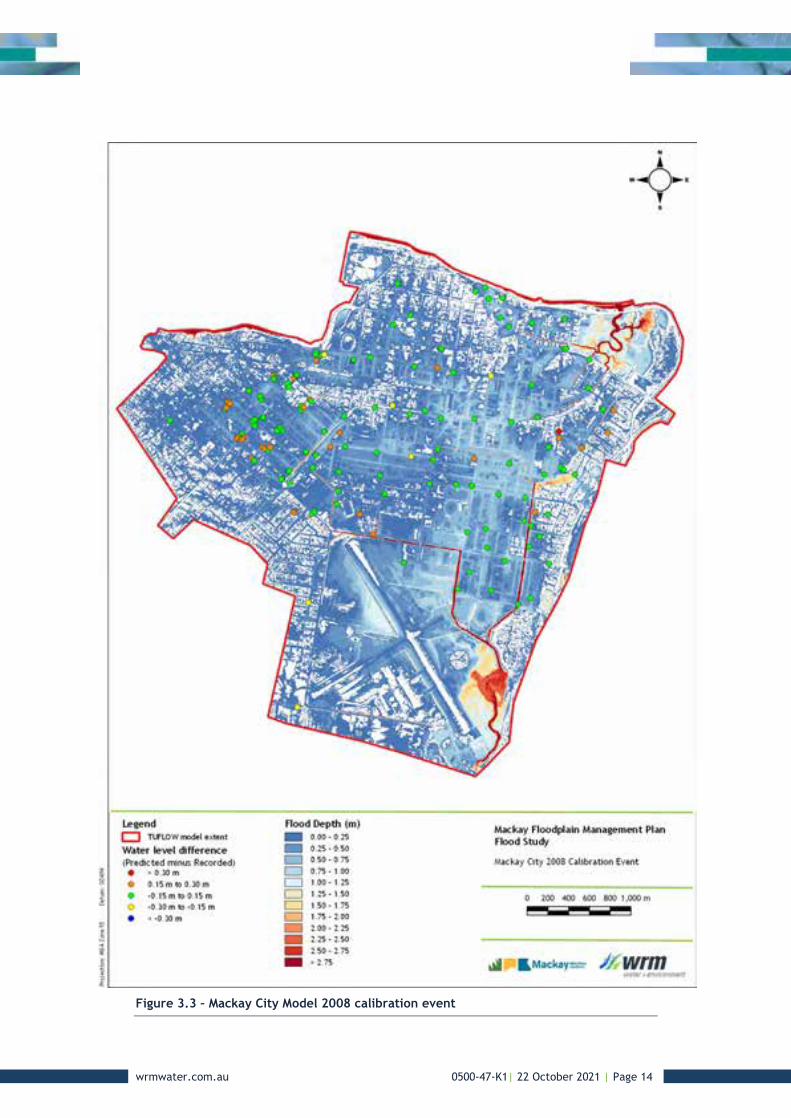
Figure 3.3 shows the predicted flood depths and extent across the Mackay City area for the 2008 event. The locations of surveyed peak flood levels and the estimated difference between the surveyed and predicted levels is also shown. Of the 154 surveyed levels, 117 are within 0.15 m of the recorded levels and the remainder with the exception of one point is within 0.3 m. The average difference is 0.05 m (high) and the standard deviation is 0.11 m. A review of the 2009 LiDAR, which has been used for model calibration, shows that the ground levels at the calibration points are about 0.05 m higher than the 2015 LiDAR ground levels (on average). The use of the 2015 Lidar would likely improve the calibration results, except in areas where infrastructure has been built.
Overall, a good calibration has been achieved for the 2008 event and model is suitable for determining design flood levels across the Mackay City area.
wrmwater.com.au 0500-47-K1| 22 October 2021 | Page 14
Figure 3.3 – Mackay City Model 2008 calibration event
wrmwater.com.au 0500-47-K1| 22 October 2021 | Page 15
4 Design discharges
4.1 OVERVIEW The TUFLOW direct rainfall method was to determine design discharges in the Mackay City area. The design discharges were determined in accordance with the methodology recommended in ARR (Ball et al., 2019), replacing ARR 1987 (Pilgrim, 1987). The major changes between ARR 2019 and ARR 1987 include:
• the use of new rainfall Intensity–Frequency–Duration (2019 IFDs), which are based on a more extensive data base, with more than 30 years of additional rainfall data and data from extra rainfall stations;
• the use of an ensemble of 10 temporal patterns for the Wet Tropics region to derive the design discharges (the temporal pattern that gives the peak discharge closest to the mean is used), compared to using single temporal pattern in ARR 1987; and
• modified areal reduction factors (ARFs).
4.2 MACKAY CITY DESIGN DISCHARGE
4.2.1 Design rainfalls
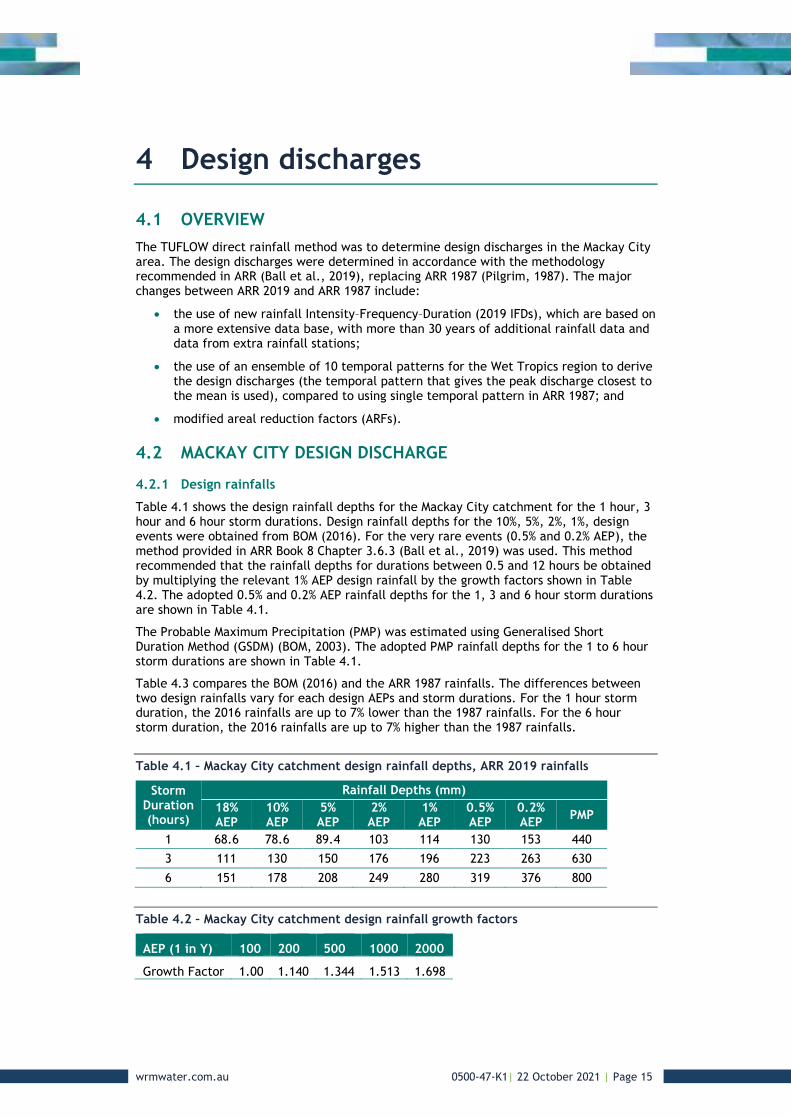
Table 4.1 shows the design rainfall depths for the Mackay City catchment for the 1 hour, 3 hour and 6 hour storm durations. Design rainfall depths for the 10%, 5%, 2%, 1%, design events were obtained from BOM (2016). For the very rare events (0.5% and 0.2% AEP), the method provided in ARR Book 8 Chapter 3.6.3 (Ball et al., 2019) was used. This method recommended that the rainfall depths for durations between 0.5 and 12 hours be obtained by multiplying the relevant 1% AEP design rainfall by the growth factors shown in Table 4.2. The adopted 0.5% and 0.2% AEP rainfall depths for the 1, 3 and 6 hour storm durations are shown in Table 4.1.
The Probable Maximum Precipitation (PMP) was estimated using Generalised Short Duration Method (GSDM) (BOM, 2003). The adopted PMP rainfall depths for the 1 to 6 hour storm durations are shown in Table 4.1.
Table 4.3 compares the BOM (2016) and the ARR 1987 rainfalls. The differences between two design rainfalls vary for each design AEPs and storm durations. For the 1 hour storm duration, the 2016 rainfalls are up to 7% lower than the 1987 rainfalls. For the 6 hour storm duration, the 2016 rainfalls are up to 7% higher than the 1987 rainfalls.
Table 4.1 – Mackay City catchment design rainfall depths, ARR 2019 rainfalls
Storm Duration (hours)
Rainfall Depths (mm) 18% AEP
10% AEP
5% AEP
2% AEP
1% AEP
0.5% AEP
0.2% AEP PMP
1 68.6 78.6 89.4 103 114 130 153 440 3 111 130 150 176 196 223 263 630 6 151 178 208 249 280 319 376 800
Table 4.2 – Mackay City catchment design rainfall growth factors
AEP (1 in Y) 100 200 500 1000 2000
Growth Factor 1.00 1.140 1.344 1.513 1.698
wrmwater.com.au 0500-47-K1| 22 October 2021 | Page 16
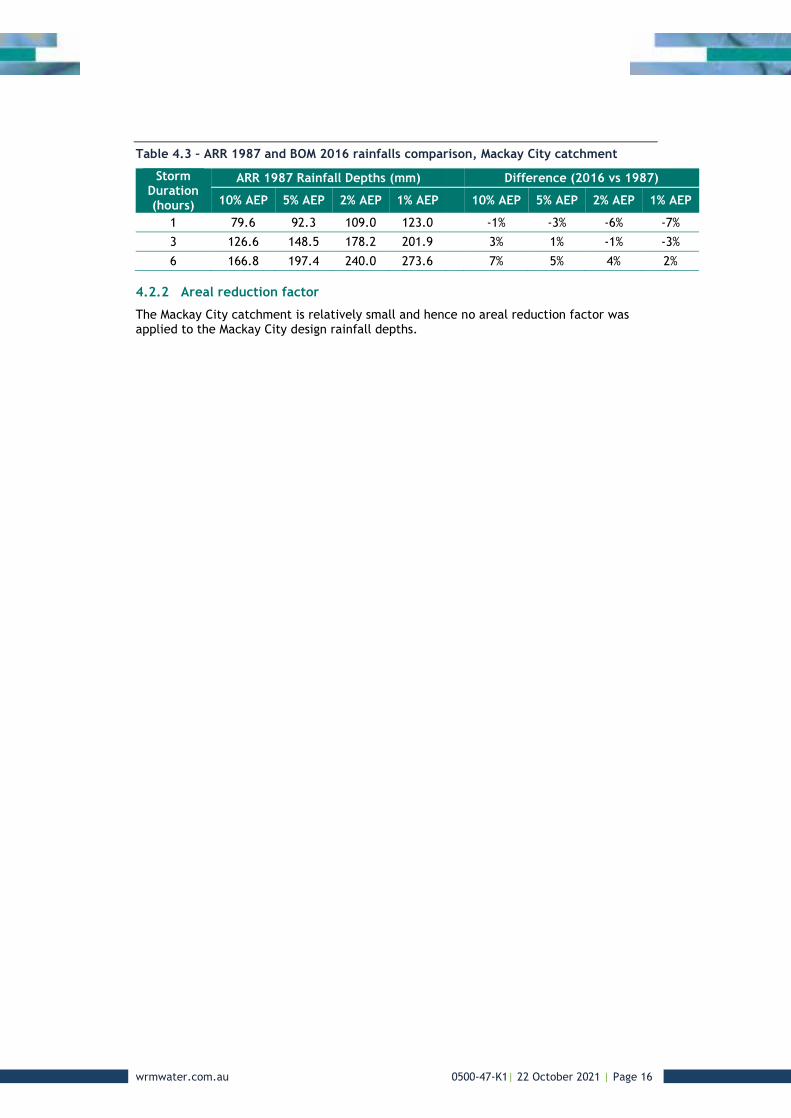
Table 4.3 – ARR 1987 and BOM 2016 rainfalls comparison, Mackay City catchment
Storm Duration (hours)
ARR 1987 Rainfall Depths (mm) Difference (2016 vs 1987)
10% AEP 5% AEP 2% AEP 1% AEP 10% AEP 5% AEP 2% AEP 1% AEP
1 79.6 92.3 109.0 123.0 -1% -3% -6% -7% 3 126.6 148.5 178.2 201.9 3% 1% -1% -3% 6 166.8 197.4 240.0 273.6 7% 5% 4% 2%
4.2.2 Areal reduction factor
The Mackay City catchment is relatively small and hence no areal reduction factor was applied to the Mackay City design rainfall depths.
wrmwater.com.au 0500-47-K1| 22 October 2021 | Page 17
5 Design flood levels
5.1 OVERVIEW The Mackay City TUFLOW models were used to estimate the peak flood levels, depths and extents for the 10% to 0.2% AEP design events and for the PMF. The models were run independently to determine the potential for flooding from each source. The results for flooding from each flood source were mapped separately. An assessment of the impact of storm surge on design levels has also been undertaken.
5.2 MACKAY CITY MODEL
5.2.1 General
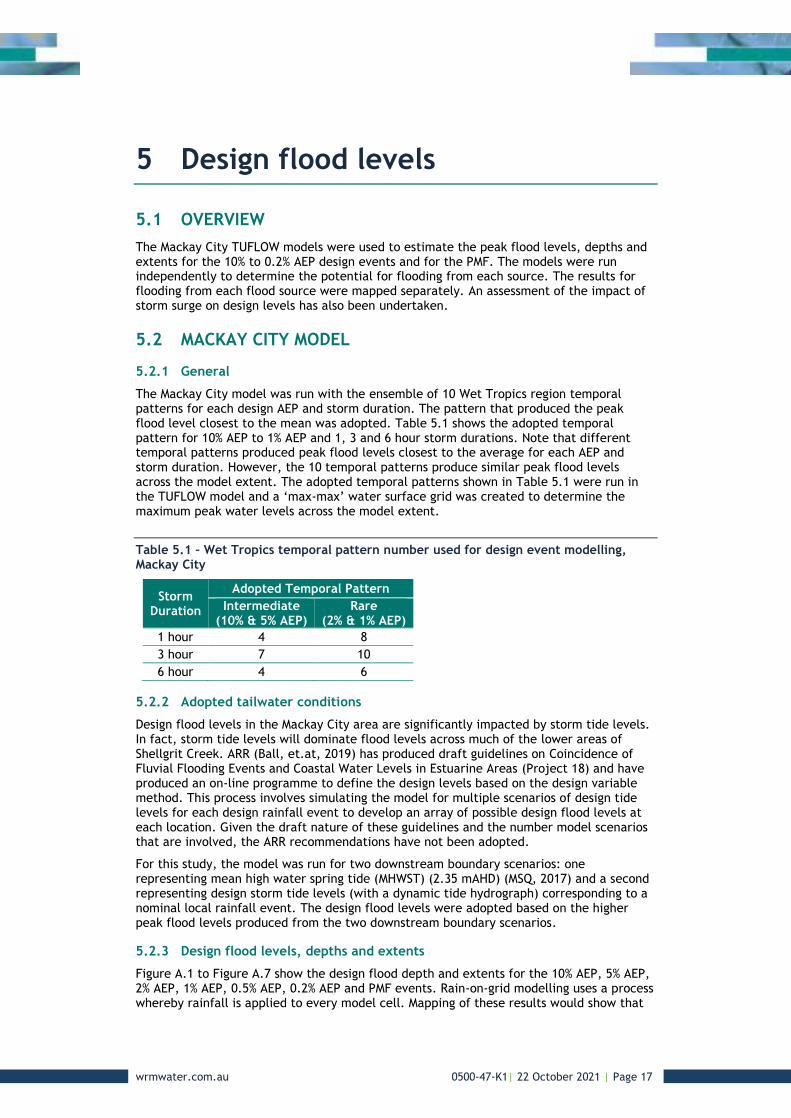
The Mackay City model was run with the ensemble of 10 Wet Tropics region temporal patterns for each design AEP and storm duration. The pattern that produced the peak flood level closest to the mean was adopted. Table 5.1 shows the adopted temporal pattern for 10% AEP to 1% AEP and 1, 3 and 6 hour storm durations. Note that different temporal patterns produced peak flood levels closest to the average for each AEP and storm duration. However, the 10 temporal patterns produce similar peak flood levels across the model extent. The adopted temporal patterns shown in Table 5.1 were run in the TUFLOW model and a ‘max-max’ water surface grid was created to determine the maximum peak water levels across the model extent.
Table 5.1 – Wet Tropics temporal pattern number used for design event modelling, Mackay City
Storm Duration
Adopted Temporal Pattern Intermediate
(10% & 5% AEP) Rare
(2% & 1% AEP) 1 hour 4 8 3 hour 7 10 6 hour 4 6
5.2.2 Adopted tailwater conditions
Design flood levels in the Mackay City area are significantly impacted by storm tide levels. In fact, storm tide levels will dominate flood levels across much of the lower areas of Shellgrit Creek. ARR (Ball, et.at, 2019) has produced draft guidelines on Coincidence of Fluvial Flooding Events and Coastal Water Levels in Estuarine Areas (Project 18) and have produced an on-line programme to define the design levels based on the design variable method. This process involves simulating the model for multiple scenarios of design tide levels for each design rainfall event to develop an array of possible design flood levels at each location. Given the draft nature of these guidelines and the number model scenarios that are involved, the ARR recommendations have not been adopted.
For this study, the model was run for two downstream boundary scenarios: one representing mean high water spring tide (MHWST) (2.35 mAHD) (MSQ, 2017) and a second representing design storm tide levels (with a dynamic tide hydrograph) corresponding to a nominal local rainfall event. The design flood levels were adopted based on the higher peak flood levels produced from the two downstream boundary scenarios.
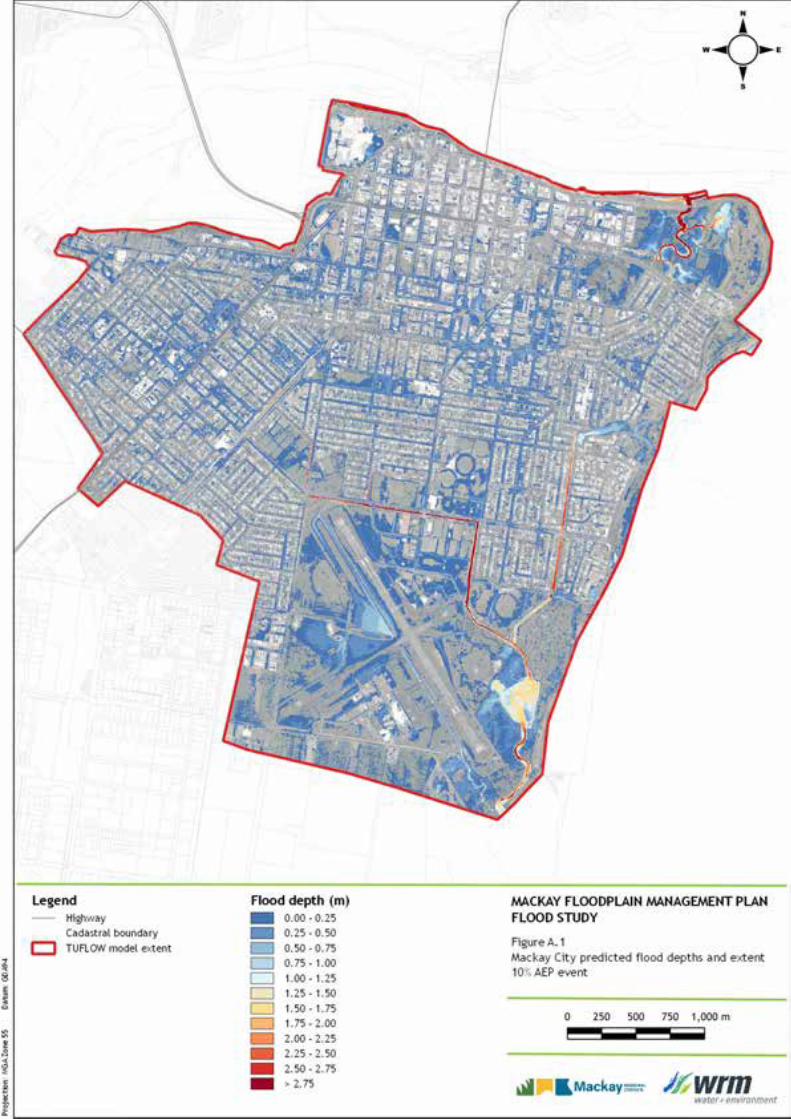
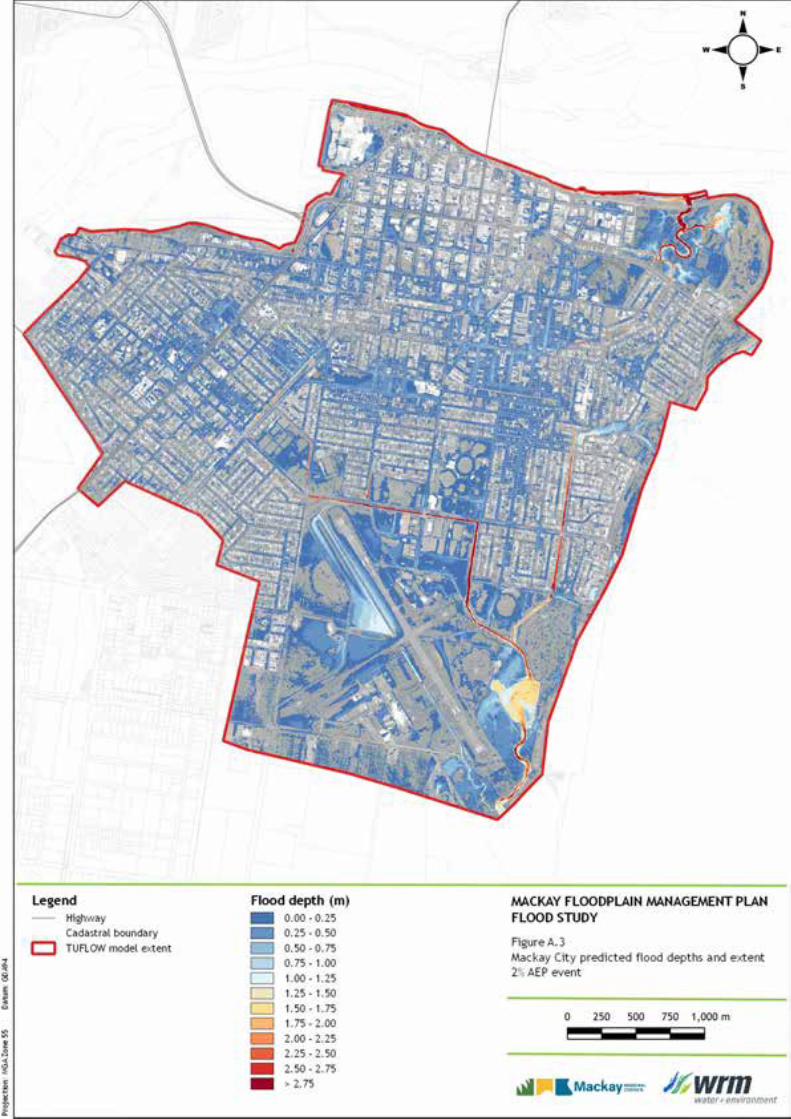
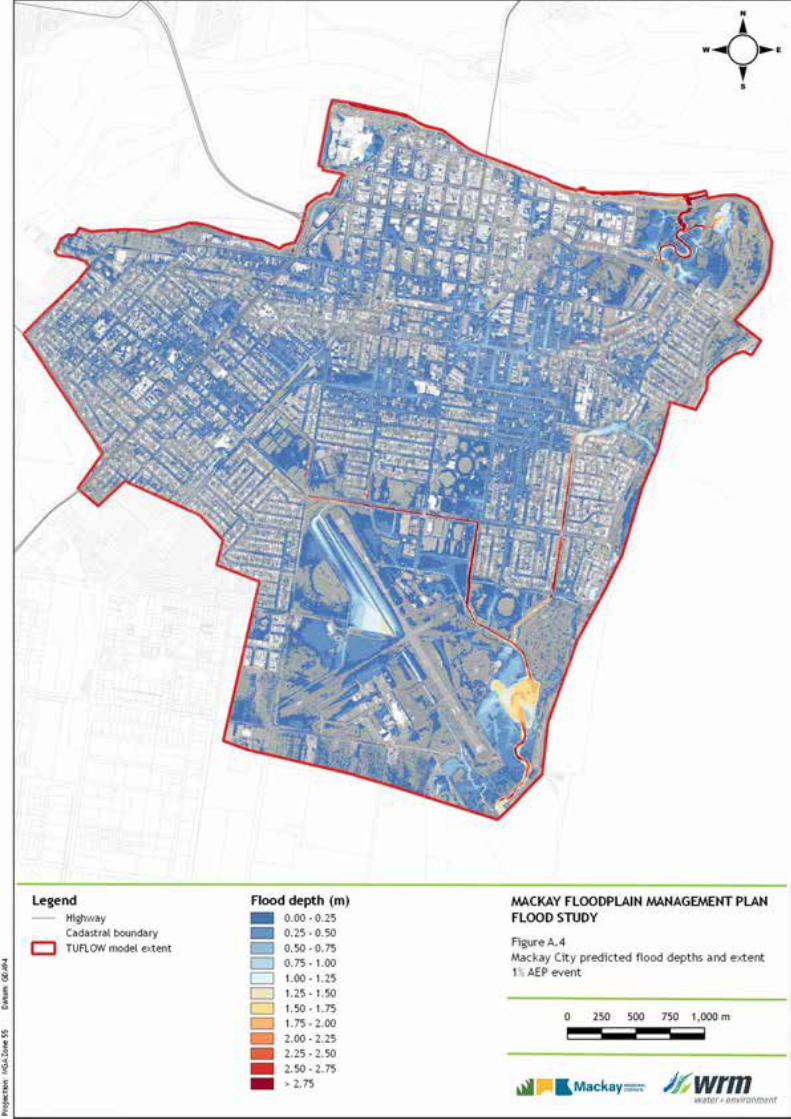
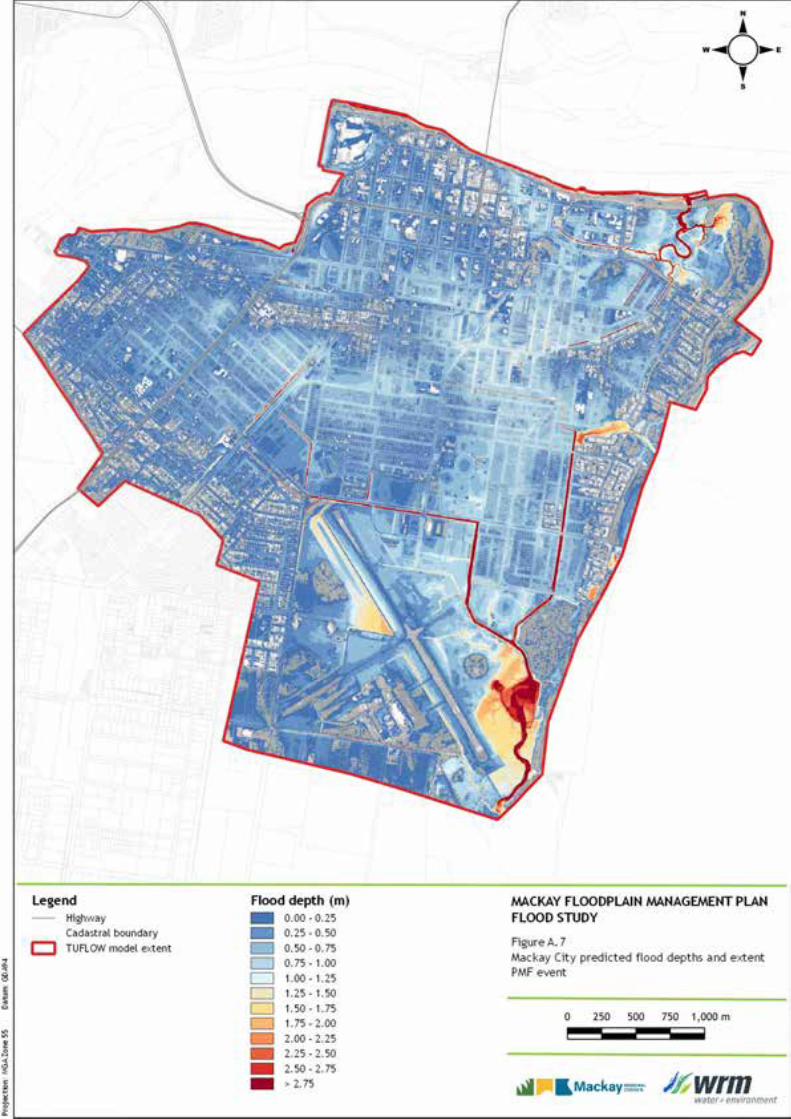
5.2.3 Design flood levels, depths and extents
Figure A.1 to Figure A.7 show the design flood depth and extents for the 10% AEP, 5% AEP, 2% AEP, 1% AEP, 0.5% AEP, 0.2% AEP and PMF events. Rain-on-grid modelling uses a process whereby rainfall is applied to every model cell. Mapping of these results would show that
wrmwater.com.au 0500-47-K1| 22 October 2021 | Page 18
the entire model area was flooded. For this reason, areas where the flow depth is less than 0.05 m were removed from the mapping. The existing conditions model results show:
• For the 10% and 5% AEP design event,
o extensive property inundation occurs during a 10% AEP event, mostly near Kippen Street, Evan Street, Shakespeare Street, Paradise Street and Nebo Road. The flood depths on private properties are mostly less than 0.4 m; and
o majority of floodwaters follow the road reserve or overland flow paths.
• For the 2% and 1% AEP design event,
o extensive property inundation occurs in many areas in Mackay City. Peak flood depths on some private properties increase to between 0.4 m and 0.5 m;
o well defined overland flow paths can be identified in many areas in Mackay City; and
o the peak flood depths exceed 0.5 m on a number of roads and are up to 0.9 m on Keats Street.
• For the 0.5%, 0.2% AEP design event and the PMF, significant widespread flooding occurs within the Mackay City area.
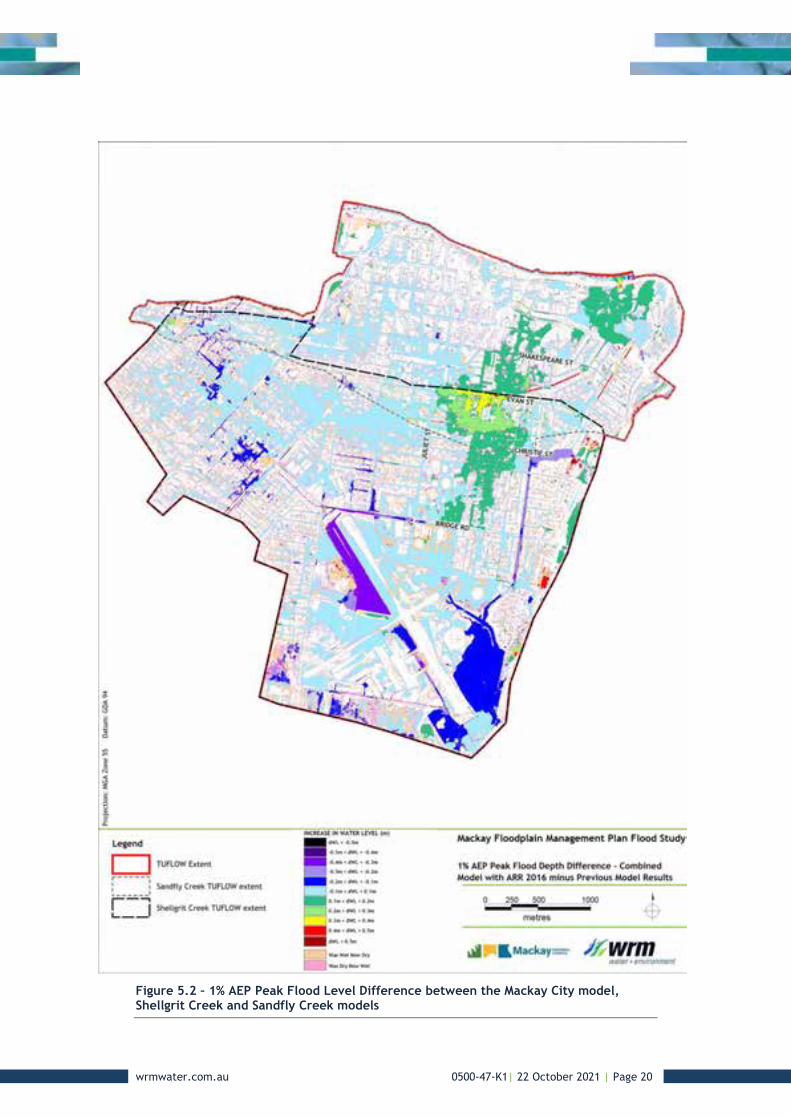
5.2.4 Comparison to previous studies
Figure 5.2 shows the 1% AEP peak flood level differences compared with previous model results from the Mackay CBD model of Sandfly Creek (AECOM, 2015) and the Shellgrit Creek model (Cardno, 2014). The following is of note:
• The adopted 1% AEP peak flood levels within the Shellgrit Creek catchment are mostly consistent with the Cardno (2014) results (within 0.1 m), except for the areas near the boundary of the Sandfly Creek catchment. The revised peak flood levels are up to 0.5 m higher than the levels predicted by Shellgrit Creek model due to overflows from Sandfly Creek. The reduction of peak flood levels near Christie Street and along Shellgrit Creek is due to the inclusion of Cod Hole Outlet.
• The adopted 1% AEP peak flood levels within the Sandfly Creek catchment are mostly consistent with the AECOM (2015) estimates except for the areas between Shakespeare Street and Evan Street due to the inclusion of Shellgrit Creek overflows.
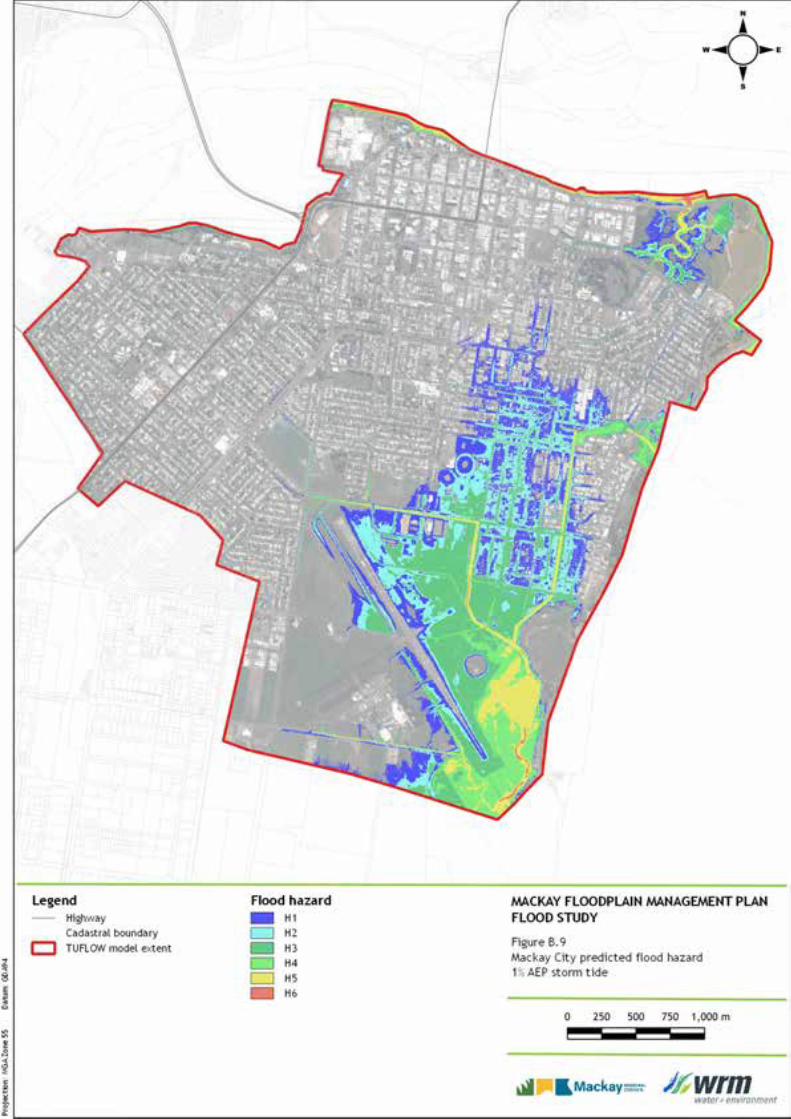
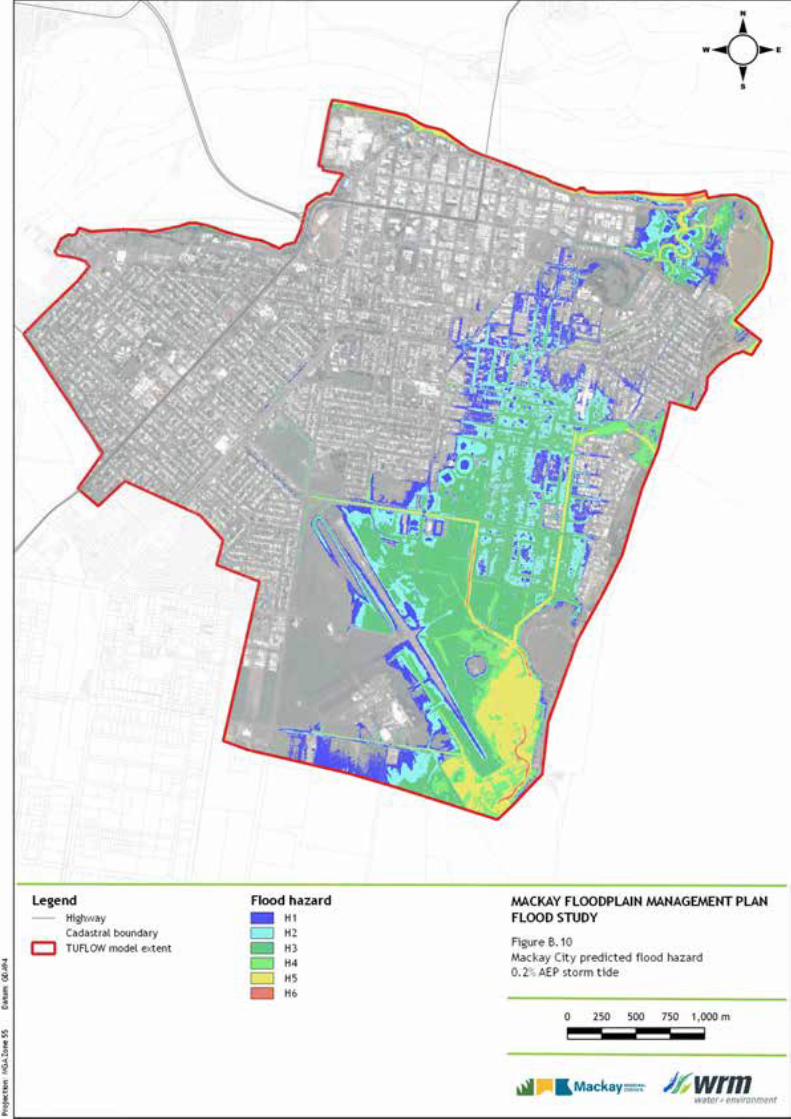
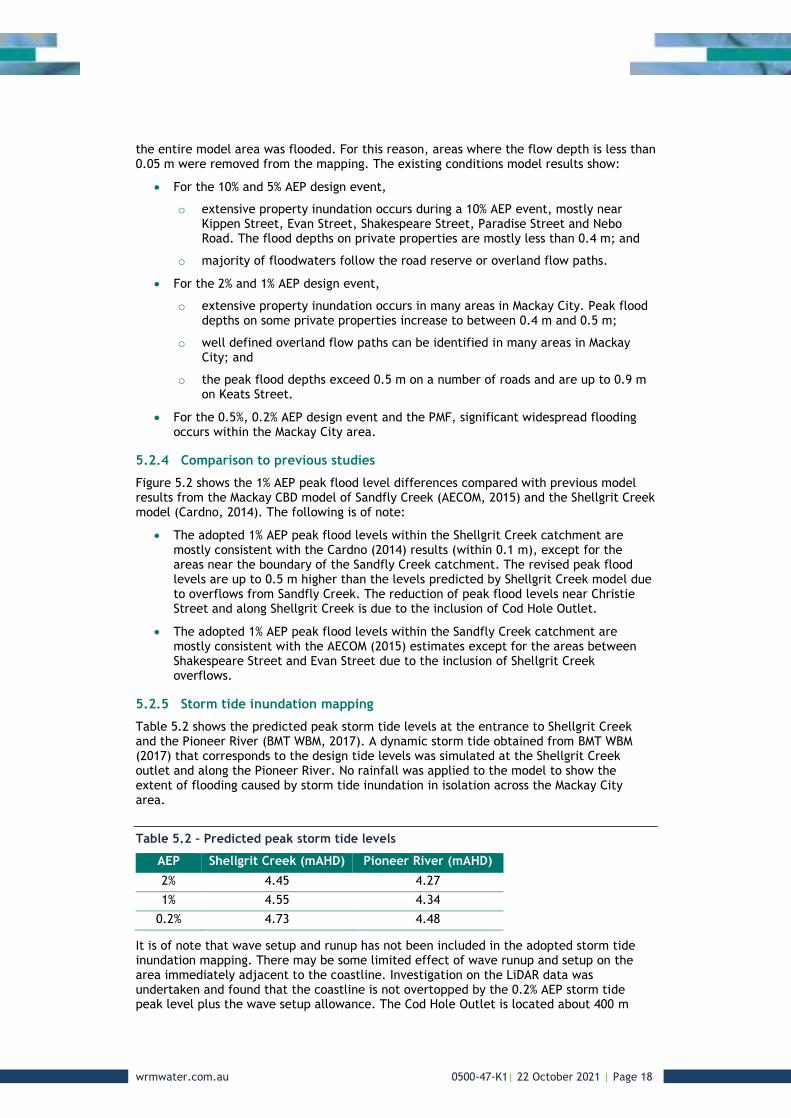
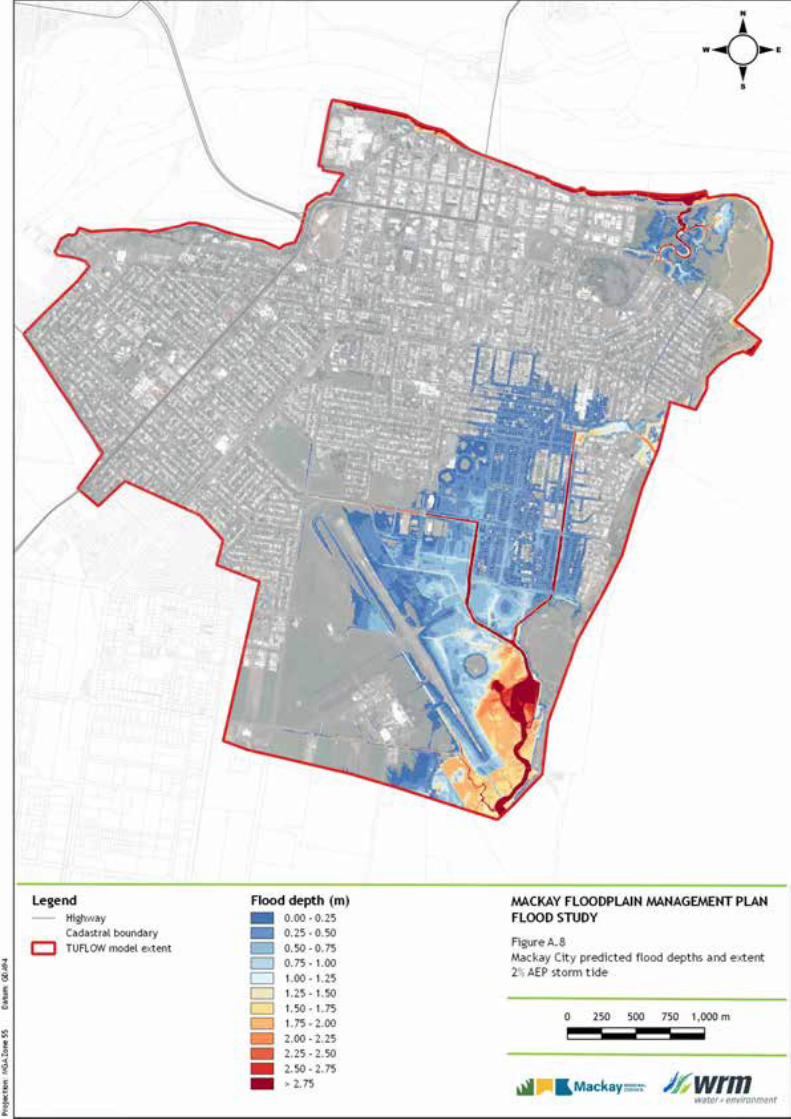
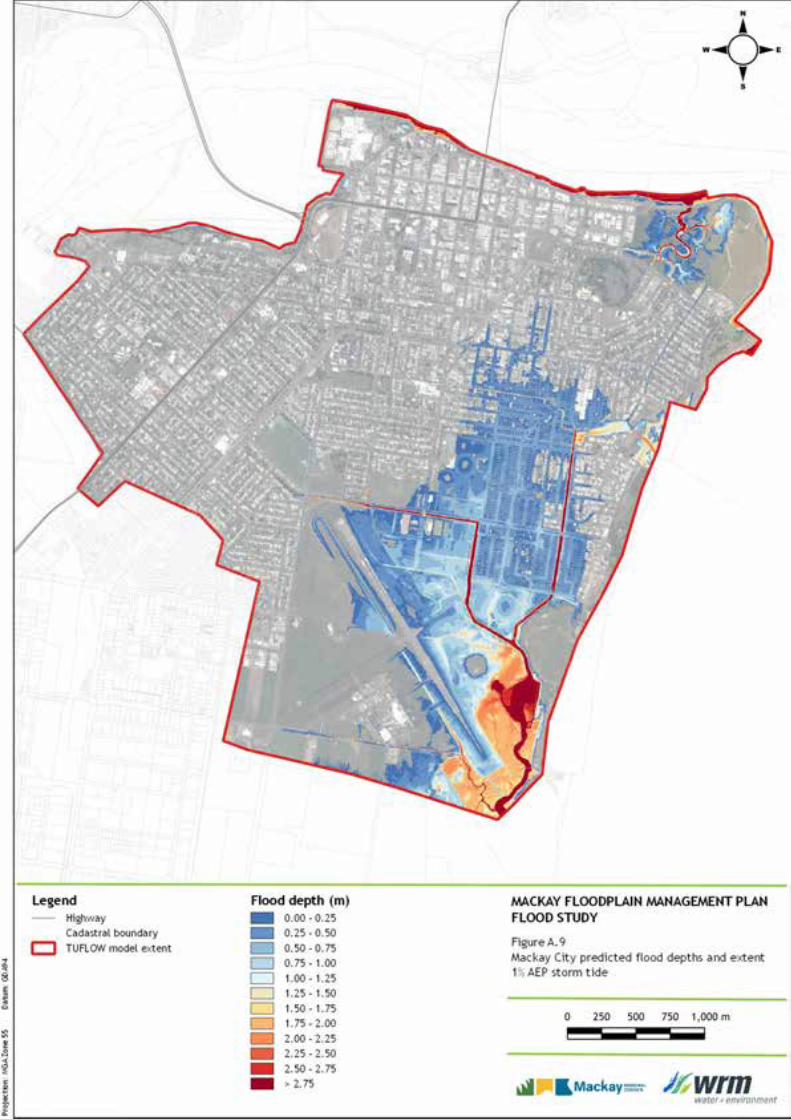
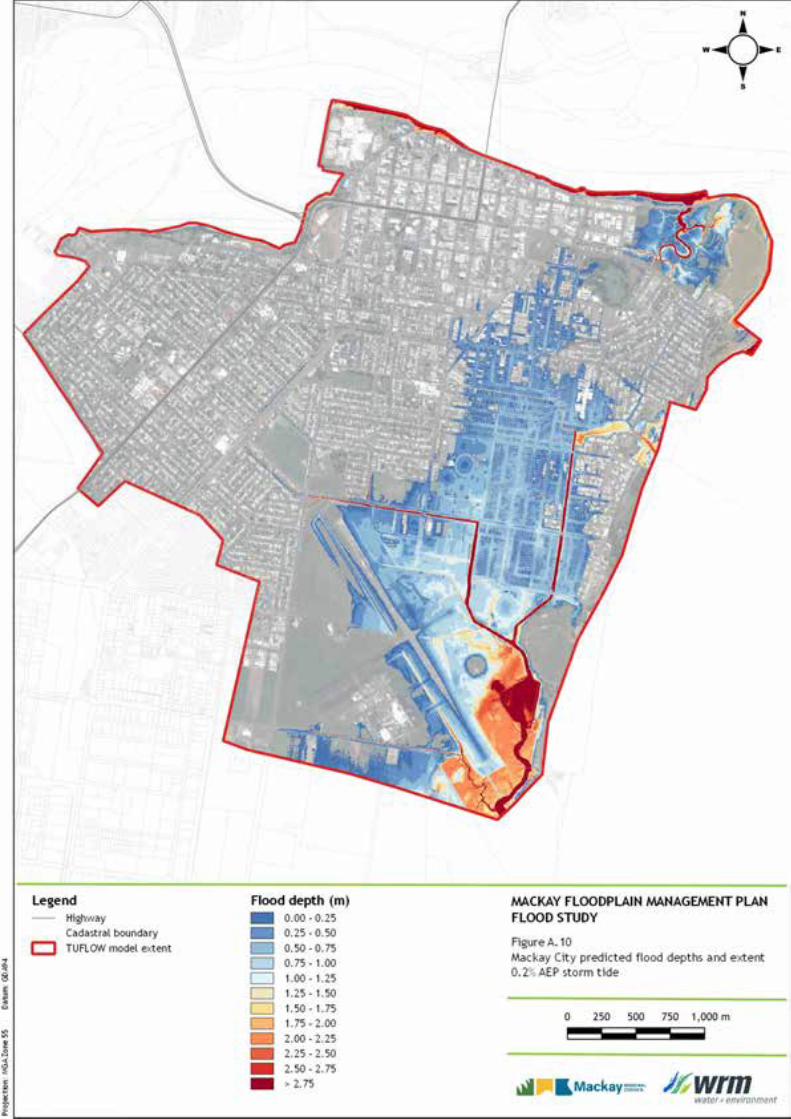
5.2.5 Storm tide inundation mapping
Table 5.2 shows the predicted peak storm tide levels at the entrance to Shellgrit Creek and the Pioneer River (BMT WBM, 2017). A dynamic storm tide obtained from BMT WBM (2017) that corresponds to the design tide levels was simulated at the Shellgrit Creek outlet and along the Pioneer River. No rainfall was applied to the model to show the extent of flooding caused by storm tide inundation in isolation across the Mackay City area.
Table 5.2 – Predicted peak storm tide levels
AEP Shellgrit Creek (mAHD) Pioneer River (mAHD)
2% 4.45 4.27 1% 4.55 4.34
0.2% 4.73 4.48
It is of note that wave setup and runup has not been included in the adopted storm tide inundation mapping. There may be some limited effect of wave runup and setup on the area immediately adjacent to the coastline. Investigation on the LiDAR data was undertaken and found that the coastline is not overtopped by the 0.2% AEP storm tide peak level plus the wave setup allowance. The Cod Hole Outlet is located about 400 m
wrmwater.com.au 0500-47-K1| 22 October 2021 | Page 19
from the coastline and the geometry of the coastline is likely to dissipate the wave setup and runup effect near the Cod Hole Outlet floodgates. Hence, the wave setup has not been included in the storm tide inundation mapping.
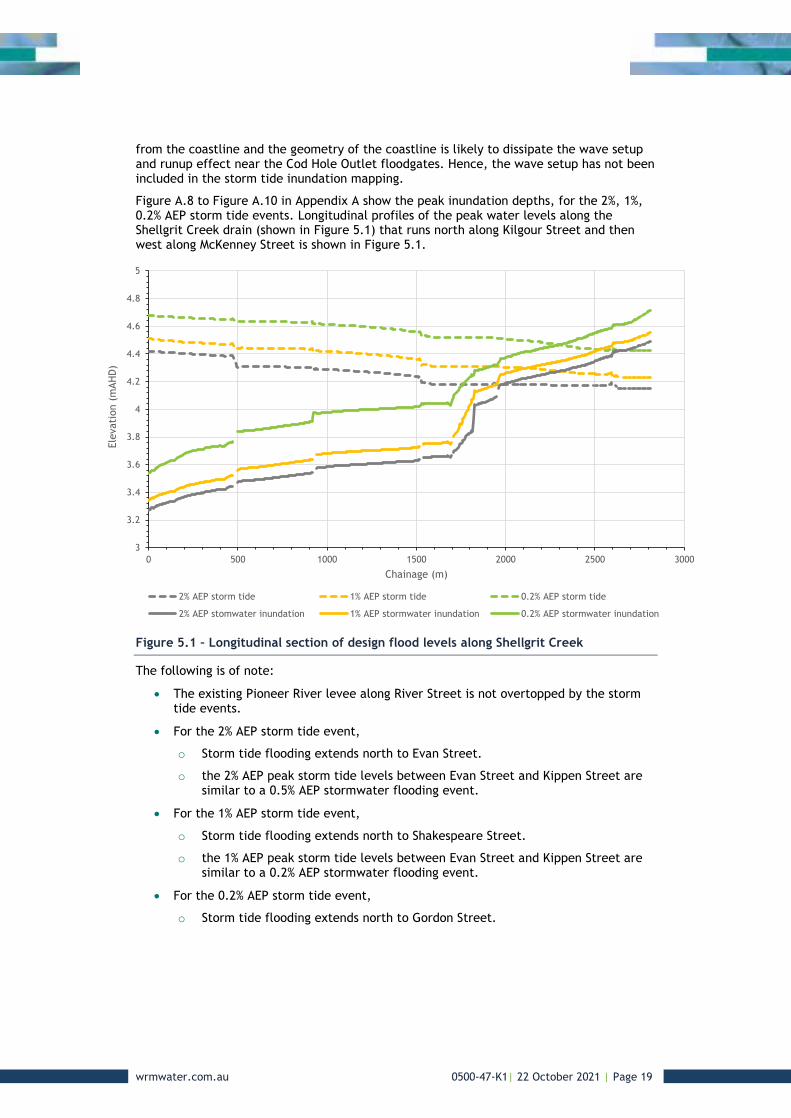
Figure A.8 to Figure A.10 in Appendix A show the peak inundation depths, for the 2%, 1%, 0.2% AEP storm tide events. Longitudinal profiles of the peak water levels along the Shellgrit Creek drain (shown in Figure 5.1) that runs north along Kilgour Street and then west along McKenney Street is shown in Figure 5.1.
Figure 5.1 – Longitudinal section of design flood levels along Shellgrit Creek
The following is of note:
• The existing Pioneer River levee along River Street is not overtopped by the storm tide events.
• For the 2% AEP storm tide event,
o Storm tide flooding extends north to Evan Street.
o the 2% AEP peak storm tide levels between Evan Street and Kippen Street are similar to a 0.5% AEP stormwater flooding event.
• For the 1% AEP storm tide event,
o Storm tide flooding extends north to Shakespeare Street.
o the 1% AEP peak storm tide levels between Evan Street and Kippen Street are similar to a 0.2% AEP stormwater flooding event.
• For the 0.2% AEP storm tide event,
o Storm tide flooding extends north to Gordon Street.
3
3.2
3.4
3.6
3.8
4
4.2
4.4
4.6
4.8
5
0 500 1000 1500 2000 2500 3000
Elev
atio
n (m
AHD)
Chainage (m)
2% AEP storm tide 1% AEP storm tide 0.2% AEP storm tide
2% AEP stomwater inundation 1% AEP stormwater inundation 0.2% AEP stormwater inundation
wrmwater.com.au 0500-47-K1| 22 October 2021 | Page 20
Figure 5.2 – 1% AEP Peak Flood Level Difference between the Mackay City model, Shellgrit Creek and Sandfly Creek models
wrmwater.com.au 0500-47-K1| 22 October 2021 | Page 21
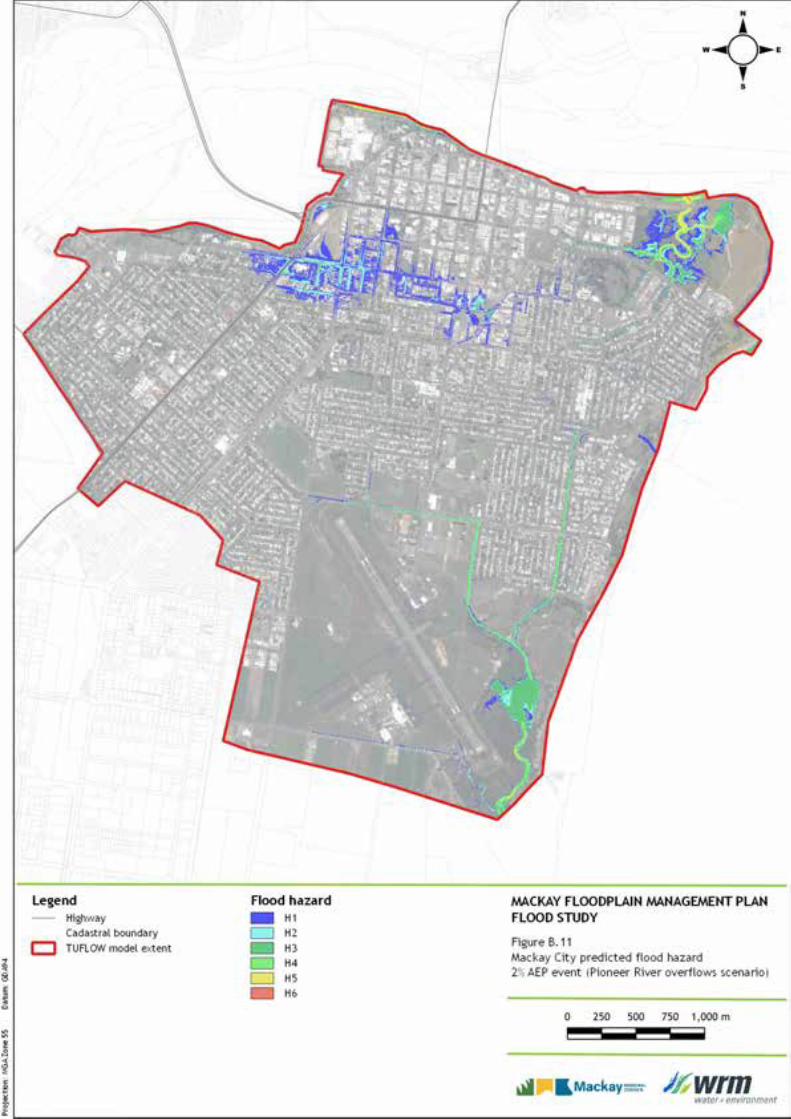
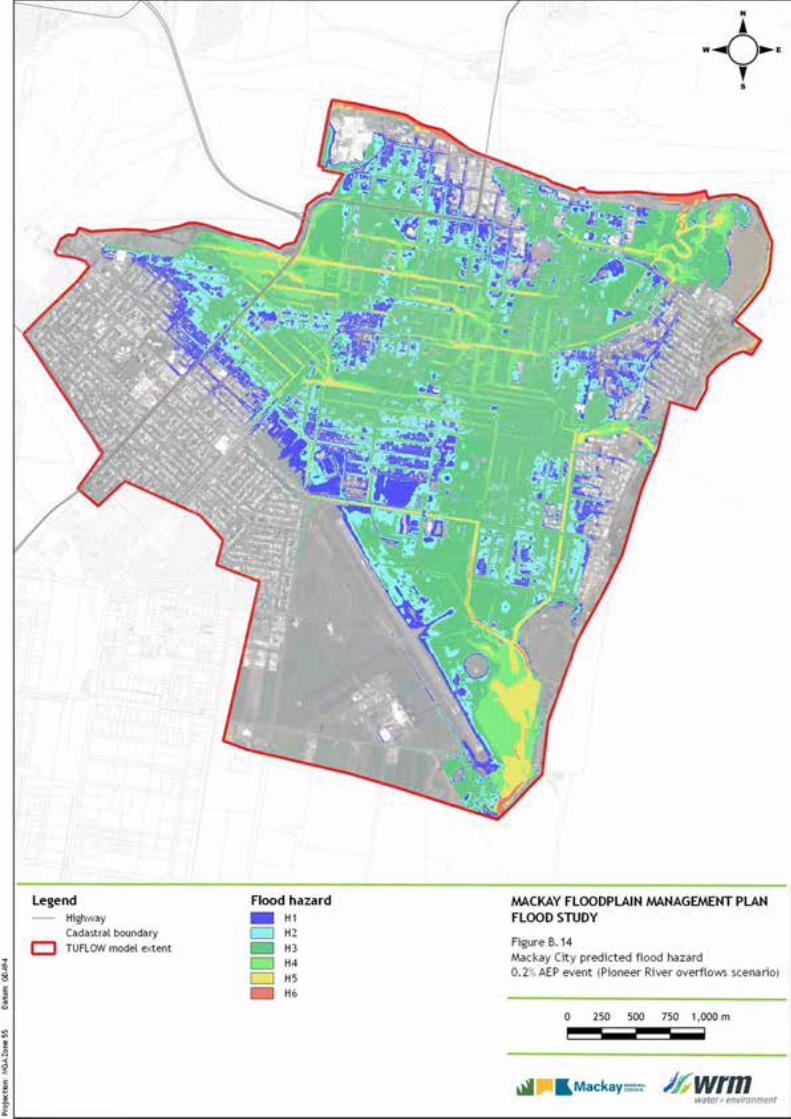
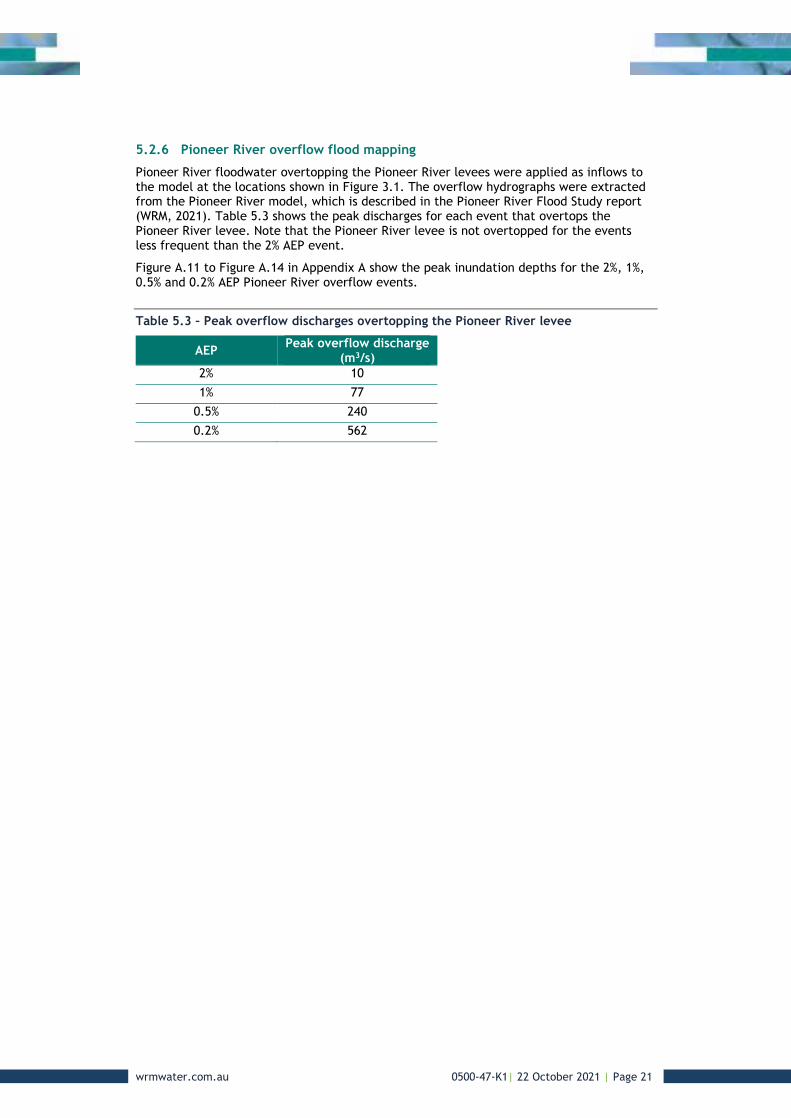
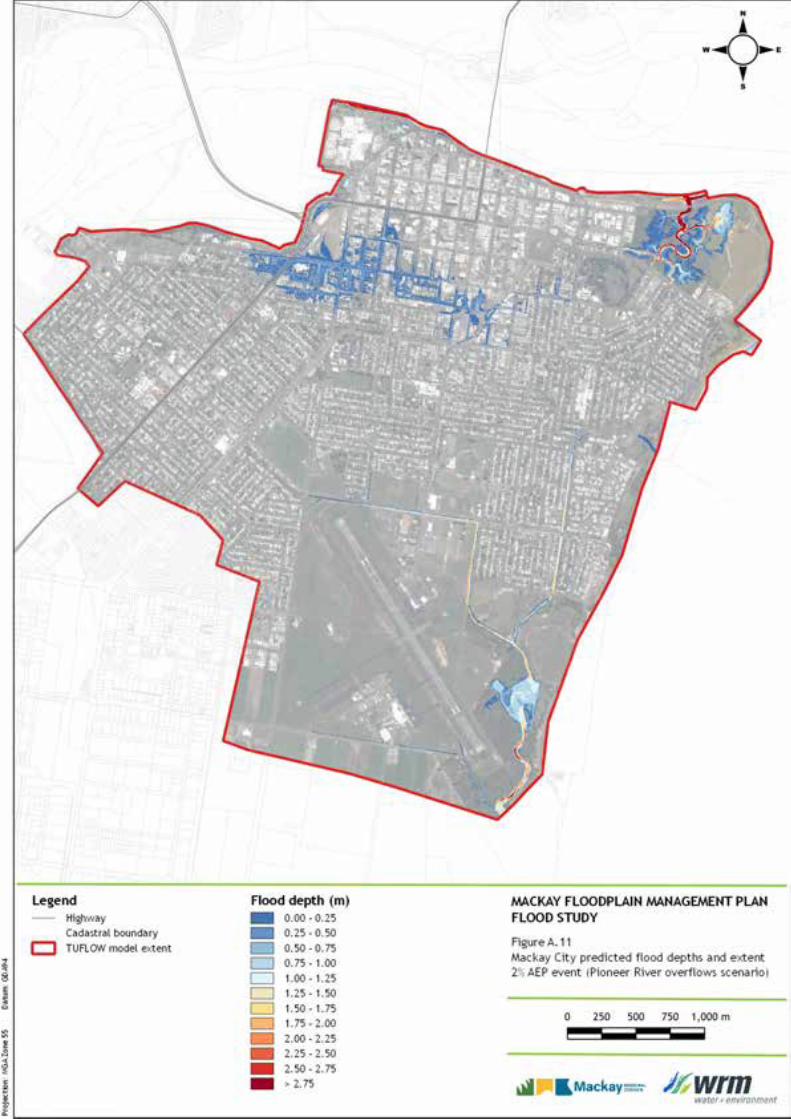
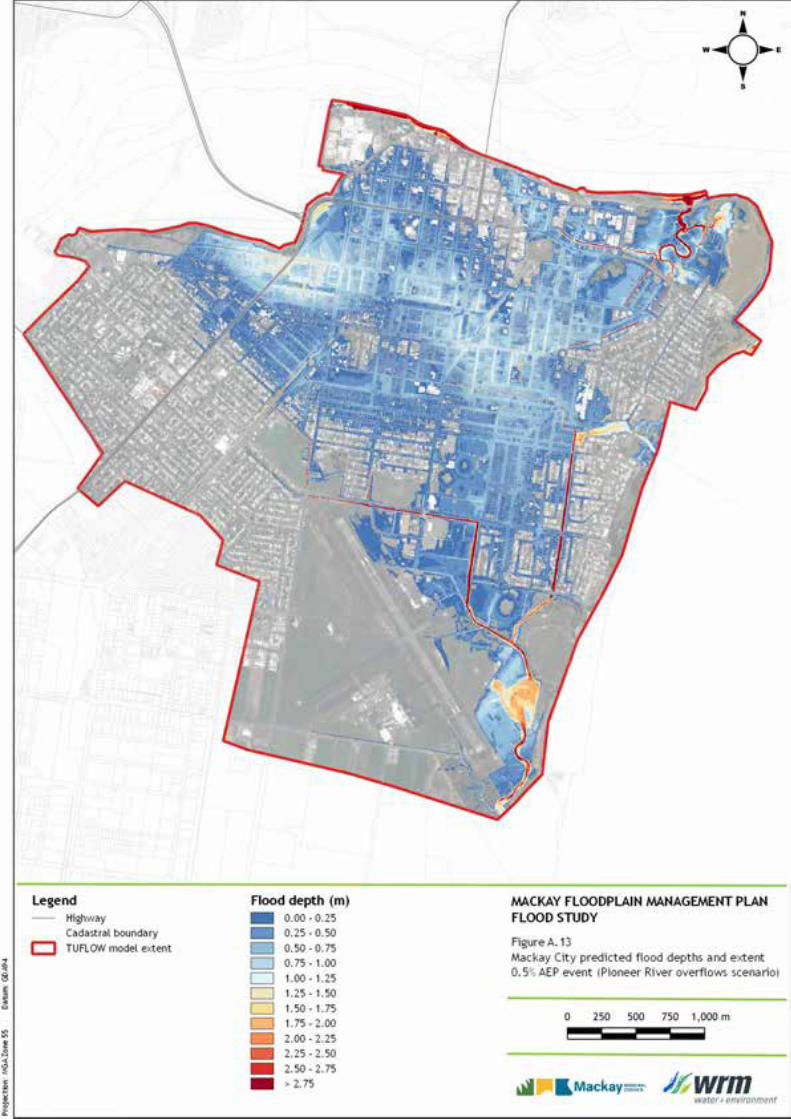
5.2.6 Pioneer River overflow flood mapping
Pioneer River floodwater overtopping the Pioneer River levees were applied as inflows to the model at the locations shown in Figure 3.1. The overflow hydrographs were extracted from the Pioneer River model, which is described in the Pioneer River Flood Study report (WRM, 2021). Table 5.3 shows the peak discharges for each event that overtops the Pioneer River levee. Note that the Pioneer River levee is not overtopped for the events less frequent than the 2% AEP event.
Figure A.11 to Figure A.14 in Appendix A show the peak inundation depths for the 2%, 1%, 0.5% and 0.2% AEP Pioneer River overflow events.
Table 5.3 – Peak overflow discharges overtopping the Pioneer River levee
AEP Peak overflow discharge (m3/s)
2% 10 1% 77
0.5% 240 0.2% 562

wrmwater.com.au 0500-47-K1| 22 October 2021 | Page 22
6 Effects of climate change
6.1 GENERAL The Local Government Association of Queensland (LGAQ) and the Queensland Government (Qld Govt, 2010) have established a framework to provide Queensland local governments with advice on how to account for climate change in assessing flood risk. The study recommends a ‘climate change factor’ be included into flood studies in the form of a 5% increase in rainfall per degree of global warming. For the purposes of applying the climate change factor, the study outlines the following temperature increases and planning horizons:
• 2°Celsius by 2050;
• 3°Celsius by 2070; and
• 4°Celsius by 2100.
These increases in temperature equate to a 10% increase in rainfall depth by 2050, and 15% increase in rainfall depth by 2070 and a 20% increase in rainfall depth by 2100 (Qld Govt, 2010).
Book 1 Chapter 6 of ARR 2019 also provides interim guideline on climate change considerations. The climate change design rainfall depth was increased by a factor of 1.2 (20% increase) in accordance with guidelines in Book 1 Chapter 6 of the 2019 ARR (Ball et al, 2019). The adopted multiplication factor is based on a planning horizon of year 2090 and a projected warming of more than 3.0 degrees Celsius. The 20% increase in rainfall depth using the interim climate change guideline in Book 1 Chapter 6 of ARR 2019 is generally consistent with the Qld Govt (2010) findings.
The ARR 2019 Data Hub also provides interim climate change factors that can be extracted for any point location within Australia. Recent inspection of the ARR 2019 Data Hub indicates that the projected temperature increase for the 2090 planning horizon for Mackay is 3.124 degrees Celsius (based on RCP 8.5). This corresponds to a 15.6% increase in rainfall, which differs to the Qld Govt (2010) guidelines and to the guideline in Book 1 Chapter 6 of ARR 2019.
A sensitivity analysis was undertaken to assess the differences in design peak flood levels along the Pioneer River and Goosepond Creek between adopting a 20% and 15.6% increase in rainfall. Details of the methodology and results of this sensitivity analysis are documented in a memorandum prepared for MRC (WRM, 2020b).
Following discussions with Mackay Regional Council, the climate change that would be expected to occur in 2100, a 20% increase in rainfall, has been adopted to assess the climate change design events.
In addition to increased rainfall, climate change has the potential to increase sea levels. A sea level rise of 0.8 m is expected by 2100. The MHWS levels at the downstream boundary has been increased by 0.8 m to 3.15 mAHD for the design events.
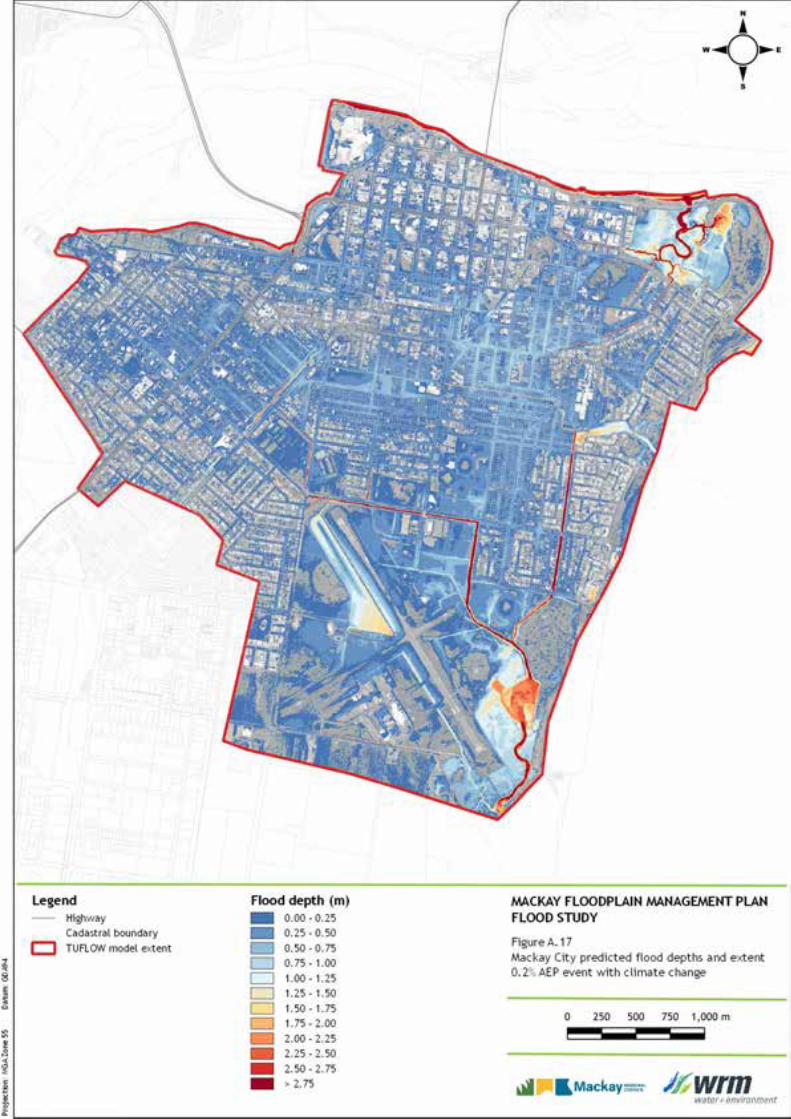
6.2 ADOPTED DESIGN RAINFALL AND BOUNDARY CONDITIONS The 10%, 1% and 0.2% AEP design rainfall depths presented in Section 4.2.1 for Mackay City were increased by 20% to account for the effects of climate change.
A fixed water level of 3.15 mAHD was adopted for the Mackay City model, representing a sea level rise of 0.8 m on the MHWS.
wrmwater.com.au 0500-47-K1| 22 October 2021 | Page 23
6.3 MODEL RESULTS
6.3.1 Mackay City stormwater inundation
Figure A.15 to Figure A.17 in Appendix A show the 10%, 1% and 0.2% AEP climate change design flood levels, depths and extents for the Mackay City stormwater inundation design events. The following is of note:
• Peak flood levels increase by about 0.1 m across most of the model extent.
• Higher increases in peak flood levels occur near the outlet of Sandfly Creek and Shellgrit Creek, due to the higher tailwater level adopted for the climate change conditions.
• The peak flood extent increases marginally to the west of Juliet Street and to the east of Juliet Street between Shakespeare Street and Bridge Road.
• More properties will be inundated for the climate change design events.
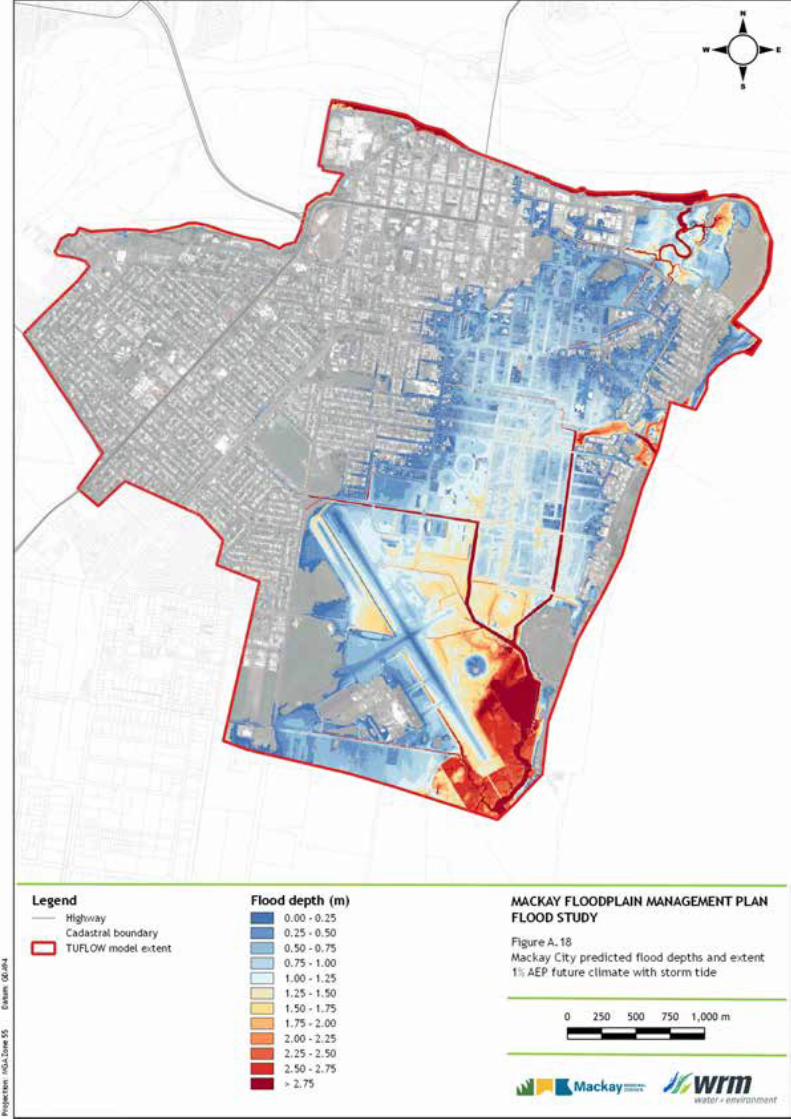
6.3.2 Mackay City storm tide inundation
Figure A.18 in Appendix A shows the 1% AEP future climate design flood levels, depths and extents for the Mackay City storm tide design event. A dynamic storm tide obtained from BMT WBM (2020) that corresponds to the design tide levels was simulated at the Shellgrit Creek outlet and along the Pioneer River to determine design storm tide levels across the Mackay City area. The predicted 1% AEP future climate storm tide levels at Shellgrit Creek and Pioneer River are 5.22 mAHD and 5.14 mAHD respectively, which are 0.7 m and 0.8 m higher than the peak 1% AEP storm tide levels. The following is of note:
• A significant number of properties in Mackay to the east of Juliet Street will be inundated;
• The 1% AEP future climate peak flood extent is significantly larger than the 1% AEP storm tide event, to the east of Juliet Street;
• Extensive flooding occurs east of Juliet Street and north of Evan Street when compared to the 1% AEP storm tide event; and
• The 1% AEP future climate storm tide event is larger than a PMF event from stormwater inundation between Milton Street and Evan Street.
6.3.3 Mackay City Pioneer River overflows
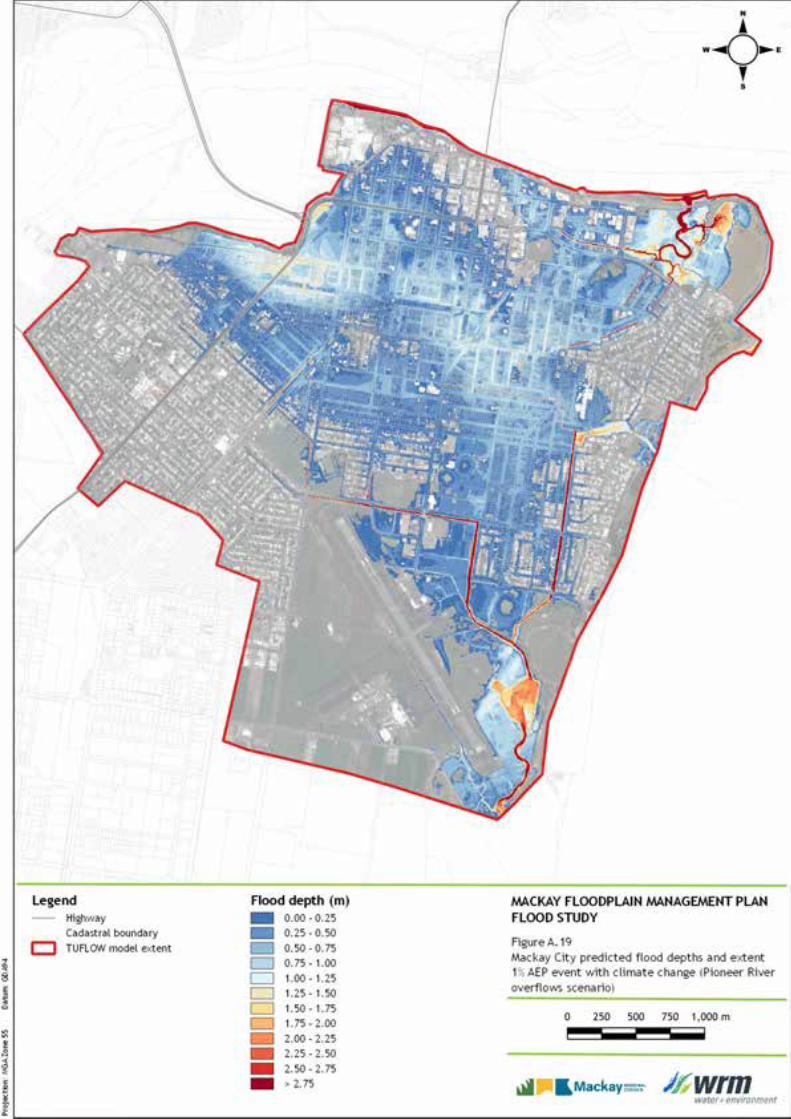
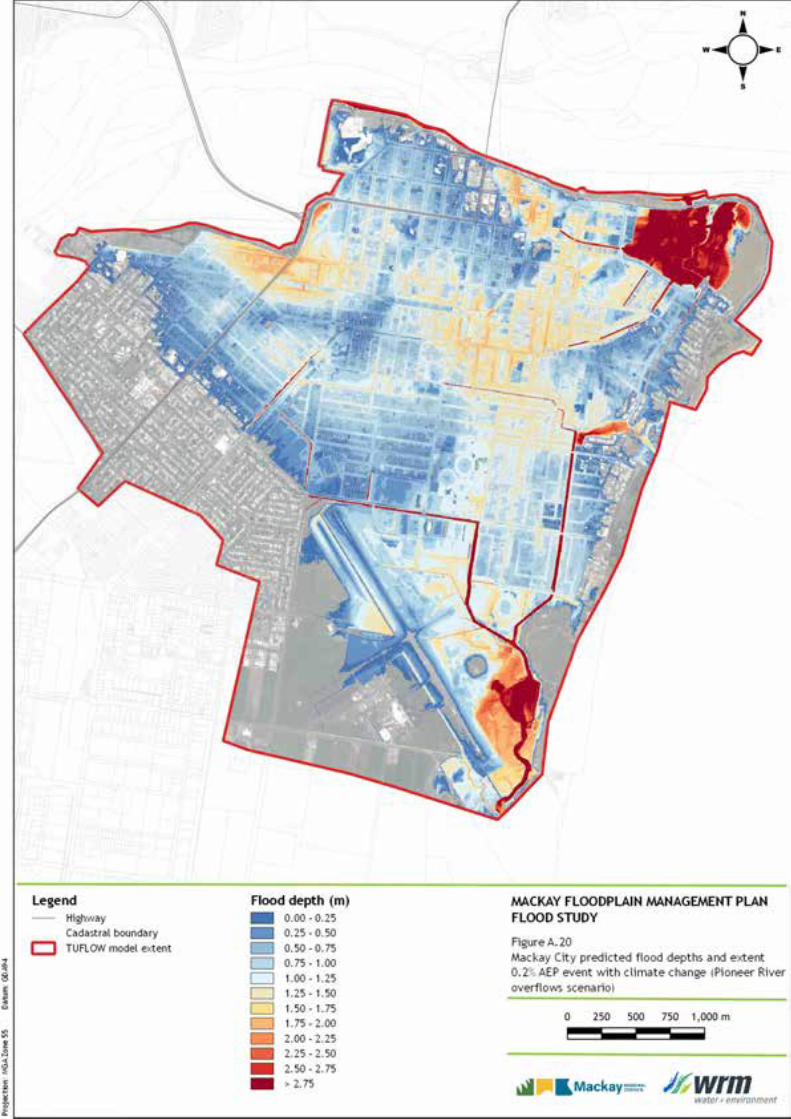
Figure A.19 and Figure A.20 in Appendix A shows the 1% and 0.2% AEP future climate design flood levels, depths and extents for the Pioneer River overflows event. The predicted 1% and 0.2% AEP future climate Pioneer River overflows peak discharges are 268 m3/s and 918 m3/s respectively, which are 191 m3/s and 356 m3/s higher than the peak overflow discharges for the 1% and 0.2% AEP events.

wrmwater.com.au 0500-47-K1| 22 October 2021 | Page 24
7 Provisional hydraulic hazard classification
7.1 FLOOD HAZARD CLASSIFICATION As part of the floodplain management study, the initial categorisation of flood prone land has been defined using the depth and velocity of the floodwaters calculated using the flood model. Each area is then assigned a provisional classification using the categories given in Australian Disaster Resilience Guideline 7-3 Flood Hazard (AIDR, 2017) and shown in Figure 7.1.
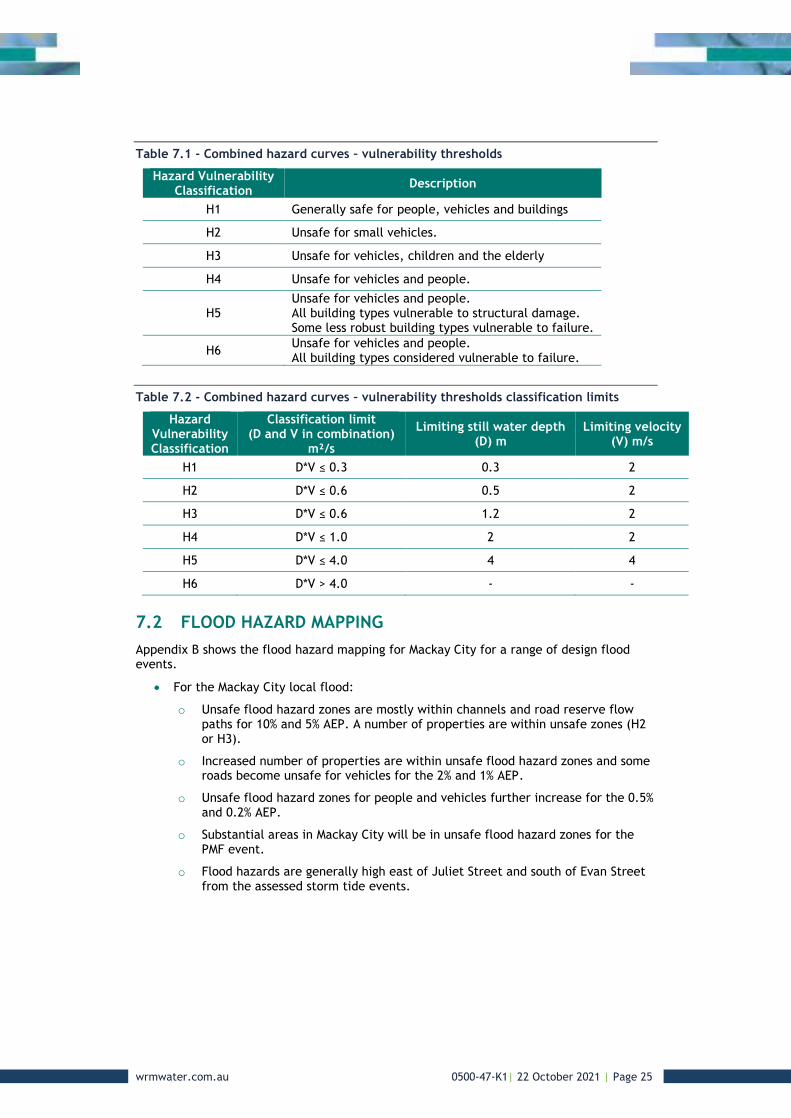
The flood hazard curves shown in Figure 7.1 set hazard thresholds that relate to the vulnerability of the community when interacting with floodwaters. Table 7.1 shows the 6 flood hazard classifications and Table 7.2 provides the depth and velocity limits for each of the classifications.
Figure 7.1 – General flood hazard vulnerability curves (Source: AIDR, 2017)
wrmwater.com.au 0500-47-K1| 22 October 2021 | Page 25
Table 7.1 - Combined hazard curves – vulnerability thresholds
Hazard Vulnerability Classification Description
H1 Generally safe for people, vehicles and buildings
H2 Unsafe for small vehicles.
H3 Unsafe for vehicles, children and the elderly
H4 Unsafe for vehicles and people.
H5 Unsafe for vehicles and people. All building types vulnerable to structural damage. Some less robust building types vulnerable to failure.
H6 Unsafe for vehicles and people. All building types considered vulnerable to failure.
Table 7.2 - Combined hazard curves – vulnerability thresholds classification limits
Hazard Vulnerability Classification
Classification limit (D and V in combination)
m²/s
Limiting still water depth (D) m
Limiting velocity (V) m/s
H1 D*V ≤ 0.3 0.3 2
H2 D*V ≤ 0.6 0.5 2
H3 D*V ≤ 0.6 1.2 2
H4 D*V ≤ 1.0 2 2
H5 D*V ≤ 4.0 4 4
H6 D*V > 4.0 - -
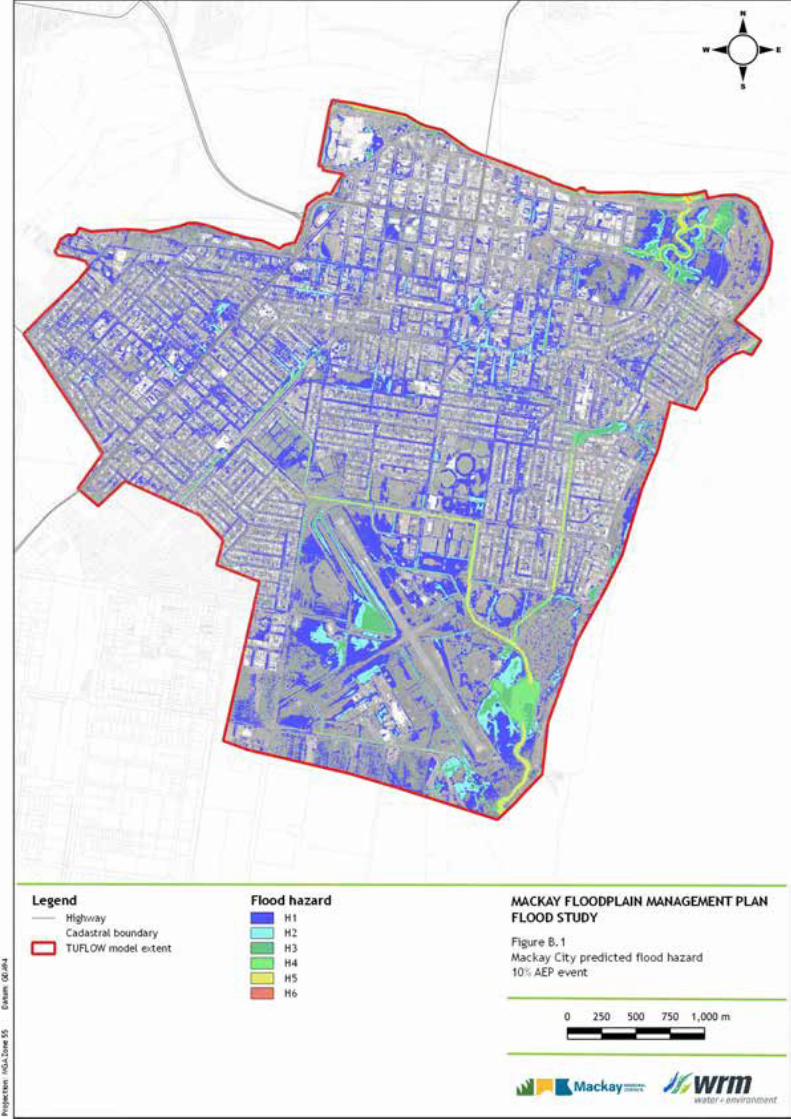
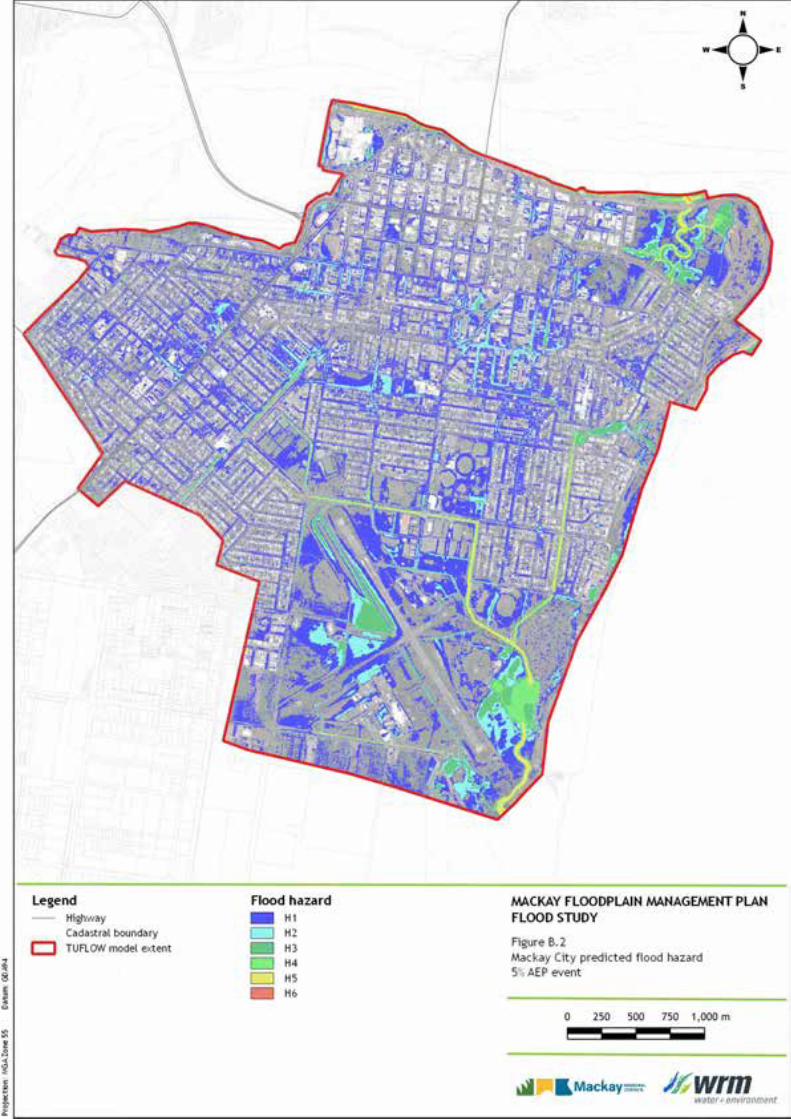
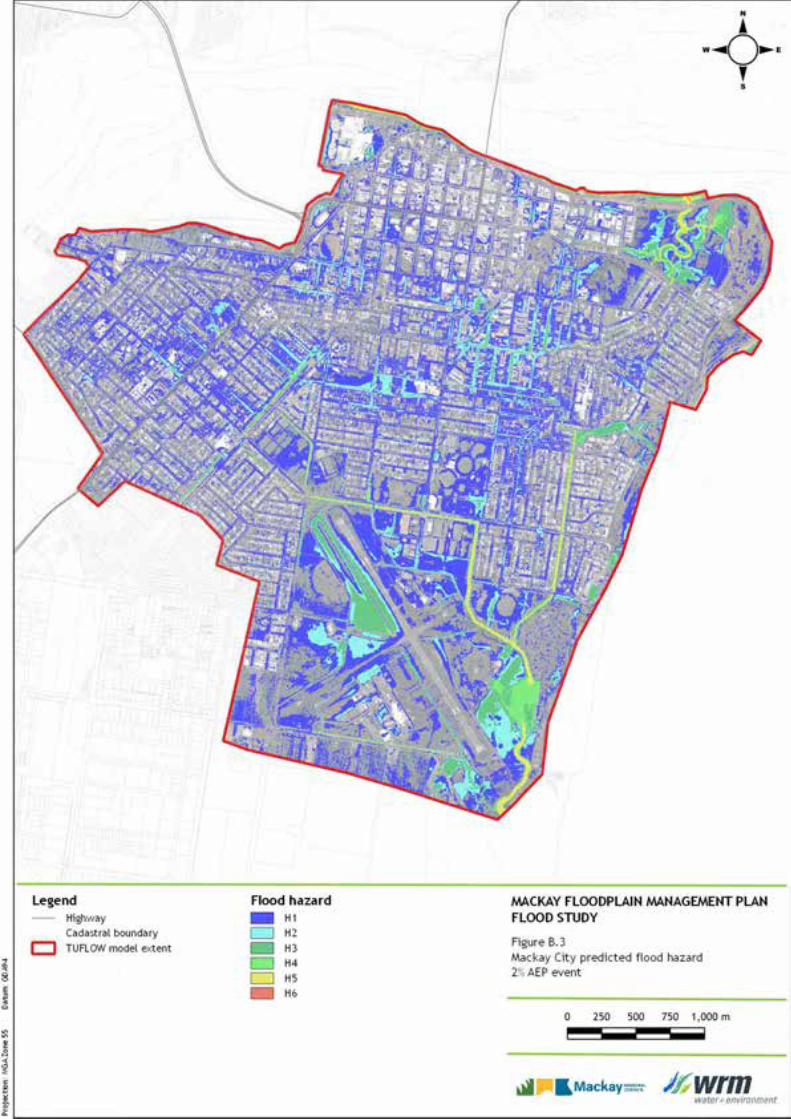
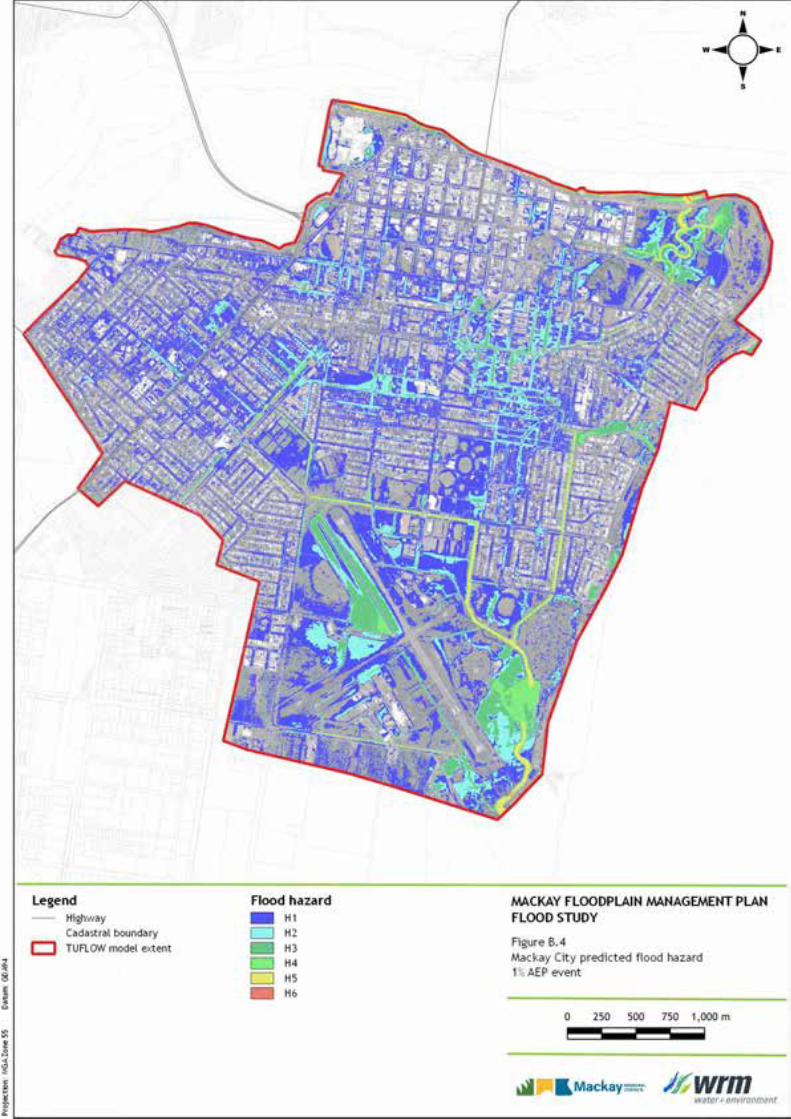
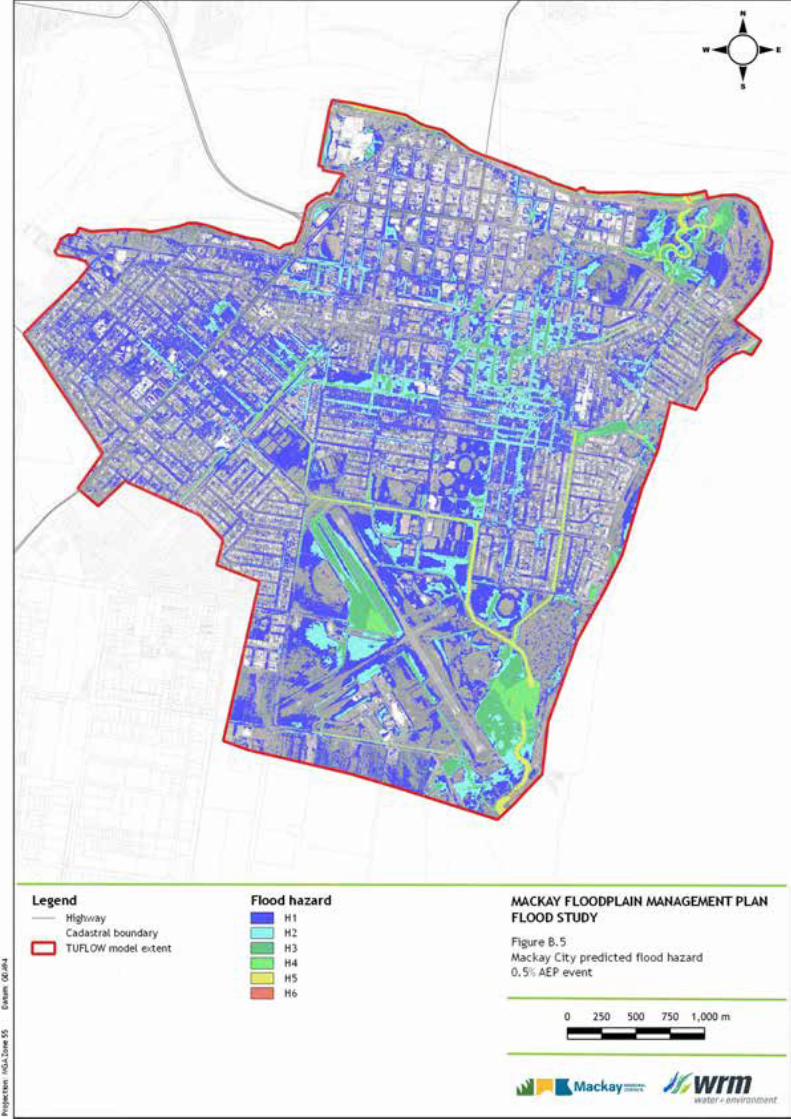
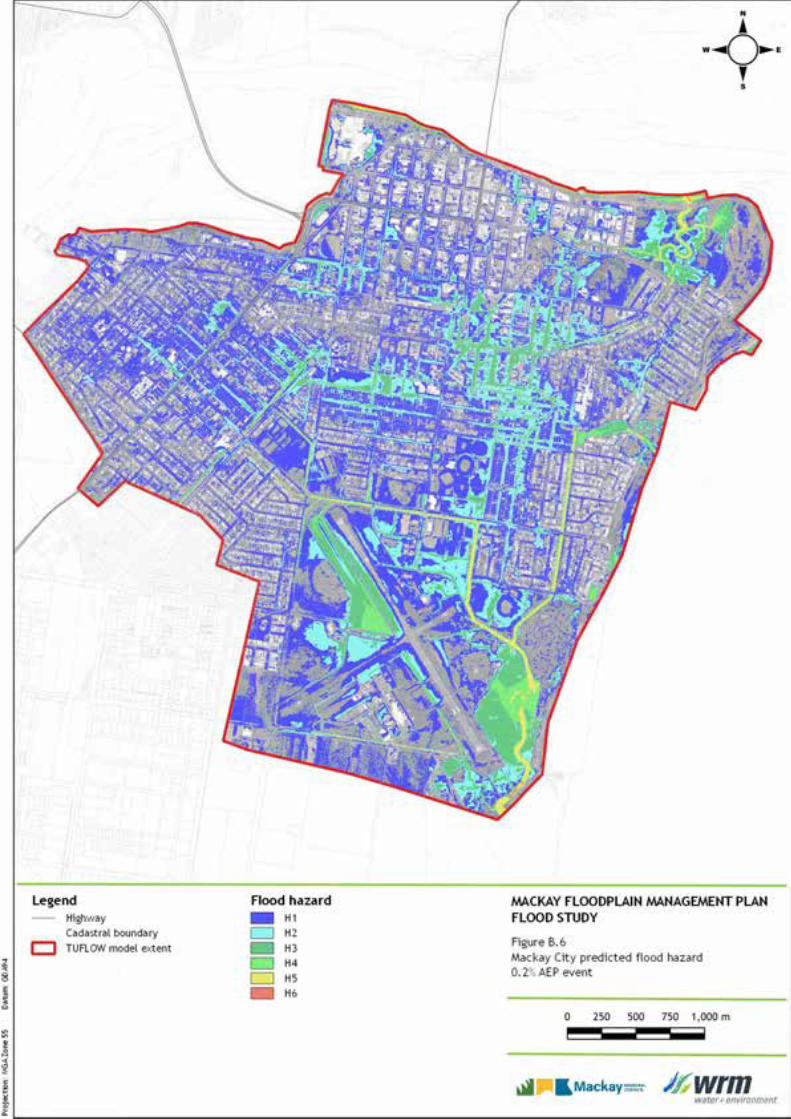
7.2 FLOOD HAZARD MAPPING Appendix B shows the flood hazard mapping for Mackay City for a range of design flood events.
• For the Mackay City local flood:
o Unsafe flood hazard zones are mostly within channels and road reserve flow paths for 10% and 5% AEP. A number of properties are within unsafe zones (H2 or H3).
o Increased number of properties are within unsafe flood hazard zones and some roads become unsafe for vehicles for the 2% and 1% AEP.
o Unsafe flood hazard zones for people and vehicles further increase for the 0.5% and 0.2% AEP.
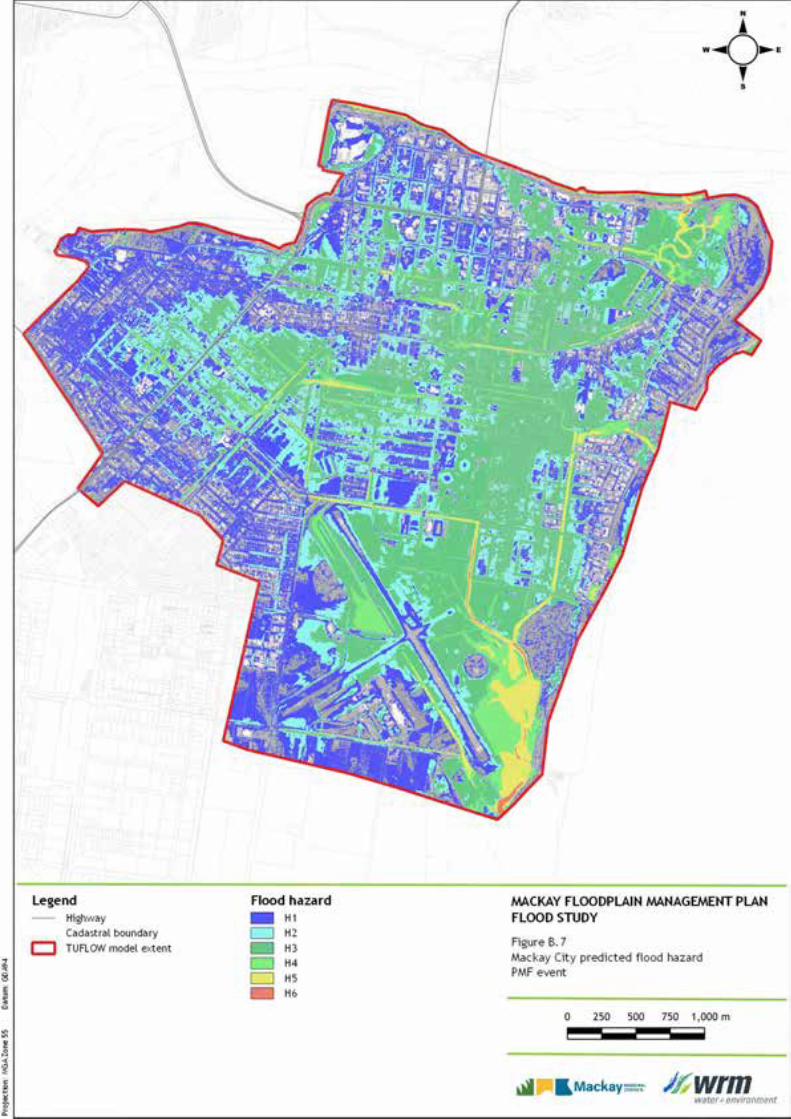
o Substantial areas in Mackay City will be in unsafe flood hazard zones for the PMF event.
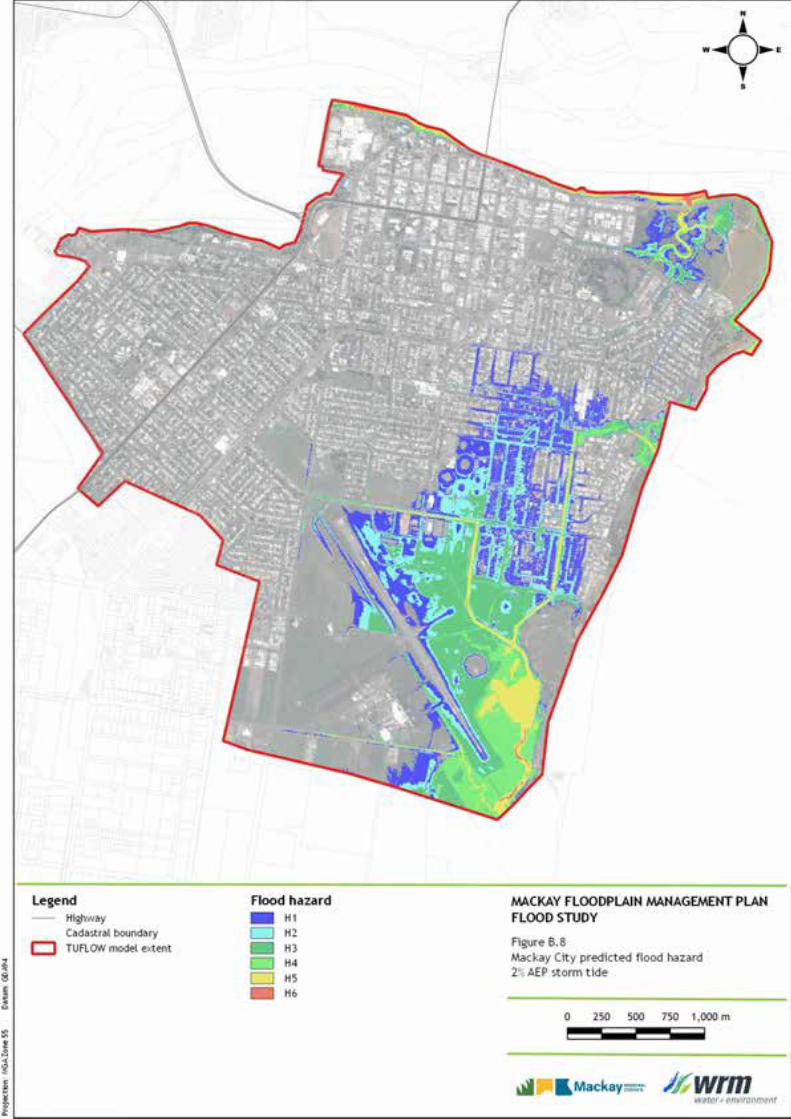
o Flood hazards are generally high east of Juliet Street and south of Evan Street from the assessed storm tide events.
wrmwater.com.au 0500-47-K1| 22 October 2021 | Page 26
8 References
AAM, 2016 ‘Metadata for Mackay Project Aerial LiDAR Scanning Project’, Commissioned by Department of Natural Resources and Mines by AAM, 25 January 2016.
AECOM, 2015 ‘Mackay CBD Drainage Study’, Report prepared for Mackay Regional Council by AECOM Australia Pty Ltd, August 2015.
AECOM, 2016 ‘Mackay Flood Levee System – Condition Assessment Report’, Report prepared for Mackay Regional Council by AECOM Australia Pty Ltd, April 2016.
AIDR, 2014 ‘Australian Disaster Resilience Guideline 7-3 Flood Hazard’, The Australian Institute for Disaster Resilience, © Commonwealth of Australia 2017 second edition.
Ball et al., 2019 ‘Australian Rainfall and Runoff – A Guide to Flood Estimation’, Ball J, Babister M, Nathan R, Weeks W, Weinmann E, Retallick M, Testoni I, (Editors), © Commonwealth of Australia (Geoscience Australia), 2019.
BMT WBM, 2013 ‘Mackay Region Storm Tide Study’, Report prepared for Mackay Regional Council by BMT WBM Pty Ltd, June 2013.
BMT WBM, 2016 ‘TUFLOW User Manual Build 2016-03-AA’, BMT WBM Pty Ltd, 2016.
BMT WBM, 2017 ‘Mackay CBD Storm Tide Timeseries Boundary Condition’, Report prepared for Mackay Regional Council by BMT WBM Pty Ltd, June 2017.
BOM, 2003 ‘The Estimation of Probable Maximum Precipitation in Australia: Generalised Short-Duration Method’, Bureau of Meteorology, 2003.
Cardno, 2014 ‘Shellgrit Creek Catchment – Drainage Study and Concept Drainage Strategy’, Report prepared for Mackay Regional Council by Cardno (QLD) Pty Ltd, May 2014.
GHD, 2012 ‘Goosepond/Vines Creek Flood Study’, Report prepared for Mackay Regional Council by GHD Pty Ltd, February 2012.
Qld Govt, 2010 ‘Increasing Queensland’s resilience to inland flooding in a changing climate’, Queensland Department of Environment and Resource Management, Queensland Department of Infrastructure and Planning and Local Government Association of Queensland (2010).
Pilgrim, 1987 ‘Australian Rainfall and Runoff – A Guide to Flood Estimation’, Pilgrim DH (Editor), Institution of Engineers, Australia, Barton, ACT, 1987.
MSQ, 2017 ‘Queensland Tide Tables Standard Port Tide Times’, Produced by Maritime Safety Queensland, Department of Transport and Main Roads, 2017.
WRM, 2011 ‘Pioneer River Flood Study’, Report prepared for Mackay Regional Council by WRM Water & Environment Pty Ltd, October 2011.
WRM, 2019b ‘Mackay Floodplain Management Plan: Addendum A – Mackay City Model Stormwater Network’, Report prepared for Mackay Regional Council by WRM Water & Environment Pty Ltd, February 2019.

wrmwater.com.au 0500-47-K1| 22 October 2021 | Page 27
WRM, 2020a Floodplain Management Plan - resolution of the third-party review Goosepond Creek catchment, memorandum prepared for Mackay Regional Council by WRM Water & Environment Pty Ltd, May 2020.
WRM, 2020b Floodplain Management Plan - resolution of the third-party review climate change sensitivity testing, memorandum prepared for Mackay Regional Council by WRM Water & Environment Pty Ltd, June 2020.
WRM, 2021 Pioneer River Flood Study, report prepared for Mackay Regional Council by WRM Water & Environment, October 2021
wrmwater.com.au 0500-47-K1| 22 October 2021 | Page 28
Mackay City Flood Study
– Mackay City Flood Mapping
Figure A 1 – Mackay City peak flood depths and extent, 10% AEP design event __________29
Figure A 2 – Mackay City peak flood depths and extent, 5% AEP design event ___________30
Figure A 3 – Mackay City peak flood depths and extent, 2% AEP design event ___________31
Figure A 4 – Mackay City peak flood depths and extent, 1% AEP design event ___________32
Figure A 5 – Mackay City peak flood depths and extent, 0.5% AEP design event _________33
Figure A 6 – Mackay City peak flood depths and extent, 0.2% AEP design event _________34
Figure A 7 – Mackay City peak flood depths and extent, PMF _________________________35
Figure A 8 – Mackay City peak flood depths and extent, 2% AEP storm tide _____________36
Figure A 9 – Mackay City peak flood depths and extent, 1% AEP storm tide _____________37
Figure A 10 – Mackay City peak flood depths and extent, 0.2% AEP storm tide __________38
Figure A 11 – Mackay City peak flood depths and extent, 2% AEP event (Pioneer River overflows scenario) __________________________________________________39
Figure A 12 – Mackay City peak flood depths and extent, 1% AEP event (Pioneer River overflows scenario) __________________________________________________40
Figure A 13 – Mackay City peak flood depths and extent, 0.5% AEP event (Pioneer River overflows scenario) _____________________________________________41
Figure A 14 – Mackay City peak flood depths and extent, 0.2% AEP event (Pioneer River overflows scenario) _____________________________________________42
Figure A 15 – Mackay City peak flood depths and extent, 10% AEP with climate change design event _________________________________________________43
Figure A 16 – Mackay City peak flood depths and extent, 1% AEP with climate change design event________________________________________________________44
Figure A 17 – Mackay City peak flood depths and extent, 0.2% AEP with climate change design event _________________________________________________45
Figure A 18 – Mackay City peak flood depths and extent, 1% AEP future climate storm tide__________________________________________________________46
Figure A 19 – Mackay City peak flood depths and extent, 1% AEP event with climate change (Pioneer River overflows scenario) ______________________________47
Figure A 20 – Mackay City peak flood depths and extent, 0.2% AEP event with climate change (Pioneer River overflows scenario) _______________________48


wrmwater.com.au 0500-47-K1| 22 October 2021 | Page 49
Mackay City Flood Study
- Provisional flood hazard categories for Mackay City
Figure B 1 – Flood hazard classification of Mackay City flooding, 10% AEP ______________50
Figure B 2 – Flood hazard classification of Mackay City flooding, 5% AEP _______________51
Figure B 3 – Flood hazard classification of Mackay City flooding, 2% AEP _______________52
Figure B 4 – Flood hazard classification of Mackay City flooding, 1% AEP _______________53
Figure B 5 – Flood hazard classification of Mackay City flooding, 0.5% AEP _____________54
Figure B 6 – Flood hazard classification of Mackay City flooding, 0.2% AEP _____________55
Figure B 7 – Flood hazard classification of Mackay City flooding, PMF__________________56
Figure B 8 – Flood hazard classification of Mackay City flooding, 2% AEP storm tide______57
Figure B 9 – Flood hazard classification of Mackay City flooding, 1% AEP storm tide______58
Figure B 10 – Flood hazard classification of Mackay City flooding, 0.2% AEP storm tide _______________________________________________________________59
Figure B 11 – Flood hazard classification of Mackay City flooding, 2% AEP event (Pioneer River overflows scenario) _____________________________________60
Figure B 12 – Flood hazard classification of Mackay City flooding, 1% AEP event (Pioneer River overflows scenario) _____________________________________61
Figure B 13 – Flood hazard classification of Mackay City flooding, 0.5% AEP event (Pioneer River overflows scenario) _____________________________________62
Figure B 14 – Flood hazard classification of Mackay City flooding, 0.2% AEP event (Pioneer River overflows scenario) _____________________________________63
Figure B 15 – Flood hazard classification of Mackay City flooding, 1% AEP with future climate storm tide___________________________________________________64
Figure B 16 – Flood hazard classification of Mackay City flooding, 10% AEP with climate change______________________________________________________65
Figure B 17 – Flood hazard classification of Mackay City flooding, 1% AEP with climate change______________________________________________________66
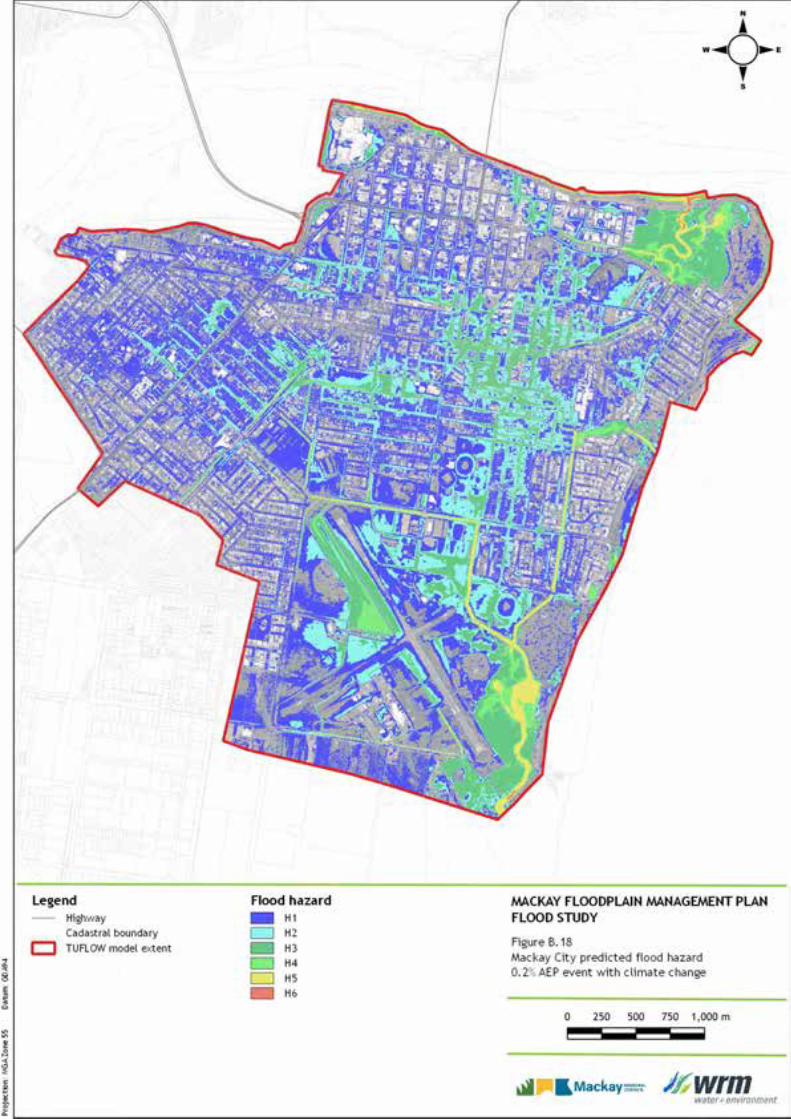
Figure B 18 – Flood hazard classification of Mackay City flooding, 0.2% AEP with climate change______________________________________________________67
Figure B 19 – Flood hazard classification of Mackay City flooding, 1% AEP event with climate change (Pioneer River overflows scenario) _______________________68
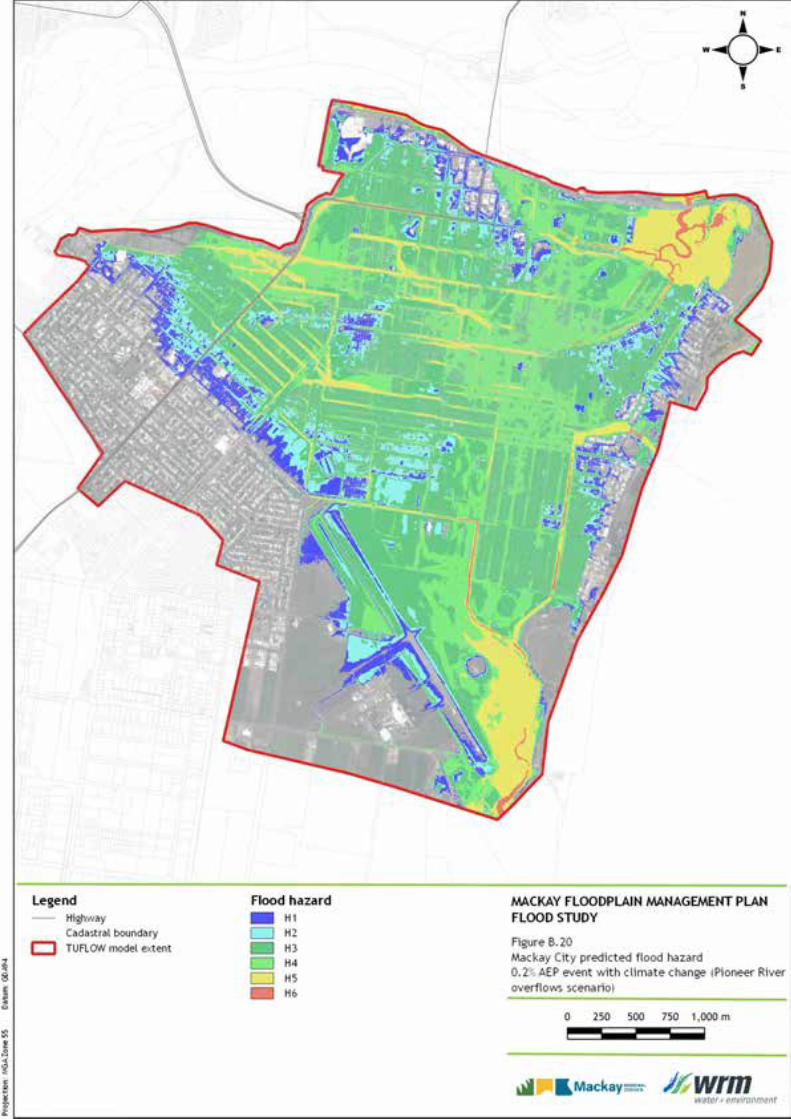
Figure B 20 – Flood hazard classification of Mackay City flooding, 0.2% AEP event with climate change (Pioneer River overflows scenario) ___________________69