macgarvie tenure form - national bureau of economic · pdf fileiain m. cockburn and megan j....
TRANSCRIPT

NBER WORKING PAPER SERIES
ENTRY AND PATENTING IN THE SOFTWARE INDUSTRY
Iain M. CockburnMegan J. MacGarvie
Working Paper 12563http://www.nber.org/papers/w12563
NATIONAL BUREAU OF ECONOMIC RESEARCH1050 Massachusetts Avenue
Cambridge, MA 02138October 2006
We thank LECG Inc. for support for this research and providing access to data via an unrestricted grant fromMicrosoft Corporation. We are grateful to Anne Layne-Farrar, Alfonso Gambardella, Daniel Garcia-Swartz,Shane Greenstein, Josh Lerner, Robert Merges, Marc Rysman, Mark Schankerman, Ken Simons, ManuelTrajtenberg, and Sam Thompson for helpful comments. The views expressed herein are those of theauthor(s) and do not necessarily reflect the views of the National Bureau of Economic Research..
©2006 by Iain M. Cockburn and Megan J. MacGarvie. All rights reserved. Short sections of text, not to exceedtwo paragraphs, may be quoted without explicit permission provided that full credit, including © notice, isgiven to the source.
Entry and Patenting in the Software IndustryIain M. Cockburn and Megan J. MacGarvieNBER Working Paper No. 12563October 2006, Revised February 2011JEL No. L1, L6, O34
ABSTRACT
To what extent are firms kept out of a market by patents covering related technologies? Do patentsheld by potential entrants make it easier to enter markets? We estimate the empirical relationshipbetween market entry and patents for 27 narrowly defined categories of software products during the period 1990-2004. Controlling for demand, market characteristics, average patent quality, andother factors, we find that a 10% increase in the number of patents relevant to market reduces the rate of entryby 3-8%, and this relationship intensified following explanations in the patentability of software in the mid-1990s. However, potential entrants with patent applications relevant to a market are more likely to enter it. Finally patents appear to substitute for comlimentary assets in the entry process, as patents have both greater entry-deterring and entry-promoting effects for firmswithout prior experience in other markets.
Iain M. CockburnNBER1050 Massachusetts AveCambridge, MA [email protected] Megan J. MacGarvieBoston UniversitySchool of Management595 Commonwealth Avenue, Room 522HBoston, MA 02215and [email protected]

2
Patents can be a significant barrier to entry into markets for many products. The patent holder
has the exclusive right to make, use or sell the claimed invention, and the costs for entrants to invent
around, license, or fight legal disputes relating to a patent can be substantial. However, evidence on the
role of patents in shaping incumbent/entrant competition is mixed. Some case studies such as GE in
electric lamps (Bright 1949), Pilkington’s float glass process (Yao 1997) or Xerox in the late 1970s
(Bresnahan 1985) have identified patents as a powerful mechanism for protecting innovators from
competition. However, the experience of other industries such as the “diaper wars” of the 1970s and 80s,
or coronary stents in the 1990s, shows that even where a pioneer firm has patent protection for its product,
competitors can rapidly enter the market with very similar products and win significant share. More
broadly, survey research reporting the experience of practicing managers has shown that the power of
patents to block imitation by competitors is generally perceived as imperfect, and is surprisingly weak in
many industries (Mansfield et al. (1981), Levin et al. (1987), Cohen et al. (2000)).
Many firms nonetheless acquire large portfolios of patents, and even where the primary
motivation for doing this goes beyond the potential to exclude competitors, the impact of an accumulated
patent “thicket” on entry costs may be substantial. In this paper we examine the effect of patent holdings
in a set of narrowly defined software markets on rates of entry into those markets, and find a significant
negative effect. Even after controlling for factors affecting entry such as demand, market structure, and
technological opportunity, any association between patents and entry is, of course, difficult to interpret
causally. In particular, incumbents’ decisions to acquire patents may be endogenous to the threat of entry.
In this context, however, we are able to take advantage of a series of important changes in the legal
regime governing software patents that clarified patentability of different types of software inventions,
and resolved uncertainty about the enforceability of issued patents. These shocks to the strength of
patents in different markets let us use an approach inspired by the “differences-in-differences”
methodology to identify the increase in the deterrent effect of patents that took place with the expansion
of software patentability.
Our estimation results suggest an economically substantial effect: holding constant the quality of
issued patents and other market characteristics, a 1% increase in the number of patents is associated with
a 0.8% decline in the number of entrants into a market, and in firm-level models this effect is between
-0.3% and -0.8%. The negative impact of patent thickets appears to be particularly strong for de novo
entrants and firms without experience in other software markets. But, importantly, these negative effects
on entry are mitigated when entrants come to market with their own patents: firms that have filed
applications for patents relevant to a market are approximately twice as likely to enter as otherwise
similar firms.
While much of the literature has focused on patents as an indicator of innovation success,
technological opportunity, or innovative capabilities, finding a positive correlation between firms’ patent

3
holdings and entry, these findings re-emphasize the role of patents as barriers to entry. They also suggest
a powerful motivation for potential entrants to invest scarce resources to obtain their own patents, and
point to an increasingly important strategic role for patents in this industry. As all industry participants
have responded to increased incentives to obtain patents, the “thicket” in these markets has grown
dramatically, imposing greater and greater transactions costs on all firms. This suggests an enhanced role
for strategic use of collaborative arrangements such as patent pooling and cross-licensing that can reduce
the negative effects of thickets, opportunities to realize profits through creating organizations that can
internalize such costs, and performance penalties for firms that fail to develop capabilities for responding
to these challenges.
Literature Review The empirical literature on entry has focused on the roles of four main factors in influencing
entry: demand, competition, technological capabilities, and entry costs.1 Our focus here is on the latter:
whether differences across software markets in the extent of patenting are associated with differences in
rates of entry. The classic view of the role of patents in incumbent/entrant competition can be found in
Porter (1980), who postulates the importance of patents as a barrier to entry and source of competitive
advantage for incumbents but does not quantify this effect. Large scale statistical studies of PIMS or
COMPUSTAT data have found patents to be associated with higher market shares (Robinson 1988) or
market/book ratios (Cockburn and Griliches (1988), Hall (1993)), but it has proven difficult to distinguish
the pure property right/exclusion aspect of patents from their role as indicators of innovative success.
Research in the strategy literature seeking to understand the entry process has largely focused on
patents as indicators of entrants’ technological capabilities, knowledge assets, or innovation success,
rather than as barriers to entry. Helfat and Lieberman (2002), for example, emphasize the importance of
matching firm’s pre-entry resources and capabilities to the requirements of the target market, with
diversifying entrants seeking economies of scope by matching their pre-entry resources and capabilities
with the “required resource profile of the industry”. Silverman (1999) explains corporate diversification
as a function of firms’ technological resources, which are measured using patents mapped to four-digit
SIC codes. In a similar vein, de Figueiredo and Kyle (2001) find that laser printer firms with more
patents are more likely to enter new markets, Nerkar and Roberts (2004) use patents to provide
information on a firm’s technological resources in modeling the success of new product introductions in
pharmaceuticals, and Henderson and Cockburn (1994) and Cockburn, Henderson, and Stern (2004) use
patents to measure accumulated knowledge capital and technological capabilities in pharmaceutical firms.
1 Cross-industry comparisons of entry rates have yielded several interesting findings (see Geroski (1995) for a discussion). Dunne et al. (1998) contains estimates of entry rates averaging between 41.4% and 51.8% over five-year census periods for a panel of US industries between 1963 and 1982. Within-industry variation in entry rates appears to dominate between-industry variation (Geroski (1995), p.423.)

4
Patents play a more significant “property rights” role in the models of Teece (1986), and Gans
and Stern (2003), who emphasize the critical role of access to co-specialized assets which are
complementary to IP when entering new markets. Related work such as Gans, Hsu, Stern (2002) and
Arora, Fosfuri, and Gambardella (2001) generally characterize patents as facilitating transactions in
technology as an alternative to entry by innovators.2
The traditional view of patents as a stimulus to innovation has been complicated in recent years
by concerns over the extent to which the increasing strategic use of patents, and the general strengthening
and expansion of patent rights may be stifling innovation.3 The public policy debate on patents has been
loudest in industries such as semiconductors, electronics, and software that are characterized by complex
and cumulative innovation, and where the nature of technology and the fragmentation of patent rights
pose unusually difficult challenges. In such circumstances, research suggests that patents are primarily
used for strategic purposes, such as for use in cross-licensing negotiations or to deter litigation, rather than
directly for preventing imitation (Cohen et al., 2000). Hall and Ziedonis (2001) highlight the dramatic
increase in the strategic use of patents in the semiconductor industry as a response to a pro-patent shift in
the U.S. policy in the 1980s. Ziedonis (2004) shows that semiconductor firms patent more aggressively
when upstream property rights faced by the firm are held by a larger number of other firms.
In software, some observers have argued that increased use of patents may lead to greater
innovation and competition in software (see, for example, Smith and Mann (2004)). This may happen
through familiar mechanisms such as the incentive effect of increased appropriability of returns from
R&D. Increased disclosure of useful information in patent documents may also result in greater industry-
wide R&D productivity compared to a trade secret regime. More subtle mechanisms include the role of
patents as a signal of the quality of start-up firms to outside investors or in facilitating contracting with
venture capital or other sources of finance (Mann (2005), Hsu and Ziedonis (2008)). Patents may permit
more efficient transactions in knowledge in a market with explicit property rights. Mann (2005), for
example, argues that patents benefit firms that are able to use them in cross-licensing negotiations.4
Lerner and Zhu (2007) find that the increased use of patents by software firms following the Lotus v.
Borland decision was associated with improvements in firm performance (as measured, for example, by
the growth of sales). Wagner and Cockburn (2010) show that internet companies filing patents were
more likely to survive the collapse of the dot-com bubble after 2001, and Merges (2006) finds evidence
2 Giarratana (2004) provides a detailed case study of entry and competition in encryption software, including the role of patents in facilitating trade in technology. 3 Federal Trade Commission (2003), Bessen and Meurer (2008), Jaffe and Lerner (2004), and Merrill et al. (2004). 4 Licensing or purchase of new firms' technology, or outright acquisition of entrants, is one option for incumbents threatened by entry, and is likely to be an important channel by which some innovations reach the market. Unfortunately we have found no way to measure this activity consistently and accurately in this population of firms, and our analysis here is confined to observations on entry.

5
that firms have adjusted to the presence of patents, and that effort put into acquiring patents correlates
with indicators of market success.
Conversely, Bessen and Hunt (2007) show that software patents are negatively correlated with
R&D intensity at the firm level. Hall and MacGarvie (2010) find that legal decisions expanding software
patentability were viewed negatively by the stock market and that the marginal software patent makes
little contribution to market value. In a study closely related to the current paper, Cockburn and
MacGarvie (2009) find that software start-ups operating in markets with more patents saw their initial
round of funding delayed relative to firms in less thicketed markets. Note that few of these studies
suggest an absolute decline in innovation. Instead, they suggest that the costs associated with patenting
may be reducing innovation below potential.
Data and Descriptive Statistics
Our analysis combines data on market conditions, firm characteristics, and entry with data on the
“patent landscape” relevant to a market. We measure entry using data on firms’ activity in various
categories of software reported in an extract of the CorpTech directory of technology companies. This
database provides information on 19,306 companies developing or selling software products in the United
States between 1990 and 2004,5 and contains detailed information on the product categories in which each
firm is active, as well as information on the founding date of the firm, revenues and employment for many
(but not all) of the firms in the dataset, information on corporate parents, funding sources, and a number
of other variables. We have matched these firms to other datasets such as SDC to verify and supplement
the CorpTech data, as well as to the NBER patent database for information on their patent applications
and grants.
For the purposes of this study, markets are defined in terms of the “SOF” code used by CorpTech
to categorize software products. SOF codes are a hierarchical classification system used by CorpTech to
group products for market research purposes. Firms surveyed by CorpTech self-report the SOF codes in
which they are active, which can include products under development as well as products already
launched. By tracking when firms are first listed as being active in a SOF code, we are able to identify
entrants and incumbents in each market. Specifically, we classify a firm as an entrant if the firm has
products in a SOF category after two consecutive sample years (4 years elapsed time) of not having
products in that class, or is founded less than two years before its first appearance in the dataset.6
5 The companies in our sample consist of organizations listed by CorpTech as having at least one product classification beginning with “SOF”, which is CorpTech’s code for software. Many of these firms are also active in other, non-software markets. Approximately 80% of the observations for which we have information on the primary SIC code are classified in SIC 73 (prepackaged software). We thank LECG Inc. for facilitating access to these data. 6 Note that CorpTech reports data biannually, with six sample years in the period 1994-2004. We exclude as entrants firms that left the market and then re-entered. Some firms enter CorpTech several years after their founding dates, and we thus do not observe their entry. However, only a relatively small number of these firms actually enter during the period under consideration (1994-2002). We omit SOF codes in which the number of missed entries

6
While CorpTech defines more than 290 fine-grained SOF categories, we focus our analysis on a
subset of 27 of these markets that make up the “core” of the database. These markets cover a large share
of the software industry: 35% of all the firms in the CorpTech file are active in at least one of these
markets. Many of the SOF categories refer to fairly general categories of software or appear to be defined
in terms of customer segments rather than in terms of a technology—e.g. “secondary school software,”
“dental practice management software,” etc.—or have very low and intermittent levels of activity.7
Furthermore, our analysis also requires a comprehensive mapping of patents to markets, which is a
challenging and resource-intensive task. These 27 markets were chosen primarily on the basis of our
assessment as to whether the technology/product is reasonably distinctive, and we could define a set of
keywords that could be fruitfully searched in the abstract of patent documents. Clearly there is some
potential for selection bias to influence our results, however we believe that the criteria used to choose
these markets are independent of entry and exit dynamics and this subset does not appear to be markedly
different in terms of firm characteristics and entry and exit rates (see the Appendix). However, since
these markets are selected on the basis of having sufficiently large numbers of patents and sufficiently
distinctive keywords, our findings may not be generalizable to markets in which there are very few
patents, or in which inventions are disclosed in unusually general or heterogeneous language.8
The markets that we consider are listed in Table 1, along with means of the number of market
participants and entrants. As can be seen in the Table, markets vary widely in size, as measured by the
average number of participants over the sample period, and in the volume of entry. The average market
had 156.42 active firms, of which 9.7% were entrants, but these mean values conceal very substantial
underlying variation over time and across markets.9 The smallest market averaged 12.5 firms, while the
largest had 588. Overall, there was substantial growth in the number of active firms in this sample:
average market size almost tripled over time, rising from 74.4 firms in 1994 to 201.9 in 2004. There was
substantial variation in the mean annual growth rate of individual markets, ranging from 3% per year to
over 70%. While the average number of entrants per market per year rose substantially over the sample
period, the ratio of entrants to market participants varies widely across markets, between 0 and 60% in
during the period is more than one standard deviation above the mean. The average number of missed entries across the categories (calculated as the share of firms that are founded after 1990 but do not appear in the sample until more than 2 years after their founding date) amounts to 12.5% of entries, and the standard deviation is 10.08. 7 While it is possible that the effective definition of markets may have changed somewhat over time, affecting counts of market participants, for variation in market definitions to bias our findings any over- or under-inclusion of firms in markets would have to be systematically correlated with our measures of patent thickets. We also control for this possibility in Table 6, which shows that including market X time effects, as controls for any market-level unobserved heterogeneity that changes over time does not affect the results. 8 Our measurement of entry is therefore contingent on Corptech’s definition of markets. Industry boundaries may be fluid, particularly in rapidly changing technologies, and we may therefore be mis-measuring entry. 9 Table A.1 in the Appendix shows annual counts of the number of entrants and number of participants in each market.

7
some market-years, and fluctuated over time, falling from an average across markets of 19.2% in 1996 to
3.3% in 2002 and then back up to 8.7% in 2004.
We measure the “patent landscape,” i.e. the number, characteristics, and ownership of patents
relevant to each market at a given point in time, by developing a mapping between patents and markets
that matches USPTO patent classifications to the CorpTech SOF categories. This was a complex
process, described in detail in the Appendix: in short, we used a combination of text searching and
reading the manual of patent classification to identify the set of patent classification codes associated with
each market, and then collected information on all patents granted in these classes since 1976 from the
NBER database of US patents. After extensive hand-checking (see the appendix) we believe that we
capture most, though not all, patents relevant to each market, whether assigned to competitors or non-
competitors.10 Based on grant dates and expiration dates of each patent we compute the set of patents “in
force” that are relevant to a market in a given sample year. The number of patents falling in this set
(though not necessarily relevant to a specific product) is one measure of the size of the patent thicket
faced by an entrant. As a proxy for bargaining costs associated with patents, we count the number of
distinct assignees on the set of patents cited by those patents we have identified as relevant to each
market. These measures are depicted in Table 1 (and in greater detail Appendix Table A.2). The number
of patents per market averaged 2383.5 over all markets and all sample years, but with significant variation
across markets and over time. The least patented market had an average of 16.67 patents in force over the
sample period, while the most patented market averaged more than 7400. Significantly for the issues of
interest here, the number of patents in each market grew very rapidly over time for all markets, with mean
annual growth rates over the period 1993-2004 ranging from 7.9% to 52% (with a mean annual growth
rate of 22%).
The average number of cited assignees per market averages 607 with a high of 2738, and a low of
6. Clearly, the average potential entrant is very unlikely to have to obtain licenses to 2383 patents from
607 different entities—only a small fraction of the total number of patents that we have identified as
being relevant to a market will be applicable to a specific product. But these figures are consistent with
anecdotal evidence that in complex technologies, clearing a product for launch can entail reviewing
thousands of patents.11 As with the number of patents relevant to each market, this measure grew
significantly over time in all markets: an entrant to the average market in 2004 would face almost six
times as many potential licensors as in 1994.
10 Note that this approach does not identify other potentially relevant patents which are generally applicable to many different software products, or are otherwise usable outside their “industry of origin,” facilitated by modular design of software and use of object-oriented programming techniques. But provided these “missing” patents are equally relevant to all 27 SOF categories this will not affect our ability to identify the effect of patents on entry from the cross-section. 11 Based on conversations with various corporate patent counsel.

8
We hypothesize that entry costs are increasing in the number of patents faced by an entrant.
These costs include the total amount of royalties that would be have to be paid by an entrant if it licensed
its way in to the market, R&D expenditures related to inventing around, and a higher probability of
having to pay infringement damages. Large numbers of patents also raise costs of performing complete
searches of prior art, and increase uncertainty about being sued for patent infringement. While they do
not account for other determinants of entry into a market controlled for in subsequent regressions, the
summary statistics in Table 2 suggest a significant negative relationship between patent thickets and
entry. For each market-year observation, the number of patents per incumbent is calculated and the
terciles of the distribution of patents per incumbent in each year are computed. We then calculate the
mean number of entrants into market-years falling in each tercile, which falls from around 27 entrants in
the least “thicketed” markets to around 7 entrants in the most thicketed. However, because this may
reflect market-specific characteristics unrelated to patenting, we also look at the mean within-market
change in the number of entrants over each two year period between sample years. Again, we see that
markets with the fewest patents per incumbent saw the fastest growth in entry, while those with the most
patents per incumbent saw the smallest increase in entry. Finally, we compare the average change in the
number of entrants over the two year period prior to a shift in the legal regime governing software patents
to that seen in the two years following a regime change. (As discussed below, these regime shifts
strengthened patentability at different points in time for different types of software, and provide an
identifying source of exogenous variation.) We find that the negative relationship between growth in the
number of entrants and patenting rates is most evident following the regime shifts.
Identification
Uncovering the impact of patent thickets on entry with conventional data is difficult for several
reasons. One central difficulty stems from the fact that a patent reflects not just a property right over an
invention but also the successful outcome of an R&D investment: because technological innovation
resulting in a new product is closely related to entry, in equilibrium the raw cross-sectional correlation
between the number of patents in the market and the entry rate is likely to be positive. A key challenge in
empirically identifying the effects of a proliferation of property rights over a given amount of invention,
therefore, is to find a way to hold the invention constant but allow the property rights to vary.
We approach this problem as follows. First, we control for persistent differences across markets
in the rate of technological innovation (as well as any other time-invariant factors associated with both
patenting and entry) using market fixed effects. Our estimates of the effect of patenting on entry are thus
derived from the “within” relationship between changes in patenting and changes in entry over time. To
also control for unobserved heterogeneity across markets that evolves over time, we estimate
specifications with market fixed effects interacted with a linear or quadratic time trend. Second, we
disentangle the effects of patents from the technological capabilities of firms in the market by

9
distinguishing between the total number of patents relevant to a given market and the average quality of
those patents. We measure the average quality of patents in a market using the mean number of citations
received by those patents, which is commonly interpreted as an indicator of patent value or importance.12
This allows us to isolate the effects of a change in the extent of patenting in a market, holding constant the
underlying technological significance or economic value of the innovations covered by those patents.
A second problem with identifying the effect of patents on entry is the potential endogeneity of
patent filings. Clearly, it may be difficult to give a causal interpretation to the coefficients of a reduced-
form regression of entry on patents if the volume of patents reflects an equilibrium response by
incumbents reacting to the threat of entry. However there are some institutional aspects of the software
industry that suggest that the impact of this potential source of bias is likely to be limited. On the one
hand, a significant share of the patents in each market during this period is held by firms other than
incumbents, primarily large hardware firms.13 On the other hand, the time it takes for a patent application
to make its way through the patent office is very long relative to product development cycles in software.
The average pendency period for patents relating to the markets in our sample during the time frame
considered here was 2.8 years, with the market with the lowest pendency period averaging 1.4 years and
the market with the longest period at 4.8 years. Software development is a very fast-moving process, with
typical development cycles measured in months rather than years. Thus, almost all of the patents in force
at the time of potential entry will have been filed well in advance of any actual product launch. It should
also be noted that any bias created by incumbents filing patents in response to the threat of entry is likely
to be positive (that is, biasing the coefficient towards zero).
Recognizing that endogeneity of patenting may nonetheless be an important problem, we look to
an independent source of variation in the impact of patents—changes during our sample period in the
legal regime governing software patents that progressively clarified and expanded patentability of
software inventions. Significantly, these changes affected different markets in our sample at different
times. Hall and MacGarvie (2010) provide a detailed description of the legal changes covering software
during this period. In summary: prior to 1996, patent protection was generally understood to be limited to
software used in manufacturing or otherwise tied to physical processes, as specified by the Supreme
Court’s Diamond v. Diehr decision of 1981; software more generally was covered after 1996;14 and
financial, business methods software and disembodied algorithms became more clearly patentable after 12 Citations are subject to a variety of problems, and may be difficult to interpret directly as evidence of knowledge flow, see Alcacer, Gittelman and Sampat (2009), but are correlated with market value of patents, probability of being litigated and other indicators of economic value. See Lanjouw and Schankerman (2004) and Hall, Jaffe and Trajenberg (2005). 13 Bessen and Hunt (2007) argue that only 5% of software patents belong to software publishers. 14 The ground-breaking decision was In re Alappat, issued in 1994, but this “left important questions unanswered” (Durant 1995) and a series of court cases in 1994 and 1995 led the USPTO to issue definitive and comprehensive new guidelines on software patentability in 1996 which increased the probability that issued software patents would be held valid (Laurie and Siino 1995).

10
the State Street decision in 1998. This differential evolution in patentability across markets and over time
can be seen in the differences in the volume and growth rates of patenting across different patent classes
within software during the 1980s and 1990s, with technologies in which the regime change took place
earlier seeing earlier increases in the growth of patenting (see Figure 1 in the Appendix).15
This variation provides a useful source of identification. A granted patent in principle represents
a right to exclude others from commercializing an invention, but in practice many issued patents may not
be upheld in court.16 This is particularly likely to be the case when standards of patentability are
controversial or evolving. Thus, while many firms did file patents covering software inventions and
many software patents were indeed granted prior to the expansion of patentability, the validity and
enforceability of these patents was uncertain. The regime changes increased the probability that a given
software patent would be found valid upon litigation and increased the number of inventions that could be
patented. Thus while increases in the number of patents relevant to a market can be expected to reduce
entry rates, after a regime shift we expect to see even greater increases in barriers to entry associated with
patents and larger reductions in entry rates.
The degree to which these regime changes are an independent source of variation in the strength
of patents is, obviously, an important question. Again, institutional features of the software industry are
useful. In most of these markets prior to our sample period, many of the patents we have identified as
being relevant were held by hardware producers. These firms were active in patent-intensive markets
outside software, had developed advanced internal IP-related resources and capabilities, and were
therefore likely to have a high propensity to file patent applications in any technology and to seek
licensing revenues from potential infringers. In contrast, there is evidence that many software firms did
not support the changes in patentability, and had invested very little in patenting their products. At
hearings held by the USTPO in 1994, major differences in attitudes towards software patents emerged
between these groups of firms17 and Mann (2007) shows that firms like Adobe, Autodesk, Computer
Associates and Oracle came late to the software patent game (in terms of applications filed). Arguably,
15 While the legal changes we describe are the crucial ones, later developments are worth mentioning. In 1999, Congress established prior user rights to alleged infringers of business methods patents able to prove that they had been commercially exploiting the invention for at least one year before the patent was filed. This change may have slightly reduced the value of business methods patents held by entrants. In 2000, the USPTO began devoting additional review time to business methods applications (the "second pair of eyes" policy) which may have improved the quality of issued patents in that area. The effects of higher-quality patents are controlled for in our regressions by the inclusion of the number of forward citations per patent. 16 Lemley and Shapiro (2005) describe patents as “probabilistic patents” and note that only 0.1% of patents are litigated to trial, and half of litigated patents are found to be invalid. 17 According to one article published in Computer Lawyer in October 1995, at these hearings “most of the large hardware manufacturers (e.g., Apple, AT&T, Digital Equipment, IBM, Intel, Silicon Graphics, and Sun Microsystems) and a few large software companies (e.g., Microsoft and Taligent) generally supported extending patent protection to software inventions. On the other side, several large software companies, including Adobe, Autodesk, and Oracle, and many small software developers opposed patent protection for software, as inhibiting the development of new software products.”

11
therefore, changes in the strength of software patents during this period were not completely anticipated
by many industry participants,18 and these changes meant that markets in which firms had (for whatever
reason) previously filed larger numbers of patents saw exogenous increases in entry barriers compared to
otherwise similar markets in which few patents had been filed.
The timing of patent applications and long lags in granting patents also help with identification.
Shifts in the legal regime have an immediate effect on the strength of granted patents and pending
applications that predate the regime change, but any increase in applications filed by incumbents in
response to the threat of entry would not result in an increase in patents granted until several years after
the change. This means that any change in the correlation between patenting and entry over the period
immediately following the regime change will not be contaminated by simultaneity bias arising from
patents filed in response to the threat of entry. Note also that because these legal changes affected the
strength of software patents but did not change the underlying innovation protected by the patent, they
further help to distinguish the effects of stronger property rights from the effects of more innovation.
Empirical Approach and Estimation Results
Our regression analysis of the relationship between patents and entry begins with a simple
discrete choice model of entry decisions. 19 Firms are assumed to enter markets when expected profits net
of entry costs are greater than zero. 20 We estimate a single equation logit discrete hazard model of the
form
y*it = ’xit+it yit =1 if y*it >0, 0 otherwise
where xit is a vector of variables capturing costs and benefits of entry and the dependent variable yit
equals 1 in the year that the firm enters a market, and 0 before. Firms are dropped from the regression
once they have entered a market. Following Berry (1992) and Scott Morton (1999), we begin by treating
all the software firms in our sample that have not previously entered a market as potential entrants. The
full dataset would have 57,167 firm-year combinations and 27 markets, for a total of 1,543,509
observations. To guard against understating our standard errors, we use the state-based sampling
technique advocated by Manski and Lerman (1977) and used by Silverman (1999) in an analogous
context, sampling 10% of the non-entrants in each market and 100% of the entrants.21 Summary statistics
18 Hall and MacGarvie (2010) find a statistically significant market reaction (measured in terms of Cumulative Abnormal Returns) to the USPTO’s 1996 announcement and issuance of new guidelines on software patentability, suggesting this regime shift was not completely foreseen by the market. 19 Our empirical approach is closely related to Greenstein and Wade (1998), who study entry, exit and the product cycle in the commercial mainframe computer market, as well as to Scott Morton (1999), which analyzes generic entry in pharmaceuticals and Kyle (2006), which studies international entry patterns in pharmaceuticals. 20 Deciding to enter means that the firm has chosen to commercialize its invention internally. Conversely, a decision not to enter may mean either that the firm has chosen to exploit its invention via licensing, or that it has abandoned commercialization entirely. 21 We also experimented with more restrictive definitions of the set of potential entrants, for example by defining potential entrants as those firms that have not previously entered an “adjacent” market (the same broad SOF
12
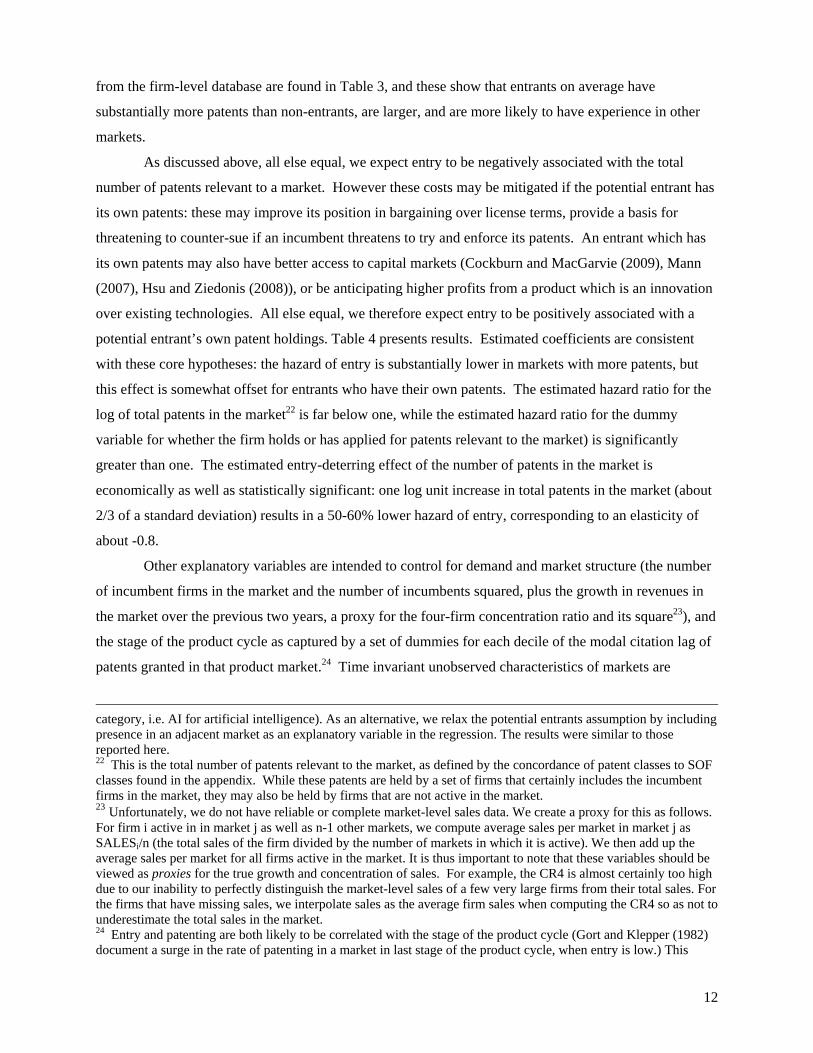
from the firm-level database are found in Table 3, and these show that entrants on average have
substantially more patents than non-entrants, are larger, and are more likely to have experience in other
markets.
As discussed above, all else equal, we expect entry to be negatively associated with the total
number of patents relevant to a market. However these costs may be mitigated if the potential entrant has
its own patents: these may improve its position in bargaining over license terms, provide a basis for
threatening to counter-sue if an incumbent threatens to try and enforce its patents. An entrant which has
its own patents may also have better access to capital markets (Cockburn and MacGarvie (2009), Mann
(2007), Hsu and Ziedonis (2008)), or be anticipating higher profits from a product which is an innovation
over existing technologies. All else equal, we therefore expect entry to be positively associated with a
potential entrant’s own patent holdings. Table 4 presents results. Estimated coefficients are consistent
with these core hypotheses: the hazard of entry is substantially lower in markets with more patents, but
this effect is somewhat offset for entrants who have their own patents. The estimated hazard ratio for the
log of total patents in the market22 is far below one, while the estimated hazard ratio for the dummy
variable for whether the firm holds or has applied for patents relevant to the market) is significantly
greater than one. The estimated entry-deterring effect of the number of patents in the market is
economically as well as statistically significant: one log unit increase in total patents in the market (about
2/3 of a standard deviation) results in a 50-60% lower hazard of entry, corresponding to an elasticity of
about -0.8.
Other explanatory variables are intended to control for demand and market structure (the number
of incumbent firms in the market and the number of incumbents squared, plus the growth in revenues in
the market over the previous two years, a proxy for the four-firm concentration ratio and its square23), and
the stage of the product cycle as captured by a set of dummies for each decile of the modal citation lag of
patents granted in that product market.24 Time invariant unobserved characteristics of markets are
category, i.e. AI for artificial intelligence). As an alternative, we relax the potential entrants assumption by including presence in an adjacent market as an explanatory variable in the regression. The results were similar to those reported here. 22 This is the total number of patents relevant to the market, as defined by the concordance of patent classes to SOF classes found in the appendix. While these patents are held by a set of firms that certainly includes the incumbent firms in the market, they may also be held by firms that are not active in the market. 23 Unfortunately, we do not have reliable or complete market-level sales data. We create a proxy for this as follows. For firm i active in in market j as well as n-1 other markets, we compute average sales per market in market j as SALESi/n (the total sales of the firm divided by the number of markets in which it is active). We then add up the average sales per market for all firms active in the market. It is thus important to note that these variables should be viewed as proxies for the true growth and concentration of sales. For example, the CR4 is almost certainly too high due to our inability to perfectly distinguish the market-level sales of a few very large firms from their total sales. For the firms that have missing sales, we interpolate sales as the average firm sales when computing the CR4 so as not to underestimate the total sales in the market. 24 Entry and patenting are both likely to be correlated with the stage of the product cycle (Gort and Klepper (1982) document a surge in the rate of patenting in a market in last stage of the product cycle, when entry is low.) This

13
controlled for with market fixed effects. We also perform robustness checks (see Table 6) which include
market-level fixed effects interacted with linear and quadratic trend variables. These interaction terms
control for market-level heterogeneity that changes over time. We control for some observable
characteristics of each potential entrant: firm age since founding, a measure of firm size based on a
categorical measure of revenues25, and prior experience in related markets as captured by the lagged
number of “adjacent” or related markets in which the firm is active, and a lagged count of the number of
other unrelated markets (outside the broad SOF class) in which the firm operates.26 Standard errors are
clustered by firm to account for potential correlation across observations caused by unobserved firm-
specific factors.
As can be seen in Table 4, after controlling for demand with the growth of revenues, the number
of incumbents enters our model with a positive sign, and the number of incumbents squared has a
negative coefficient. Both are significant at the 5% level in all specifications. Thus, when the number of
firms in the market is small, increases in the size of the market are associated with increases in entry—
presumably reflecting a reduction in the market power of incumbents or a reduction of barriers to entry
created by network effects. For markets with larger numbers of incumbents, however, increases in the
number of incumbents reduce the probability of entry, which could reflect the fact that large numbers of
incumbents indicate more mature, more crowded, and less attractive markets. A similar pattern emerges
in the coefficients on the four-firm concentration ratio, with a positive coefficient on the linear term and a
negative coefficient on the squared term. Our proxy for the growth rate of revenues in a product market is
positively and significantly related to the rate of entry. The modal citation lag coefficients (not reported
but available upon request) display a pattern in which there is an initial increase in the rate of entry as the
modal lag increases, followed by a decrease and then an increase in the coefficient when the modal lag
becomes very long. These coefficients are as one would expect given the relationship between the rate of
entry and the stage of the product cycle. We find that the probability of entering a given market is
increasing in the number of adjacent markets the firm has already entered. Similarly, the number of
unrelated markets in which firms have experience is a significant positive predictor of entry (being active
in one more of these markets increases the hazard of entry by around 28%). Following Silverman (1999),
observation is likely to be less relevant in fast-moving technologies with short product lifecycles such as software. Nonetheless, we control for the modal citation lag to patents in the product class as an indicator of the maturity of the technology. For each product class and citing-cited year pair, we compute the citation frequency, or ratio of actual to potential citations (see Jaffe and Trajtenberg (1999)), and then identify the citation lag (citing year – cited year) with the highest citation frequency for a given product class and citing year. 25 This is a set of dummies for each category of revenue: 0 = under $1m; 1 = $1m - $2.5m; 2 = $2.5m - $5m; 3 = $5m - $10m; 4 = $10m - $25m; 5 = $25m - $50m;6 = $50m - $100m; 7 = $100m - $250m; 8 = $250m - $500m; 9 = Over $500m. 26 Here we define other markets in terms of the aggregate SOF categories (e.g. AI: Artificial Intelligence), to reflect the fact that the benefits of experience in a broadly defined area is likely to be common across more detailed product classes.

14
which includes a measure of the relevance or relatedness of a potential entrant’s technological capability
to any given market, we distinguish in column (2) between the firm’s patents related to a particular
market and a dummy for whether the firm ever patents in any market during our sample.27 The inclusion
of the latter dummy helps us to interpret the coefficient on the firm’s patents in a particular market as the
value of IP related to the market in question, holding constant other firm characteristics correlated with
patenting more generally. We observe that, while there is a positive and significant effect of ever
patenting at all in any market (which increases the hazard of entry by 23%), the effect of having patents in
a particular market is almost three times as important (increases the hazard of entry by 124%). Though
not reported here due to space constraints, the effect of the firm’s size (revenues) on the probability of
entry is concave.
The average quality of patents in the market, as captured by forward citations, has a large and
strongly significant negative effect on entry. This effect is distinguishable from the number of patents per
se. This result is consistent both with the idea that higher numbers of citations suggest “larger” patents,
which are more difficult to invent around, and with the idea that higher numbers of citations reflect more
significant past innovation by incumbents—both of which will tend to deter entry. Similarly, the average
quality of “own” patents held by potential entrants, as measured by the number of forward citations per
patent, is also positively and significantly associated with the rate of entry. This suggests that entrants
with higher quality patents may find it easier to bargain their way into the market. A striking finding of
this model (as seen in columns 1 and 3) is that entrants’ “pipeline” of pending applications is a stronger
predictor of entry than the number of granted patents: entry is positively associated with a dummy for
having any patent applications and with the ratio of patent applications to grants, but not with cumulative
patent grants or a dummy for having patents granted (after controlling for applications).
We also find that, consistent with our expectations, the effects of both the firms’ own patents and
the number of patents in the market are diminished when a firm is active in other markets. In column (7)
we estimate negative and significant coefficient on the firm’s patent application dummy interacted with
the number of related markets in which the firm has experience. There is also a positive and significant
coefficient on the interaction of the firm’s experience in related markets (markets with the same broad
product category definition) and the number of patents in the focal market (market j). These results
suggest that the negative effects of incumbents’ patents on entry are mitigated when potential entrants
have complementary assets (proxied here by experience in other markets), and that having patent
applications is significantly more positively related with entry for firms with no experience in related
markets. Similar findings are obtained in column (8) for the interaction terms between firms’ and
27 In results not reported in the table, we estimated a positive and significant relationship between Silverman (1999)’s RELTECH measure and the rate of entry.

15
markets’ patents and the number of unrelated markets in which the firm operates (markets with a different
broad product category).
As discussed above, it may not be just the absolute number of patents in an area that can deter
entry, but also the total cost to an entrant of licensing its way through the thicket. One salient feature of
patent thickets is the potential for higher costs associated with negotiating with many parties. To the
extent that there are fixed costs of conducting a negotiation, having to deal with more parties will drive up
costs of obtaining licenses. There may also be transactions costs associated with bargaining and
coordinating negotiations with multiple licensors.28 We calculate the number of different assignees
whose patents are cited by patents relevant to the market in question, which can be thought of a proxy for
the number of distinct licensors that an entrant would have to negotiate with in order to license its way in
to a market. The results in column (4) in Table 4 are consistent with the idea that increases in the
potential number of licensors increase entry costs, with a negative and significant estimated coefficient on
the number of cited assignees per forward citation in a market. In this regression the count of cited
assignees is normalized by the number of forward citations in the market to reduce collinearity among the
explanatory variables.29
Endogeneity and regime change results
In Table 4 we address identification of a causal effect of patent thickets on entry using
differences-in-differences estimates that exploit the changes in the legal regime affecting patentability of
software relevant to different markets discussed above. To take advantage of this source of exogeneity,
we estimate the effects of patents on entry in a difference-in-differences type of analysis in column (5) of
Table 4, where we include a dummy variable equal to one in each market following the regime change,
and its interaction with the number of patents in the market.30 The negative and significant coefficient on
the interaction term indicates a negative treatment effect of strengthened patent rights on entry. In
column (6) we consider three time periods: pre regime-change, the initial period following the regime
change, and later years after the regime change. We focus on the change in the coefficient on the
market’s patents during the period immediately following the regime change, because long administrative
28 See Noel and Schankerman (2006) and Ziedonis (2004). 29 The resulting variable enters the regression in log form. In alternate versions of this regression, negative coefficients were also obtained on the number of cited assignees, but standard errors were difficult to estimate precisely due to collinearity with the number of patents in the market. 30 The precise timing of the regime shift in each market is laid out in Table A.3. We assigned markets to one of three groups. The first group includes software related to manufacturing or tied to physical processes, which should have been considered patentable following Diamond v. Diehr in 1981. This includes automatic teller machine, robotic, quality control, and peripheral device driver software. Another group of markets are those relating to business methods and financial applications, which became patentable following the State Street decision in 1998, which in our sample includes invoicing/billing, tax preparation, inventory management, and order entry/processing software. The remaining markets are considered to have been affected by the USPTO’s issuance of new guidelines over software patents in 1995-96, which allowed for software patents as long as they were not embedded in physical media.

16
delays at the patent office prevent incumbent firms from reacting to the “treatment” by obtaining
additional patents. 31 We show that only the immediate effect is significant, indicating that the
intensification of the negative effect of patents on entry is restricted to the initial period following the
regime change, during which the increase in the number of patents in the market would largely be the
result of the processing of applications filed before the regime change. This suggests that the estimated
negative effect of patents in the market is not driven by the endogenous response of incumbents filing
more patents in reaction to the regime change. The coefficient on the main effect of the patents in the
market variable remains negative and significant in all these regressions.
In contrast to the results on the intensification of the entry-deterring effect, we do not observe a
statistically significant increase in the impact of firms’ own patents on the probability of entry following a
regime change. This suggests that the entry-deterring effect of the market’s patents intensified once
software became more patentable, but the entry-promoting effect did not. If the property-right component
of entrants’ patents were a significant determinant of entry, this should have become more valuable
following a regime change, with a positive estimated coefficient on the interaction term. The fact that
there is no significant change in the association between firms’ own patents and entry may imply that the
estimated main effect is mainly picking up the fact that firms with better technologies are both more
likely to patent and more likely to enter markets, rather than the property right effect.
Robustness
The difference-in-differences approach we employ here relies upon the assumption that the legal
changes were exogenous, or more precisely, were not driven by other factors that simultaneously changed
the relationship between patenting and entry.32 For example, if some other change took place at around
the same time as the legal changes and led to both an increase in the rate of patenting and a decline in the
rate of entry, identification of a casual effect of patents on entry will be compromised. But because pre-
regime-change markets are used as a control group, for such a confounding factor to explain our findings,
it would have to have affected each of the relevant markets separately at exactly the same time as the
legal change. Results are also contingent on the timing and application of the regime shifts to each
market. As an additional robustness check, we randomly assigned the “regime” dummy to markets while
31 The length of the period “immediately” following the regime change is determined by the length of the grant lag in the years following the change. As of 2000, the median grant lag in markets affected by the first regime change (in March 1996) averaged 2.8 years, so that a large share of the patents granted up to 2000 were filed before the USPTO issued new guidelines in 1996. By 2004, the median grant lag in markets affected by the State Street decision in July 1998 averaged 3.8 years, and was as long as 4.7 years in billing software. We therefore restrict the period “immediately” following the first regime change to 1998-2000, while the corresponding period after State Street is 2000-2004. 32 It is certainly possible that some firms filed more patents in anticipation of legal changes, which if true, would bias our estimates of the effects of patents on entry towards zero. But note that this effect works against a finding of a significant effect on entry, and as stated previously there is evidence that many software firms (as opposed to hardware firms) did not support the changes in patentability and were late in starting to file large numbers of software patents.

17
preserving the number of markets that were post-regime change in each year. We find that in such a
specification with a random regime variable, the regime X patents coefficient is statistically insignificant.
We also find that the latter interaction is insignificant at the 5% level when we shift the date of the regime
change forward or backward in time within each market.
Another important assumption underlying our analysis is the definition of markets used to
measure entry and identify relevant patents. We have considered the possibility that technological change
could have led some of the markets in our sample to become more fragmented into sub-markets not
captured by the CorpTech market definitions at around the same time as our regime changes. If this did
indeed happen, we might see declines in observed entry rates (because entry into the submarkets would
not necessarily be captured) associated with an increase in patenting that could spuriously generate our
regime change findings. But if this effect is responsible for our findings, we would expect to see it
primarily in the largest markets or in the markets that saw the biggest declines in concentration, and our
results are robust to a variety of specifications that account for this potential fragmentation.33
Another possible omitted variable is the rise of the internet. The growth of internet-related
businesses, for example, would be associated with an increase in both the rate of entry and the rate of
patenting, which would lead to a positive coefficient on the interaction of the market’s patent stock and
the rate of entry. We find the opposite – a negative and significant estimated coefficient on this interaction
term. Our main regressions and regime change results are similarly robust to dropping the “internet
tools” market from the sample. We also experimented with including a dummy variable for markets in
which Microsoft was active, and the results were robust to the inclusion of this control.
Endogeneity and patenting by potential entrants
A second source of potential endogeneity in the single-equation discrete-time hazard model is
patenting by entrant or potential entrant firms. The positive effect of a firm’s own patents on entry may
be subject to simultaneity bias if firms’ decisions to enter a market and to apply for patents are jointly
determined (for example, if there are unobserved differences across firms in R&D productivity that make
the most productive firms more likely to patent and enter markets). 34 To correct for this bias, we use a
Bivariate Probit (BVP) model, with separate equations for the firm’s decision to patent an innovation and
to enter the market. This type of model has been used by, for example, Cassiman and Veugelers (2006) to
model the complementarity between internal R&D and external knowledge acquisition, and allows us to
33 We tried dropping the largest markets, and interacting of the number of patents in the market with the number of incumbents. We also dropped markets with the biggest declines in the CR4 and interacted the regime dummy and the CR4 and CR4 squared. All of these regressions confirmed that our results are not driven by increased fragmentation within markets. 34 This two-equation approach has some similarities to the model of Hunt (2006) who models jointly determined R&D and patenting decisions in the presence of overlapping property rights.

18
account for the endogenous nature of the firm’s patenting decision in the entry equation by allowing for
correlation in the errors of the entry and patenting equations. 35
The Bivariate Probit model takes the following form: define dummy variables y1 =1 if the firm
enters the market and 0 otherwise, and y2 = 1 if the firm files a patent and zero otherwise. Let x1 and x2 be
vectors of variables influencing entry and patenting. We then specify a two-equation model where
y*1 = 1’x1+1 y1 =1 if y*1 >0, 0 otherwise y*2 = 2’x2+2 y2 =1 if y*2 >0, 0 otherwise E[1]= E[2]=0 Var[1]= Var[2]=1 Cov[1,2] = Assuming that the firm decides first whether or not to patent, making patenting costs sunk, we
can write this model as a recursive simultaneous equations model in which the joint distribution of y1 and
y2 is given by:
Prob[y1 =1, y2 = 1| x1, x2] =21’x1+y22’x2
where 2 is the cdf of the bivariate normal distribution.36 In this model we use the number of non-
software patents previously filed by the firm as an additional identifying instrument for the probability the
firm has filed a software patent in year t. This variable instruments for propensity to patent: if a firm has
experience navigating the patent system for technologies other than software, that firm should lower costs
of obtaining a software patent.
The estimates of the BVP model for various model specifications are contained in Table 5. Both
the patenting equation and the entry equation include the covariates used in the single-equation model.
The patent equation additionally includes the number of non-software patents held by the firm as an
instrument. The firm’s patent application dummy is an explanatory variable in the entry equation, so that
this is a recursive simultaneous-equations model.
Most of the estimated effects are similar to those found in the single-equation model. However,
the effects of the market’s patents and the firm’s patents both fall in magnitude in the BVP model relative
to the single-equation entry model, consistent with a reduction in simultaneity bias. For example, in the
single-equation entry model, a firm having filed any patent applications has a roughly three times greater
odds of entry, whereas in the BVP model this increase is only around 45%. The odds ratio on the log of
the patents in the market is around 0.4 in the single-equation model and 0.7 in the BVP model. The
estimated correlation coefficient of the error terms across equations is positive and statistically significant
(at the 5% or 10% level, depending on the specification).
35 As Greene (1998) observes, “in the bivariate probit model, unlike in the linear simultaneous equations model, if the two dependent variables are jointly determined, we just put each on the right hand side of the other equation (or, in our case, one of them) and proceed as if there were no simultaneity problem.” 36 See Greene (1999) p. 848, and Greene (1998) for an example.

19
The estimated effect of the number of patents in the market on entrant/potential entrant firms’
probability of patenting is positive, though not significant. Consistent with our hypothesis that experience
in non-software patenting may lower costs of obtaining software patents, or that firms vary in their
propensity to patent, this variable is a strong predictor of patenting, with a t-ratio of 27.13 in the patenting
equation corresponding to a first-stage F-statistic of 208.7. However it appears to be uncorrelated with
the firm’s entry decision except through its effect on propensity to obtain software patents: when the
number of the firm’s non-software patents are included as an explanatory variable in the entry equation,
the point estimate of the effect is essentially zero and is statistically insignificant with a p-value of 0.84.
The effect of the number of patents in the market on the probability of entry is economically
significant, and we see a substantial difference between firms that patent and those that do not. A one
percent increase in the number of patents in the market is associated with a 0.34% decrease in the
probability that a firm has patents and enters the market (Pr (y1=1, y2=1)). Meanwhile, the elasticity of the
probability that the firm has no patents and enters the market (Pr(y1=1, y2=0)) with respect to the number
of patents in the market is -0.84.37
In addition to using the instrumental variable to control for endogeneity of own patenting, we
address potential endogeneity of incumbents’ patenting in the entry equation, using the same differences-
in-differences approach as in Table 4. As can be seen in the estimates reported for the models in columns
(5) and (6), and (7) and (8), very similar results are obtained.
While we believe that these firm-level estimates, where we can control to some degree for firm-
specific characteristics and directly measure decisions not to enter, are most helpful for understanding the
determinants of the firm’s entry decision, we have also estimated an aggregate market-level model of
entry rates. Table 6 presents results. The specification of these regressions are essentially the same as in
Table 4, however because the dependent variable is a count we use a Poisson regression model with
market fixed effects and robust standard errors is used to estimate the parameters.38
Consistent with the firm-level results, we find a negative and significant relationship between the
log of the number of patents in the market and the rate of entry. The estimates from the market-level
model generally confirm those of the firm-level model, and we include several additional robustness
37 The magnitude of the effect of own patents on entry estimated using instrumental variables should be interpreted carefully. As shown by Angrist and Imbens (1995), the estimates obtained from instrumental variables are informative about the effect of the “treatment” only on firms induced to patent software by their history of non-software patenting. If the marginal firms induced to patent by their history of patenting non-software are those valuing patents less highly, while the firms patenting software independent of their patenting histories value patents highly, our instrumented estimates may in fact underestimate the effect of firms’ patents on entry. 38 Wooldridge (2002) explains that if the underlying distribution is truly Negative Binomial, the Negative Binomial estimator is more efficient than the Poisson, but if the distributional assumption is wrong, the Poisson is still consistent as long as the conditional mean is correctly specified. In practice, we found that there was essentially no difference between results obtained using a fixed-effects Negative Binomial model and those obtained from the Poisson model. The former are available upon request.

20
checks. First of all, we show in columns (3) and (4) that the main result is robust to the inclusion of a
linear trend interacted market-level fixed effects (or a quadratic trend interacted with these effects).
Columns 5 and 6 examine the impact of legal changes in patentability on the entry-deterring
effects of patents. We find that for entrants as a whole, the relationship between the number of patents in
the market and the rate of entry is exacerbated (with a significant coefficient of -0.10 on the interaction of
the market’s patent stock and the regime change dummy).39 For de novo entrants (which we define as
firms younger than 10 years old who specialize in one aggregate SOF class40 – e.g. AI: artificial
intelligence), the effect is stronger—the coefficient on the interaction between market’s patent stock and
the regime shift dummy is -0.32 and significant at the 1% level in column 7. This suggests that the
strengthening of IP rights in software led to a more substantial intensification of the entry-deterring effect
of patents for young, specialized firms than for established companies.41
The magnitudes of the coefficients described in this paper should be interpreted carefully.
Holding constant average patent quality, a 1% increase in patents is associated with approximately a 0.8%
decline in entry, which may seem a surprisingly large effect. Note however that the “pure” property
rights effect associated with strengthening of software patents is much smaller: the interaction of patents
with regime change adds only -0.1 to the main effect of patents in the market. Interpreting this as an
estimate of the effect of going from no patent protection over software to strong patent protection, the
deterrent effect on entry is rather small. However, if one views the regime changes as a mild increase in
the strength of patents, the deterrent effect appears larger. Thus, this coefficient remains somewhat open
to interpretation.
Secondly, it is important to think about whether an increase in patenting holding constant forward
citations per patent (patent quality) is a likely real-world outcome. In our data, we observe a negative
correlation between the number of patents in the market and the average number of forward citations
received by these patents. This is partly due to a truncation effect (controlled for by the inclusion of year
effects in our regressions), but it may also reflect the issuance of larger numbers of relatively less
important patents in some markets. Note that if we assume that the number of forward citations per
patents falls as the number of patents granted grows, the magnitude of the effect of patents on entry is
lower. Under this interpretation, “frivolous” or purely strategic patents without much technological value
are not predicted to have as significant an effect on entry.
39 When we drop citations per patent from the regression, the coefficient on the number of patents in the market is -0.2 (s.e. of 0.11) and the regime X patents coefficient is -0.12 (s.e. of 0.05). Thus, without holding constant patent quality, the effects of patents pre-regime change are substantially smaller, but the post-regime change effect is similar. 40 We measure firm age as the time elapsed since the founding date reported in Corptech. 11% of the entrants in the sample meet this criteria. 41 GMM estimation of the market-level regressions using the models suggested by Chamberlain (1992) and Wooldridge (1997), or Blundell, Griffith and Windmeijer (2002), gave similar coefficients.

21
Discussion and Conclusions
Patents appear to have a significant effect on competition and entrant/incumbent interaction in
software markets. In this context, where patents are thought to be particularly problematic in creating
transactions costs, we estimate substantial elasticities of entry with respect to patents held by incumbents
and non-competitors in the range of -0.3 to -0.8. Because patents are both a property right that allows
patent holders to exclude competitors, and an indicator of technological capabilities, it can be difficult to
interpret a negative association between patents and entry: are entry rates lower because the incumbents’
patents raise entry costs, or because incumbents are out-innovating entrants? Here we use exogenous
changes in the legal regime governing software patents, along with a control for the quality of patents in a
market, to identify a distinct and significant “property rights” effect. Interestingly, the deterrent effect of
patents is substantially less negative when entrants arrive at the market with their own patents. Where we
explicitly model firms’ joint decisions to obtain their own patents and to enter the market, we find an
almost three times larger negative effect of existing patents on entry when entrants lack patents.
We also find that patents appear to be substitutes for complementary assets and capabilities in
determining entry: the estimated value of entrants’ own patent holdings in the entry process is lower for
those firms that have prior experience entering other markets, and patent thickets matter less for firms
with experience. While this result is difficult to interpret definitively without much finer detail on firms’
products and entry strategies than we have been able to collect, it highlights the significance of co-
specialized complementary assets for competition in knowledge-intensive industries.
Patent thickets, at least as measured here, thus appear to substantially raise entry costs. This is
not to say that the overall effect of strengthening software patents was necessarily negative, at least in an
absolute sense. The markets in our sample saw substantial overall growth in sales and in the number of
participants during this period. Any negative impact of patent thickets on entry is felt as forgone potential
for even higher rates of entry, and this may be mitigated by the stimulating effects of stronger patent
protection. As discussed above, strengthening or clarifying property rights has potential benefits as well
as costs, and we estimate a positive and significant main effect of regime changes on entry, all else equal.
But transactions costs associated with thickets may have interesting dynamic effects: while incumbents
enjoy increased protection for current innovations, larger thickets will also raise their costs of introducing
future generations of innovations. With both entrants and incumbents facing strong incentives to acquire
patents, which in turn contribute to even larger thickets and higher associated transactions costs, all
market participants can become negatively affected. These dynamics may underlie opportunities
emerging for new organizational forms and business models that eliminate (or arbitrage) transactions
costs associated with patent thickets. Some privately funded entities have begun to assemble large
portfolios of software patents, with the apparent intent to sell access at a single “one-stop shopping” price

22
that reflects internalization of transactions costs. Other software producers are side-stepping the whole
problem by operating in the open source world.
A striking finding is that, while firms holding patents related to a market are much more likely to
enter it, relatively few of the entrant firms in our sample came to market with patents—and only a
minority of entrants in the sample held patents by 2004.42 There are a variety of reasons why a
prospective entrant might not obtain any patents. These firms may not have been innovators (rather
unlikely in software, where new products dominate and the pace of technological change is very high), or
may have made strategic decisions to ignore incumbents’ patents or (unobserved by us) may have taken a
license on terms offered by the incumbent. It may also be the case that compared to alternate IP strategies
such as Open Source or reliance on trade secrets, copyright, and speed to market, for many firms the costs
of obtaining patents outweigh perceived benefits. But this finding also points to an important role for
sophisticated management of new enterprises and prompt responses to environmental changes: some
firms may simply have failed to appreciate the strategic value of patents in this industry—giving those
that quickly and effectively acquired the ability to manage IP a significant advantage in this dynamic
sector.
42 30% of entrants in our sample held at least one patent in any technology class by 2006.

23
References
Alcacer, J., M. Gittelman, and B. Sampat (2009) “Assignee and Examiner citations in US Patents: An. Overview”, Research Policy, 38:415-427
Angrist, J. and G. Imbens (2005) “Two-Stage Least Squares Estimation of Average Causal Effects in
Models with Variable Treatment Intensity.” Journal of the American Statistical Association, 90(430):431-442
Arora, A., Fosfuri, A., Gambardella, A. (2001). Markets for Technology: Economics of Innovation and
Corporate Strategy. MIT Press, Cambridge MA. Berry, S. (1992) “Estimation of a Model of Entry in the Airline Industry.” Econometrica, 60(4):889-917 Bessen, J. and R. Hunt (2007) “An Empirical Look at Software Patents,” Journal of Economics and
Management Strategy 16, no. 1, pp. 157-89. Bessen, J. and M. Meurer (2008) Patent Failure: How Judges, Bureaucrats and Lawyers Put Innovators
at Risk, forthcoming, Princeton University Press. Blundell, R., R. Griffith and F. Windmeijer (2002) “Individual Effects and Dynamics in Count Data
Models,” Journal of Econometrics, Vol.108, No.1, 113-131, May 2002. Bresnahan, T. (1985). “Post-entry Competition in the Plain Paper Copier Market.” American Economic
Review, May, pp.15 19. Bright, A.A. (1949). The Electric Lamp Industry, N.Y. Macmillan. Cassiman, B. and Veugelers, R. (2006) “In Search of Complementarity in Innovation Strategy: Internal
R&D and External Knowledge Acquisition.” Management Science, 52 (1), p. 68-82 Chamberlain, G. (1992) “Comment: Sequential Moment Restrictions in Panel Data.” Journal of Business
and Economic Statistics, 10, pp. 20-26. Cockburn, I. M., MacGarvie, M. “Patents, Thickets and the Financing of Early-Stage Firms: Evidence
from the Software Industry.” Journal of Economics and Management Strategy, 2009, 18(3):729-773.
Cockburn, I. M. and Z. Griliches (1988) “Industry Effects and Appropriability Measures in the Stock
Market’s Valuation of R&D and Patents.” American Economic Review, 78(2), pp. 419-423. Cockburn, I. M., R. Henderson, and S. Stern, “Untangling the Origins of Competitive Advantage.”
Strategic Management Journal, December 2000, 21(10-11), pp. 1123-1145 Cohen, W. R. Nelson, and J. Walsh (2000) “Protecting Their Intellectual Assets: Appropriability
Conditions and Why U.S. Manufacturing Firms Patent (or Not).” NBER Working Paper No. 7552.
de Figueiredo, J. and M. Kyle (2001) “Competition, Innovation and Market Exit” Working Paper, MIT. Dunne, T., M. J. Roberts and L. Samuelson (1988) “Patterns of Firm Entry and Exit in U.S.
Manufacturing Industries,” RAND Journal of Economics, 19(4), pp. 495-515.
24
Federal Trade Commission (2003) To Promote Innovation: The Proper Balance of Competition and
Patent Law and Policy. Washington DC, October 2003. Gans, J., Hsu, D. and S. Stern (2002) “When Does Start-Up Innovation Spur the Gale of Creative
Destruction?” RAND Journal of Economics, 33(4), pp571-586.)] Gans, J., and S. Stern (2003) “The product market and the market for “ideas”: commercialization
strategies for technology entrepreneurs.” Research Policy 32(2):333-350 Geroski, P. (1995) “What do we know about entry?” International Journal of Industrial Organization, 13,
pp. 421-440. Geroski, P. (1989) “Entry and the rate of innovation.” Economics of Innovation and New Technology 1,
pp. 203-214. Giarratana, M. (2004) “The Birth of a New Industry: Entry by Start-ups and the Drivers of Firm Growth.
The Case of Encryption Software”, Research Policy, 35(2): 787-806. Gort, M. and S. Klepper (1982) “Time Paths in the Diffusion of Product Innovations.” Economic Journal,
92(367), pp. 630-653. Greene, W. (1998) “Gender Economics Courses in Liberal Arts Colleges: Further Results.” Journal of
Economic Education, 29(4): 291-300. Greene, W. (1999) Econometric Analysis 4th Edition. Prentice Hall. Greenstein, S. and J. Wade (1998) “The Product Life Cycle in the Commercial Mainframe Computer
Market, 1968-1982, RAND Journal of Economics, 29(4), pp. 772-789. Hall, B.H. (1993) “The Stock Market’s Valuation of R&D Investment During the 1980’s.” American
Economic Review, 83(2):259-264. Hall, B.H., A.B. Jaffe, and M. Trajtenberg (2005) “Market Value and Patent Citations” RAND Journal of
Economics, 36(1), pp. 16-38. Hall, B.H. and M. MacGarvie (2010) “The Private Value of Software Patents.” Research Policy, Volume
39, Issue 7, September 2010, pp. 994-1009. Hall, B.H. and R.H. Ziedonis (2001) “The Patent Paradox Revisited: An Empirical Study of Patenting in
the US Semiconductor Industry, 1979-95,” Rand Journal of Economics, 32(1): 101-128. Hunt, R. (2006) “When Do More Patents Reduce R&D?” American Economic Review, Papers &
Proceedings, Vol. 96, pp.87-91. Henderson, R. and I. M. Cockburn (1994) “Measuring Competence: Exploring Firm Effects in
Pharmaceutical Research.” Strategic Management Journal, 15:63-84. Hsu, D. and Ziedonis, R. (2008) “Patents as Quality Signals for Entrepreneurial Ventures.” Academy of
Management Best Paper Proceedings.

25
Jaffe, Adam B. and Lerner, Josh (2006) “Innovation and Its Discontents,” Capitalism and Society: Vol. 1: Iss. 3, Article 3.
Jaffe, A. and M. Trajtenberg (1999) “International Knowledge Flows: Evidence from Patent Citations”,
Economics of Innovation and New Technology, Vol. 8 (1999): 105-136. Kyle, M. (2006) “The Role of Firm Characteristics in Pharmaceutical Product Launches.” RAND Journal
of Economics, 37(3):602-618 Lanjouw, J. and M. Schankerman (2004) “Patent Quality and Research Productivity: Measuring
Innovation With Multiple Indicators.” Economic Journal, 114(495), 441-465. Lemley, M. and Shapiro, C. (2005), “Probabilistic Patents”, Journal of Economic Perspectives, Vol. 19,
No. 2, pp. 75-98. Lerner, J. and F. Zhu (2007) “What is the Impact of Software Patent Shifts: Evidence from Lotus v.
Borland.” International Journal of Industrial Organization 25(3):511-529. Levin, R, et al., (1987) “Appropriating the Returns from Industrial Research and Development.”
Brookings Papers on Economic Activity, 1987, No. 3, pp783-831 Mann, R. (2005) Do Patents Facilitate Financing in the Software Industry?” Texas Law Review
83(4):961-1030 Mann, R. and T. Sager (2005) “Patents, Venture Capital, and Software Start-Ups.” University of Texas
Law School, Law and Economics Research Paper No. 57, September 2005. Mansfield E., M. Schwartz and S, Wagner (1981). “Imitation Costs and Patents: An Empirical Study. “
Economic Journal 91, pp907-918. Manski, C. and Lerman, S. (1977) “Estimation of Choice Probabilities from Choice Based Samples.”
Econometrica, Vol. 45, No. 8, pp. 1977-1988 Merges, R. P. (2006) “Patents, Entry and Growth in the Software Industry.” Working paper, UC
Berkeley School of Law. Merrill, S. et al. (2004) A Patent System for the 21st Century. Washington DC; National Academies
Press. Nerkar, A. and P. Roberts (2004) “Technological and Product-Market Experience and the Success of New
Product Introductions in the Pharmaceutical Industry.” Strategic Management Journal, 25: 779–799
Noel, M. and M. Schankerman (2006). “Patent Thickets and Software Innovation: Theory and Evidence
from a Panel of U.S. Firms”, CEPR Working Paper #5701. Porter, M. (1980) Competitive Strategy. New York; Basic Books. Robinson W.T. (1988). “Sources of Market Pioneer Advantages of Industrial Goods Industries.”Journal
of Marketing Research

26
Silverman, B. (1999) “Technological Resources and the Direction of Corporate Diversification: Toward an Integration of the Resource-Based View and Transaction Cost Economics.” Management Science, 45(8):1109-1124
Scott Morton, F. (1999) “Entry Decisions in the Generic Drug Industry” RAND Journal of Economics,
30(3), pp. 421-440. Shapiro, C. (2001) “Navigating the Patent Thicket: Cross-licenses, Patent Pools, and Standard-Setting.”
In Innovation Policy and the Economy, Vol. 1. Adam Jaffe, Joshua Lerner, and Scott Stern, (eds.), MIT Press for the National Bureau of Economic Research.
Smith, B. L. and S. O. Mann (2004) “Innovation and Intellectual Property Protection in the Software
Industry: An Emerging Role for Patents.” University of Chicago Law Review, 71, pp. 241-264. Teece, D. (1986) “Profiting from technological innovation: Implications for integration, collaboration,
licensing and public policy.” Research Policy, 15:285-305. Wagner, S. and I. M. Cockburn, (2010) “Patents and the Survival of Internet-related IPOs.” Research
Policy, 39(2):214-228. Wooldridge, J. (1997) “Distribution-Free Estimation of Some Nonlinear Panel Data Models.” Journal of
Econometrics, 90, pp. 77-91. Yao, Dennis (1997) “Antitrust constraints on competitive strategies.” Chapter in by G. Day and D.
Reibstein (eds.) Wharton on Dynamic Competitive Strategy, John Wiley & Sons, Inc., 1997. Ziedonis, R. H. (2004) “Don't Fence Me In: Fragmented Markets for Technology and the Patent
Acquisition Strategies of Firms”, Management Science, 50: 804 - 820.
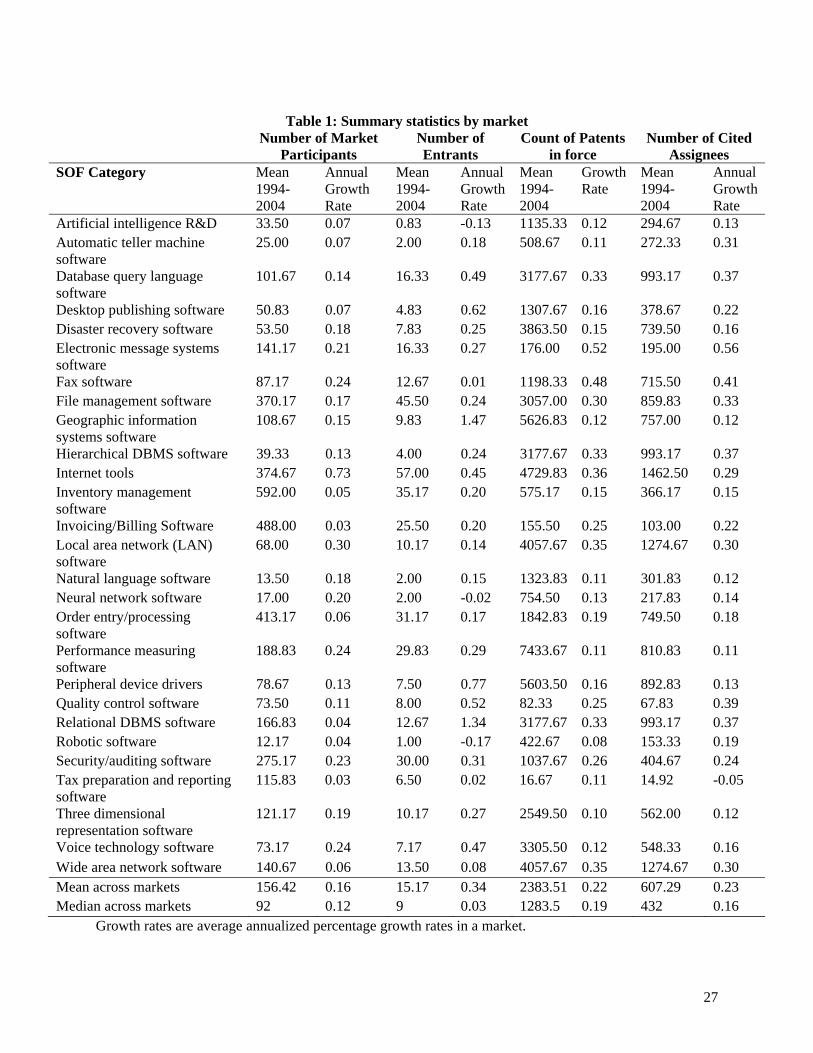
27
Table 1: Summary statistics by market
Number of Market Participants
Number of Entrants
Count of Patents in force
Number of Cited Assignees
SOF Category Mean 1994-2004
Annual Growth Rate
Mean 1994-2004
Annual Growth Rate
Mean 1994-2004
Growth Rate
Mean 1994-2004
Annual Growth Rate
Artificial intelligence R&D 33.50 0.07 0.83 -0.13 1135.33 0.12 294.67 0.13 Automatic teller machine software
25.00 0.07 2.00 0.18 508.67 0.11 272.33 0.31
Database query language software
101.67 0.14 16.33 0.49 3177.67 0.33 993.17 0.37
Desktop publishing software 50.83 0.07 4.83 0.62 1307.67 0.16 378.67 0.22 Disaster recovery software 53.50 0.18 7.83 0.25 3863.50 0.15 739.50 0.16 Electronic message systems software
141.17 0.21 16.33 0.27 176.00 0.52 195.00 0.56
Fax software 87.17 0.24 12.67 0.01 1198.33 0.48 715.50 0.41 File management software 370.17 0.17 45.50 0.24 3057.00 0.30 859.83 0.33 Geographic information systems software
108.67 0.15 9.83 1.47 5626.83 0.12 757.00 0.12
Hierarchical DBMS software 39.33 0.13 4.00 0.24 3177.67 0.33 993.17 0.37 Internet tools 374.67 0.73 57.00 0.45 4729.83 0.36 1462.50 0.29 Inventory management software
592.00 0.05 35.17 0.20 575.17 0.15 366.17 0.15
Invoicing/Billing Software 488.00 0.03 25.50 0.20 155.50 0.25 103.00 0.22 Local area network (LAN) software
68.00 0.30 10.17 0.14 4057.67 0.35 1274.67 0.30
Natural language software 13.50 0.18 2.00 0.15 1323.83 0.11 301.83 0.12 Neural network software 17.00 0.20 2.00 -0.02 754.50 0.13 217.83 0.14 Order entry/processing software
413.17 0.06 31.17 0.17 1842.83 0.19 749.50 0.18
Performance measuring software
188.83 0.24 29.83 0.29 7433.67 0.11 810.83 0.11
Peripheral device drivers 78.67 0.13 7.50 0.77 5603.50 0.16 892.83 0.13 Quality control software 73.50 0.11 8.00 0.52 82.33 0.25 67.83 0.39 Relational DBMS software 166.83 0.04 12.67 1.34 3177.67 0.33 993.17 0.37 Robotic software 12.17 0.04 1.00 -0.17 422.67 0.08 153.33 0.19 Security/auditing software 275.17 0.23 30.00 0.31 1037.67 0.26 404.67 0.24 Tax preparation and reporting software
115.83 0.03 6.50 0.02 16.67 0.11 14.92 -0.05
Three dimensional representation software
121.17 0.19 10.17 0.27 2549.50 0.10 562.00 0.12
Voice technology software 73.17 0.24 7.17 0.47 3305.50 0.12 548.33 0.16 Wide area network software 140.67 0.06 13.50 0.08 4057.67 0.35 1274.67 0.30 Mean across markets 156.42 0.16 15.17 0.34 2383.51 0.22 607.29 0.23 Median across markets 92 0.12 9 0.03 1283.5 0.19 432 0.16
Growth rates are average annualized percentage growth rates in a market.

28
Table 2: Summary statistics on entry, markets grouped by terciles of the distribution of patents per incumbent in the market
Mean Patents per incumbent Mean # entrants Mean 2-yr change in # entrants
Market group*
1994-2004
Pre-regime change
Post-regime change
1994-2004
1996-2004
pre-regime change
post-regime change
Lower third 3.356 2.000 4.153 25.444 4.467 5.750 4.000
Middle third 27.184 21.740 29.089 12.630 3.156 6.000 2.632
Upper third 78.055 92.006 72.548 7.566 1.244 6.250 0.162
* markets in the lower third group have fewer patents per incumbent in a given year than 66.7% of the markets in that year.

29
Table 3: Firm-level summary statistics Variable Obs. Mean Std. Dev. Min Max
All firms
Age 151475 15.432 12.087 0 229
Firm’s revenues (in millions*) 77048 48.141 129.813 1 500
Proxy for growth of sales in market j 151475 0.217 0.735 -1.172 2.611
Proxy for CR4 in market j 151475 0.433 0.224 0 1
Number of incumbents (in 100’s) 151475 1.583 1.744 0 6.880
Number of related markets in which firm is active 149892 0.103 0.498 0 16
Number of adjacent markets in which firm is active 149892 0.780 1.338 0 18
Dummy for firm’s cumulative patents granted in market j 151475 0.010 0.099 0 1
Dummy for firm’s cumulative patent applications in market j 151475 0.013 0.114 0 1
Firm’s granted patents in market j 151475 0.115 4.064 0 812
Forward citations to firm’s patents in market j 151475 1.579 59.714 0 11323
Entrants (firm-market-year observations in which enterijt =1)
Age 2457 15.079 11.538 0 139
Firm’s revenues (in millions*) 1654 85.304 164.321 1 500
Proxy for growth of sales in market 2457 0.455 0.652 -1.172 2.611
Proxy for CR4 in market 2457 0.277 0.163 0.093 1
Number of incumbents (in 100’s) 2457 2.755 2.086 0.04 6.88
Number of related markets in which firm is active 2455 0.426 1.083 0 16
Number of adjacent markets in which firm is active 2455 1.691 2.037 0 18
Dummy for firm’s cumulative patents granted in market j 2457 0.063 0.242 0 1
Dummy for firm’s cumulative patent applications in market j 2457 0.078 0.268 0 1
Firm’s granted patents in market j 2457 1.065 11.755 0 298
Forward citations to firm’s patents in market j 2457 15.807 185.811 0 6373
Potential entrants (firm-market-year observations in which enterijt =0)
Age 149018 15.437 12.096 0 229
Firm’s revenues (in millions*) 75394 47.326 128.833 1 500
Proxy for growth of sales in market 149018 0.213 0.736 -1.172 2.611
Proxy for CR4 in market 149018 0.435 0.224 0 1
Number of incumbents (in 100’s) 149018 1.564 1.731 0 6.88
Number of related markets in which firm is active 147437 0.098 0.481 0 14
Number of adjacent markets in which firm is active 147437 0.765 1.318 0 18
Dummy for firm’s cumulative patents granted in market j 149018 0.009 0.095 0 1
Dummy for firm’s cumulative patent applications in market j 149018 0.012 0.11 0 1
Firm’s granted patents in market j 149018 0.099 3.807 0 812
Forward citations to firm’s patents in market j 149018 1.344 55.246 0 11323

30
Table 4: Discrete-time hazard model of entry. Coefficients expressed as odds ratios. Dependent variable = Enterijt.
(1) (2) (3) (4) (5) (6) (7) (8) ln(# patents in market) 0.436 0.443 0.429 0.398 0.442 0.440 0.441 0.419 (0.107)*** (0.109)*** (0.106)*** (0.100)*** (0.118)*** (0.120)*** (0.119)** (0.102)*** ln(fwd citations per patent in mkt)
0.230 0.242 0.225 0.136 0.287 0.260 0.260 0.226 (0.139)** (0.146)** (0.136)** (0.088)*** (0.184)* (0.177)** (0.177)* (0.135)**
Firm’s granted patents 1.001 1.000 (0.004) (0.003)
Firm’s patent apps per granted patent
1.194 1.071 (0.078)*** (0.046)
Firm’s fwd citations per patent
1.030 (0.004)***
Patents granted (dummy) 1.451 1.470 1.441 1.477 1.478 1.670 (0.335) (0.344) (0.689) (0.347)* (0.335) (0.371)**
Patents filed (dummy) 2.239 2.537 2.515 2.535 2.977 3.211 (0.448)*** (0.506)*** (0.730)*** (0.509)*** (0.592)** (0.634)***
Ever patents (dummy) 1.231 (0.075)***
Ln(assignees/fwd cites) 0.680 (0.113)**
D(Regime) 3.351 (2.680)
D(Regime) X Patents granted
1.029 (0.561)
D(Regime) X Market's patents
0.855 (0.044)***
D(Regime) X Patents filed
1.010 (0.383)
D(Regime) X Market's Fwd cites
0.990 (0.191)
D(Early Regime) 3.281 (1.254)***
D(Early Regime) X Market’s Patents
0.855 (0.043)***
D(Late Regime) 2.118 (1.507)
D(Late Regime) X Market’s Patents
0.896 (0.078)
“Experience”† X firm’s patents
0.711 0.862 (0.071)** (0.036)***
“Experience” † X market’s patents
1.038 1.012 (0.012)** (0.006)**
Age 0.976 0.976 0.976 0.976 0.976 0.976 0.977 0.976 (0.003)*** (0.004)*** (0.004)*** (0.004)*** (0.004)*** (0.004)*** (0.003)** (0.003)***
Experience in related markets
1.476 1.471 1.460 1.467 1.470 1.470 1.219 1.477 (0.041)*** (0.041)*** (0.042)*** (0.043)*** (0.043)*** (0.043)*** (0.080)** (0.042)***
Experience in unrelated markets
1.290 1.289 1.281 1.279 1.279 1.279 1.282 1.199 (0.020)*** (0.021)*** (0.024)*** (0.023)*** (0.023)*** (0.023)*** (0.023)** (0.055)***
# Incumbents (in hundreds)
2.203 2.203 2.221 2.271 2.619 2.682 2.291 2.212 (0.213)*** (0.214)*** (0.216)*** (0.220)*** (0.282)*** (0.293)*** (0.222)** (0.215)***
# Incumbents squared 0.938 0.938 0.937 0.936 0.921 0.918 0.934 0.938 (0.011)*** (0.011)*** (0.011)*** (0.011)*** (0.011)*** (0.012)*** (0.011)** (0.011)***
growth of sales in SOF 1.769 1.763 1.753 1.757 1.790 1.786 1.727 1.745 (0.138)*** (0.138)*** (0.137)*** (0.138)*** (0.141)*** (0.142)*** (0.135)** (0.136)*** Four-firm CR in SOF 15.286 15.958 15.721 19.655 28.296 30.404 17.369 15.494
(12.672)*** (13.281)*** (13.109)*** (16.519)*** (24.907)*** (26.908)*** (14.431)** (12.801)*** CR4 squared 0.035 0.033 0.033 0.026 0.022 0.020 0.030 0.035
(0.033)*** (0.031)*** (0.032)*** (0.025)*** (0.022)*** (0.020)*** (0.029)** (0.033)*** Robust standard errors (clustered by firm) in parentheses. Controls for firm revenues included. 149,892 Observations. *significant at 10%; ** significant at 5%; *** significant at 1% † “Experience” in col. (7) is in related markets; col. (8) is unrelated markets.

31
Table 5: Bivariate probit model
Coefficients expressed as odds ratios.
(1) (2) (3) (4) (5) (6) Dependent variable Patent
Filed Enter Patent
Filed Enter Patent
Filed Enter
ln(Market's patents) 1.156 0.743 1.156 0.722 1.167 0.755 (0.170) (0.074)*** (0.170) (0.074)*** (0.196) (0.081)*** ln(Fwd cites per patent in market)
0.976 0.617 0.975 0.509 0.953 0.677 (0.357) (0.152)** (0.356) (0.135)** (0.403) (0.176)
D(Patent Filed) 1.456 1.449 1.481 (0.225)** (0.225)** (0.285)**
Ln(assignees per forward cite)
0.865 (0.058)**
D(Regime) 0.920 1.653 (0.637) (0.533)
D(Regime) X Market's Patents
0.973 0.939 (0.046) (0.020)***
D(Regime) X Market's Fwd cites
1.073 0.992 (0.159) (0.077)
D(Regime) X Firm's granted Patents
1.303 (0.172)**
D(Regime) X Patents filed 0.773 (0.128)
ln(Firm's non-sw patents) 1.454 1.454 1.454 (0.023)*** (0.023)*** (0.023)***
Firm age 0.995 0.990 0.995 0.990 0.995 0.990 (0.002)** (0.001)*** (0.002)** (0.001)*** (0.002)** (0.001)*** Experience in related markets
1.234 1.216 1.234 1.220 1.235 1.220 (0.025)*** (0.016)*** (0.025)*** (0.016)*** (0.025)*** (0.016)***
Experience in unrelated markets
1.053 1.123 1.053 1.123 1.053 1.122 (0.010)*** (0.008)*** (0.010)*** (0.008)*** (0.010)*** (0.008)***
# Incumbents (in 100's) 0.880 1.427 0.880 1.442 0.887 1.523 (0.061)* (0.060)*** (0.061)* (0.060)*** (0.063)* (0.070)***
# incumbents squared 1.014 0.970 1.014 0.969 1.013 0.963 (0.008)* (0.005)*** (0.008)* (0.005)*** (0.008) (0.005)***
Growth of Sales in market 1.055 1.262 1.054 1.259 1.051 1.273 (0.039) (0.043)*** (0.039) (0.043)*** (0.039) (0.043)***
Four-firm CR in market 0.600 2.845 0.600 3.057 0.615 3.505 (0.247) (0.972)*** (0.247) (1.054)*** (0.254) (1.254)***
CR4 squared 1.449 0.280 1.448 0.258 1.391 0.243 (0.601) (0.105)*** (0.601) (0.098)*** (0.583) (0.095)***
Rho (p-value, Wald test of =0)
0.124 (0.09)*
0.123 (0.08)*
0.139 (0.04)**
Observations 149892 149892 149892 149892 149892 149892 Robust standard errors (clustered by firm) in parentheses * significant at 10%; ** significant at 5%; *** significant at 1%

32
Table 6: Market-level Poisson Regressions
(1) (2) (3) (4) (5) (6) (7) Dependent variable: Number of entrants # de novo
entrants Ln(market’s patents)
-0.235 -0.829 -1.335 -1.326 -0.849 -0.807 0.062 (0.135)* (0.293)*** (0.491)*** (0.490)*** (0.295)*** (0.272)*** (0.590)
Ln(fwd cites per pat in market)
-1.575 -0.348 -0.335 -1.785 -1.404 0.838 (0.708)** (0.795) (0.795) (0.730)** (0.679)** (1.352)
Ln(assignees per fwd cite in market)
-0.185 (0.109)*
D(Regime) 0.787 1.659 (0.597) (1.810)
D(Regime) X ln(mkt’s patents)
-0.097 -0.319 (0.038)** (0.108)***
D(Regime) X ln(fwd cites per pat)
-0.001 0.166 (0.159) (0.450)
Incumbents/100 0.733 0.709 -0.520 -0.519 0.727 0.826 1.492 (0.166)*** (0.167)*** (0.274)* (0.275)* (0.168)*** (0.172)*** (0.239)***
(Incumbents/100) squared
-0.056 -0.055 0.040 0.039 -0.057 -0.067 -0.128 (0.020)*** (0.020)*** (0.038) (0.038) (0.020)*** (0.020)*** (0.029)***
Growth of sales 0.531 0.518 0.425 0.424 0.522 0.535 0.746 (0.110)*** (0.103)*** (0.069)*** (0.069)*** (0.109)*** (0.095)*** (0.259)***
CR4 2.947 2.794 -1.228 -1.220 2.930 3.167 4.759 (1.753)* (1.719) (2.185) (2.186) (1.713)* (1.682)* (2.182)**
CR4 squared -3.572 -3.387 -0.093 -0.099 -3.554 -3.652 -4.109 (1.619)** (1.565)** (2.025) (2.025) (1.553)** (1.559)** (2.403)*
Constant 1.041 9.237 -504.790 -246.513 10.027 8.869 -7.950 (0.714) (3.600)** (156.950)*** (79.095)*** (3.823)*** (3.591)** (7.148)
Correction for unobserved heterogeneity
Market and year F.E.
Market and year F.E.
Linear trend + interacted with market F.E.
Quadratic trend + interacted with market F.E.
Market and year F.E.
Market and year F.E.
Market and year F.E.
Observations 162 162 162 162 162 162 162 Log Likelihood -415.67 -412.12 -434.52 -434.44 -411.31 -409.25 -211.43
Robust standard errors (clustered by market) in parentheses * significant at 10%; ** significant at 5%; *** significant at 1%
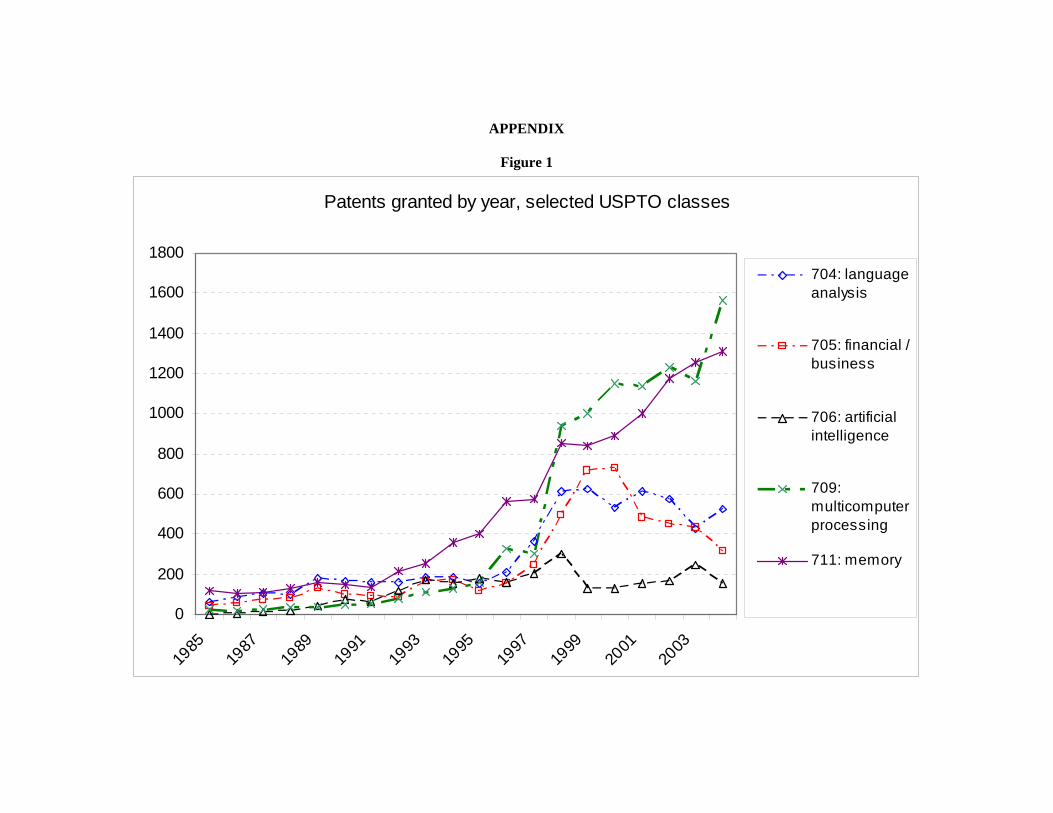
APPENDIX
Figure 1
Patents granted by year, selected USPTO classes
0
200
400
600
800
1000
1200
1400
1600
1800
1985
1987
1989
1991
1993
1995
1997
1999
2001
2003
704: languageanalysis
705: financial /business
706: artificialintelligence
709:multicomputerprocessing
711: memory
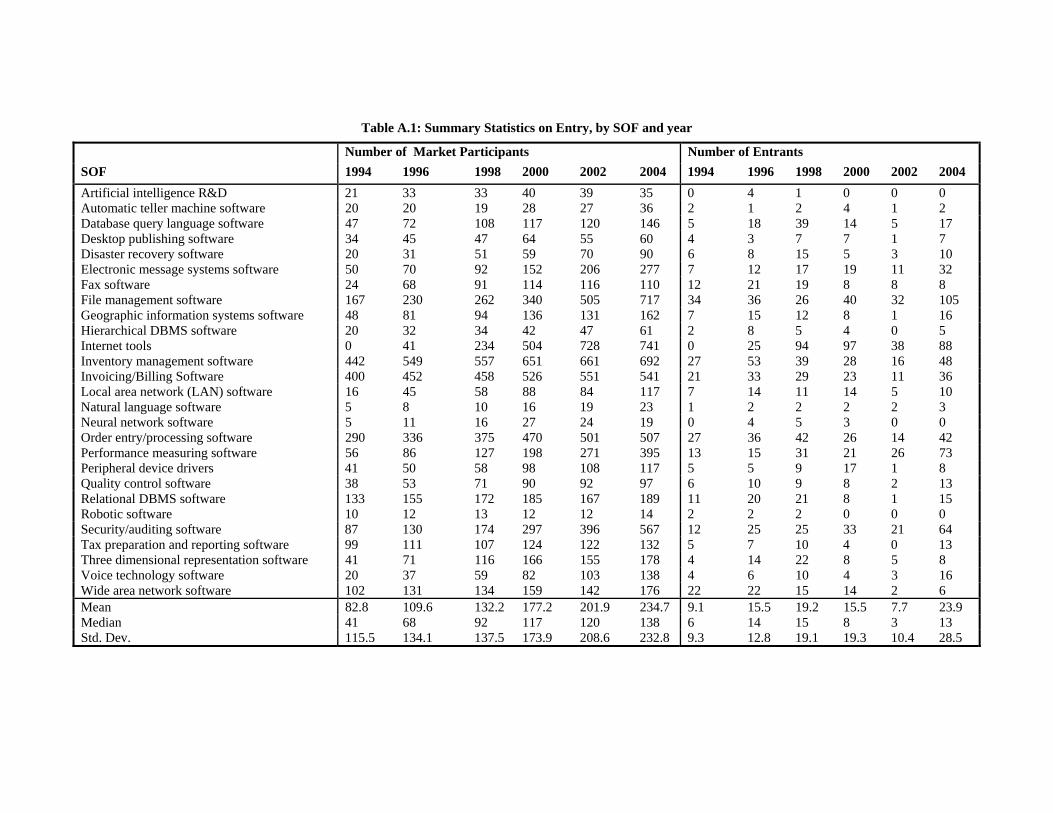
Table A.1: Summary Statistics on Entry, by SOF and year
Number of Market Participants Number of Entrants
SOF 1994 1996 1998 2000 2002 2004 1994 1996 1998 2000 2002 2004
Artificial intelligence R&D 21 33 33 40 39 35 0 4 1 0 0 0 Automatic teller machine software 20 20 19 28 27 36 2 1 2 4 1 2 Database query language software 47 72 108 117 120 146 5 18 39 14 5 17 Desktop publishing software 34 45 47 64 55 60 4 3 7 7 1 7 Disaster recovery software 20 31 51 59 70 90 6 8 15 5 3 10 Electronic message systems software 50 70 92 152 206 277 7 12 17 19 11 32 Fax software 24 68 91 114 116 110 12 21 19 8 8 8 File management software 167 230 262 340 505 717 34 36 26 40 32 105 Geographic information systems software 48 81 94 136 131 162 7 15 12 8 1 16 Hierarchical DBMS software 20 32 34 42 47 61 2 8 5 4 0 5 Internet tools 0 41 234 504 728 741 0 25 94 97 38 88 Inventory management software 442 549 557 651 661 692 27 53 39 28 16 48 Invoicing/Billing Software 400 452 458 526 551 541 21 33 29 23 11 36 Local area network (LAN) software 16 45 58 88 84 117 7 14 11 14 5 10 Natural language software 5 8 10 16 19 23 1 2 2 2 2 3 Neural network software 5 11 16 27 24 19 0 4 5 3 0 0 Order entry/processing software 290 336 375 470 501 507 27 36 42 26 14 42 Performance measuring software 56 86 127 198 271 395 13 15 31 21 26 73 Peripheral device drivers 41 50 58 98 108 117 5 5 9 17 1 8 Quality control software 38 53 71 90 92 97 6 10 9 8 2 13 Relational DBMS software 133 155 172 185 167 189 11 20 21 8 1 15 Robotic software 10 12 13 12 12 14 2 2 2 0 0 0 Security/auditing software 87 130 174 297 396 567 12 25 25 33 21 64 Tax preparation and reporting software 99 111 107 124 122 132 5 7 10 4 0 13 Three dimensional representation software 41 71 116 166 155 178 4 14 22 8 5 8 Voice technology software 20 37 59 82 103 138 4 6 10 4 3 16 Wide area network software 102 131 134 159 142 176 22 22 15 14 2 6 Mean 82.8 109.6 132.2 177.2 201.9 234.7 9.1 15.5 19.2 15.5 7.7 23.9 Median 41 68 92 117 120 138 6 14 15 8 3 13 Std. Dev. 115.5 134.1 137.5 173.9 208.6 232.8 9.3 12.8 19.1 19.3 10.4 28.5

Table A.2: Summary Statistics on Patents and Cited Assignees, by SOF and year
Number of patents in force Number of assignees cited in patents in force
SOF 1994 1996 1998 2000 2002 2004 1994 1996 1998 2000 2002 2004
Artificial intelligence R&D 567 821 1166 1297 1396 1565 160 198 362 254 439 355 Automatic teller machine software 305 332 392 529 676 818 58 163 259 352 348 454 Database query language software 580 1032 1990 3366 5015 7083 155 395 828 1055 1526 2000 Desktop publishing software 547 755 1096 1496 1827 2125 111 220 401 457 522 561 Disaster recovery software 1744 2330 3245 4235 5220 6407 312 513 731 833 894 1154 Electronic message systems software 15 27 62 154 317 481 16 27 99 170 419 439 Fax software 112 216 527 1284 2091 2960 88 219 521 836 1191 1438 File management software 642 1080 2015 3286 4819 6500 158 383 760 874 1307 1677 Geographic information systems software 3264 3911 4406 5460 7483 9237 408 535 620 767 1052 1160 Hierarchical DBMS software 580 1032 1990 3366 5015 7083 155 395 828 1055 1526 2000 Internet tools 759 1283 2660 5141 7807 10729 308 628 1241 1651 2209 2738 Inventory management software 276 321 426 599 807 1022 158 206 368 444 478 543 Invoicing/Billing Software 41 61 110 192 250 279 31 51 148 145 139 104 Local area network (LAN) software 665 1133 2330 4408 6659 9151 259 545 1093 1443 1880 2428 Natural language software 719 879 1151 1458 1738 1998 171 235 333 305 309 458 Neural network software 358 542 785 866 930 1046 119 160 264 172 349 243 Order entry/processing software 704 839 1234 2243 2839 3198 308 300 746 1117 1116 910 Performance measuring software 4187 5284 6591 8048 9409 11083 446 659 800 910 924 1126 Peripheral device drivers 2427 3158 4572 6333 7672 9459 425 658 904 1105 1004 1261 Quality control software 26 37 52 77 109 193 17 17 59 65 79 170 Relational DBMS software 580 1032 1990 3366 5015 7083 155 395 828 1055 1526 2000 Robotic software 309 339 362 372 525 629 103 99 130 86 271 231 Security/auditing software 270 389 695 1227 1618 2027 107 211 393 524 562 631 Tax preparation and reporting software 10 10 12 19 23 26 15 15 16 21 16 6 Three dimensional representation software 1598 1840 2177 2577 3207 3898 324 388 570 521 703 866 Voice technology software 1722 1971 2778 3669 4559 5134 233 336 655 560 711 795 Wide area network software 665 1133 2330 4408 6659 9151 259 545 1093 1443 1880 2428 Mean 876.7 1177.3 1746.1 2573.2 3469.8 4458.0 187.4 314.7 557.4 674.8 865.9 1043.6 Median 580 879 1234 2243 2839 3198 158 300 570 560 711 866 Std. Dev. 1016.7 1249.4 1588.1 2147.1 2846.9 3703.4 126.6 200.3 340.5 464.7 602.9 794.3


Table A.3
Timing of regime changes in software patentability for markets in the sample Pre-1996
ba_a Automatic teller machine software ma_c Robotic software ma_q Quality control software ut_h Peripheral device drivers
After 1996
ai_a Voice technology software
ai_l Natural language software ai_n Neural network software cs_f Fax software cs_i Internet tools cs_l Wide area network software cs_w Local area network software dm_f File management software dm_mh Hierarchical DBMS software dm_mr Relational DBMS software dm_q Database query language software oa_gd 3D representation software oa_me Electronic message systems software oa_p Desktop publishing software sv_ar Artificial intelligence R&D ts_er Geographic information systems software ts_er Geographic information systems software ut_r Disaster recovery software ut_x Security/auditing software ut_y Performance measuring software
After 1998
ac_b Invoicing/Billing Software ac_t Tax preparation and reporting software wd_i Inventory management software wd_o Order entry/processing software
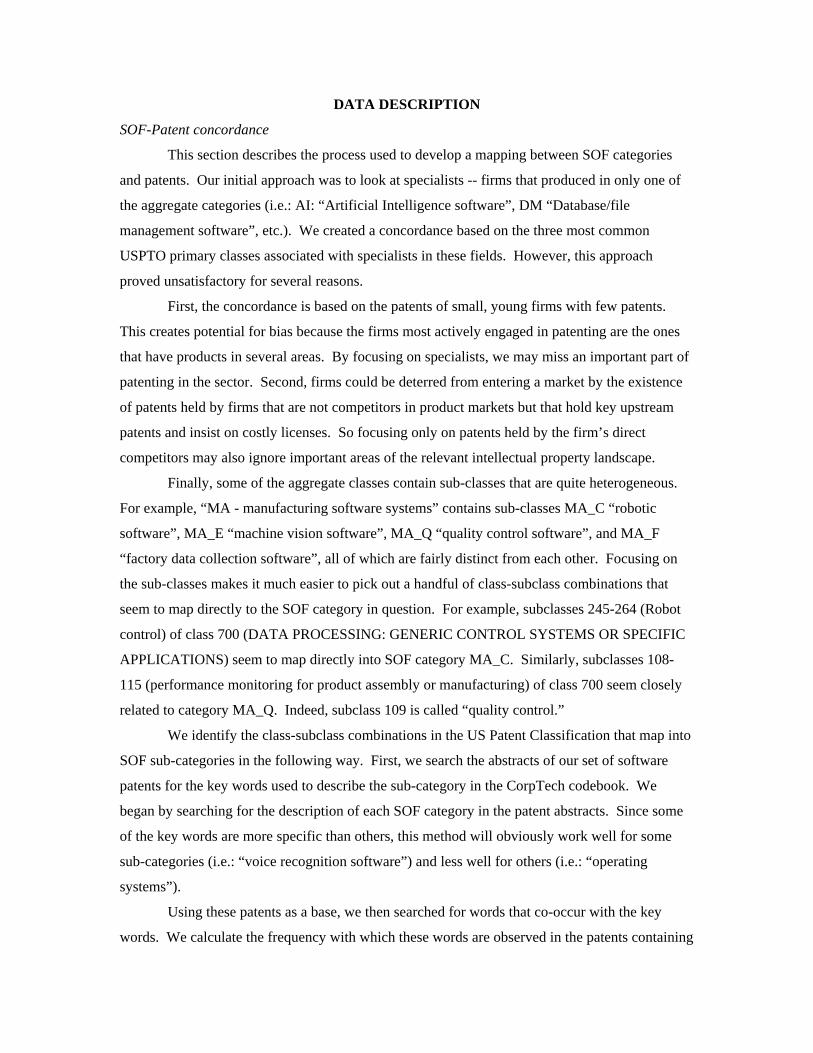
DATA DESCRIPTION
SOF-Patent concordance
This section describes the process used to develop a mapping between SOF categories
and patents. Our initial approach was to look at specialists -- firms that produced in only one of
the aggregate categories (i.e.: AI: “Artificial Intelligence software”, DM “Database/file
management software”, etc.). We created a concordance based on the three most common
USPTO primary classes associated with specialists in these fields. However, this approach
proved unsatisfactory for several reasons.
First, the concordance is based on the patents of small, young firms with few patents.
This creates potential for bias because the firms most actively engaged in patenting are the ones
that have products in several areas. By focusing on specialists, we may miss an important part of
patenting in the sector. Second, firms could be deterred from entering a market by the existence
of patents held by firms that are not competitors in product markets but that hold key upstream
patents and insist on costly licenses. So focusing only on patents held by the firm’s direct
competitors may also ignore important areas of the relevant intellectual property landscape.
Finally, some of the aggregate classes contain sub-classes that are quite heterogeneous.
For example, “MA - manufacturing software systems” contains sub-classes MA_C “robotic
software”, MA_E “machine vision software”, MA_Q “quality control software”, and MA_F
“factory data collection software”, all of which are fairly distinct from each other. Focusing on
the sub-classes makes it much easier to pick out a handful of class-subclass combinations that
seem to map directly to the SOF category in question. For example, subclasses 245-264 (Robot
control) of class 700 (DATA PROCESSING: GENERIC CONTROL SYSTEMS OR SPECIFIC
APPLICATIONS) seem to map directly into SOF category MA_C. Similarly, subclasses 108-
115 (performance monitoring for product assembly or manufacturing) of class 700 seem closely
related to category MA_Q. Indeed, subclass 109 is called “quality control.”
We identify the class-subclass combinations in the US Patent Classification that map into
SOF sub-categories in the following way. First, we search the abstracts of our set of software
patents for the key words used to describe the sub-category in the CorpTech codebook. We
began by searching for the description of each SOF category in the patent abstracts. Since some
of the key words are more specific than others, this method will obviously work well for some
sub-categories (i.e.: “voice recognition software”) and less well for others (i.e.: “operating
systems”).
Using these patents as a base, we then searched for words that co-occur with the key
words. We calculate the frequency with which these words are observed in the patents containing
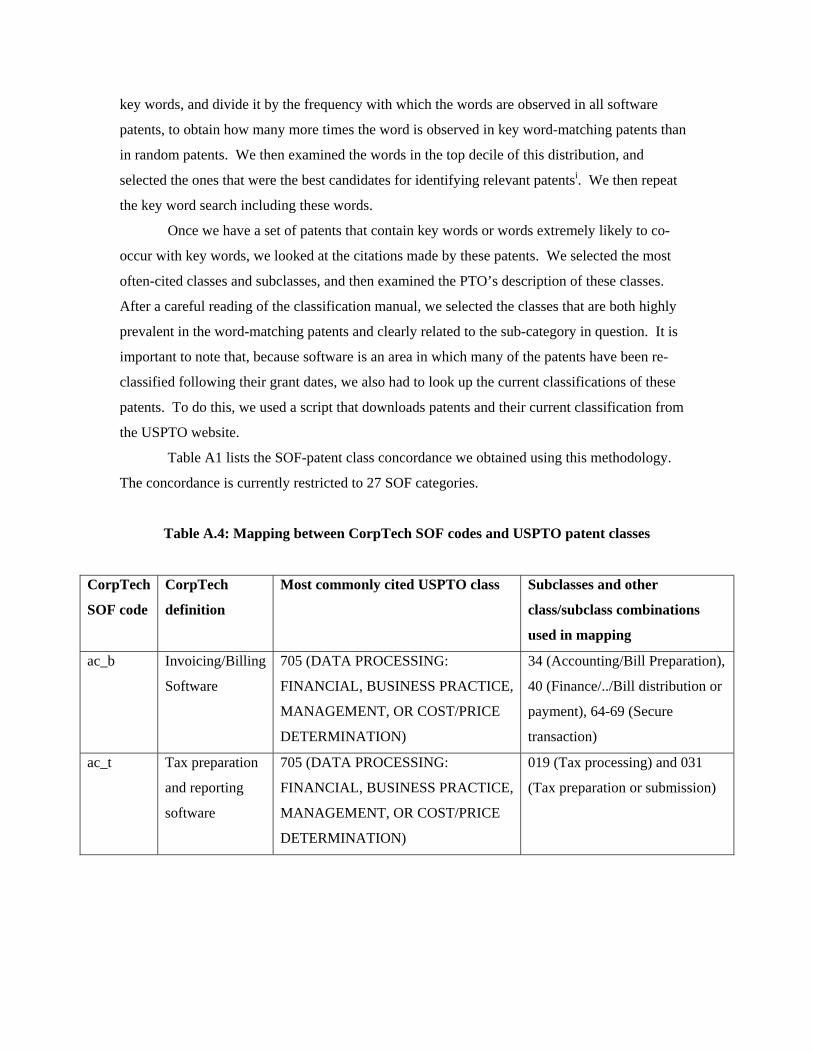
key words, and divide it by the frequency with which the words are observed in all software
patents, to obtain how many more times the word is observed in key word-matching patents than
in random patents. We then examined the words in the top decile of this distribution, and
selected the ones that were the best candidates for identifying relevant patentsi. We then repeat
the key word search including these words.
Once we have a set of patents that contain key words or words extremely likely to co-
occur with key words, we looked at the citations made by these patents. We selected the most
often-cited classes and subclasses, and then examined the PTO’s description of these classes.
After a careful reading of the classification manual, we selected the classes that are both highly
prevalent in the word-matching patents and clearly related to the sub-category in question. It is
important to note that, because software is an area in which many of the patents have been re-
classified following their grant dates, we also had to look up the current classifications of these
patents. To do this, we used a script that downloads patents and their current classification from
the USPTO website.
Table A1 lists the SOF-patent class concordance we obtained using this methodology.
The concordance is currently restricted to 27 SOF categories.
Table A.4: Mapping between CorpTech SOF codes and USPTO patent classes
CorpTech
SOF code
CorpTech
definition
Most commonly cited USPTO class Subclasses and other
class/subclass combinations
used in mapping
ac_b Invoicing/Billing
Software
705 (DATA PROCESSING:
FINANCIAL, BUSINESS PRACTICE,
MANAGEMENT, OR COST/PRICE
DETERMINATION)
34 (Accounting/Bill Preparation),
40 (Finance/../Bill distribution or
payment), 64-69 (Secure
transaction)
ac_t Tax preparation
and reporting
software
705 (DATA PROCESSING:
FINANCIAL, BUSINESS PRACTICE,
MANAGEMENT, OR COST/PRICE
DETERMINATION)
019 (Tax processing) and 031
(Tax preparation or submission)

ai_a Voice
technology
software
704 (DATA PROCESSING: SPEECH
SIGNAL PROCESSING,
LINGUISTICS, LANGUAGE
TRANSLATION, AND AUDIO
COMPRESSION/DECOMPRESSION)
All subclasses up to 278 are
represented.
ai_l Natural language
software
704 (DATA PROCESSING: SPEECH
SIGNAL PROCESSING,
LINGUISTICS, LANGUAGE
TRANSLATION, AND AUDIO
COMPRESSION/DECOMPRESSION)
subclasses 8 and 9 (Multilingual
or national language support;
Natural language) Also class 382
ai_n Neural network
software
706 (DATA PROCESSING:
ARTIFICIAL INTELLIGENCE)
15-45 (Neural Networks)
ba_a Automatic teller
machine
software
235 (REGISTERS) 378 -380 (Banking systems and
Credit or identification card
systems ); 705/41-43
(AUTOMATED ELECTRICAL
FINANCIAL OR BUSINESS
PRACTICE OR
MANAGEMENT
ARRANGEMENT); 700/231-
238 (article handling/dispensing
or vending)
cs_f Fax software 709 (ELECTRICAL COMPUTERS
AND DIGITAL PROCESSING
SYSTEMS: MULTICOMPUTER
DATA TRANSFERRING)
201-206 (DISTRIBUTED DATA
PROCESSING and
COMPUTER
CONFERENCING) and 217-219
(REMOTE DATA
ACCESSING)
cs_i Internet tools 709 (ELECTRICAL COMPUTERS
AND DIGITAL PROCESSING
SYSTEMS: MULTICOMPUTER
DATA TRANSFERRING)
all 2XX subclasses (deals with
computers talking to each other)
also 705, subclasses 026
(Electronic shopping (e.g.,
remote ordering) and

705/014(Distribution or
redemption of coupon, or
incentive or promotion program);
and 707/10 (Database or file
accessing, distributed or remote
access)
cs_l Local area
network (LAN)
software
709 (ELECTRICAL COMPUTERS
AND DIGITAL PROCESSING
SYSTEMS: MULTICOMPUTER
DATA TRANSFERRING)
all 2XX subclasses
cs_w Wide area
network (WAN)
software
709 (ELECTRICAL COMPUTERS
AND DIGITAL PROCESSING
SYSTEMS: MULTICOMPUTER
DATA TRANSFERRING)
all 2XX subclasses
dm_f File
management
software
707(DATA PROCESSING:
DATABASE AND FILE
MANAGEMENT OR DATA
STRUCTURES)
sub 1-10 (DATABASE OR FILE
ACCESSING) and 200-206
(FILE OR DATABASE
MAINTENANCE )
dm_mh Hierarchical
DBMS software
707(DATA PROCESSING:
DATABASE AND FILE
MANAGEMENT OR DATA
STRUCTURES)
sub 1-10 (DATABASE OR FILE
ACCESSING ) and 100-104.1
(DATABASE SCHEMA OR
DATA STRUCTURE )
dm_mr Relational
DBMS software
707(DATA PROCESSING:
DATABASE AND FILE
MANAGEMENT OR DATA
STRUCTURES)
sub 1-10 (DATABASE OR FILE
ACCESSING ) and 100-104.1
(DATABASE SCHEMA OR
DATA STRUCTURE )
dm_q Database query
language
software
707(DATA PROCESSING:
DATABASE AND FILE
MANAGEMENT OR DATA
STRUCTURES)
sub 1-10 (DATABASE OR FILE
ACCESSING ) esp 002-006
(Query processing (i.e.,
searching)) and 100-104.1
(DATABASE SCHEMA OR
DATA STRUCTURE )

ma_c Robotic software 700 (DATA PROCESSING:
GENERIC CONTROL SYSTEMS OR
SPECIFIC APPLICATIONS)
sub 245-264 (Robot control)
ma_q Quality control
software
700 (DATA PROCESSING:
GENERIC CONTROL SYSTEMS OR
SPECIFIC APPLICATIONS)
108-115
oa_gd Three
dimensional
representation
software
class 345 (COMPUTER GRAPHICS
PROCESSING AND SELECTIVE
VISUAL DISPLAY SYSTEMS)
418-427 (Three-dimension) and
700/98 ( 3-D product design
(e.g., solid modeling) ); 115-212
oa_me Electronic
message systems
software
709 (ELECTRICAL COMPUTERS
AND DIGITAL PROCESSING
SYSTEMS: MULTICOMPUTER
DATA TRANSFERRING)
sub 206 (computer
conferencing/Demand based
messaging)
oa_p Desktop
publishing
software
715 (DATA PROCESSING:
PRESENTATION PROCESSING OF
DOCUMENT, OPERATOR
INTERFACE PROCESSING, AND
SCREEN SAVER DISPLAY
PROCESSING)
500-542 (PRESENTATION
PROCESSING OF
DOCUMENT)
sv_ar Artificial
intelligence
R&D
706 (DATA PROCESSING:
ARTIFICIAL INTELLIGENCE)
15-62 (all subclasses)
ts_er Geographic
information
systems software
701 (DATA PROCESSING:
VEHICLES, NAVIGATION, AND
RELATIVE LOCATION)
2xxx (NAVIGATION); 702/005
(Topography (e.g., land
mapping))
ut_h Peripheral
device drivers
710 (ELECTRICAL COMPUTERS
AND DIGITAL DATA PROCESSING
SYSTEMS: INPUT/OUTPUT)
classes 1-74 (INPUT/OUTPUT
DATA PROCESSING) esp sub
008-019 (Peripheral
configuration/peripheral
monitoring)

ut_r Disaster
recovery
software
714 (ERROR
DETECTION/CORRECTION AND
FAULT DETECTION/RECOVERY)
sub 1-57 (DATA PROCESSING
SYSTEM ERROR OR FAULT
HANDLING) esp 006
(Redundant stored data accessed
(e.g., duplicated data, error
correction coded data, or other
parity-type data)), also class
707(DATA PROCESSING:
DATABASE AND FILE
MANAGEMENT OR DATA
STRUCTURES) 200-206(FILE
OR DATABASE
MAINTENANCE) esp sub 202
(Recoverability)
ut_x Security/auditing
software
726 (Information Security) all
subclasses
also 705/50-79 (DATA
PROCESSING: FINANCIAL,
BUSINESS PRACTICE,
MANAGEMENT, OR
COST/PRICE
DETERMINATION/BUSINESS
PROCESSING USING
CRYPTOGRAPHY)
ut_y Performance
measuring
software
714 (ERROR
DETECTION/CORRECTION AND
FAULT DETECTION/RECOVERY)
all subclasses
wd_i Inventory
management
software
705 (DATA PROCESSING:
FINANCIAL, BUSINESS PRACTICE,
MANAGEMENT, OR COST/PRICE
DETERMINATION)
esp sub 28 (Inventory
management) and 10 (Market
analysis, demand forecasting or
surveying)
wd_o Order
entry/processing
software
705 (DATA PROCESSING:
FINANCIAL, BUSINESS PRACTICE,
MANAGEMENT, OR COST/PRICE
DETERMINATION)
esp sub 1-45(AUTOMATED
ELECTRICAL FINANCIAL OR
BUSINESS PRACTICE OR
MANAGEMENT

ARRANGEMENT) including 26
(Electronic shopping (e.g.,
remote ordering))
How accurate and comprehensive is this concordance? Obviously, we need to balance
type I errors associated with a too-narrow definition of the relevant set of patents against type II
errors from a too-inclusive definition. We attempt to answer this question by determining what
share of patents held by firms specializing in a category are picked up by the patent classes
assigned to that category, and how many of the patents in those classes are assigned to specialist
firms in the CorpTech database that do not operate in the category in question. A preliminary
analysis of a selection of SOF codes well populated by specialist patents is found in Table A.5.ii

Table A.5: Validation of SOF-patent concordance for a selected set of SOF codes, using
specialist patents
Total specialist
patents
True
positives
Sensitivit
y
Positive
predictive
value
Billing/Invoicing software 9 4 0.444 0.571
Neural Network software 5 4 0.800 0.364
ATM software 14 10 0.786 1.000
Internet tools 62 17 0.274 0.218
WAN software 173 5 0.029 0.076
File maintenance software 26 4 0.154 0.053
Relational DMBS software 223 103 0.462 0.715
Quality Control software 7 0 0.000 0.000
Three-dimensional imaging software 45 5 0.111 0.417
Electronic message systems software 11 1 0.091 0.500
Geographical Information Systems software 25 9 0.360 0.474
Peripheral device drivers 117 41 0.350 0.410
Disaster recovery software 11 7 0.636 0.079
Security/auditing software 108 22 0.204 0.815
Performance measuring software 8 2 0.250 0.044
Sensitivity = share of specialist pats identified.
Positive predictive value = share of patents identified by mapping as belonging to that SOF that
actually belong to a specialist in that SOF.
Because surely not all patents held by specialists are for technologies related to the firm’s
main product, we have also read the patents held by specialists to estimate how many such
patents we should expect our concordance to (correctly) miss. We read the abstracts of all the
specialist patents in a handful of categories, chosen because they are both narrowly-defined and
populated by a significant number of specialist patents. These categories are invoicing/billing,

automatic teller machines, geographic information systems, three-dimensional representation, and
security/auditing. We found that a significant fraction of patents held by firms specializing in
these fields were not strictly speaking covering technologies in the field. Table A3 lists the share
of patents held by specialists in a SOF category that actually relate to technologies in that
category.
As an example, consider the patents held by firms specializing in automatic teller
machine software. A number of these patents are for software used to track and dispense medical
items (5,912,818, 5,971,593, and 5,993,046). Others are for digital cash systems like smart cards
(6,032,135). Others are simply not software patents (6,042,003: “lighting system for automated
banking machine”), despite the fact that they are classified in IPC G06F.
Table A.6: Specialist Patents
SOF Number of specialist
patents read
Share of specialist
patents in SOF
invoicing/billing 10 60%
automatic teller machines 13 46%
geographic information systems 45 85%
three-dimensional representation 20 20%
security/auditing 26 65%
As a result, we should not necessarily expect our SOF-patent mapping to pick up all
specialist patents, and the sensitivity of the mapping should be evaluated with this fact in mind.
These findings, based admittedly on a small sample of SOFs, might suggest a rule of thumb like
the following: if at least 50% of the patents held by specialists in a given area are picked up, the
mapping can be considered successful.
Selectivity
Nothing about the 27 SOF classes for which we have established a patent concordance
strikes us as being a source of serious selection bias. As noted in the main body of the paper,
firms active in these markets tend to have more patents than firms in the markets we omit, but we
feel this is an inevitable fact arising from the way the SOF categories are defined. Firms in
sampled markets have on average sales of $50 millioniii and an age of 14.89 years. Firms in other
markets have on average sales of $44 million, and an age of 14.53 years. The average entry rate
of markets in the sample is 0.21, and the average exit rate is 0.12. Markets excluded from the

sample have an average entry rate of 0.16 and an exit rate of 0.14 (the difference in exit rates is
statistically insignificant), The high entry rate of the sample comes from the fact that it includes
internet-related markets. When these are excluded, the average entry rate is 0.17, which is
insignificantly different from the rate in the excluded markets.
i This step is necessary to weed out idiosyncratic and misspelled words. ii We exclude patents held by firms that specialize in one SOF code, but that have a primary two-digit SIC code other than 73. We do this because these firms are not true specialists – they just appear as specialists in the Corptech dataset, which is restricted to software. These firms are likely to have patents in fields other than the software market in which they are active, and thus their patent portfolios are not a good indicator of state of the art in that particular software market. iii This calculation is based on a weighted average of the categorical revenue measures at the mid-point of the range. Because 23% of the observations in our CorpTech dataset have missing revenue data, this number may be inflated if the missing values tend to be firms with lower revenues.