m.1225 - guidelines for evaluation of radio transmission
TRANSCRIPT
Rec. ITU-R M.1225 1
RECOMMENDATION ITU-R M.1225
GUIDELINES FOR EVALUATION OF RADIO TRANSMISSIONTECHNOLOGIES FOR IMT-2000
(Question ITU-R 39/8)
(1997)Rec. ITU-R M.1225
CONTENTS
Page
1 Introduction .................................................................................................................................................... 2
2 Scope.............................................................................................................................................................. 2
3 Structure of the Recommendation.................................................................................................................. 3
4 Related documents ......................................................................................................................................... 3
5 Radio transmission technology considerations .............................................................................................. 4
5.1 Radio transmission technologies functional blocks .......................................................................... 6
5.1.1 Multiple access technology............................................................................................... 6
5.1.2 Modulation technology ..................................................................................................... 6
5.1.3 Channel coding and interleaving....................................................................................... 6
5.1.4 Duplexing technology....................................................................................................... 6
5.1.5 Physical channel structure and multiplexing..................................................................... 6
5.1.6 Frame structure ................................................................................................................. 7
5.1.7 RF channel parameters...................................................................................................... 7
5.2 Other functional blocks..................................................................................................................... 7
5.2.1 Source coder ..................................................................................................................... 7
5.2.2 Interworking...................................................................................................................... 7
6 Technical characteristics chosen for evaluation ............................................................................................. 7
6.1 Criteria for evaluation of radio transmission technologies ............................................................... 7
6.1.1 Spectrum efficiency .......................................................................................................... 8
6.1.2 Technology complexity – Effect on cost of installation and operation............................. 8
6.1.3 Quality .............................................................................................................................. 8
6.1.4 Flexibility of radio technologies ....................................................................................... 8
6.1.5 Implication on network interface ...................................................................................... 8
6.1.6 Handportable performance optimization capability.......................................................... 9
6.1.7 Coverage/power efficiency ............................................................................................... 9
7 Selected test environments for evaluation...................................................................................................... 9
8 Guidelines for evaluating the radio transmission technologies by independent evaluation groups ............... 9
9 Evaluation methodology ................................................................................................................................ 11
9.1 Objective criteria .............................................................................................................................. 12
9.2 Subjective criteria ............................................................................................................................. 12
9.3 Evaluation spreadsheet ..................................................................................................................... 12
9.4 Summary evaluations........................................................................................................................ 13
9.4.1 Methodology for summary criteria evaluations ................................................................ 13
2 Rec. ITU-R M.1225
Page
Annex 1 – Radio transmission technologies description template .......................................................................... 13
Annex 2 – Test environments and deployment models........................................................................................... 22
Appendix 1 to Annex 2 – Propagation models........................................................................................................ 44
Appendix 2 to Annex 2 – Computation of Doppler shift for satellites.................................................................... 48
Annex 3 – Detailed evaluation procedures.............................................................................................................. 50
1 Introduction
International Mobile Telecommunications-2000 (IMT-2000) are third generation mobile systems which are scheduled tostart service around the year 2000 subject to market considerations. They will provide access, by means of one or moreradio links, to a wide range of telecommunication services supported by the fixed telecommunication networks(e.g. PSTN/ISDN), and to other services which are specific to mobile users.
A range of mobile terminal types is encompassed, linking to terrestrial and/or satellite based networks, and the terminalsmay be designed for mobile or fixed use.
Key features of IMT-2000 are:
– high degree of commonality of design worldwide,
– compatibility of services within IMT-2000 and with the fixed networks,
– high quality,
– use of a small pocket terminal with worldwide roaming capability.
IMT-2000 will operate worldwide in bands identified by Radio Regulations provision No. S5.388 (1 885-2 025 and2 110-2 200 MHz, with the satellite component limited to 1 980-2 010 and 2 170-2 200 MHz). IMT-2000 are defined by aset of interdependent ITU Recommendations, of which this Recommendation is a member.
It is a design objective of IMT-2000 that the number of radio interfaces should be minimal and, if more than oneinterface is required, that there should be a high degree of commonality between them. These radio interfaces will servethe radio operating environments as nominated in Recommendation ITU-R M.1034. A number of sets of radiotransmission technologies (SRTTs) may meet the requirements for the radio interfaces. This Recommendation containsthe procedure and criteria that will be used to evaluate candidate radio transmission technologies (RTTs).
The subject matter of IMT-2000 is complex and its representation in the form of Recommendations is evolving. Tomaintain the pace of progress on the subject it is necessary to produce a sequence of Recommendations on a variety ofaspects. The recommendations strive to avoid apparent conflicts between themselves. Nevertheless, futureRecommendations, or revisions, will be used to resolve any discrepancies.
2 Scope
This Recommendation provides guidelines for both the procedure and the criteria to be used in evaluating RTTs for anumber of test environments. These test environments, defined herein, are chosen to simulate closely the more stringentradio operating environments. The evaluation procedure is designed in such a way that the impact of the candidate RTTson the overall performance and economics of IMT-2000 may be fairly and equally assessed on a technical basis. Itensures that the overall IMT-2000 objectives are met.
The Recommendation provides, for proponents and developers of RTTs, the common bases for the submission andevaluation of RTTs and system aspects impacting the radio performance.

Rec. ITU-R M.1225 3
This Recommendation allows a degree of freedom so as to encompass new technologies.
The actual selection of the RTTs for IMT-2000 is outside the scope of this Recommendation. It deals only with themethodology for the technical evaluations that should be performed. The results of the evaluation are to be documentedin an evaluation report and submitted to the ITU-R.
3 Structure of the Recommendation
Section 5 outlines the RTT considerations and identifies the transmission dependent part of the radio interfaceconsidered in the evaluation procedure. Section 6 defines the criteria for evaluating the RTTs and § 7 references the testsenvironments under which the candidate RTTs are evaluated. Section 8 outlines the overall procedure for evaluating theRTTs. Section 9 gives details on evaluation methodology.
The following Annexes form part of this Recommendation:
Annex 1: Radio transmission technologies description template
Annex 2: Test environments and deployment models
Annex 3: Detailed evaluation procedures
4 Related Documents
Recommendation ITU-R M.687 International Mobile Telecommunications-2000 (IMT-2000)
Recommendation ITU-R M.816 Framework for services supported on International MobileTelecommunications-2000 (IMT-2000)
Recommendation ITU-R M.818 Satellite operation within International MobileTelecommunications-2000 (IMT-2000)
Recommendation ITU-R M.819 International Mobile Telecommunications-2000 (IMT-2000) fordeveloping countries
Recommendation ITU-R M.1034 Requirements for the radio interface(s) for International MobileTelecommunications-2000 (IMT-2000)
Recommendation ITU-R M.1035 Framework for the radio interfaces and radio subsystemfunctionality for International Mobile Telecommunications-2000(IMT-2000)
Recommendation ITU-R M.1036 Spectrum considerations for implementation of InternationalMobile Telecommunications-2000 (IMT-2000) in the bands1 885-2 025 MHz and 2 110-2 200 MHz
Recommendation ITU-R M.1079 Speech and voiceband data performance requirements forInternational Mobile Telecommunications-2000 (IMT-2000)
Recommendation ITU-R M.1224. Vocabulary of terms for International Mobile Telecommunications-2000 (IMT-2000)
ITU-T Recommendation G.174 Transmission performance objectives for terrestrial digital wirelesssystems using portable terminals to access the PSTN
ITU-T Recommendation F.115 Service objectives and principles for Future Public Land MobileTelecommunication Systems (FPLMTS)
Recommendation ITU-R M.1167 Framework for the satellite component of International MobileTelecommunications-2000 (IMT-2000)
ITU-T Recommendation E.770 Land mobile and fixed network interconnection traffic grade ofservice concept
ITU-T Recommendation E.771 Network grade of service parameters and target values for circuit-switched public land mobile services
4 Rec. ITU-R M.1225
5 Radio transmission technology considerations
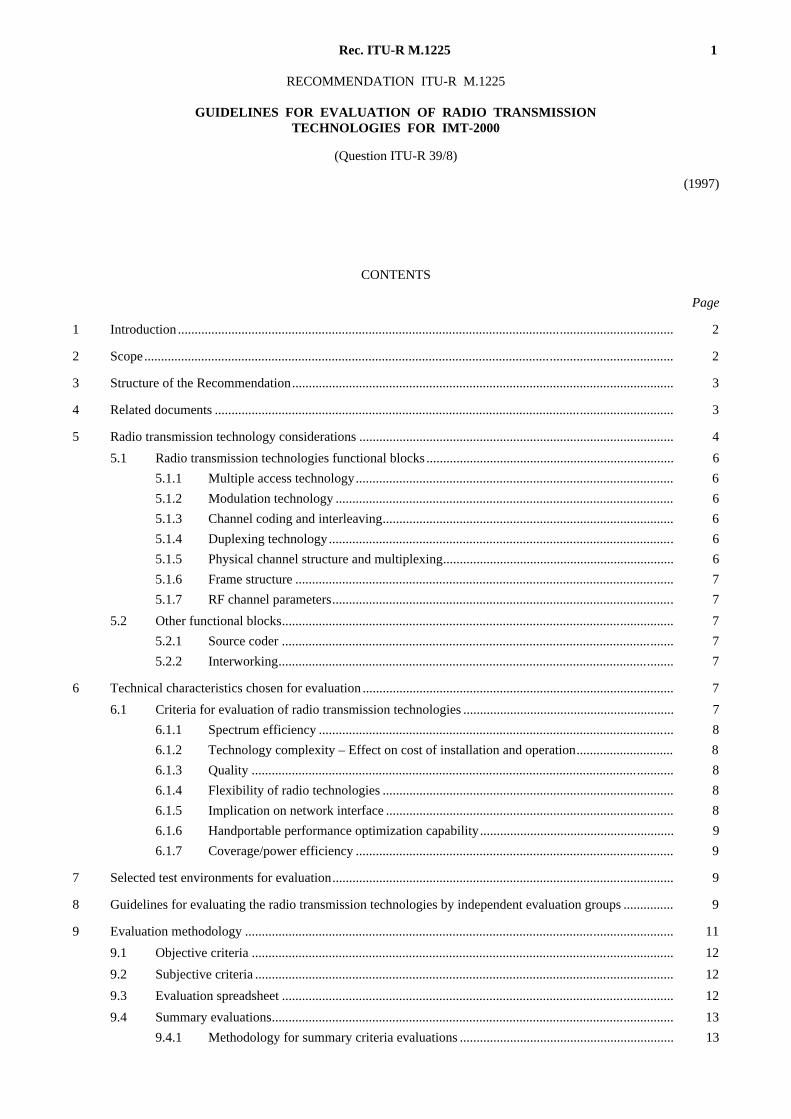
Within a telecommunication system (see Fig. 1), a RTT reflects the combination of technical choices and concepts thatallow for the provision of a radio subsystem. The evaluation process for candidate IMT-2000 RTTs will involvemaximizing the transmission independent aspects and minimizing the differences between the remaining transmissiondependent parts in the various IMT-2000 operating environments from an implementation perspective.
1225-01
FIGURE 1
Radio transmission technologies as part of a total telecommunication system
Radio transmission technology
Accesstechnology
Modulationtechnology
Channel codingand interleaving
RF-channelparameters
Duplexingtechnology
Frame structure
Physical channelstructure andmultiplexing
Market impact,measurable performance,
customers perception,environment impact
Environment, market
and regulations
Telecommunication system
TelecommunicationsManagement
Network
Radiotransmissiontechnology
Total qualitymanagement
Customer care
Networkinfrastructure
FIGURE 1225-01 = 16 CM

Rec. ITU-R M.1225 5
Figure 2 presents an example of a layered structure of radio interface.
1225-02
FIGURE 2
Example of a layered structure of radio interface
Transmission independent
Transmission dependent
Network layer containing:call control, mobility management,radio resource management
Link access control layer
Medium access control layer
Physical layer
Layer 3
Layer 2
Layer 1
FIGURE 1225-02 = 12 CM
As shown in Fig. 3, the transmission dependent part of the radio interface may be considered as a set of functionalblocks. It should be noted that all these functional blocks are not necessarily transmission dependent in their entirety.The functional blocks identified here are the following:
– multiple access technology,
– modulation technology,
– channel coding and interleaving,
– RF-channel parameters such as bandwidth, allocation and channel spacing,
– duplexing technology,
– frame structure,
– physical channel structure and multiplexing.
In the process of making design choices, the dependencies between the above functional blocks have to be considered.Some of the interdependencies are shown in Fig. 3 and are further described in § 5.1.

6 Rec. ITU-R M.1225
1225-03
FIGURE 3
Functional blocks and their interdependencies
Radio transmission technologies
Physical channeldefinition and multiplexing
Framestructure
Duplexingtechnology
RF-channelparameters
Multipleaccess
technology
Modulationtechnology
Source coder
Channel coding
Interworking
Synchronization requirements Spectrum efficiency requirements
FIGURE 1225-03 = 10 CM
5.1 Radio transmission technologies functional blocks
5.1.1 Multiple access technology
The choice of the multiple access technology has major impact on the design of the radio interface.
5.1.2 Modulation technology
The choice of the modulation technology depends mainly on radio environment and the spectrum efficiencyrequirements.
5.1.3 Channel coding and interleaving
The choice of channel coding depends on the propagation environment and spectrum efficiency and quality requirementsof the various services. Applications of large cells, especially in case of satellite component, usually require morepowerful channel coding, while microcellular systems, used in a pedestrian environment, may allow less complexchannel coding. For the choice of the channel coding with or without interleaving, it may be desirable to have multiplechoices; each optimized to the appropriate service environment.
5.1.4 Duplexing technology
The choice of the duplexing technology mainly affects the choices of the RF-channel bandwidth and the frame length.Duplexing technology may be independent of the access technology since for example either frequency divisionduplex (FDD) or time division duplex (TDD) may be used with either TDMA or CDMA systems.
5.1.5 Physical channel structure and multiplexing
The physical channel is a specified portion of one or more radio frequency channels as defined in frequency, time andcode domain.

Rec. ITU-R M.1225 7
5.1.6 Frame structure
The frame structure depends mainly on the multiple access technology (e.g. FDMA, TDMA, CDMA) and the duplexingtechnology (e.g. FDD, TDD). Commonality should be maximised by maintaining the same frame structure wheneverpossible. That is, data fields identifying physical and logical channels, as well as the frame length should be maintainedwhen possible.
5.1.7 RF channel parameters
RF channel parameters include parameters such as bandwidth, allocation and channel spacing.
5.2 Other functional blocks
5.2.1 Source coder
The choice of the source coder may generally be made independently of the access method.
5.2.2 Interworking
The interworking function (IWF) converts standard data services to the rates used internally by the radio transmissionsubsystem. The IWF feeds into the channel coder on the transmit side and is fed from the channel decoder on thereceiver side.
6 Technical characteristics chosen for evaluation
As a radio interface is only one part of a system, the choice of a specific RTT (see Fig. 1), for the provision of a radiointerface for IMT-2000, requires consideration of the broad technical characteristics so as to cover the most importantaspects that may impact the economics and performance of the system.
For practical reasons, a limited set of these technical characteristics has been chosen. It by no means implies that other(technical and non-technical) criteria are not relevant or significant. It is however believed that those essential systemaspects which are impacted by the RTTs are fairly covered with the selected technical characteristics.
Given the difficulties of predicting the future, in particular when dealing with technology, sufficient provision is alsomade for a fair technical evaluation for all possible technologies, particularly new technologies. This is accomplished bymaking sure that it is not only the technology itself which is evaluated but also its impact on the system performance andeconomics.
6.1 Criteria for evaluation of radio transmission technologies
Each of the technical characteristics defined hereafter will be used as evaluation criterion and is further defined in thespecific technical attributes in Annex 3. The RTTs description template is given in Annex 1.
Some of the criteria such as coverage or spectrum efficiency are measurable and may be numerically evaluated. Specifictest scenarios are given in Annex 2 so as to enable the proponents and evaluators to calculate and verify the requiredfigures on a common and fair basis.
Other criteria such as flexibility are of a more subjective nature and need to be assessed qualitatively. Advantages anddrawbacks of the proposed technologies are to be given and commented on by the proponents and evaluatorsconsidering the technical parameters that are judged relevant to the criterion. A list of technical parameters that will beconsidered for each evaluation criterion, is given in Annex 3.
6.1.1 Spectrum efficiency
Optimum use of the radio spectrum is of great importance to IMT-2000 radio interfaces. In general the moretelecommunications traffic that can be handled at a given quality, for a given frequency band, the more efficiently thespectrum is used. Evaluation of voice traffic capacity and information capacity should take into account frequency reuseand signalling overhead, among other parameters, as noted in Annex 2.
8 Rec. ITU-R M.1225
6.1.2 Technology complexity – Effect on cost of installation and operation
This criterion expresses the impact of a given RTT on complexity (and hence on cost) of implementation (equipment,infrastructure, installation, etc.) i.e., the less complex the better. In order to achieve the minimum cost and best reliabilityof equipment, the technologies selected should have a level of complexity consistent with the state of technology, thedesired service objectives and the radio environment. Some technologies have several possible methods ofimplementation which allow a compromise between complexity/cost and performance.
The installed and ongoing cost of IMT-2000 is influenced by both the transmission technology and the level of qualityand reliability. At a given quality level, it is impacted by the complexity of the radio hardware, the other necessarynetwork infrastructures, and the ongoing operational aspects of IMT-2000.
6.1.3 Quality
Most of the quality parameters which are dealt with in other Recommendations are minimum requirements which mustbe met and are not to be treated in the evaluation process. RTTs will be evaluated on the impact of transmissionprocessing delay on the end-to-end delay, expected average bit error ratio (BER) under the stated test conditions, ontheir maximum supportable bit rate under specified conditions and their overall ability to minimise circuit disruptionduring handover. In addition, they will be evaluated on their ability to sustain quality under certain extreme conditionssuch as system overload, hardware failures, interference, etc.
6.1.4 Flexibility of radio technologies
This criterion is of utmost importance for IMT-2000 operators. IMT-2000 systems will have to be flexible in terms ofdeployment, service provision, resource planning and spectrum sharing. Among the items that need to be considered are:
– ability to balance capacity versus RF signal quality as long as minimum performance requirements are met;
– adaptability of system(s) to different and/or time-varying propagation and traffic environments;
– ease of radio resource management;
– ability to accommodate fixed wireless access (FWA) architecture;
– ease of service provision including variable bit rate capability, packet data mode transmission and simultaneoustransmission of voice and non-voice services;
and for terrestrial considerations:
– ability to accommodate mixed-cell (pico, micro, macro, and mega) architecture;
– suitability for multiple operators in the same/overlapping service areas. RTTs will be compared based on theirability to:
– efficiently share a common spectrum allocation;
– share network infrastructures (for example in areas of low subscriber density);
– provide for handover between systems run by different operators.
6.1.5 Implication on network interface
It is desirable to minimise the impact of the radio subsystems on fixed network interfaces. The choice of RTTs mayaffect both the actual network interfaces required in IMT-2000 for multi-environment operation and the informationpassed over them. The need for synchronization between base stations (BSs) and between systems sharing commonlocation and spectrum may be different. The requirements placed on the networks by the handover procedure may bedifferent. Cross-environment operation, e.g. PSTN to wireless PBX call transfer, may require additional PSTNfunctionality. In particular, the number of signalling messages, the actual switching requirements, and the transmissioncapacity from BSs to switches may be different. RTTs should be evaluated based on the implications they impose onfixed network interfaces.

Rec. ITU-R M.1225 9
6.1.6 Handportable performance optimization capability
Handportable IMT-2000 terminals will be used in a broad range of user environments and applications which aredefined in Recommendation ITU-R M.1034 and other IMT-2000 Recommendations. As with previous generationwireless systems, the capability for handportable voice and personal data applications will impact the market acceptanceand success of IMT-2000.
The following should be considered when evaluating the RTTs for either individual or multiple operating IMT-2000environments:
– transmit power requirements,
– transmitter and receiver linearity requirements,
– size and weight as a function of application,
– intermittent reception capability,
– circuit clock rate,
– overall complexity.
6.1.7 Coverage/power efficiency
In terrestrial systems, the minimum number of BSs per square kilometre for a given frequency assignment to offer acertain amount of traffic with the required coverage is an important figure, at low traffic levels. At low loading, thesystem will be noise limited and the number of base stations constrained by the maximum range achievable by thetechnology.
At low loading, range and coverage efficiency are the major considerations, while at high loading, capacity and spectrumefficiency are more important.
Technologies providing the desired level of coverage with fewer base sites for a specific test environment are defined ashaving higher coverage efficiency.
The coverage efficiency as defined above is not applicable to satellite systems for this evaluation criterion.
In satellite systems the DC power available for conversion into usable RF power is limited and fixed for any givensatellite. It is important that this power is used efficiently and yields the maximum number of traffic channels of a givenquality. The power efficiency as defined here is not applicable to terrestrial systems.
7 Selected test environments for evaluation
The test environments for evaluation are discussed in Annex 2. The selected test operating environments are thefollowing:
– indoor office,
– outdoor to indoor and pedestrian,
– vehicular,
– mixed-cell pedestrian/vehicular,
– satellite.
8 Guidelines for evaluating the radio transmission technologies by independentevaluation groups
This section gives guidelines for evaluating candidate RTTs, or candidate SRTTs, for the IMT-2000 radio interface. Thisprocedure evaluates the candidate SRTTs as a whole as it is difficult to evaluate transmission technologies independentlyof each other.
This procedure deals only with evaluating radio transmission aspects. It is not intended for evaluating system aspects(including those for satellite system aspects). Nevertheless, some combinations of RTTs may have an impact on thenetwork side, and this is taken into consideration in the evaluation procedure (Step 4).
Figure 4 presents in a schematic way the different steps involved in the evaluation procedure.
The results will then be submitted to the ITU-R in the form of an evaluation report.

10 Rec. ITU-R M.1225
1225-04
FIGURE 4
Section 6
Evaluation criteria
Annex 3
Detailed evaluation procedures
Section 9
Evaluation methodology
Annex 2
Test environments anddeployment models
Rec. ITU-R M.1035
Step 1
Submission of candidate set ofradio transmission technologies
Step 2
Comparison with requirementsand objectives
Step 3
Preliminary verification oftechnologies
Step 4
Evaluation of set of radiotransmission technologies for one
or more test environments
Step 5
Modification
Step 6
Synthesis and grouping
Step 7
Evaluation report
Annex 1
Radio transmission technologiesdescription template
Annex 2
Test environments anddeployment models
Recs. ITU-R M.687, ITU-R M.816, ITU-R M.819, ITU-R M.1079
and ITU-T Rec. G.174
Intellectual property rightspolicy of ITU
FIGURE 1225-04 = 19 CM
Evaluation guidelines
The evaluation procedure is based on the following steps.
Step 1 – Submission of candidate radio transmission technologies
Candidate RTTs are submitted with a technical description which should be formatted according to the template inAnnex 1 to facilitate their comparison. In order to evaluate performance aspects of proposed RTTs, such as trafficcapacity and others, it is necessary to assume appropriate conditions that include propagation models, traffic conditionsand objective performances. Annex 2 provides the test environments and deployment models which should be assumedby all proponents.

Rec. ITU-R M.1225 11
Proposed RTTs should also be capable of meeting IMT-2000 objectives and requirements as defined in existingIMT-2000 Recommendations (see § 4). Also the intellectual property right (IPR) category should be stated as noted inAnnex 1.
The level of detail in the Annex 1 template is sufficient to allow an accurate evaluation of the overall performance of theproposed RTT. In the case of new proposed technologies, it may need further refinements and more information may beadded or requested.
It is also recognized that the Annex 1 template is only a list of radio related technical parameters. Other aspects, whichwould be essential for the choice of a commercial system, may not be taken into account.
Step 2 – Comparison with requirements and objectives
Candidate RTTs are compared against the technical requirements and objectives given in IMT-2000 Recommendations.
Step 3 – Preliminary verification of technology
Proponents may be asked to submit additional information, including perhaps results of software or simulation tests, orhardware tests, to verify key elements of their candidate technologies.
Step 4 – Evaluation of RTTs
Candidate RTTs are evaluated through use of analysis and simulation by comparing them against the set of criteriadefined in § 6 for test environments given in Annex 2. Each RTT is then evaluated according to the procedure given inAnnex 3.
Step 5 – Modification
The candidate RTTs may be modified by their proponents through additional iteration of the evaluation procedurereturning back to Step 1.
Step 6 – Synthesis and grouping
Based on the results of Steps 4 and 5, proponents are requested to form an “optimum” group of RTTs for serving allIMT-2000 test environments. The grouping process should also take into account high commonality of the RTTs withinthe group to serve all environments. Recommendation ITU-R M.1035 provides guidelines to be considered in this step toobtain high commonality in the group of RTTs.
Step 7 – Evaluation report
An evaluation report should be prepared for consideration by the ITU-R and should include:
– technologies description as per Annex 1,
– evaluation based on the application of Annexes 2 and 3,
– applicable information.
9 Evaluation methodology
After the candidate RTT has been compared against the technical requirements and objectives and a preliminaryverification of the technology has been made (Steps 2 and 3 in § 8), a technical evaluation of the candidate RTT is madeagainst each evaluation criterion given in § 6.1. This evaluation will be made in the appropriate test environments usingthe deployment models described in Annex 2. Candidate RTTs will be evaluated based on technical descriptions that aresubmitted using the technologies description template contained in Annex 1. The detailed evaluation procedures aregiven in Annex 3, which lists technical attributes that should be considered for the evaluation of RTTs against each ofthe evaluation criteria.
The evaluation criteria can be sub-divided into objective and subjective criteria. Objective criteria contain technicalattributes that can be assessed on a quantitative basis; subjective criteria contain a mixture of technical attributes that canbe assessed on a quantitative basis and technical attributes that can be assessed on a qualitative basis.

12 Rec. ITU-R M.1225
9.1 Objective criteria
For these criteria, the evaluation is made based on the quantitative information submitted for each technical attribute.The independent evaluation groups may comment on the results and request further information or new calculations tofurther validate the given figures (e.g. by requesting simulation results when only theoretical analyses have beenperformed). The proponent is allowed to reply to these comments within a given deadline. Final conclusions orcomments are then issued by the evaluators, and a summary evaluation for the criteria, as described in § 9.4, is thengiven taking into account all the results.
9.2 Subjective criteria
For these criteria, a numerical evaluation is difficult as the information submitted for a technical attribute may bequalitative instead of quantitative. However, a technical-based evaluation is still feasible and beneficial if a summarycriteria evaluation approach is taken so as to understand the relative merits and drawbacks of each candidate RTT. Indoing so, the most important technical information for decision-makers is then given as a result of this technicalevaluation process. As with objective criteria, the evaluators may comment on the results and request additionalinformation to further validate the RTT submission. The proponent is allowed to reply to these comments within a givendeadline. Final conclusions or comments are then issued by the evaluators, and a summary evaluation for the criteria, asdescribed in § 9.4, is then given taking into account all the results.
9.3 Evaluation spreadsheet
The following spreadsheet should be used as a guideline for the submission of the evaluation information to the ITU-R.It includes an example for information.
SPREADSHEET FOR RTT A CRITERION 1
Objective criteria Subjective criteria
– Spectrum efficiency
– Coverage/power efficiency
– Technology complexity - Effect on cost of installation and operation
– Quality
– Flexibility of radio technologies
– Implication on network interfaces
– Handportable performance optimization capability
Criterione.g. flexibility
Proponent comments Evaluator comments
1st technical attribute
E.g. variable user bit rate capabilities
E.g. how well the RTT performs withrespect to this attribute; how relevant thistechnical attribute is for the proposed RTT
E.g. request for clarification, disagreement,etc.; indication of relative importance ofthis attribute to others within this criterion
2nd technical attribute This is not relevant as our technology doesnot use that particular feature, ...
3rd technical attribute
E.g. maximum tolerable Dopplershift
Required figures xxx
Comments (e.g. it has been obtained usingthe following assumptions)
E.g., comments on the validity of theresults; request for further hardwareverification
…
Comment sections General comments from the proponents
(e.g. new relevant technical parameters totake into account, etc.)
General comments from the evaluators
(e.g. request for clarification, missingpoints, etc.)
2nd step comments Reply to the evaluator’s comments Summary criterion evaluation, includinginformation about how the summaryevaluation was achieved and the relativeimportance placed on the technicalattributes and other considerations

Rec. ITU-R M.1225 13
9.4 Summary evaluations
In order to compare multiple RTTs, it is useful to have criteria evaluation summaries for each RTT. A criterionevaluation summary may be difficult to make when both qualitative and quantitative attributes must be considered, andwhen each technical attribute may have different relative importance with the overall evaluation criteria.
To facilitate such a criterion evaluation summary, Annex 3 identifies the importance or relative ranking of the varioustechnical attributes within each of the evaluation criteria. These rankings are based upon current anticipated marketneeds within some countries. It is recognized that market needs may differ in various countries and may change overtime. It is also recognized that some new technical attributes or important considerations may be identified during theevaluation procedure that would impact on any summary. As such, Annex 3 provides that evaluation groups may, ifappropriate, modify the group of technical attributes, or add new attributes or considerations, in determining a criterionevaluation summary.
All evaluation groups are requested to include in the evaluation reports, information on the criterion evaluationsummaries including the relative importance which was placed on each technical attribute and any other considerationthat affected the summaries.
9.4.1 Methodology for criteria evaluation summaries
Some evaluation groups may wish to use a methodology to determine the criterion evaluation summaries. This sectioncontains one example of a possible numerical methodology; however, other numerical or non-numerical methodologiesmay be used for criterion evaluation summaries provided adequate documentation is provided in the evaluation report asto how they were done.
The technical attributes given in Annex 3 are grouped relative to their overall impact on a specific evaluation criterion.Each group can be assigned a relative weight based upon their perceived importance or impact for each criterion. Thisallows the inclusion of both qualitative and quantitatively defined attributes to be simultaneously and objectivelyevaluated when comparing proposed RTTs.
RTT performance comparisons are done attribute by attribute for a given evaluation criterion. Relative attributeperformance for different RTTs are quantified into four performance bins: poor, fair, good, and excellent. Attributeperformance not supporting IMT-2000 objectives is graded poor and exceeding objectives as excellent.
Considering the relative attribute characterization noted above, a differential grade is determined based upon howattribute performances compare. After completion of the attribute performance comparisons, the attribute gradingdifferentials are multiplied by the agreed upon weightings and aggregated to determine an overall RTT performancedifferential grade for that criterion.
ANNEX 1
Radio transmission technologies description template
Description of the radio transmission technology
The RTT has to be described in a detailed form to get an overview and an understanding of the functionalities of thetechnical approach. This Annex provides a template to aid in the technical description of the characteristics of acandidate RTT.
The following technical parameters, the relevant templates given in Annex 2 and any additionally useful information,should be provided for each test environment for which the candidate RTT is proposed to operate. This can be done bypreparing:
– a separate template submission for each test environment; or
– a single submission that includes multiple answers for those technical parameters impacted by a test environment.
14 Rec. ITU-R M.1225
In addition to the detailed technical description described below, proponents should assure that their submission meets theoverall IMT-2000 objectives as defined in existing Recommendations (see § 4). Submittors should also state if the currentITU policy for IPR is met for their RTT proposals.
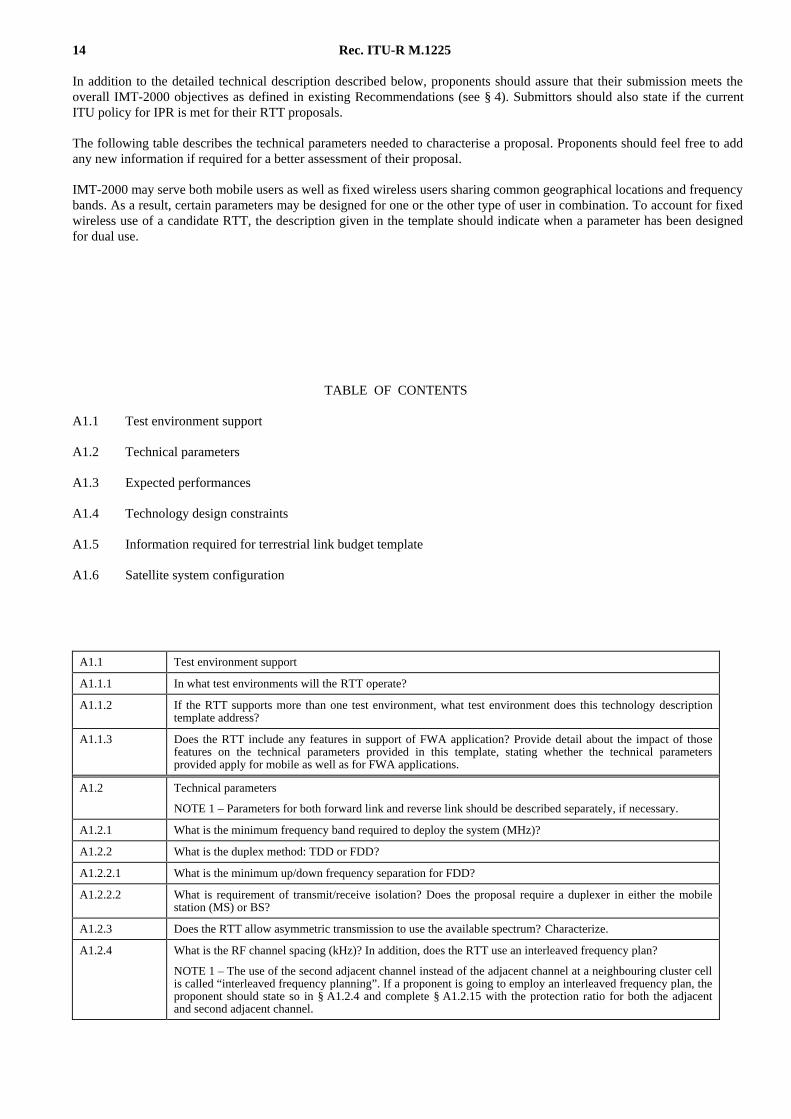
The following table describes the technical parameters needed to characterise a proposal. Proponents should feel free to addany new information if required for a better assessment of their proposal.
IMT-2000 may serve both mobile users as well as fixed wireless users sharing common geographical locations and frequencybands. As a result, certain parameters may be designed for one or the other type of user in combination. To account for fixedwireless use of a candidate RTT, the description given in the template should indicate when a parameter has been designedfor dual use.
TABLE OF CONTENTS
A1.1 Test environment support
A1.2 Technical parameters
A1.3 Expected performances
A1.4 Technology design constraints
A1.5 Information required for terrestrial link budget template
A1.6 Satellite system configuration
A1.1 Test environment support
A1.1.1 In what test environments will the RTT operate?
A1.1.2 If the RTT supports more than one test environment, what test environment does this technology descriptiontemplate address?
A1.1.3 Does the RTT include any features in support of FWA application? Provide detail about the impact of thosefeatures on the technical parameters provided in this template, stating whether the technical parametersprovided apply for mobile as well as for FWA applications.
A1.2 Technical parameters
NOTE 1 – Parameters for both forward link and reverse link should be described separately, if necessary.
A1.2.1 What is the minimum frequency band required to deploy the system (MHz)?
A1.2.2 What is the duplex method: TDD or FDD?
A1.2.2.1 What is the minimum up/down frequency separation for FDD?
A1.2.2.2 What is requirement of transmit/receive isolation? Does the proposal require a duplexer in either the mobilestation (MS) or BS?
A1.2.3 Does the RTT allow asymmetric transmission to use the available spectrum? Characterize.
A1.2.4 What is the RF channel spacing (kHz)? In addition, does the RTT use an interleaved frequency plan?
NOTE 1 – The use of the second adjacent channel instead of the adjacent channel at a neighbouring cluster cellis called “interleaved frequency planning”. If a proponent is going to employ an interleaved frequency plan, theproponent should state so in § A1.2.4 and complete § A1.2.15 with the protection ratio for both the adjacentand second adjacent channel.
Rec. ITU-R M.1225 15
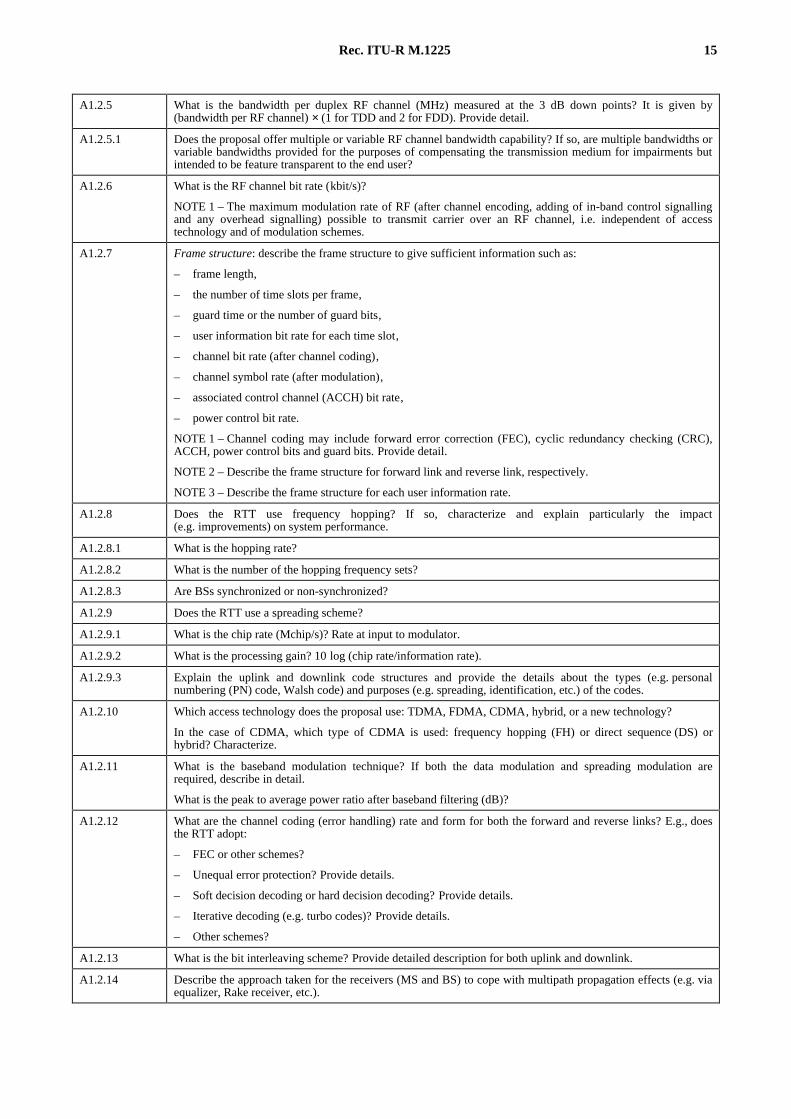
A1.2.5 What is the bandwidth per duplex RF channel (MHz) measured at the 3 dB down points? It is given by(bandwidth per RF channel) × (1 for TDD and 2 for FDD). Provide detail.
A1.2.5.1 Does the proposal offer multiple or variable RF channel bandwidth capability? If so, are multiple bandwidths orvariable bandwidths provided for the purposes of compensating the transmission medium for impairments butintended to be feature transparent to the end user?
A1.2.6 What is the RF channel bit rate (kbit/s)?
NOTE 1 – The maximum modulation rate of RF (after channel encoding, adding of in-band control signallingand any overhead signalling) possible to transmit carrier over an RF channel, i.e. independent of accesstechnology and of modulation schemes.
A1.2.7 Frame structure: describe the frame structure to give sufficient information such as:
– frame length,
– the number of time slots per frame,
– guard time or the number of guard bits,
– user information bit rate for each time slot,
– channel bit rate (after channel coding),
– channel symbol rate (after modulation),
– associated control channel (ACCH) bit rate,
– power control bit rate.
NOTE 1 – Channel coding may include forward error correction (FEC), cyclic redundancy checking (CRC),ACCH, power control bits and guard bits. Provide detail.
NOTE 2 – Describe the frame structure for forward link and reverse link, respectively.
NOTE 3 – Describe the frame structure for each user information rate.
A1.2.8 Does the RTT use frequency hopping? If so, characterize and explain particularly the impact(e.g. improvements) on system performance.
A1.2.8.1 What is the hopping rate?
A1.2.8.2 What is the number of the hopping frequency sets?
A1.2.8.3 Are BSs synchronized or non-synchronized?
A1.2.9 Does the RTT use a spreading scheme?
A1.2.9.1 What is the chip rate (Mchip/s)? Rate at input to modulator.
A1.2.9.2 What is the processing gain? 10 log (chip rate/information rate).
A1.2.9.3 Explain the uplink and downlink code structures and provide the details about the types (e.g. personalnumbering (PN) code, Walsh code) and purposes (e.g. spreading, identification, etc.) of the codes.
A1.2.10 Which access technology does the proposal use: TDMA, FDMA, CDMA, hybrid, or a new technology?
In the case of CDMA, which type of CDMA is used: frequency hopping (FH) or direct sequence (DS) orhybrid? Characterize.
A1.2.11 What is the baseband modulation technique? If both the data modulation and spreading modulation arerequired, describe in detail.
What is the peak to average power ratio after baseband filtering (dB)?
A1.2.12 What are the channel coding (error handling) rate and form for both the forward and reverse links? E.g., doesthe RTT adopt:
– FEC or other schemes?
– Unequal error protection? Provide details.
– Soft decision decoding or hard decision decoding? Provide details.
– Iterative decoding (e.g. turbo codes)? Provide details.
– Other schemes?
A1.2.13 What is the bit interleaving scheme? Provide detailed description for both uplink and downlink.
A1.2.14 Describe the approach taken for the receivers (MS and BS) to cope with multipath propagation effects (e.g. viaequalizer, Rake receiver, etc.).

16 Rec. ITU-R M.1225
A1.2.14.1 Describe the robustness to intersymbol interference and the specific delay spread profiles that are best or worstfor the proposal.
A1.2.14.2 Can rapidly changing delay spread profile be accommodated? Describe.
A1.2.15 What is the adjacent channel protection ratio?
NOTE 1 – In order to maintain robustness to adjacent channel interference, the RTT should have some receivercharacteristics that can withstand higher power adjacent channel interference. Specify the maximum allowedrelative level of adjacent RF channel power (dBc). Provide detail how this figure is assumed.
A1.2.16 Power classes
A1.2.16.1 Mobile terminal emitted power : what is the radiated antenna power measured at the antenna? For terrestrialcomponent, give (dBm). For satellite component, the mobile terminal emitted power should be given in e.i.r.p.(effective isotropic radiated power) (dBm).
A1.2.16.1.1 What is the maximum peak power transmitted while in active or busy state?
A1.2.16.1.2 What is the time average power transmitted while in active or busy state? Provide detailed explanation used tocalculate this time average power.
A1.2.16.2 Base station transmit power per RF carrier for terrestrial component
A1.2.16.2.1 What is the maximum peak transmitted power per RF carrier radiated from antenna?
A1.2.16.2.2 What is the average transmitted power per RF carrier radiated from antenna?
A1.2.17 What is the maximum number of voice channels available per RF channel that can be supported at one BS with1 RF channel (TDD systems) or 1 duplex RF channel pair (FDD systems), while still meetingITU-T Recommendation G.726 performance requirements?
A1.2.18 Variable bit rate capabilities : describe the ways the proposal is able to handle variable baseband transmissionrates. For example, does the RTT use:
– adaptive source and channel coding as a function of RF signal quality?
– Variable data rate as a function of user application?
– Variable voice/data channel utilization as a function of traffic mix requirements?
Characterize how the bit rate modification is performed. In addition, what are the advantages of your systemproposal associated with variable bit rate capabilities?
A1.2.18.1 What are the user information bit rates in each variable bit rate mode?
A1.2.19 What kind of voice coding scheme or codec is assumed to be used in proposed RTT? If the existing specificvoice coding scheme or codec is to be used, give the name of it. If a special voice coding scheme or codec(e.g. those not standardized in standardization bodies such as ITU) is indispensable for the proposed RTT,provide detail, e.g. scheme, algorithm, coding rates, coding delays and the number of stochastic code books.
A1.2.19.1 Does the proposal offer multiple voice coding rate capability? Provide detail.
A1.2.20 Data services : are there particular aspects of the proposed technologies which are applicable for the provisionof circuit-switched, packet-switched or other data services like asymmetric data services? For each serviceclass (A, B, C and D) a description of RTT services should be provided, at least in terms of bit rate, delay andBER/frame error rate (FER).
NOTE 1 – See Recommendation ITU-R M.1224 for the definition of:– “circuit transfer mode”,– “packet transfer mode”,– “connectionless service”,and for the aid of understanding “circuit switched” and “packet switched” data services.
NOTE 2 – See ITU-T Recommendation I.362 for details about the service classes A, B, C and D.
A1.2.20.1 For delay constrained, connection oriented (Class A).
A1.2.20.2 For delay constrained, connection oriented, variable bit rate (Class B).
A1.2.20.3 For delay unconstrained, connection oriented (Class C).
A1.2.20.4 For delay unconstrained, connectionless (Class D).

Rec. ITU-R M.1225 17
A1.2.21 Simultaneous voice/data services: is the proposal capable of providing multiple user services simultaneouslywith appropriate channel capacity assignment?NOTE 1 – The following describes the different techniques that are inherent or improve to a great extent thetechnology described above to be presented.Description for both BS and MS are required in attributes from § A1.2.22 through § A1.2.23.2.
A1.2.22 Power control characteristics : is a power control scheme included in the proposal? Characterize the impact(e.g. improvements) of supported power control schemes on system performance.
A1.2.22.1 What is the power control step size (dB)?
A1.2.22.2 What are the number of power control cycles per second?
A1.2.22.3 What is the power control dynamic range (dB)?
A1.2.22.4 What is the minimum transmit power level with power control?
A1.2.22.5 What is the residual power variation after power control when RTT is operating? Provide details about thecircumstances (e.g. in terms of system characteristics, environment, deployment, MS-speed, etc.) under whichthis residual power variation appears and which impact it has on the system performance.
A1.2.23 Diversity combining in MS and BS : are diversity combining schemes incorporated in the design of the RTT?
A1.2.23.1 Describe the diversity techniques applied in the MS and at the BS, including micro diversity and macrodiversity, characterizing the type of diversity used, for example:
– time diversity: repetition, Rake-receiver, etc.,
– space diversity: multiple sectors, multiple satellite, etc.,
– frequency diversity: FH, wideband transmission, etc.,
– code diversity: multiple PN codes, multiple FH code, etc.,
– other scheme.
Characterize the diversity combining algorithm, for example, switch diversity, maximal ratio combining, equalgain combining. Additionally, provide supporting values for the number of receivers (or demodulators) per cellper mobile user. State the dB of performance improvement introduced by the use of diversity.
For the MS: what is the minimum number of RF receivers (or demodulators) per mobile unit and what is theminimum number of antennas per mobile unit required for the purpose of diversity reception?
These numbers should be consistent to that assumed in the link budget template of Annex 2 and that assumed inthe calculation of the “capacity” defined at § A1.3.1.5.
A1.2.23.2 What is the degree of improvement expected (dB)? Also indicate the assumed conditions such as BERand FER.
A1.2.24 Handover/automatic radio link transfer (ALT) : do the radio transmission technologies support handover?
Characterize the type of handover strategy (or strategies) which may be supported, e.g. MS assisted handover.Give explanations on potential advantages, e.g. possible choice of handover algorithms. Provide evidencewhenever possible.
A1.2.24.1 What is the break duration (s) when a handover is executed? In this evaluation, a detailed description of theimpact of the handover on the service performance should also be given. Explain how the estimate was derived.
A1.2.24.2 For the proposed RTT, can handover cope with rapid decrease in signal strength (e.g. street corner effect)?
Give a detailed description of:
– the way the handover detected, initiated and executed,
– how long each of this action lasts (minimum/maximum time (ms)),
– the time-out periods for these actions.
A1.2.25 Characterize how the proposed RTT reacts to the system deployment (e.g. necessity to add new cells and/ornew carriers) particularly in terms of frequency planning.
A1.2.26 Sharing frequency band capabilities : to what degree is the proposal able to deal with spectrum sharing amongIMT-2000 systems as well as with all other systems:– spectrum sharing between operators,
– spectrum sharing between terrestrial and satellite IMT-2000 systems,– spectrum sharing between IMT-2000 and non-IMT-2000 systems,– other sharing schemes.
A1.2.27 Dynamic channel allocation : characterize the dynamic channel allocation (DCA) schemes which may besupported and characterize their impact on system performance (e.g. in terms of adaptability to varyinginterference conditions, adaptability to varying traffic conditions, capability to avoid frequency planning,impact on the reuse distance, etc.).

18 Rec. ITU-R M.1225
A1.2.28 Mixed cell architecture : how well does the RTT accommodate mixed cell architectures (pico, micro andmacrocells)? Does the proposal provide pico, micro and macro cell user service in a single licensed spectrumassignment, with handoff as required between them? (terrestrial component only) .NOTE 1 – Cell definitions are as follows:– pico – cell hex radius: r < 100 m– micro: 100 m < r < 1 000 m– macro: r > 1 000 m.
A1.2.29 Describe any battery saver/intermittent reception capability .
A1.2.29.1 Ability of the MS to conserve standby battery power : provide details about how the proposal conserves standbybattery power.
A1.2.30 Signalling transmission scheme : if the proposed system will use RTTs for signalling transmission differentfrom those for user data transmission, describe the details of the signalling transmission scheme over the radiointerface between terminals and base (satellite) stations.
A1.2.30.1 Describe the different signalling transfer schemes which may be supported, e.g. in connection with a call,outside a call. Does the RTT support:– new techniques? Characterize.– Signalling enhancements for the delivery of multimedia services? Characterize.
A1.2.31 Does the RTT support a bandwidth on demand (BOD) capability? BOD refers specifically to the ability of anend-user to request multi-bearer services. Typically, this is given as the capacity in the form of bits per secondof throughput. Multi-bearer services can be implemented by using such technologies as multi-carrier,multi-time slot or multi-codes. If so, characterize these capabilities.NOTE 1 – BOD does not refer to the self-adaptive feature of the radio channel to cope with changes in thetransmission quality (see § A1.2.5.1).
A1.2.32 Does the RTT support channel aggregation capability to achieve higher user bit rates?
A1.3 Expected performances.
A1.3.1 For terrestrial test environment only.
A1.3.1.1 What is the achievable BER floor level (for voice)?NOTE 1 – The BER floor level is evaluated under the BER measuring conditions defined in Annex 2 using thedata rates indicated in § 1 of Annex 2.
A1.3.1.2 What is the achievable BER floor level (for data)?NOTE 1 – The BER floor level is evaluated under the measuring conditions defined in Annex 2 using the datarates indicated in § 1 of Annex 2.
A1.3.1.3 What is the maximum tolerable delay spread (ns) to maintain the voice and data service quality requirements?NOTE 1 – The BER is an error floor level measured with the Doppler shift given in the BER measuringconditions of Annex 2.
A1.3.1.4 What is the maximum tolerable Doppler shift (Hz) to maintain the voice and data service quality requirements?NOTE 1 – The BER is an error floor level measured with the delay spread given in the BER measuringconditions of Annex 2.
A1.3.1.5 Capacity : the capacity of the radio transmission technology has to be evaluated assuming the deploymentmodels described in Annex 2 and technical parameters from § A1.2.22 through § A1.2.23.2.
A1.3.1.5.1 What is the voice traffic capacity per cell (not per sector): provide the total traffic that can be supported by asingle cell (E/MHz/cell) in a total available assigned non-contiguous bandwidth of 30 MHz (15 MHzforward/15 MHz reverse) for FDD mode or contiguous bandwidth of 30 MHz for TDD mode. Providecapacities for all penetration values defined in the deployment model for the test environment in Annex 2. Theprocedure to obtain this value is described in Annex 2. The capacity supported by not a standalone cell but asingle cell within contiguous service area should be obtained here.
A1.3.1.5.2 What is the information capacity per cell (not per sector): provide the total number of user-channel informationbits which can be supported by a single cell (Mbit/s/MHz/cell) in a total available assigned non-contiguousbandwidth of 30 MHz (15 MHz forward/15 MHz reverse) for FDD mode or contiguous bandwidth of 30 MHzfor TDD mode. Provide capacities for all penetration values defined in the deployment model for the testenvironment in Annex 2. The procedure to obtain this value is described in Annex 2. The capacity supported bynot a standalone cell but a single cell within contiguous service area should be obtained here.

Rec. ITU-R M.1225 19
A1.3.1.6 Does the RTT support sectorization? If yes, provide for each sectorization scheme and the total number ofuser-channel information bits which can be supported by a single site (Mbit/s/MHz) (and the number of sectors)in a total available assigned non-contiguous bandwidth of 30 MHz (15 MHz forward/15 MHz reverse) in FDDmode or contiguous bandwidth of 30 MHz in TDD mode.
A1.3.1.7 Coverage efficiency : the coverage efficiency of the radio transmission technology has to be evaluated assumingthe deployment models described in Annex 2.
A1.3.1.7.1 What is the base site coverage efficiency (km2/site) for the lowest traffic loading in the voice only deploymentmodel? Lowest traffic loading means the lowest penetration case described in Annex 2.
A1.3.1.7.2 What is the base site coverage efficiency (km2/site) for the lowest traffic loading in the data only deploymentmodel? Lowest traffic loading means the lowest penetration case described in Annex 2.
A1.3.2 For satellite test environment only
A1.3.2.1 What is the required C/N0 to achieve objective performance defined in Annex 2?
A1.3.2.2 What are the Doppler compensation method and residual Doppler shift after compensation?
A1.3.2.3 Capacity : the spectrum efficiency of the radio transmission technology has to be evaluated assuming thedeployment models described in Annex 2.
A1.3.2.3.1 What is the voice information capacity per required RF bandwidth (bit /s/Hz)?
A1.3.2.3.2 What is the voice plus data information capacity per required RF bandwidth (bit /s/Hz)?
A1.3.2.4 Normalized power efficiency : the power efficiency of the radio transmission technology has to be evaluatedassuming the deployment models described in Annex 2.
A1.3.2.4.1 What is the supported information bit rate per required carrier power-to-noise density ratio for the givenchannel performance under the given interference conditions for voice?
A1.3.2.4.2 What is the supported information bit rate per required carrier power-to-noise density ratio for the givenchannel performance under the given interference conditions for voice plus data?
A1.3.3 Maximum user bit rate (for data) : specify the maximum user bit rate (kbit/s) available in the deploymentmodels described in Annex 2.
A1.3.4 What is the maximum range (m) between a user terminal and a BS (prior to hand-off, relay, etc.) under nominaltraffic loading and link impairments as defined in Annex 2?
A1.3.5 Describe the capability for the use of repeaters.
A1.3.6 Antenna systems : fully describe the antenna systems that can be used and/or have to be used; characterize theirimpacts on systems performance, (terrestrial only); e.g., does the RTT have the capability for the use of:
– remote antennas: describe whether and how remote antenna systems can be used to extend coverage to lowtraffic density areas;
– distributed antennas: describe whether and how distributed antenna designs are used, and in whichIMT-2000 test environments;
– Smart antennas (e.g., switched beam, adaptive, etc.): describe how smart antennas can be used and what istheir impact on system performance;
– other antenna systems.
A1.3.7 Delay (for voice)
A1.3.7.1 What is the radio transmission processing delay due to the overall process of channel coding, bit interleaving,framing, etc., not including source coding? This is given as transmitter delay from the input of the channelcoder to the antenna plus the receiver delay from the antenna to the output of the channel decoder. Provide thisinformation for each service being provided. In addition, a detailed description of how this parameter wascalculated is required for both the uplink and the downlink.
A1.3.7.2 What is the total estimated round trip delay (ms) to include both the processing delay, propagation delay(terrestrial only) and vocoder delay? Give the estimated delay associated with each of the key attributesdescribed in Fig. 6 that make up the total delay provided.
A1.3.7.3 Does the proposed RTT need echo control?

20 Rec. ITU-R M.1225
A1.3.8 What is the MOS level for the proposed codec for the relevant test environments given in Annex 2? Specify itsabsolute MOS value and its relative value with respect to the MOS value of ITU-T Recommendation G.711(64 k PCM) and ITU-T Recommendation G.726 (32 k ADPCM).
NOTE 1 – If a special voice coding algorithm is indispensable for the proposed RTT, the proponent shoulddeclare detail with its performance of the codec such as MOS level. (See § A1.2.19)
A1.3.9 Description of the ability to sustain quality under certain extreme conditions.
A1.3.9.1 System overload (terrestrial only) : characterize system behaviour and performance in such conditions for eachtest services in Annex 2, including potential impact on adjacent cells. Describe the effect on systemperformance in terms of blocking grade of service for the cases that the load on a particular cell is 125%, 150%,175%, and 200% of full load. Also describe the effect of blocking on the immediate adjacent cells. Voiceservice is to be considered here. Full load means a traffic loading which results in 1% call blocking with theBER of 1 × 10⁻³ maintained.
A1.3.9.2 Hardware failures : characterize system behaviour and performance in such conditions. Provide detailedexplanation on any calculation.
A1.3.9.3 Interference immunity : characterize system immunity or protection mechanisms against interference. What isthe interference detection method? What is the interference avoidance method?
A1.3.10 Characterize the adaptability of the proposed RTT to different and/or time-varying conditions (e.g. propagation,traffic, etc.) that are not considered in the above attributes of § A1.3.
A1.4 Technology design constraints
A1.4.1 Frequency stability : provide transmission frequency stability (not oscillator stability) requirements of thecarrier (include long term – 1 year – frequency stability requirements (ppm)).
A1.4.1.1 For BS transmission (terrestrial component only).
A1.4.1.2 For MS transmission.
A1.4.2 Out-of-band and spurious emissions : specify the expected levels of base or satellite and mobile transmitteremissions outside the operating channel, as a function of frequency offset.
A1.4.3 Synchronisation requirements : describe RTT’s timing requirements, e.g.
– Is BS-to-BS or satellite land earth station (LES)-to-LES synchronisation required? Provide preciseinformation, the type of synchronisation, i.e., synchronisation of carrier frequency, bit clock, spreadingcode or frame, and their accuracy.
– Is BS-to-network synchronisation required? (terrestrial only).– State short-term frequency and timing accuracy of BS (or LES) transmit signal.– State source of external system reference and the accuracy required, if used at BS (or LES) (for example:
derived from wireline network, or GPS receiver).– State free run accuracy of MS frequency and timing reference clock.– State base-to-base bit time alignment requirement over a 24 h period (µs).
A1.4.4 Timing jitter : for BS (or LES) and MS give:
– the maximum jitter on the transmit signal,– the maximum jitter tolerated on the received signal.Timing jitter is defined as r.m.s. value of the time variance normalized by symbol duration.
A1.4.5 Frequency synthesizer : what is the required step size, switched speed and frequency range of the frequencysynthesizer of MSs?
A1.4.6 Does the proposed system require capabilities of fixed networks not generally available today?
A1.4.6.1 Describe the special requirements on the fixed networks for the handover procedure. Provide handoverprocedure to be employed in proposed RTT in detail.
A1.4.7 Fixed network feature transparency
A1.4.7.1 Which service(s) of the standard set of ISDN bearer services can the proposed RTT pass to users without fixednetwork modification.
A1.4.8 Characterize any radio resource control capabilities that exist for the provision of roaming between a private(e.g., closed user group) and a public IMT-2000 operating environment.
Rec. ITU-R M.1225 21
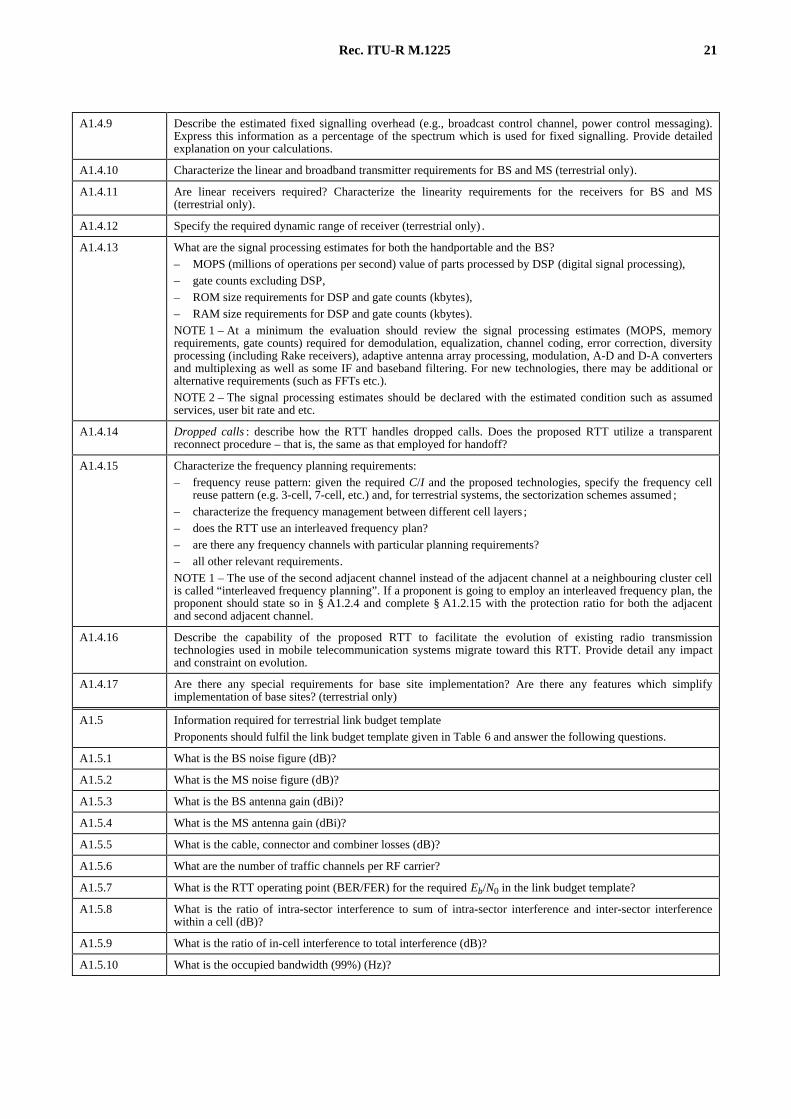
A1.4.9 Describe the estimated fixed signalling overhead (e.g., broadcast control channel, power control messaging).Express this information as a percentage of the spectrum which is used for fixed signalling. Provide detailedexplanation on your calculations.
A1.4.10 Characterize the linear and broadband transmitter requirements for BS and MS (terrestrial only).
A1.4.11 Are linear receivers required? Characterize the linearity requirements for the receivers for BS and MS(terrestrial only).
A1.4.12 Specify the required dynamic range of receiver (terrestrial only) .
A1.4.13 What are the signal processing estimates for both the handportable and the BS?– MOPS (millions of operations per second) value of parts processed by DSP (digital signal processing),– gate counts excluding DSP,– ROM size requirements for DSP and gate counts (kbytes),– RAM size requirements for DSP and gate counts (kbytes).NOTE 1 – At a minimum the evaluation should review the signal processing estimates (MOPS, memoryrequirements, gate counts) required for demodulation, equalization, channel coding, error correction, diversityprocessing (including Rake receivers), adaptive antenna array processing, modulation, A-D and D-A convertersand multiplexing as well as some IF and baseband filtering. For new technologies, there may be additional oralternative requirements (such as FFTs etc.).NOTE 2 – The signal processing estimates should be declared with the estimated condition such as assumedservices, user bit rate and etc.
A1.4.14 Dropped calls : describe how the RTT handles dropped calls. Does the proposed RTT utilize a transparentreconnect procedure – that is, the same as that employed for handoff?
A1.4.15 Characterize the frequency planning requirements:– frequency reuse pattern: given the required C/I and the proposed technologies, specify the frequency cell
reuse pattern (e.g. 3-cell, 7-cell, etc.) and, for terrestrial systems, the sectorization schemes assumed ;– characterize the frequency management between different cell layers ;– does the RTT use an interleaved frequency plan?– are there any frequency channels with particular planning requirements?– all other relevant requirements.NOTE 1 – The use of the second adjacent channel instead of the adjacent channel at a neighbouring cluster cellis called “interleaved frequency planning”. If a proponent is going to employ an interleaved frequency plan, theproponent should state so in § A1.2.4 and complete § A1.2.15 with the protection ratio for both the adjacentand second adjacent channel.
A1.4.16 Describe the capability of the proposed RTT to facilitate the evolution of existing radio transmissiontechnologies used in mobile telecommunication systems migrate toward this RTT. Provide detail any impactand constraint on evolution.
A1.4.17 Are there any special requirements for base site implementation? Are there any features which simplifyimplementation of base sites? (terrestrial only)
A1.5 Information required for terrestrial link budget templateProponents should fulfil the link budget template given in Table 6 and answer the following questions.
A1.5.1 What is the BS noise figure (dB)?
A1.5.2 What is the MS noise figure (dB)?
A1.5.3 What is the BS antenna gain (dBi)?
A1.5.4 What is the MS antenna gain (dBi)?
A1.5.5 What is the cable, connector and combiner losses (dB)?
A1.5.6 What are the number of traffic channels per RF carrier?
A1.5.7 What is the RTT operating point (BER/FER) for the required Eb/N0 in the link budget template?
A1.5.8 What is the ratio of intra-sector interference to sum of intra-sector interference and inter-sector interferencewithin a cell (dB)?
A1.5.9 What is the ratio of in-cell interference to total interference (dB)?
A1.5.10 What is the occupied bandwidth (99%) (Hz)?
22 Rec. ITU-R M.1225
ANNEX 2
Test environments and deployment models
This Annex describes the reference scenarios (test environments and deployment models) and propagation modelsnecessary to elaborate the performance figures of candidate terrestrial and satellite RTTs for IMT-2000. The terrestrialand the satellite component are subdivided in Parts 1 and 2, respectively.
PART 1
Terrestrial component
1 Test environments
This section will provide the reference model for each test operating environment. These test environments are intendedto cover the range of IMT-2000 operating environments. The necessary parameters to identify the reference modelsinclude the test propagation environments, traffic conditions, user information rate for prototype voice and data services,and the objective performance criteria for each test operating environment.
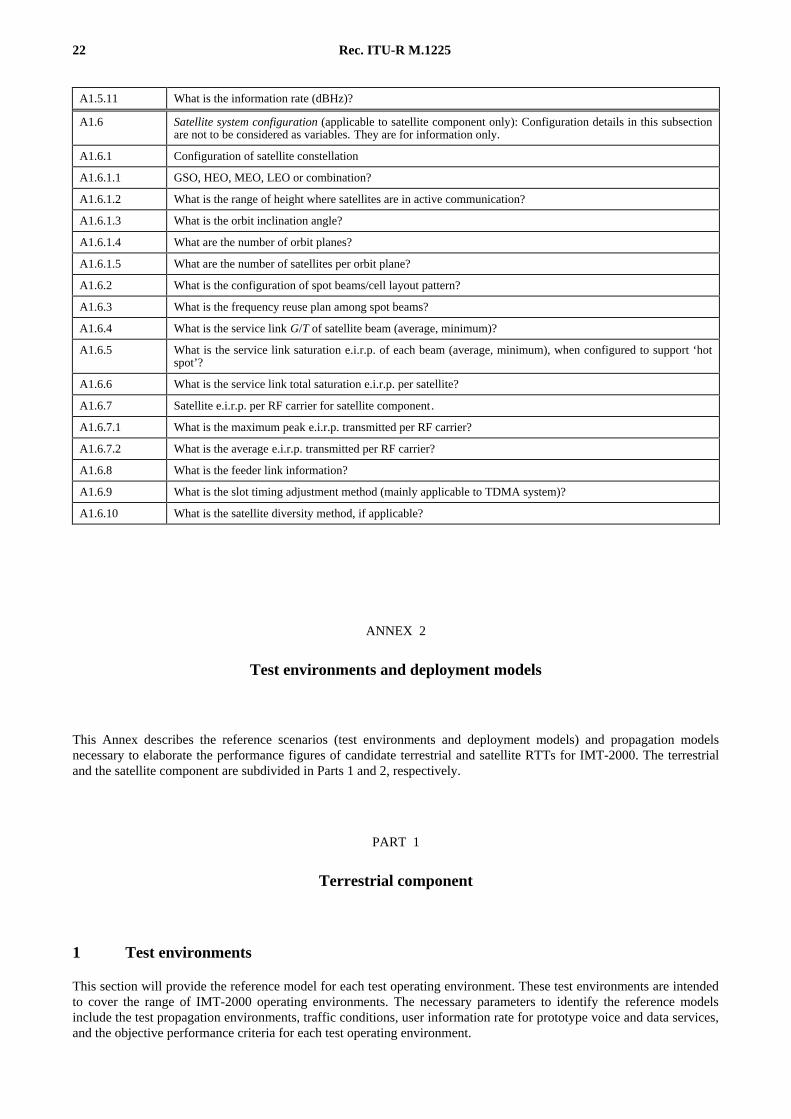
A1.5.11 What is the information rate (dBHz)?
A1.6 Satellite system configuration (applicable to satellite component only): Configuration details in this subsectionare not to be considered as variables. They are for information only.
A1.6.1 Configuration of satellite constellation
A1.6.1.1 GSO, HEO, MEO, LEO or combination?
A1.6.1.2 What is the range of height where satellites are in active communication?
A1.6.1.3 What is the orbit inclination angle?
A1.6.1.4 What are the number of orbit planes?
A1.6.1.5 What are the number of satellites per orbit plane?
A1.6.2 What is the configuration of spot beams/cell layout pattern?
A1.6.3 What is the frequency reuse plan among spot beams?
A1.6.4 What is the service link G/T of satellite beam (average, minimum)?
A1.6.5 What is the service link saturation e.i.r.p. of each beam (average, minimum), when configured to support ‘hotspot’?
A1.6.6 What is the service link total saturation e.i.r.p. per satellite?
A1.6.7 Satellite e.i.r.p. per RF carrier for satellite component.
A1.6.7.1 What is the maximum peak e.i.r.p. transmitted per RF carrier?
A1.6.7.2 What is the average e.i.r.p. transmitted per RF carrier?
A1.6.8 What is the feeder link information?
A1.6.9 What is the slot timing adjustment method (mainly applicable to TDMA system)?
A1.6.10 What is the satellite diversity method, if applicable?

Rec. ITU-R M.1225 23
The test operating environments are considered as a basic factor in the evaluation process of the RTTs. The referencemodels are used to estimate the critical aspects, such as the spectrum, coverage and power efficiencies. This estimationwill be based on system-level calculations and link-level software simulations using propagation and traffic models.
Critical aspects of RTTs, such as spectrum and coverage efficiencies, cannot be fairly estimated independently ofappropriate IMT-2000 services. These IMT-2000 services are, as minimum, characterised by:
– ranges of supported data rates,
– BER requirements,
– one way delay requirements,
– activity factor,
– traffic models.
Table 1 provides a list of test data rates for evaluation purposes.
TABLE 1
List of test data rates for evaluation purposes
NOTE 1 – The delay values for various services are to be derived from service (e.g. speech) requirements which mayvary from one test environment to another. Coordination between different evaluations is encouraged in order to achievecomparable evaluation results.
In the coverage and spectrum efficiencies evaluation procedure, proponents shall use:
– “speech” – one among the data rates given in Table 1;
– data – for each service the evaluation of RTTs or SRTTs shall be performed for at least the following two data ratesfrom Table 1:
– one data rate equal to the proposed value indicated in bold;
– the maximum data rate of the proposed RTT or SRTT.
It is open to the proponent of an RTT (or SRTT) to give performance for more than two data rates to show advantages ofthe proposed technology.
Test environments Indoor officeOutdoor to indoor
and pedestrian Vehicular
Test services Bit rates (values)BER
Channel activity
Bit rates (values)BER
Channel activity
Bit rates (values)BER
Channel activity
Representative low delaydata bearer for speech(1)
8-16-32 kbit/s≤ 1 × 10⁻³
50%
8-16-32 kbit/s≤ 1 × 10⁻³
50%
8-16-32 kbit/s≤ 1 × 10⁻³
50%
Data (circuit-switched,low delay)(1)
64-144-384-512-1 024-2 048 kbit/s
≤ 1 × 10⁻⁶
100%
64-144 kbit/s
≤ 1 × 10⁻⁶
100%
16-32-64 kbit/s
≤ 1 × 10⁻⁶
100%
Data (circuit-switched, longdelay constrained)(1)
64-144-384-512-1 024-2 048 kbit/s
≤ 1 × 10⁻⁶
100%
64-144 kbit/s
≤ 1 × 10⁻⁶
100%
16-32-64 kbit/s
≤ 1 × 10⁻⁶
100%
Data (packet)(1) 64-144-384-512 -1 024-2 048 kbit/s
≤ 1 × 10⁻⁶
Poisson arrivals(2)
64-144 kbit/s
≤ 1 × 10⁻⁶
Poisson arrivals(2)
16-32-64 kbit/s
≤ 1 × 10⁻⁶
Poisson arrivals(2)
(1) Proponents must indicate the achieved one-way delay (excluding propagation delay and processing delay of voice channelcoding) for all the test services.
(2) For packet data service an interarrival process with Poisson distribution has to be considered. Packet block size is of exponentiallength.
24 Rec. ITU-R M.1225
1.1 Test environment descriptions
A central factor of mobile radio propagation environments is multi-path propagation causing fading and channel timedispersion. The fading characteristics vary with the propagation environment and its impact on the communicationquality (i.e. bit error patterns) is highly dependent on the speed of the mobile station relative to the serving base station.These environments are described in Recommendation ITU-R M.1034.
The purpose of the test environments is to challenge the RTTs. Instead of constructing propagation models for allpossible IMT-2000 operating environments, a smaller set of test environments is defined which adequately span theoverall range of possible environments. The descriptions of these test environments may therefore not correspond withthose of the actual operating environments.
This section will identify the propagation model for each test operating environment listed below. For practical reasons,these test operating environments are an appropriate subset of the IMT-2000 operating environments described inRecommendation ITU-R M.1034. While simple models are adequate to evaluate the performance of individual radiolinks, more complex models are needed to evaluate the overall system-level reliability and suitability of specifictechnologies. For narrowband technologies, time delay spread may be characterized by its r.m.s. value alone; forwideband technologies, however, the number, strength, and relative time delay of the many signal components becomeimportant. For some technologies (e.g. those employing power control) these models must include coupling between allco-channel propagation links to achieve maximum accuracy. Also, in some cases, the large-scale (shadow fading)temporal variations of the environment must be modelled.
The key parameters to describe each propagation model would include:
– time delay-spread, its structure, and its statistical variability (e.g. probability distribution of time delay spread);
– geometrical path loss rule (e.g. R – 4) and excess path loss;
– shadow fading;
– multipath fading characteristics (e.g. Doppler spectrum, Rician vs. Rayleigh) for the envelope of channels;
– operating radio frequency.
Statistical models are proposed in § 1.2 to generate path losses and time delay structures for paths in each testenvironment.
It should be noted that IMT-2000 will be a world-wide standard. Therefore, the models proposed for evaluation of RTTsshould consider a broad range of environment characteristics, e.g. large and small cities, tropical, rural, and desert areas.
The following sections provide a brief description of the conditions that might be expected in the identifiedenvironments. The specific channel parameters are found in the appropriate parts of § 1.2.
IMT-2000 may include both mobile wireless and fixed wireless applications. It should be noted that for the purpose ofevaluation, operation in the fixed environment is considered to be covered by the mobile test environments. Generally,the fixed wireless channel model will be less complex due to lack of mobility. As a result, there is a trade-off possiblebetween fixed and mobile users which should be considered while evaluating RTTs.
1.1.1 Indoor office test environment
This environment is also characterized by small cells and low transmit powers. Both base stations and pedestrian usersare located indoors. Section 1.2.2 describes the channel impulse response model and its parameters. The path loss rulevaries due to scatter and attenuation by walls, floors, and metallic structures such as partitions and filing cabinets. Theseobjects also produce shadowing effects. A log-normal shadow fading standard deviation of 12 dB can be expected.Fading ranges from Rician to Rayleigh, with Doppler frequency offsets set by walking speeds.

Rec. ITU-R M.1225 25
1.1.2 Outdoor to indoor and pedestrian test environment
This environment is characterized by small cells and low transmit power. Base stations with low antenna heights arelocated outdoors; pedestrian users are located on streets and inside buildings and residences. Section 1.2.2 describes thechannel impulse response model. A geometrical path loss rule of R – 4 is appropriate, but a wider range should beconsidered. If the path is a line of sight on a canyon-like street, for example, the path loss follows a R – 2 rule where thereis Fresnel zone clearance. For the region where there is no longer Fresnel zone clearance, a path loss rule of R – 4 isappropriate but a range up to R – 6 may be encountered due to trees and other obstructions along the path. Log-normalshadow fading with a standard deviation of 10 dB is reasonable for outdoors and 12 dB for indoor. Building penetrationloss averages 12 dB with a standard deviation of 8 dB. Rayleigh and/or Rician fading rates are generally set by walkingspeeds, but faster fading due to reflections from moving vehicles is occasionally seen.
1.1.3 Vehicular test environment
This environment is characterized by larger cells and higher transmit power. Assuming limited spectrum, higher cellcapacity will be important. Section 1.2.2 describes the channel impulse response model and its parameters. Ageometrical path loss rule of R – 4 and log-normal shadow fading with 10 dB standard deviation are appropriate in urbanand suburban areas. In rural areas with flat terrain the path loss is lower than that of urban and suburban areas. Inmountainous areas, if path blockage are avoided by choosing base station locations, a path loss rule closer to R – 2 may beappropriate. Rayleigh fading rates are set by vehicle speeds. Lower fading rates are appropriate for applicationsemploying stationary terminals.
1.1.4 Mixed test environment
It is not sufficient for a RTT to have good performance in only one of the specified test environments defined in thissection. The RTT should also have a good performance in a mixed environment, see Recommendation ITU-R M.1035,§ 10. For example, it can be a “vehicular test environment” (macro cells) and an “outdoor to indoor test environment”(micro cells) in the same geographical area. In this area fast moving terminals (vehicles) should probably be connectedto the macro cells to reduce the handoff rate (number of hand-offs per minute) and slow moving terminals (pedestrians)should be connected to the micro cells to achieve high capacity.
1.2 Propagation models
The following sections provide both path loss models and channel impulse response models for the terrestrialcomponent.
For the terrestrial environments, the propagation effects are divided into three distinct types of model. These are meanpath loss, slow variation about the mean due to shadowing and scattering, and the rapid variation in the signal due tomultipath effects. Equations are given for mean path loss for each of the three terrestrial environments. The slowvariation is considered to be log-normally distributed. This is described by the standard deviation (given in thedeployment model section).
Finally, the rapid variation is characterized by the channel impulse response. Channel impulse response is modelledusing a tapped delay line implementation. The characteristics of the tap variability is characterized by the Dopplerspectrum. A detailed treatment of the propagation models is found in Appendix 1.
1.2.1 Path loss models
Equations are given for mean path loss as a function of distance for each of the terrestrial environments except themixed-cell test environment. The slow variation is considered to be log-normally distributed. This is described by thestandard deviation (dB) and the decorrelation length of this long-term fading for the vehicular test environment.

26 Rec. ITU-R M.1225
1.2.1.1 Path loss model for indoor office test environment
The indoor path loss model (dB) is in the following simplified form, which is derived from the COST 231 indoor modelpresented in Appendix 1. This low increase of path loss versus distance is a worst-case from the interference point ofview:
( )L R n
nn= + +
++37 30 18 310
0 4621log .
– .
where:
R : transmitter-receiver separation (m)
n : number of floors in the path.
NOTE 1 – L shall in no circumstances be less than free space loss. A log-normal shadow fading standard deviation of12 dB can be expected.
1.2.1.2 Path loss model for outdoor to indoor and pedestrian test environment
The following model should be used for the outdoor to indoor and pedestrian test environment:
L R f= + +40 30 4910 10log log
where:
R : base station – mobile station separation (km)
f : carrier frequency of 2 000 MHz for IMT-2000 band application.
NOTE 1– L shall in no circumstances be less than free space loss. This model is valid for non-line-of-sight (NLOS) caseonly and describes worse case propagation. Log-normal shadow fading with a standard deviation of 10 dB for outdoorusers and 12 dB for indoor users is assumed. The average building penetration loss is 12 dB with a standard deviationof 8 dB.
1.2.1.3 Path loss model for vehicular test environment
This model, based on the same general format as in § 1.2.1.2, is applicable for the test scenarios in urban and suburbanareas outside the high rise core where the buildings are of nearly uniform height:
L h R h fb b= − × − + +−40 1 4 10 18 21 80310 10 10( )∆ ∆log log log dB
where:
R : base station – mobile station separation (km)
f : carrier frequency of 2 000 MHz
∆hb : base station antenna height (m), measured from the average rooftop level.
To quantitatively evaluate each RTT, the base station antenna height is fixed at 15 m above the average rooftop(∆hb = 15 m). Each proponent has an option to specify an alternate base station antenna height to optimize coverage andspectrum efficiency in their proposal.
NOTE 1 – L shall in no circumstances be less than free space loss. This model is valid for NLOS case only and describesworse case propagation. Log-normal shadow fading with 10 dB standard deviation are assumed in both urban andsuburban areas.
NOTE 2 – The path loss model is valid for a range of ∆hb from 0 to 50 m.
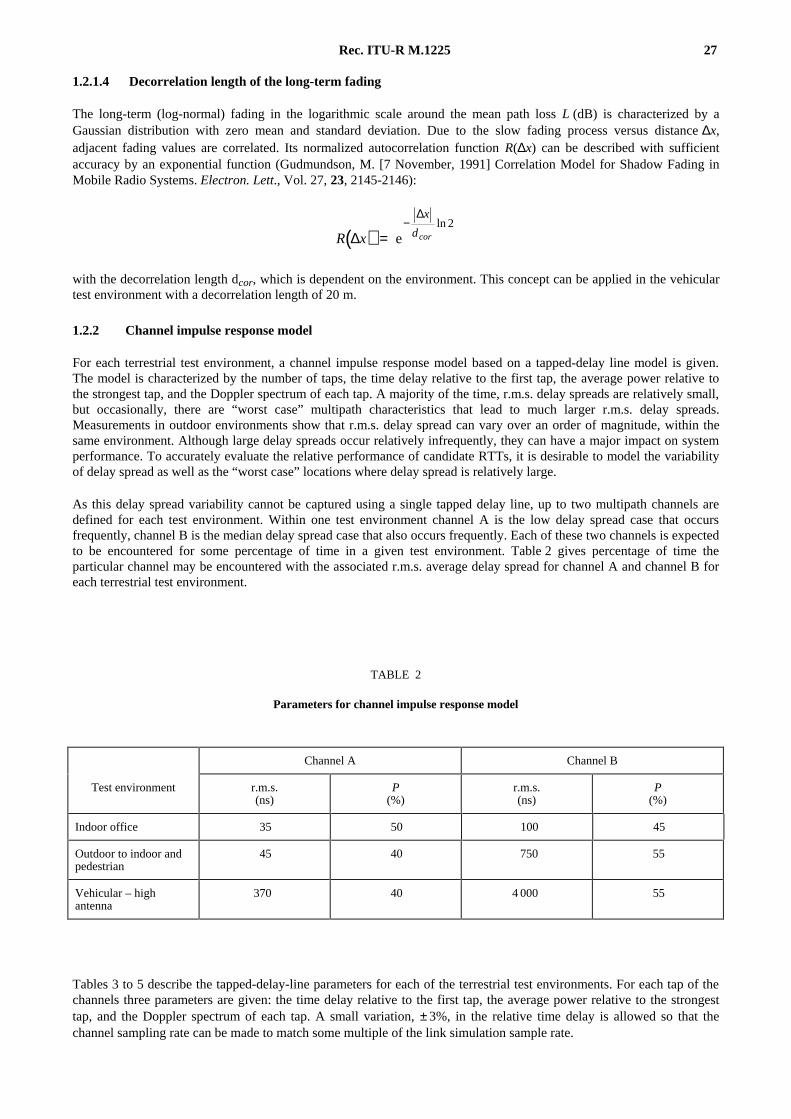
Rec. ITU-R M.1225 27
1.2.1.4 Decorrelation length of the long-term fading
The long-term (log-normal) fading in the logarithmic scale around the mean path loss L (dB) is characterized by aGaussian distribution with zero mean and standard deviation. Due to the slow fading process versus distance ∆x,adjacent fading values are correlated. Its normalized autocorrelation function R(∆x) can be described with sufficientaccuracy by an exponential function (Gudmundson, M. [7 November, 1991] Correlation Model for Shadow Fading inMobile Radio Systems. Electron. Lett., Vol. 27, 23, 2145-2146):
( )R x
x
dcor∆
∆
=−
eln 2
with the decorrelation length dcor, which is dependent on the environment. This concept can be applied in the vehiculartest environment with a decorrelation length of 20 m.
1.2.2 Channel impulse response model
For each terrestrial test environment, a channel impulse response model based on a tapped-delay line model is given.The model is characterized by the number of taps, the time delay relative to the first tap, the average power relative tothe strongest tap, and the Doppler spectrum of each tap. A majority of the time, r.m.s. delay spreads are relatively small,but occasionally, there are “worst case” multipath characteristics that lead to much larger r.m.s. delay spreads.Measurements in outdoor environments show that r.m.s. delay spread can vary over an order of magnitude, within thesame environment. Although large delay spreads occur relatively infrequently, they can have a major impact on systemperformance. To accurately evaluate the relative performance of candidate RTTs, it is desirable to model the variabilityof delay spread as well as the “worst case” locations where delay spread is relatively large.
As this delay spread variability cannot be captured using a single tapped delay line, up to two multipath channels aredefined for each test environment. Within one test environment channel A is the low delay spread case that occursfrequently, channel B is the median delay spread case that also occurs frequently. Each of these two channels is expectedto be encountered for some percentage of time in a given test environment. Table 2 gives percentage of time theparticular channel may be encountered with the associated r.m.s. average delay spread for channel A and channel B foreach terrestrial test environment.
TABLE 2
Parameters for channel impulse response model
Tables 3 to 5 describe the tapped-delay-line parameters for each of the terrestrial test environments. For each tap of thechannels three parameters are given: the time delay relative to the first tap, the average power relative to the strongesttap, and the Doppler spectrum of each tap. A small variation, ± 3%, in the relative time delay is allowed so that thechannel sampling rate can be made to match some multiple of the link simulation sample rate.
Channel A Channel B
Test environment r.m.s.(ns)
P(%)
r.m.s.(ns)
P(%)
Indoor office 35 50 100 45
Outdoor to indoor andpedestrian
45 40 750 55
Vehicular – highantenna
370 40 4 000 55

28 Rec. ITU-R M.1225
TABLE 3
Indoor office test environment tapped-delay-line parameters
TABLE 4
Outdoor to indoor and pedestrian test environment tapped-delay-line parameters
TABLE 5
Vehicular test environment, high antenna, tapped-delay-line parameters
Channel A Channel BDoppler
Tap Relative delay(ns)
Average power(dB)
Relative delay(ns)
Average power(dB)
spectrum
1 0 0 0 0 Flat
2 50 –3.0 100 –3.6 Flat
3 110 –10.0 200 –7.2 Flat
4 170 –18.0 300 –10.8 Flat
5 290 –26.0 500 –18.0 Flat
6 310 –32.0 700 –25.2 Flat
Channel A Channel BDoppler
Tap Relative delay(ns)
Average power(dB)
Relative delay(ns)
Average power(dB)
spectrum
1 0 0 0 0 Classic
2 110 –9.7 200 –0.9 Classic
3 190 –19.2 800 –4.9 Classic
4 410 –22.8 1 200 –8.0 Classic
5 – – 2 300 –7.8 Classic
6 – – 3 700 –23.9 Classic
Channel A Channel BDoppler
Tap Relative delay(ns)
Average power(dB)
Relative delay(ns)
Average power(dB)
spectrum
1 0 0.0 0 –2.5 Classic
2 310 –1.0 300 0 Classic
3 710 –9.0 8.900 –12.8 Classic
4 1 090 –10.0 12 900 –10.0 Classic
5 1 730 –15.0 17 100 –25.2 Classic
6 2 510 –20.0 20 000 –16.0 Classic
Rec. ITU-R M.1225 29
1.3 Link budget template and deployment models
In the sections that follow a link budget template and deployment models are proposed to be used for evaluation in eachof the terrestrial test environments. The proponent must use the terrestrial link budget corresponding to channel impulseresponse model channels A and B. For calculations of coverage and spectrum efficiencies the worst case amongchannels A and B has to be assumed.
For the terrestrial RTTs, the deployment models are used to extract critical parameters, such as coverage efficiency andspectrum efficiency. They also give a general idea of the amount of infrastructure required to provide service to thespecified model deployment area.
The spectrum efficiency is defined as the number of E/MHz/cell for speech and Mbit/s/cell for data. Spectrum efficiencyis calculated for the higher offered traffic levels and for the given spectrum allocation. Spectrum efficiency is dependenton the frequency bandwidth allocation and is not linearly scaleable between different bandwidth allocations. For thepurpose of evaluation, a duplex bandwidth of 30 MHz is assumed and is to be divided between forward and reverse linkas required by the RTT implementation. An indication of the guardband needed between operators using the same RTTshould be given by the RTT proponent.
The coverage efficiency is defined as the total number of cell sites per square kilometre required to meet the coveragerequirements specified for each test environment. Coverage efficiency is to be calculated at low traffic levels (asspecified in deployment tables) since the system will most probably be interference limited at high traffic load.
A link budget template for the terrestrial RTTs is given in Table 6. The link budget template is to be completed for eachtest environment and each test case service in Table 1. Link level simulations based on channel B of the impulseresponse models are used to determine the required Eb/(N0 + I0) and hence the required C/I of their RTT to meet theperformance criteria given in Table 1. Path loss formulas are then used to determine the maximum range and thecoverage area. In case of hexagonal deployment of sectored cells, the area covered by one sector is defined asS = R
2 · 3/4, where R is the range obtained in the link budget. This means that the sectors are hexagonal with basestations placed in the corners of the hexagons.
An infrastructure is determined by the proponent to meet the service objectives and coverage requirements for thedeployment. Calculation of coverage efficiency is done based on the proposed deployment for the given low trafficlevels.
Implementation independent parameters (ii) are fixed in the link budget template to avoid divergence not directly relatedto radio technology differences. The proponents must provide coverage efficiency values using these fixed ii values.
A specific deployment scenario is given for each terrestrial test environment. This contains information on marketrequirements including grade of service, traffic level, coverage requirements and subscriber penetration. Also given foreach deployment scenario are the physical parameters of that environment which includes: area to cover, populationdensity, and mobile terminal velocity (for Doppler frequency).
Along with a link budget template for each terrestrial test environment a deployment model results matrix is to becompleted for each specified traffic. The results matrix is found in Table 11. The simulations used to complete the linkbudget template are required to complete the model deployment for each test environment. Each system proponent mustuse only the propagation models given in § 1.2.
System proponents will assume a centre frequency of 2.0 GHz when completing the deployment models.
1.3.1 Terrestrial link budget templates
The link budget template shall be completed for both the forward and reverse links for each deployment environmentand each test case service. In the case of the mixed environment, the link budget template should be completed for thepedestrian and vehicular test environments. Implementation dependent and independent link budget items are indicatedby id and ii in the template. The link budget template should not be considered as a tool for planning since essential partsare missing such as body loss, penetration loss into cars etc. To facilitate comparable results RTT independentparameters are pre-set.

30 Rec. ITU-R M.1225
TABLE 6
Link budget template
id/ii Item Forward link Reverse link
Test environment
Test service
Multipath channel class A, B A, B
ii/id (a0) Average transmitter power per traffic channel(NOTE 1)
dBm dBm
id (a1) Maximum transmitter power per traffic channel dBm dBm
id (a2) Maximum total transmitter power dBm dBm
ii (b) Cable, connector, and combiner losses (enumeratesources)
2 dB 0 dB
ii (c) Transmitter antenna gain 13 dBi (vehicular)
10 dBi (pedestrian)
2 dBi (indoor)
0 dBi
id (d1) Transmitter e.i.r.p. per traffic channel = (a1 – b + c) dBm dBm
id (d2) Total transmitter e.i.r.p. = (a2 – b + c) dBm dBm
ii (e) Receiver antenna gain 0 dBi 13 dBi (vehicular)
10 dBi (pedestrian)
2 dBi (indoor)
ii (f) Cable and connector losses 0 dB 2 dB
ii (g) Receiver noise figure 5 dB 5 dB
ii (h) Thermal noise density
(H) (linear units)
–174 dBm/Hz
3.98 × 10⁻¹⁸ mW/Hz
–174 dBm/Hz
3.98 × 10⁻¹⁸ mW/Hz
id (i) Receiver interference density (NOTE 2)
(I) (linear units)
dBm/Hz
mW/Hz
dBm/Hz
mW/Hz
id (j) Total effective noise plus interference density
= 10 log (10((g + h)/10) + I)
dBm/Hz dBm/Hz
ii (k) Information rate (10 log (Rb)) dB(Hz) dB(Hz)
id (l) Required Eb/(N0 + I0) dB dB
id (m) Receiver sensitivity = (j + k + l)
id (n) Hand-off gain dB dB
id (o) Explicit diversity gain dB dB
id (o′) Other gain dB dB
id (p) Log-normal fade margin dB dB
id (q) Maximum path loss
= {d1 – m + (e – f) + o + n + o′ – p}
dB dB
id (r) Maximum range m m
Rec. ITU-R M.1225 31
NOTES to Table 6:
NOTE 1 – Proponents must provide coverage and spectrum efficiencies values using the following proposed average transmitterpower per traffic channel. However they should provide additional values based on optimized transmitter power for their proposedRTT.
Forward link Reverse link
(a0) Average transmitter power pertraffic channel
30 dBm vehicular20 dBm pedestrian10 dBm indoor
24 dBm vehicular14 dBm pedestrian
04 dBm indoor
NOTE 2 – Since the significance and method of calculating this value will vary from RTT to RTT, the proponent must give a detailedexplanation of their method for calculating this value and its significance in determining capacity and coverage of the RTT. Inparticular, the proponent must state explicitly what frequency reuse ratio and traffic loading per sector are assumed in determiningthis quantity. Interference has to be evaluated for the specified low traffic level given for each test environment.
The following sections provide descriptions of the individual link budget template items. Descriptions apply to both forward andreverse links unless specifically stated otherwise. For the forward link the base station is the transmitter and the mobile station thereceiver. For the reverse link the mobile station is the transmitter and the base station the receiver.
(a0) Average transmitter power per traffic channel (dBm)
The average transmitter power per traffic channel is defined as the mean of the total transmitted power over an entire transmissioncycle with maximum transmitted power when transmitting.
(a1) Maximum transmitter power per traffic channel (dBm)
Maximum transmitter power per traffic channel is defined as the total power at the transmitter output for a single traffic channel. Atraffic channel is defined as a communication path between a mobile station and a base station used for user and signalling traffic.The term traffic channel implies a forward traffic channel and reverse traffic channel pair.
(a2) Maximum total transmitter power (dBm)
Maximum total transmit power is the aggregate maximum transmit power of all channels.
(b) Cable, connector, and combiner losses (transmitter) (dB)
These are the combined losses of all transmission system components between the transmitter output and the antenna input (all lossesin positive dB values). The value is fixed in the template.
(c) Transmitter antenna gain (dBi)
Transmitter antenna gain is the maximum gain of the transmitter antenna in the horizontal plane (specified as dB relative to anisotropic radiator). The value is fixed in the template.
(d1) Transmitter e.i.r.p. per traffic channel (dBm)
This is the summation of transmitter power output per traffic channel (dBm), transmission system losses (–dB), and the transmitterantenna gain (dBi), in the direction of maximum radiation.
d2) Transmitter e.i.r.p. (dBm)
This is the summation of the total transmitter power (dBm), transmission system losses (–dB), and the transmitter antenna gain (dBi).
(e) Receiver antenna gain (dBi)
Receiver antenna gain is the maximum gain of the receiver antenna in the horizontal plane (specified as dB relative to an isotropicradiator).
(f) Cable, connector, and splitter losses (receiver) (dB)
These are the combined losses of all transmission system components between the receiving antenna output and the receiver input (alllosses in positive dB values). The value is fixed in the template.
(g) Receiver noise figure (dB)
Receiver noise figure is the noise figure of the receiving system referenced to the receiver input. The value is fixed in the template.
(h), (H) Thermal noise density, N0 (dB(m/Hz))
Thermal noise density, N0, is defined as the noise power per Hertz at the receiver input. Note that (h) is logarithmic units and (H) islinear units. The value is fixed in the template.
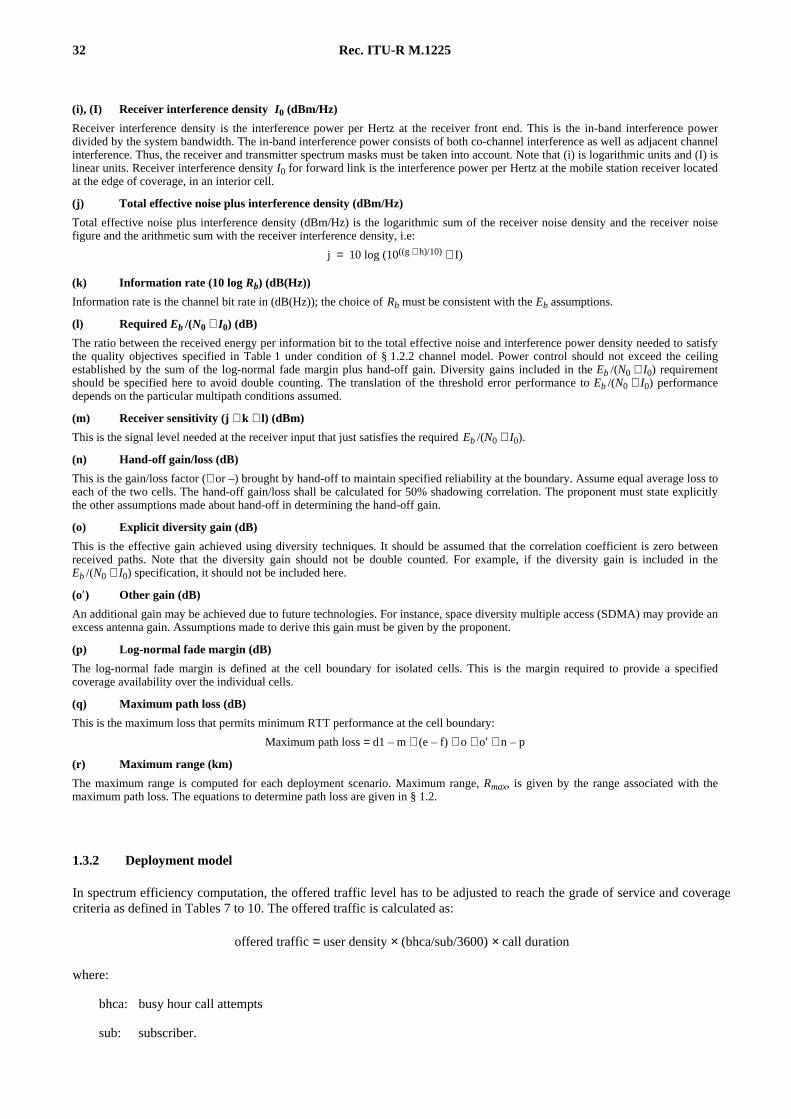
32 Rec. ITU-R M.1225
1.3.2 Deployment model
In spectrum efficiency computation, the offered traffic level has to be adjusted to reach the grade of service and coveragecriteria as defined in Tables 7 to 10. The offered traffic is calculated as:
offered traffic = user density × (bhca/sub/3600) × call duration
where:
bhca: busy hour call attempts
sub: subscriber.
(i), (I) Receiver interference density I0 (dBm/Hz)
Receiver interference density is the interference power per Hertz at the receiver front end. This is the in-band interference powerdivided by the system bandwidth. The in-band interference power consists of both co-channel interference as well as adjacent channelinterference. Thus, the receiver and transmitter spectrum masks must be taken into account. Note that (i) is logarithmic units and (I) islinear units. Receiver interference density I0 for forward link is the interference power per Hertz at the mobile station receiver locatedat the edge of coverage, in an interior cell.
(j) Total effective noise plus interference density (dBm/Hz)
Total effective noise plus interference density (dBm/Hz) is the logarithmic sum of the receiver noise density and the receiver noisefigure and the arithmetic sum with the receiver interference density, i.e:
j = 10 log (10((g + h)/10) + I)
(k) Information rate (10 log Rb) (dB(Hz))
Information rate is the channel bit rate in (dB(Hz)); the choice of Rb must be consistent with the Eb assumptions.
(l) Required Eb /(N0 + I0) (dB)
The ratio between the received energy per information bit to the total effective noise and interference power density needed to satisfythe quality objectives specified in Table 1 under condition of § 1.2.2 channel model. Power control should not exceed the ceilingestablished by the sum of the log-normal fade margin plus hand-off gain. Diversity gains included in the Eb /(N0 + I0) requirementshould be specified here to avoid double counting. The translation of the threshold error performance to Eb /(N0 + I0) performancedepends on the particular multipath conditions assumed.
(m) Receiver sensitivity (j + k + l) (dBm)
This is the signal level needed at the receiver input that just satisfies the required Eb /(N0 + I0).
(n) Hand-off gain/loss (dB)
This is the gain/loss factor (+ or –) brought by hand-off to maintain specified reliability at the boundary. Assume equal average loss toeach of the two cells. The hand-off gain/loss shall be calculated for 50% shadowing correlation. The proponent must state explicitlythe other assumptions made about hand-off in determining the hand-off gain.
(o) Explicit diversity gain (dB)
This is the effective gain achieved using diversity techniques. It should be assumed that the correlation coefficient is zero betweenreceived paths. Note that the diversity gain should not be double counted. For example, if the diversity gain is included in theEb /(N0 + I0) specification, it should not be included here.
(o′) Other gain (dB)
An additional gain may be achieved due to future technologies. For instance, space diversity multiple access (SDMA) may provide anexcess antenna gain. Assumptions made to derive this gain must be given by the proponent.
(p) Log-normal fade margin (dB)
The log-normal fade margin is defined at the cell boundary for isolated cells. This is the margin required to provide a specifiedcoverage availability over the individual cells.
(q) Maximum path loss (dB)
This is the maximum loss that permits minimum RTT performance at the cell boundary:
Maximum path loss = d1 – m + (e – f) + o + o′ + n – p
(r) Maximum range (km)
The maximum range is computed for each deployment scenario. Maximum range, Rmax, is given by the range associated with themaximum path loss. The equations to determine path loss are given in § 1.2.
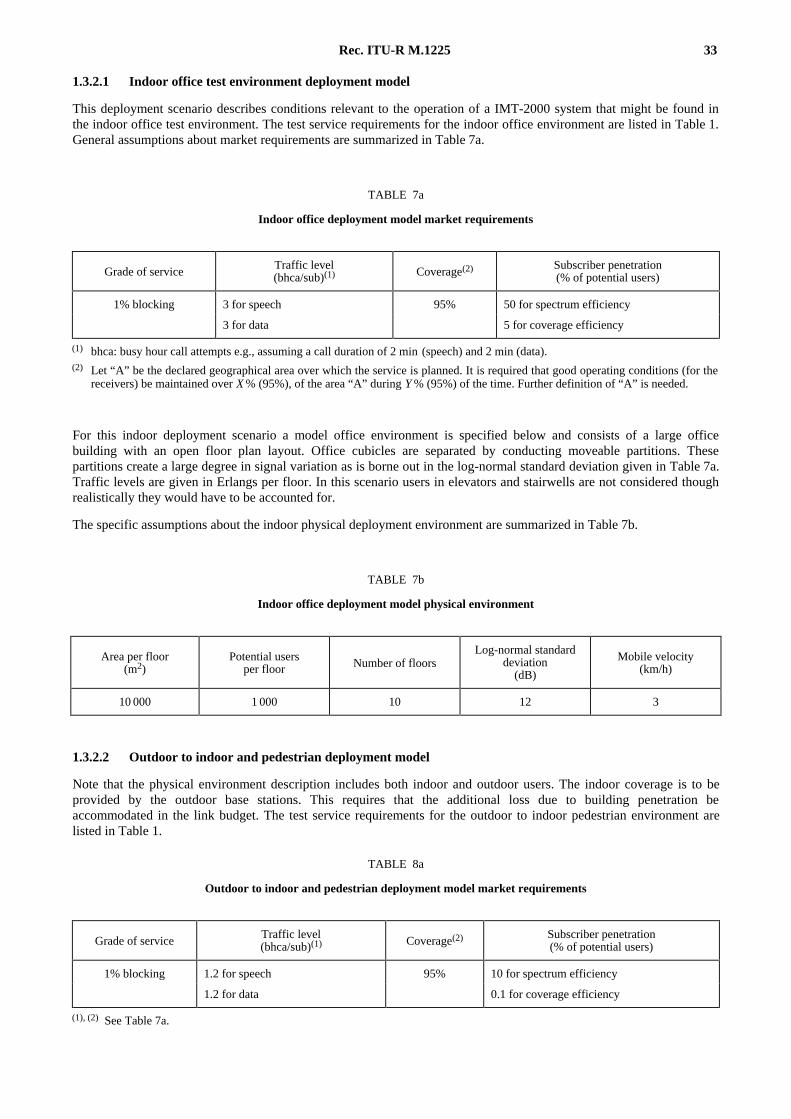
Rec. ITU-R M.1225 33
1.3.2.1 Indoor office test environment deployment model
This deployment scenario describes conditions relevant to the operation of a IMT-2000 system that might be found inthe indoor office test environment. The test service requirements for the indoor office environment are listed in Table 1.General assumptions about market requirements are summarized in Table 7a.
TABLE 7a
Indoor office deployment model market requirements
For this indoor deployment scenario a model office environment is specified below and consists of a large officebuilding with an open floor plan layout. Office cubicles are separated by conducting moveable partitions. Thesepartitions create a large degree in signal variation as is borne out in the log-normal standard deviation given in Table 7a.Traffic levels are given in Erlangs per floor. In this scenario users in elevators and stairwells are not considered thoughrealistically they would have to be accounted for.
The specific assumptions about the indoor physical deployment environment are summarized in Table 7b.
TABLE 7b
Indoor office deployment model physical environment
1.3.2.2 Outdoor to indoor and pedestrian deployment model
Note that the physical environment description includes both indoor and outdoor users. The indoor coverage is to beprovided by the outdoor base stations. This requires that the additional loss due to building penetration beaccommodated in the link budget. The test service requirements for the outdoor to indoor pedestrian environment arelisted in Table 1.
TABLE 8a
Outdoor to indoor and pedestrian deployment model market requirements
Grade of serviceTraffic level(bhca/sub)(1) Coverage(2) Subscriber penetration
(% of potential users)
1% blocking 3 for speech 95% 50 for spectrum efficiency
3 for data 5 for coverage efficiency
(1) bhca: busy hour call attempts e.g., assuming a call duration of 2 min (speech) and 2 min (data).(2) Let “A” be the declared geographical area over which the service is planned. It is required that good operating conditions (for the
receivers) be maintained over X % (95%), of the area “A” during Y % (95%) of the time. Further definition of “A” is needed.
Area per floor(m2)
Potential usersper floor Number of floors
Log-normal standarddeviation
(dB)
Mobile velocity(km/h)
10 000 1 000 10 12 3
Grade of serviceTraffic level(bhca/sub)(1) Coverage(2) Subscriber penetration
(% of potential users)
1% blocking 1.2 for speech 95% 10 for spectrum efficiency
1.2 for data 0.1 for coverage efficiency
(1), (2) See Table 7a.
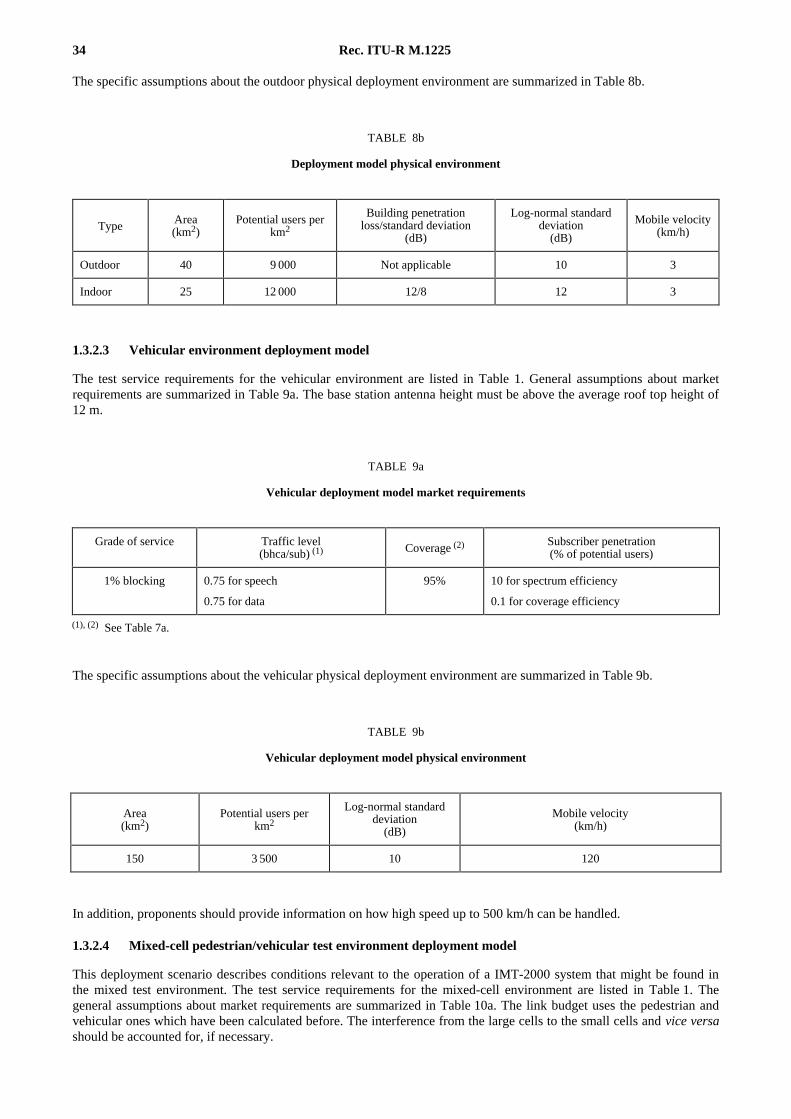
34 Rec. ITU-R M.1225
The specific assumptions about the outdoor physical deployment environment are summarized in Table 8b.
TABLE 8b
Deployment model physical environment
1.3.2.3 Vehicular environment deployment model
The test service requirements for the vehicular environment are listed in Table 1. General assumptions about marketrequirements are summarized in Table 9a. The base station antenna height must be above the average roof top height of12 m.
TABLE 9a
Vehicular deployment model market requirements
The specific assumptions about the vehicular physical deployment environment are summarized in Table 9b.
TABLE 9b
Vehicular deployment model physical environment
In addition, proponents should provide information on how high speed up to 500 km/h can be handled.
1.3.2.4 Mixed-cell pedestrian/vehicular test environment deployment model
This deployment scenario describes conditions relevant to the operation of a IMT-2000 system that might be found inthe mixed test environment. The test service requirements for the mixed-cell environment are listed in Table 1. Thegeneral assumptions about market requirements are summarized in Table 10a. The link budget uses the pedestrian andvehicular ones which have been calculated before. The interference from the large cells to the small cells and vice versashould be accounted for, if necessary.
Type Area(km2)
Potential users perkm2
Building penetrationloss/standard deviation
(dB)
Log-normal standarddeviation
(dB)
Mobile velocity(km/h)
Outdoor 40 9 000 Not applicable 10 3
Indoor 25 12 000 12/8 12 3
Grade of service Traffic level(bhca/sub) (1) Coverage (2) Subscriber penetration
(% of potential users)
1% blocking 0.75 for speech 95% 10 for spectrum efficiency
0.75 for data 0.1 for coverage efficiency
(1), (2) See Table 7a.
Area(km2)
Potential users perkm2
Log-normal standarddeviation
(dB)
Mobile velocity(km/h)
150 3 500 10 120
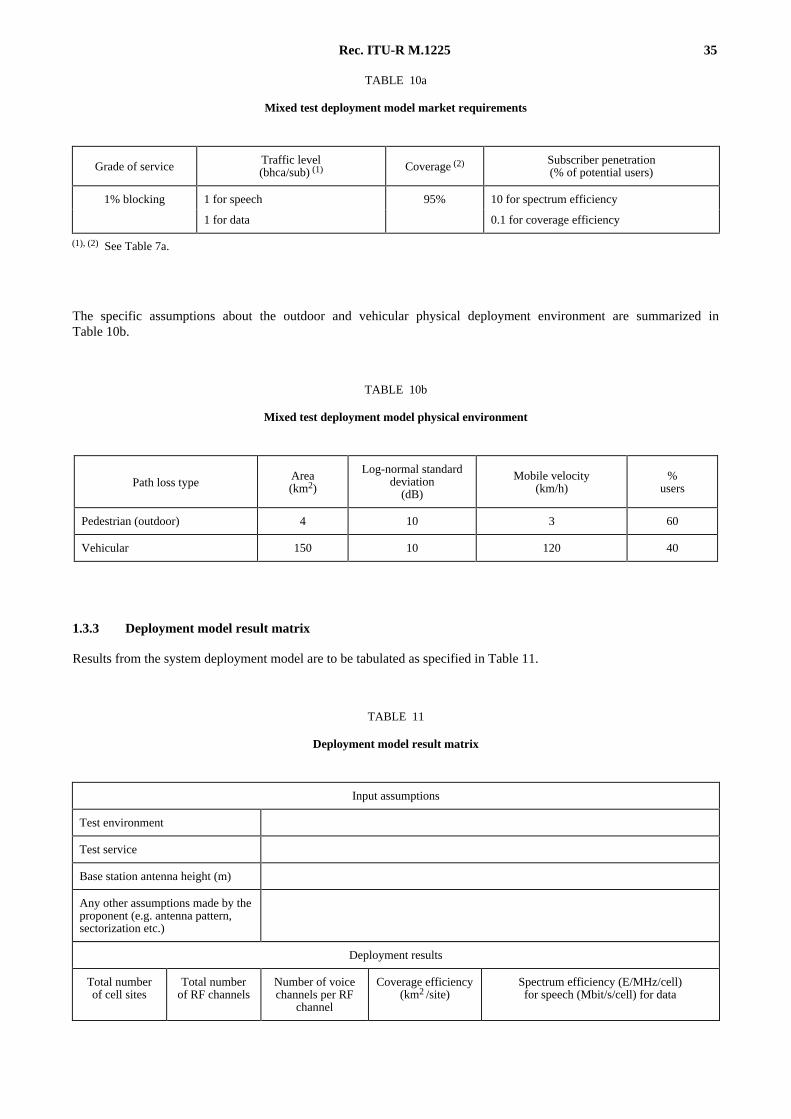
Rec. ITU-R M.1225 35
TABLE 10a
Mixed test deployment model market requirements
The specific assumptions about the outdoor and vehicular physical deployment environment are summarized inTable 10b.
TABLE 10b
Mixed test deployment model physical environment
1.3.3 Deployment model result matrix
Results from the system deployment model are to be tabulated as specified in Table 11.
TABLE 11
Deployment model result matrix
Grade of serviceTraffic level(bhca/sub) (1) Coverage (2) Subscriber penetration
(% of potential users)
1% blocking 1 for speech 95% 10 for spectrum efficiency
1 for data 0.1 for coverage efficiency
(1), (2) See Table 7a.
Path loss type Area(km2)
Log-normal standarddeviation
(dB)
Mobile velocity(km/h)
%users
Pedestrian (outdoor) 4 10 3 60
Vehicular 150 10 120 40
Input assumptions
Test environment
Test service
Base station antenna height (m)
Any other assumptions made by theproponent (e.g. antenna pattern,sectorization etc.)
Deployment results
Total numberof cell sites
Total numberof RF channels
Number of voicechannels per RF
channel
Coverage efficiency(km2 /site)
Spectrum efficiency (E/MHz/cell)for speech (Mbit/s/cell) for data
36 Rec. ITU-R M.1225
PART 2
Satellite component
The satellite component is of specific nature and cannot be evaluated in the same way as for the terrestrial component.Recommendation ITU-R M.1167, Framework for Satellite Component of International Mobile Telecommuni-cations-2000 (IMT-2000), provides details about this subject.
2.1 Propagation models
Satellite propagation normally includes a line of sight component and diffused/reflected multipath components, andhence tends to be Rician distributed with fading rates set by user and satellite motions; however, Rayleigh fading occurswhen the line of sight path is obstructed. Time delay spreads are likely no more than a few tens or hundreds ofnanoseconds and the levels of delayed components are low so that fading may be considered as flat in frequency for achannel with a bandwidth less than about 2 MHz.
Doppler offsets and rates of change are dependent upon relative motion between user and satellite. Gross Doppler shiftin the carrier is a function of satellite velocity while Doppler spreading is dependent on the motion of the mobile station.
For satellite applications in general a Rician fading model should be used to assess the performance of the RTT. Further,the aspects of multipath propagation and the maximum Doppler shifts are taken into account. The gross Doppler shift inthe carrier frequency due to the motion of the satellite and the mobile terminals should be included in the link levelsimulation.
2.1.1 Narrowband model
In the narrowband case the Rician model is characterized by the sum of the direct path component and thediffused/reflected multipath components. When the direct path component is diminished due to shadowing, it becomesthe Rayleigh fading.
If z(t) and w(t) denote the complex low pass representation of the channel input and output, then:
w t P z t P g t z t( ) ( ) ( ) ( )= +0 1 1
where:
P0 : strength of the direct component
P1 : strength of the multipath component
g1(t) : complex Gaussian process weighting the multipath component.
The general amplitude distribution of the Rician channel is characterized by (probability density-function, pdf):
pdf aa
PI
a P
P
a P
P( ) = ⋅ ⋅
− +
22
10
0
1
20
1e
The ratio c of P0 and P1 is the direct-to-multipath signal power ratio and is called the Rician factor, K, usually expressedin dB value as:
K = 10 log (P0 /P1) = 10 log c
The Doppler spectrum of g(t) is described by the Rician case in § 2.1.3.
The special case when P0 = 0, i.e. K = –∞ is called the Rayleigh fading channel and its amplitude distribution ischaracterized by:
pdf aa
P
a
P( ) = ⋅−
21
2
1e
with P1 as the mean received power. The Doppler spectrum of g(t) is described here by the classical case in § 2.1.3.

Rec. ITU-R M.1225 37
Rician factor values in Table 12 should be considered. Note that the attenuation of the direct path component due toshadowing should also be considered as indicated in this Table.
TABLE 12
Rician factors for satellite environment
2.1.2 Wideband model
Satellite cell wideband propagation models for the 2 GHz band are proposed to represent the different environments:
– rural,
– suburban,
– urban,which are based on extensive measurement campaigns. These models are typical in the elevation angles ranging from15° to 55°. In addition to the narrowband description echoes due to multipath signals (near echoes) have to be taken intoaccount according to:
w t P z t P g t z t P g t z ti i ii
M
( ) ( ) ( ) ( ) ( ) ( )= + + −=∑0 1 1
2
τ
This model corresponds to a tapped-delay line structure with a fixed number M of taps with a direct path and M – 1echoes with tap delays τi and randomly time varying tap amplitudes. Each tap is described by its:
– complex time varying amplitude P g ti i ( ) with variance Pi relative to free space propagation;
– delay τi relative to the first path;
– Rayleigh amplitude distribution of P g ti i ( ) (with i > 1);
– Doppler spectrum.
2.1.3 Description of Doppler spectra
With respect to the LOS and NLOS situations of the direct component and the Rayleigh amplitude distribution of thedelayed components two types of Doppler spectra were chosen. The power spectrum of gi(t) with i > 0 is called theDoppler spectrum and is modelled by:
– Classic Doppler power density spectrum:
( ) ( )G Gi
maxsat
max
sat max sat maxυ υ
π υυ υ
υ
υ υ υ υ υ= =
⋅ −
− ≤ ≤ +1
12
–
for
υmax is related to the speed V of the mobile terminal:
υλmaxV=
where:
V : velocity of the mobile
λ : wavelength at the carrier frequency.
Rician factor, K(dB) Direct path component, P0 Multipath component, P1
10 1.0 0.1
7 0.5 0.1
3 0.2 0.1
–∞ 0.0 0.1
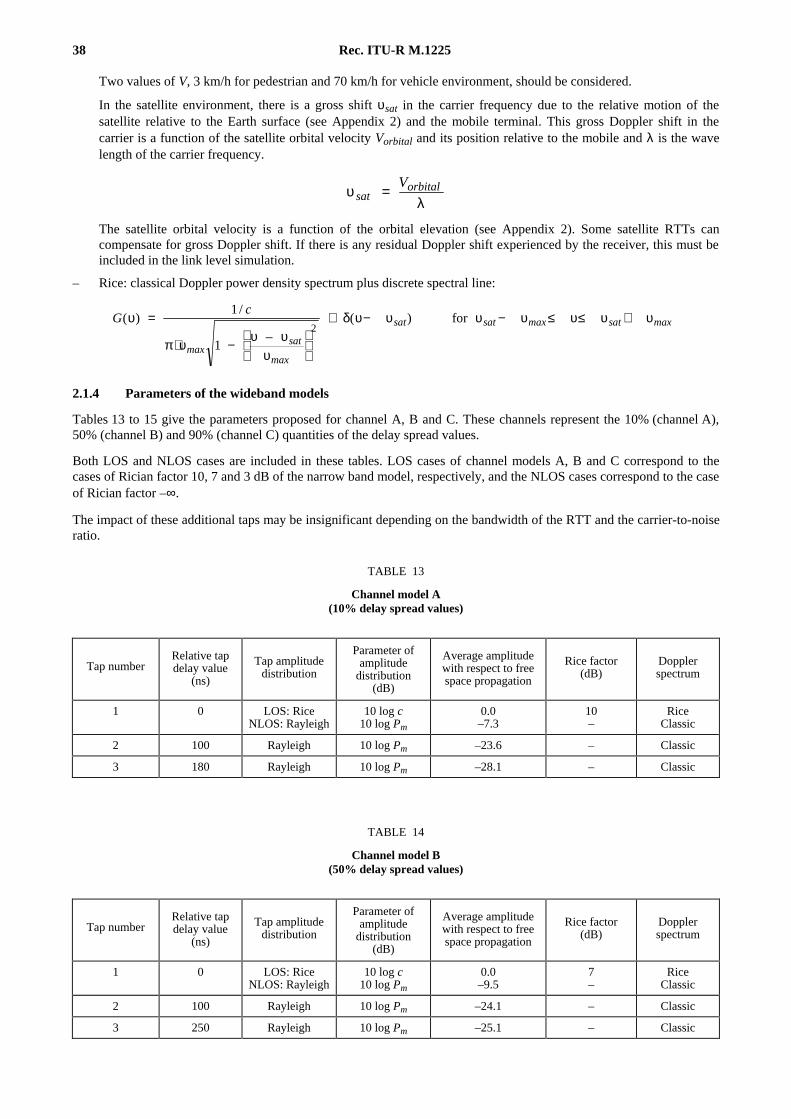
38 Rec. ITU-R M.1225
Two values of V, 3 km/h for pedestrian and 70 km/h for vehicle environment, should be considered.
In the satellite environment, there is a gross shift υsat in the carrier frequency due to the relative motion of thesatellite relative to the Earth surface (see Appendix 2) and the mobile terminal. This gross Doppler shift in thecarrier is a function of the satellite orbital velocity Vorbital and its position relative to the mobile and λ is the wavelength of the carrier frequency.
υλsat
orbitalV=
The satellite orbital velocity is a function of the orbital elevation (see Appendix 2). Some satellite RTTs cancompensate for gross Doppler shift. If there is any residual Doppler shift experienced by the receiver, this must beincluded in the link level simulation.
– Rice: classical Doppler power density spectrum plus discrete spectral line:
Gc
maxsat
max
sat sat max sat max( )/
–
( )υ
π υ υ υυ
δ υ υ υ υ υ υ υ=
⋅ −
+ − − ≤ ≤ +1
12
for
2.1.4 Parameters of the wideband models
Tables 13 to 15 give the parameters proposed for channel A, B and C. These channels represent the 10% (channel A),50% (channel B) and 90% (channel C) quantities of the delay spread values.
Both LOS and NLOS cases are included in these tables. LOS cases of channel models A, B and C correspond to thecases of Rician factor 10, 7 and 3 dB of the narrow band model, respectively, and the NLOS cases correspond to the caseof Rician factor –∞.
The impact of these additional taps may be insignificant depending on the bandwidth of the RTT and the carrier-to-noiseratio.
TABLE 13
Channel model A(10% delay spread values)
TABLE 14
Channel model B(50% delay spread values)
Tap numberRelative tapdelay value
(ns)
Tap amplitudedistribution
Parameter ofamplitude
distribution(dB)
Average amplitudewith respect to freespace propagation
Rice factor(dB)
Dopplerspectrum
1 0 LOS: RiceNLOS: Rayleigh
10 log c10 log Pm
0.0–7.3
10–
RiceClassic
2 100 Rayleigh 10 log Pm –23.6 – Classic
3 180 Rayleigh 10 log Pm –28.1 – Classic
Tap numberRelative tapdelay value
(ns)
Tap amplitudedistribution
Parameter ofamplitude
distribution(dB)
Average amplitudewith respect to freespace propagation
Rice factor(dB)
Dopplerspectrum
1 0 LOS: RiceNLOS: Rayleigh
10 log c10 log Pm
0.0–9.5
7–
RiceClassic
2 100 Rayleigh 10 log Pm –24.1 – Classic
3 250 Rayleigh 10 log Pm –25.1 – Classic
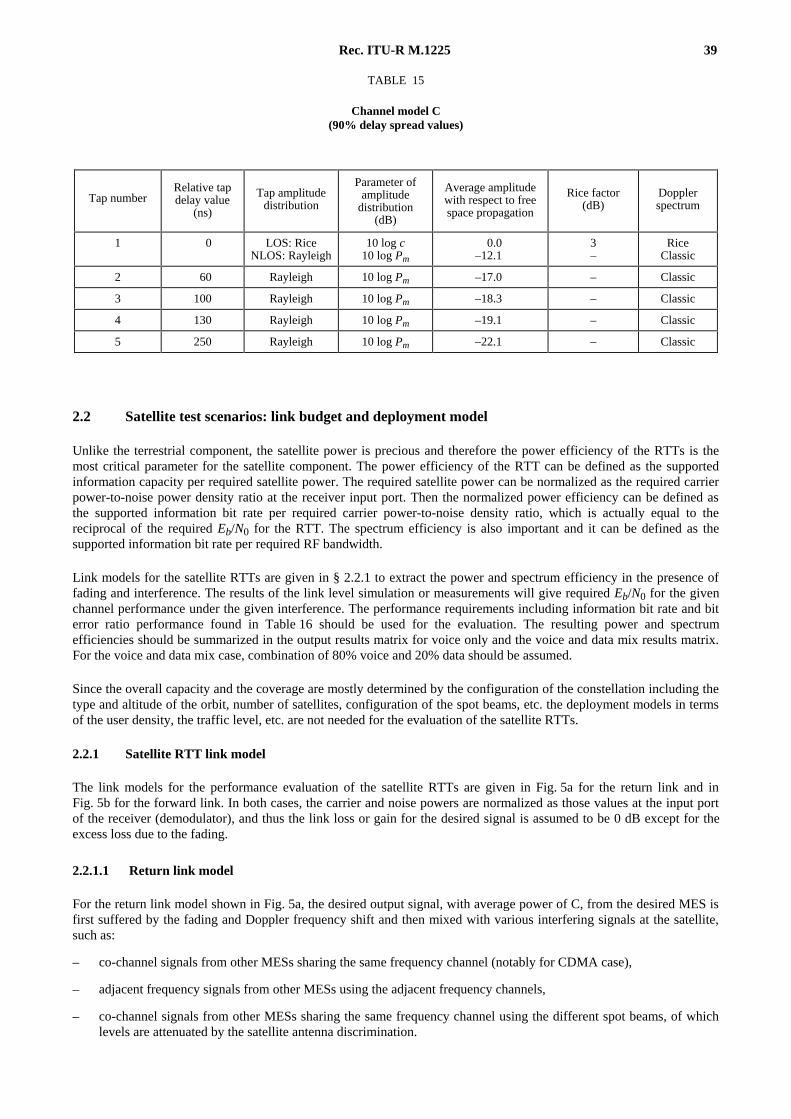
Rec. ITU-R M.1225 39
TABLE 15
Channel model C(90% delay spread values)
2.2 Satellite test scenarios: link budget and deployment model
Unlike the terrestrial component, the satellite power is precious and therefore the power efficiency of the RTTs is themost critical parameter for the satellite component. The power efficiency of the RTT can be defined as the supportedinformation capacity per required satellite power. The required satellite power can be normalized as the required carrierpower-to-noise power density ratio at the receiver input port. Then the normalized power efficiency can be defined asthe supported information bit rate per required carrier power-to-noise density ratio, which is actually equal to thereciprocal of the required Eb/N0 for the RTT. The spectrum efficiency is also important and it can be defined as thesupported information bit rate per required RF bandwidth.
Link models for the satellite RTTs are given in § 2.2.1 to extract the power and spectrum efficiency in the presence offading and interference. The results of the link level simulation or measurements will give required Eb/N0 for the givenchannel performance under the given interference. The performance requirements including information bit rate and biterror ratio performance found in Table 16 should be used for the evaluation. The resulting power and spectrumefficiencies should be summarized in the output results matrix for voice only and the voice and data mix results matrix.For the voice and data mix case, combination of 80% voice and 20% data should be assumed.
Since the overall capacity and the coverage are mostly determined by the configuration of the constellation including thetype and altitude of the orbit, number of satellites, configuration of the spot beams, etc. the deployment models in termsof the user density, the traffic level, etc. are not needed for the evaluation of the satellite RTTs.
2.2.1 Satellite RTT link model
The link models for the performance evaluation of the satellite RTTs are given in Fig. 5a for the return link and inFig. 5b for the forward link. In both cases, the carrier and noise powers are normalized as those values at the input portof the receiver (demodulator), and thus the link loss or gain for the desired signal is assumed to be 0 dB except for theexcess loss due to the fading.
2.2.1.1 Return link model
For the return link model shown in Fig. 5a, the desired output signal, with average power of C, from the desired MES isfirst suffered by the fading and Doppler frequency shift and then mixed with various interfering signals at the satellite,such as:
– co-channel signals from other MESs sharing the same frequency channel (notably for CDMA case),
– adjacent frequency signals from other MESs using the adjacent frequency channels,
– co-channel signals from other MESs sharing the same frequency channel using the different spot beams, of whichlevels are attenuated by the satellite antenna discrimination.
Tap numberRelative tapdelay value
(ns)
Tap amplitudedistribution
Parameter ofamplitude
distribution(dB)
Average amplitudewith respect to freespace propagation
Rice factor(dB)
Dopplerspectrum
1 0 LOS: RiceNLOS: Rayleigh
10 log c10 log Pm
0.0–12.1
3–
RiceClassic
2 60 Rayleigh 10 log Pm –17.0 – Classic
3 100 Rayleigh 10 log Pm –18.3 – Classic
4 130 Rayleigh 10 log Pm –19.1 – Classic
5 250 Rayleigh 10 log Pm –22.1 – Classic
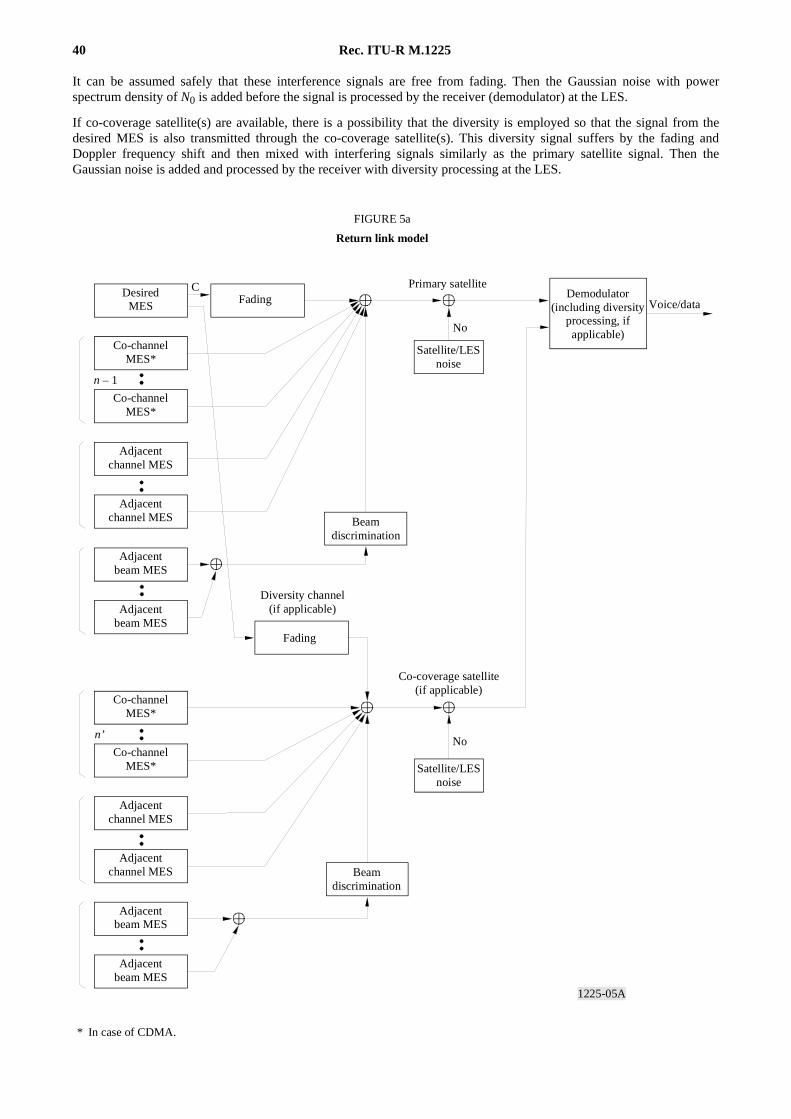
40 Rec. ITU-R M.1225
It can be assumed safely that these interference signals are free from fading. Then the Gaussian noise with powerspectrum density of N0 is added before the signal is processed by the receiver (demodulator) at the LES.
If co-coverage satellite(s) are available, there is a possibility that the diversity is employed so that the signal from thedesired MES is also transmitted through the co-coverage satellite(s). This diversity signal suffers by the fading andDoppler frequency shift and then mixed with interfering signals similarly as the primary satellite signal. Then theGaussian noise is added and processed by the receiver with diversity processing at the LES.
1225-05A
C
n’
n – 1
FIGURE 5a
Return link model
DesiredMES
Co-channelMES*
Co-channelMES*
Adjacentchannel MES
Adjacentchannel MES
Adjacentbeam MES
Adjacentbeam MES
Co-channelMES*
Co-channelMES*
Adjacentchannel MES
Adjacentbeam MES
Adjacentchannel MES
Adjacentbeam MES
* In case of CDMA.
Fading Demodulator(including diversity
processing, ifapplicable)
Satellite/LESnoise
Primary satellite
Voice/data
Beamdiscrimination
Fading
Satellite/LESnoise
Beamdiscrimination
Diversity channel(if applicable)
Co-coverage satellite(if applicable)
No
No
FIGURE 5a 1225-05A

Rec. ITU-R M.1225 41
2.2.1.2 Forward link model
For the forward link model shown in Fig. 5b, the desired output signal, with average power of C, from the primarysatellite is first mixed with various interfering signals at the satellite, such as:
– co-channel signals to other MESs sharing the same frequency channel (notably for CDMA case):
– adjacent frequency signals to other MESs using the adjacent frequency channels;
– co-channel signals to other MESs sharing the same frequency channel using the different spot beams, of whichlevels are attenuated by the satellite antenna discrimination.
Then the mixed signals suffer by the fading and Doppler frequency shift. Then the Gaussian noise with power spectrumdensity of N0 is added before the signal is processed by the receiver (demodulator) of the MES.
If co-coverage satellite(s) are available, there is a possibility that the diversity is employed so that the signal to thedesired MES is also transmitted through the co-coverage satellite(s). This diversity signal suffers by the fading andDoppler shift after it is mixed with interfering signals similarly as the primary satellite signal. Then both the primary andco-coverage signals including the interference are mixed at the MES and processed by the receiver with diversityprocessing at the MES.
2.2.1.3 Inter-beam interference
For the interference from the other spot beams sharing the same frequency band, the following assumptions can beadequate for both return and forward links:
– for TDMA: 4 cell frequency reuse pattern and average beam discrimination of 20 dB should be assumed;
– for CDMA: full frequency reuse and average beam discrimination of 10 dB should be assumed.
Other sources of noise and interference are not taken into account for the sake of simplicity.
2.2.1.4 Derivation of power and spectrum efficiency
Then by using computer simulations and/or experimental measurements based on this model, the proponent shouldderive the minimum required value of C/N0 to achieve the objective performance in terms of frame and/or bit error ratiounder the designed full load condition. For the return link, the effect of the non-linearity of the HPA of the MESs shouldbe taken into account in the adjacent channel interference and demodulator performance.
In TDMA case, if the carrier supports n channels of user voice or data information of b bit/s, the power efficiency can bederived as:
Power efficiency = n × b / (C/N0) = 1 / (Eb /N0)
and the spectrum efficiency can be derived as:
Spectrum efficiency = r n b / B
where B is the required RF bandwidth for the carrier including half of the guard bands of both sides between theadjacent frequency channels, and r is the frequency reuse factor between spot beams which is assumed to be 0.25 forTDMA case.
Similarly in case of CDMA, if for return link up to n MESs within the coverage of a spot beam can transmit the signalsimultaneously in the same frequency channel as the desired MES signal, or for forward link up to n signals can betransmitted from a spot beam simultaneously in the same frequency channel, and still the required performance can beachieved, the power efficiency can be derived as:
Power efficiency = b / (C/N0) = 1 / (Eb /N0)
and the spectrum efficiency can be derived as:
Spectrum efficiency = r n b / B
where r is the frequency reuse factor which is assumed to be 1.0 for CDMA case. If there are co-coverage satellites, totalnumber of signals transmitted simultaneously in the same frequency channel from all co-coverage satellites to thedirection of the MES with effectively the same strength should be counted as n in the above formula for forward link.

42 Rec. ITU-R M.1225
1225-05b
C
n’
n – 1
C
FIGURE 5b
Forward link model
Desiredcarrier
Co-channelcarrier*
Adjacentchannel carrier
Adjacentbeam carrier
Co-channelcarrier*
Adjacentchannel carrier
Adjacentbeam carrier
* In case of CDMA.
FadingDemodulator
(including diversityprocessing, ifapplicable)
MESnoise
Primary satellite
Voice/data
Beamdiscrimination
Fading
Beamdiscrimination
Co-coverage satellite(if applicable)
Co-channelcarrier*
Adjacentchannel carrier
Adjacentbeam carrier
Diversity carrier(if applicable)
Co-channelcarrier*
Adjacentchannel carrier
Adjacentbeam carrier
No
FIGURE 5b/M.1225-05b = 21 CM
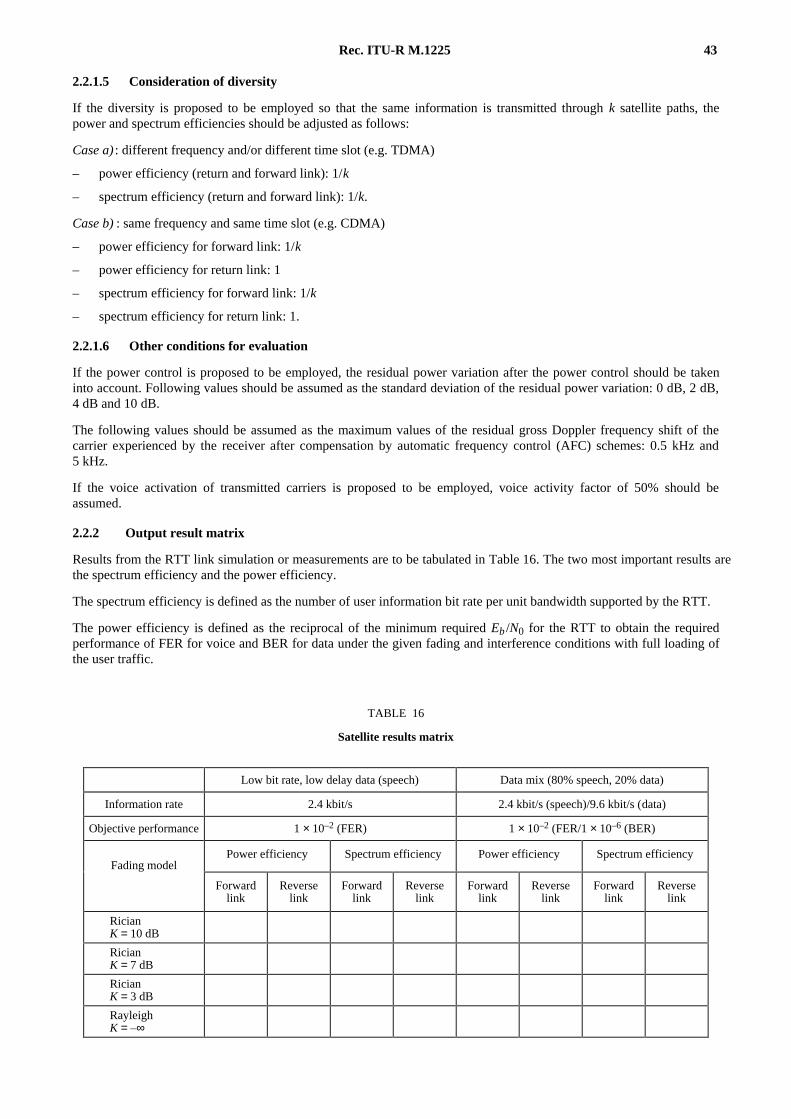
Rec. ITU-R M.1225 43
2.2.1.5 Consideration of diversity
If the diversity is proposed to be employed so that the same information is transmitted through k satellite paths, thepower and spectrum efficiencies should be adjusted as follows:
Case a) : different frequency and/or different time slot (e.g. TDMA)
– power efficiency (return and forward link): 1/k
– spectrum efficiency (return and forward link): 1/k.
Case b) : same frequency and same time slot (e.g. CDMA)
– power efficiency for forward link: 1/k
– power efficiency for return link: 1
– spectrum efficiency for forward link: 1/k
– spectrum efficiency for return link: 1.
2.2.1.6 Other conditions for evaluation
If the power control is proposed to be employed, the residual power variation after the power control should be takeninto account. Following values should be assumed as the standard deviation of the residual power variation: 0 dB, 2 dB,4 dB and 10 dB.
The following values should be assumed as the maximum values of the residual gross Doppler frequency shift of thecarrier experienced by the receiver after compensation by automatic frequency control (AFC) schemes: 0.5 kHz and5 kHz.
If the voice activation of transmitted carriers is proposed to be employed, voice activity factor of 50% should beassumed.
2.2.2 Output result matrix
Results from the RTT link simulation or measurements are to be tabulated in Table 16. The two most important results arethe spectrum efficiency and the power efficiency.
The spectrum efficiency is defined as the number of user information bit rate per unit bandwidth supported by the RTT.
The power efficiency is defined as the reciprocal of the minimum required Eb /N0 for the RTT to obtain the requiredperformance of FER for voice and BER for data under the given fading and interference conditions with full loading ofthe user traffic.
TABLE 16
Satellite results matrix
Low bit rate, low delay data (speech) Data mix (80% speech, 20% data)
Information rate 2.4 kbit/s 2.4 kbit/s (speech)/9.6 kbit/s (data)
Objective performance 1 × 10⁻² (FER) 1 × 10⁻² (FER/1 × 10–6 (BER)
Fading modelPower efficiency Spectrum efficiency Power efficiency Spectrum efficiency
Forwardlink
Reverselink
Forwardlink
Reverselink
Forwardlink
Reverselink
Forwardlink
Reverselink
RicianK = 10 dB
RicianK = 7 dB
RicianK = 3 dB
RayleighK = –∞
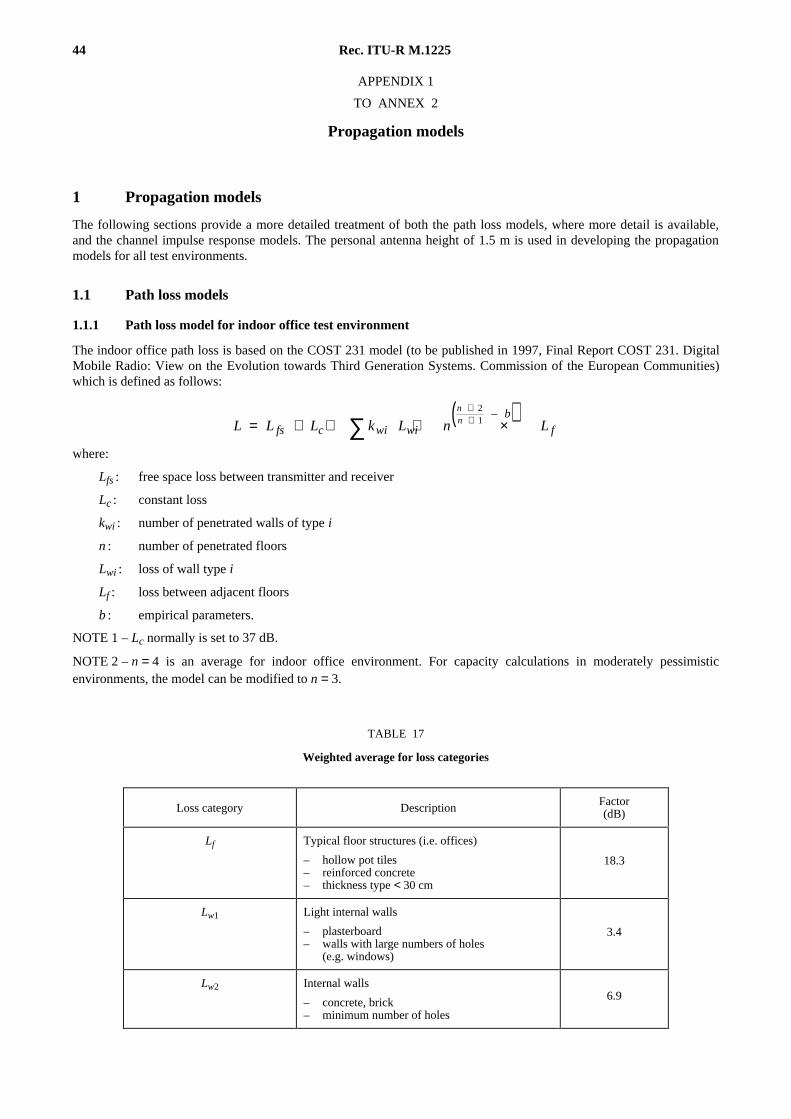
44 Rec. ITU-R M.1225
APPENDIX 1
TO ANNEX 2
Propagation models
1 Propagation models
The following sections provide a more detailed treatment of both the path loss models, where more detail is available,and the channel impulse response models. The personal antenna height of 1.5 m is used in developing the propagationmodels for all test environments.
1.1 Path loss models
1.1.1 Path loss model for indoor office test environment
The indoor office path loss is based on the COST 231 model (to be published in 1997, Final Report COST 231. DigitalMobile Radio: View on the Evolution towards Third Generation Systems. Commission of the European Communities)which is defined as follows:
( )L L L k L n Lfs c wi wi
b
f
nn= + + + ×∑
++
21
–
where:
Lfs : free space loss between transmitter and receiver
Lc : constant loss
kwi : number of penetrated walls of type i
n : number of penetrated floors
Lwi : loss of wall type i
Lf : loss between adjacent floors
b : empirical parameters.
NOTE 1 – Lc normally is set to 37 dB.
NOTE 2 – n = 4 is an average for indoor office environment. For capacity calculations in moderately pessimisticenvironments, the model can be modified to n = 3.
TABLE 17
Weighted average for loss categories
Loss category DescriptionFactor(dB)
Lf Typical floor structures (i.e. offices)
– hollow pot tiles– reinforced concrete– thickness type < 30 cm
18.3
Lw1 Light internal walls
– plasterboard– walls with large numbers of holes
(e.g. windows)
3.4
Lw2 Internal walls
– concrete, brick– minimum number of holes
6.9

Rec. ITU-R M.1225 45
Under the simplifying assumptions of the office environment the indoor path loss model has the following form:
( )L R n
nn= + + ×
++37 30 18 310
0 4621log .
– .
where:
R : transmitter-receiver separation
n : number of floors in the path.
1.1.2 Path loss model for outdoor to indoor and pedestrian test environment
The following model is intended for the outdoor to indoor and pedestrian test environment. In the general model foroutdoor transmission loss, the total transmission loss L (dB) between isotropic antennas is expressed as the sum of freespace loss, Lfs, the diffraction loss from rooftop to the street, Lrts, and the reduction due to multiple screen diffractionpast rows of buildings, Lmsd. In this model, Lfs and Lrts are independent of the base station antenna height, while Lmsd isdependent on whether the base station antenna is at, below or above building heights. In general the model is given as:
L(R) = Lfs + Lrts + Lmsd
Given a mobile-to-base separation R, the free space loss between them is given by:
Lfs = –10410
2
logλπ R
The diffraction from the rooftop down to the street level gives the excess loss to the mobile station:
Lr
rts = − −+
102
1 1
210 2
2
logλ
π θ π θ
where:
θ =
−tan 1 ∆h
xm
( )r h xm= +∆ 2 2
∆hm is the difference between the mean building height and the mobile antenna height; x is the horizontal distancebetween the mobile and the diffracting edges.
For the general model, the multiple screen diffraction loss from the base antennas due to propagation past rows ofbuildings is:
L Qmsd M= − 10 102log
where QM is a factor dependent on the relative height of the base station antenna as being either at, below or above themean building heights (see Note 2).
In this case the base-station antenna height is near mean rooftop level, then:
Q d RM = /
where d is the average separation between rows of buildings.
The total transmission loss for the near rooftop case then becomes:
LR r
d R= −
−
+
−102 2
102
1 1
21010
2
10 2
2
102log log – log ( / )
λπ
λπ θ π θ
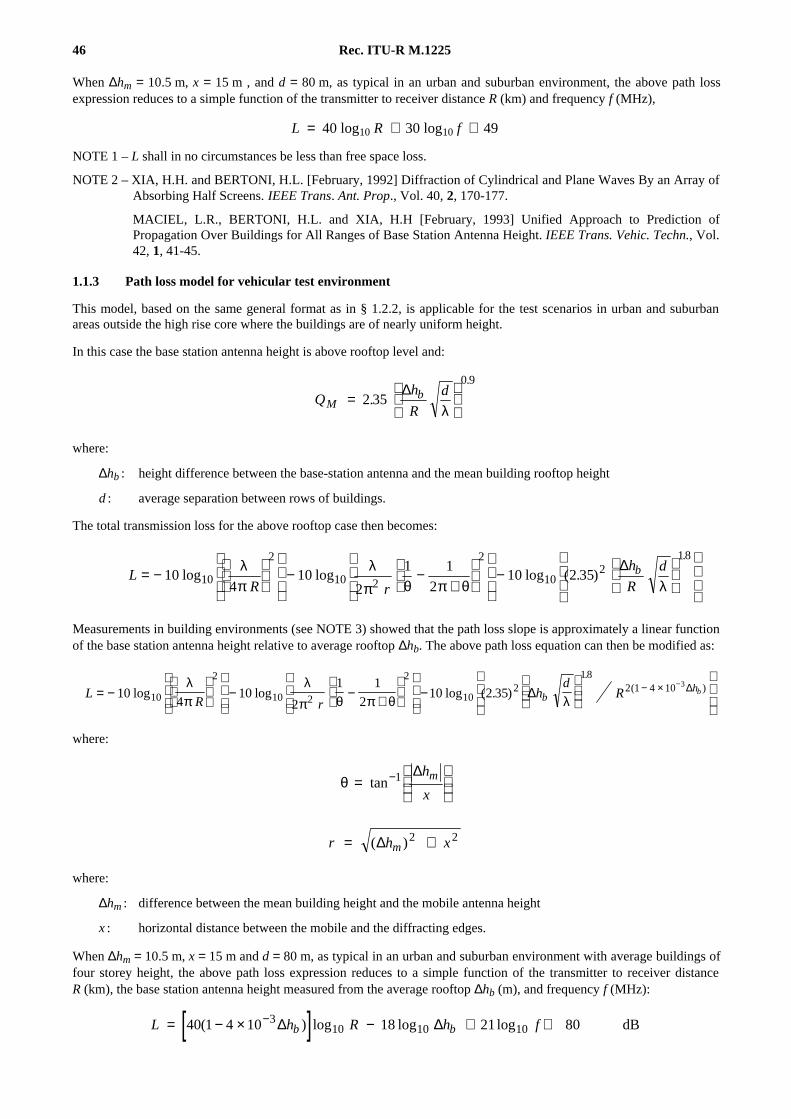
46 Rec. ITU-R M.1225
When ∆hm = 10.5 m, x = 15 m , and d = 80 m, as typical in an urban and suburban environment, the above path lossexpression reduces to a simple function of the transmitter to receiver distance R (km) and frequency f (MHz),
L = 40 log10 R + 30 log10 f + 49
NOTE 1 – L shall in no circumstances be less than free space loss.
NOTE 2 – XIA, H.H. and BERTONI, H.L. [February, 1992] Diffraction of Cylindrical and Plane Waves By an Array ofAbsorbing Half Screens. IEEE Trans. Ant. Prop., Vol. 40, 2, 170-177.
MACIEL, L.R., BERTONI, H.L. and XIA, H.H [February, 1993] Unified Approach to Prediction ofPropagation Over Buildings for All Ranges of Base Station Antenna Height. IEEE Trans. Vehic. Techn., Vol.42, 1, 41-45.
1.1.3 Path loss model for vehicular test environment
This model, based on the same general format as in § 1.2.2, is applicable for the test scenarios in urban and suburbanareas outside the high rise core where the buildings are of nearly uniform height.
In this case the base station antenna height is above rooftop level and:
Qh
R
dM
b=
2 35
0 9
.
.∆
λ
where:
∆hb : height difference between the base-station antenna and the mean building rooftop height
d : average separation between rows of buildings.
The total transmission loss for the above rooftop case then becomes:
LR r
h
R
db= −
− −+
−
104
102
1 1
210 2 3510
2
10 2
2
102
18
log log log ( . )
.λπ
λπ θ π θ λ
∆
Measurements in building environments (see NOTE 3) showed that the path loss slope is approximately a linear functionof the base station antenna height relative to average rooftop ∆hb. The above path loss equation can then be modified as:
LR r
hd
Rbhb= −
− −+
−
− × −10
410
2
1 1
210 2 3510
2
10 2
2
102
182 1 4 10 3
log log log ( . )
.( )λ
πλ
π θ π θ λ∆ ∆
where:
θ =
−tan 1 ∆h
xm
r h xm= +( )∆ 2 2
where:
∆hm : difference between the mean building height and the mobile antenna height
x : horizontal distance between the mobile and the diffracting edges.
When ∆hm = 10.5 m, x = 15 m and d = 80 m, as typical in an urban and suburban environment with average buildings offour storey height, the above path loss expression reduces to a simple function of the transmitter to receiver distanceR (km), the base station antenna height measured from the average rooftop ∆hb (m), and frequency f (MHz):
[ ]L h R h fb b= − × − + +−40 1 4 10 18 21 80310 10 10( ) log log log∆ ∆ dB
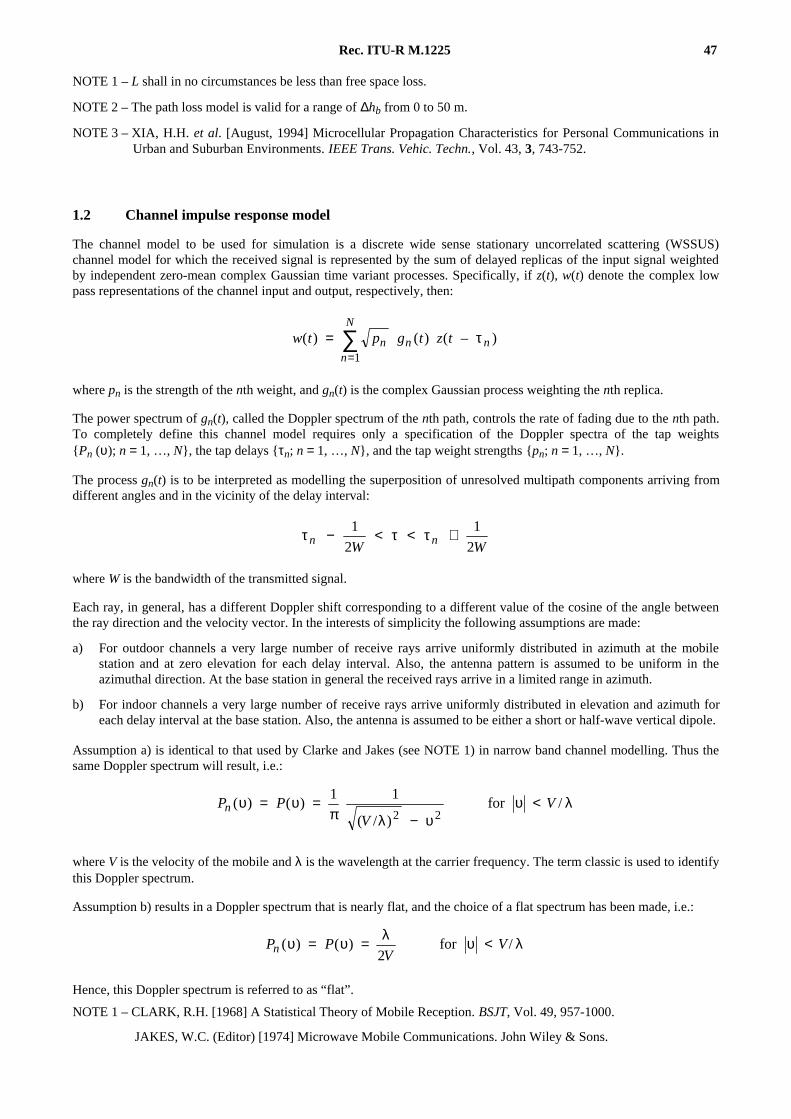
Rec. ITU-R M.1225 47
NOTE 1 – L shall in no circumstances be less than free space loss.
NOTE 2 – The path loss model is valid for a range of ∆hb from 0 to 50 m.
NOTE 3 – XIA, H.H. et al. [August, 1994] Microcellular Propagation Characteristics for Personal Communications inUrban and Suburban Environments. IEEE Trans. Vehic. Techn., Vol. 43, 3, 743-752.
1.2 Channel impulse response model
The channel model to be used for simulation is a discrete wide sense stationary uncorrelated scattering (WSSUS)channel model for which the received signal is represented by the sum of delayed replicas of the input signal weightedby independent zero-mean complex Gaussian time variant processes. Specifically, if z(t), w(t) denote the complex lowpass representations of the channel input and output, respectively, then:
w t p g t z tn nn
N
n( ) ( ) ( – )==
∑1
τ
where pn is the strength of the nth weight, and gn(t) is the complex Gaussian process weighting the nth replica.
The power spectrum of gn(t), called the Doppler spectrum of the nth path, controls the rate of fading due to the nth path.To completely define this channel model requires only a specification of the Doppler spectra of the tap weights{Pn (υ); n = 1, …, N}, the tap delays {τn; n = 1, …, N}, and the tap weight strengths {pn; n = 1, …, N}.
The process gn(t) is to be interpreted as modelling the superposition of unresolved multipath components arriving fromdifferent angles and in the vicinity of the delay interval:
τ τ τn nW W− < < +1
2
1
2
where W is the bandwidth of the transmitted signal.
Each ray, in general, has a different Doppler shift corresponding to a different value of the cosine of the angle betweenthe ray direction and the velocity vector. In the interests of simplicity the following assumptions are made:
a) For outdoor channels a very large number of receive rays arrive uniformly distributed in azimuth at the mobilestation and at zero elevation for each delay interval. Also, the antenna pattern is assumed to be uniform in theazimuthal direction. At the base station in general the received rays arrive in a limited range in azimuth.
b) For indoor channels a very large number of receive rays arrive uniformly distributed in elevation and azimuth foreach delay interval at the base station. Also, the antenna is assumed to be either a short or half-wave vertical dipole.
Assumption a) is identical to that used by Clarke and Jakes (see NOTE 1) in narrow band channel modelling. Thus thesame Doppler spectrum will result, i.e.:
P PV
Vn ( ) ( )( / )
/υ υπ λ υ
υ λ= =−
<1 12 2
for
where V is the velocity of the mobile and λ is the wavelength at the carrier frequency. The term classic is used to identifythis Doppler spectrum.
Assumption b) results in a Doppler spectrum that is nearly flat, and the choice of a flat spectrum has been made, i.e.:
P PV
Vn ( ) ( ) /υ υ λ υ λ= = <2
for
Hence, this Doppler spectrum is referred to as “flat”.
NOTE 1 – CLARK, R.H. [1968] A Statistical Theory of Mobile Reception. BSJT, Vol. 49, 957-1000.
JAKES, W.C. (Editor) [1974] Microwave Mobile Communications. John Wiley & Sons.
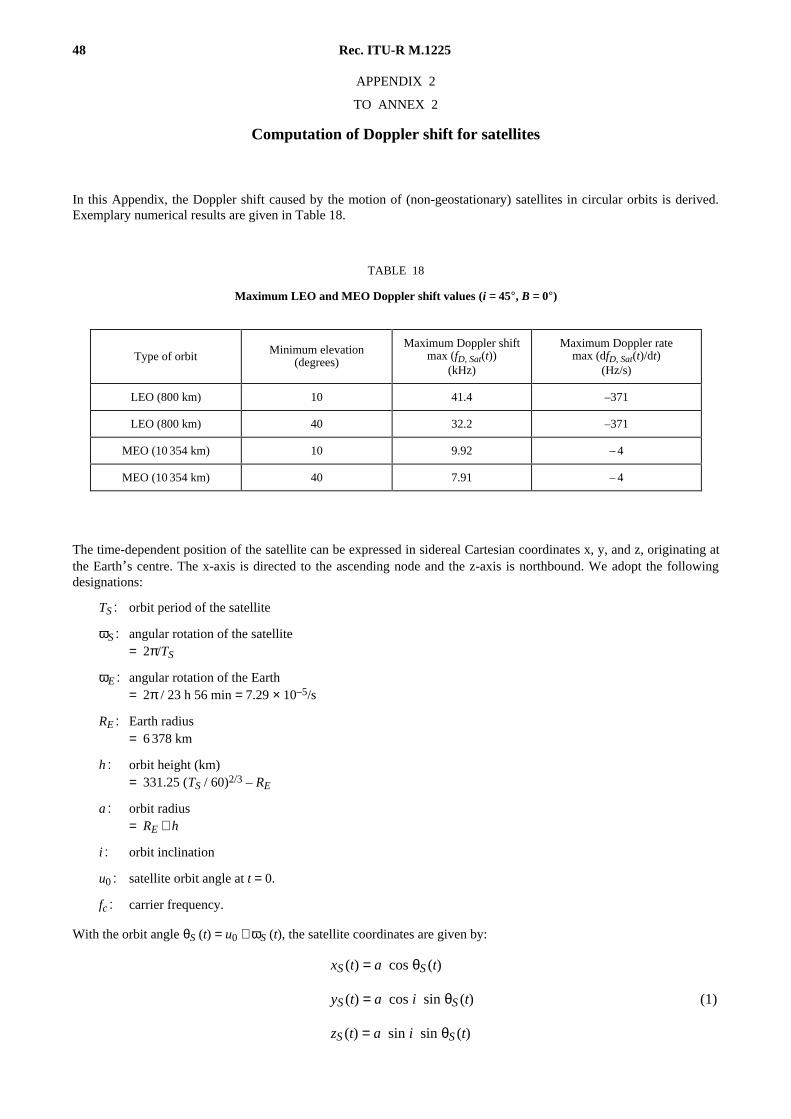
48 Rec. ITU-R M.1225
APPENDIX 2
TO ANNEX 2
Computation of Doppler shift for satellites
In this Appendix, the Doppler shift caused by the motion of (non-geostationary) satellites in circular orbits is derived.Exemplary numerical results are given in Table 18.
TABLE 18
Maximum LEO and MEO Doppler shift values (i = 45°, B = 0°)
The time-dependent position of the satellite can be expressed in sidereal Cartesian coordinates x, y, and z, originating atthe Earth’ s centre. The x-axis is directed to the ascending node and the z-axis is northbound. We adopt the followingdesignations:
TS : orbit period of the satellite
ωS : angular rotation of the satellite= 2π/TS
ωE : angular rotation of the Earth= 2π / 23 h 56 min = 7.29 × 10⁻⁵/s
RE : Earth radius= 6 378 km
h : orbit height (km)= 331.25 (TS / 60)2/3 – RE
a : orbit radius= RE + h
i : orbit inclination
u0 : satellite orbit angle at t = 0.
fc : carrier frequency.
With the orbit angle θS (t) = u0 + ωS (t), the satellite coordinates are given by:
xS (t) = a cos θS (t)
yS (t) = a cos i sin θS (t) (1)
zS (t) = a sin i sin θS (t)
Type of orbit Minimum elevation(degrees)
Maximum Doppler shiftmax (fD, Sat(t))
(kHz)
Maximum Doppler ratemax (dfD, Sat(t)/dt)
(Hz/s)
LEO (800 km) 10 41.4 –371
LEO (800 km) 40 32.2 –371
MEO (10 354 km) 10 9.92 – 4
MEO (10 354 km) 40 7.91 – 4

Rec. ITU-R M.1225 49
The coordinates of the user are determined by his/her latitude B and longitude L. Assuming that at time t = 0longitude 0° coincides with the ascending node, the time-varying longitude angle of the user is θE (t) = L + ωE (t), and theuser coordinates are:
xE (t) = RE cos B cos θE (t)
yE (t) = RE cos B sin θE (t) (2)
zE (t) = RE sin B
The slant range as a function of time is:
s t x t x t a R a R tS E E E( ) ( ) ( ) cos ( )= − = + −r r 2 2 2 ϕ (3)
with ϕ designating the angle between rxS and
rxE , and
cos ( ) cos cos ( ) cos ( ) cos cos sin ( ) sin ( ) sin sin sin ( )ϕ θ θ θ θ θt B t t i B t t i B tS E S E S= + + (4)
The time-varying Doppler shift is determined by:
υsatcf
c
s t
t= ⋅–
( )d
d
[= ⋅ − +f
c
a R
s ti B tc E
E S S( )( cos ) cos cos ( )ω ω θ (5)
]+ − +( cos ) cos cos ( ) sin ( ) sin sin cos ( )ω ω θ θ ω θS E S E S Si B t t i B t
The time-varying elevation angle is given by:
( )ε ϕ( ) sin
( ) ( ) ( )
( )sin
cos ( )
( )t
x t x t x t
R s t
a t R
s tE S E
E
E=⋅ −
⋅
= −
arc arc
r r r
(6)
In the following, we consider a situation where the satellite directly passes over the user position (the passing occursat t = 0). This should be a rather good approximation for the worst-case with regard to Doppler shift. The user latitudecan be chosen within –Bmax ≤ B ≤ Bmax, with:
{ }B i imax = ° −min , 180 (7)
In order to have the overpass occurring at t = 0, the initial phases u0,1 for the ascending overpass and u0,2 for thedescending overpass are:
uB
i0 1, sinsin
sin=
arc
(8)u u0 2 0 1, ,= −π
and the respective user longitudes are:
LB
i1 =
arc
tan
tansin
LL
L
i
i21
1
180
180
90
90=
° −− ° −
≤ °> °
for
for
(9)
The slant range, Doppler shift, and elevation can now be evaluated from (3), (5) and (6). At the moment of the overpasswe have ϕ = 0, s = h, fD, Sat = 0 and ε = 90°.
To a good approximation, the maximum Doppler shift occurs when the satellite appears at minimum elevationangle εmin. The Doppler shift is almost independent from the user latitude B.
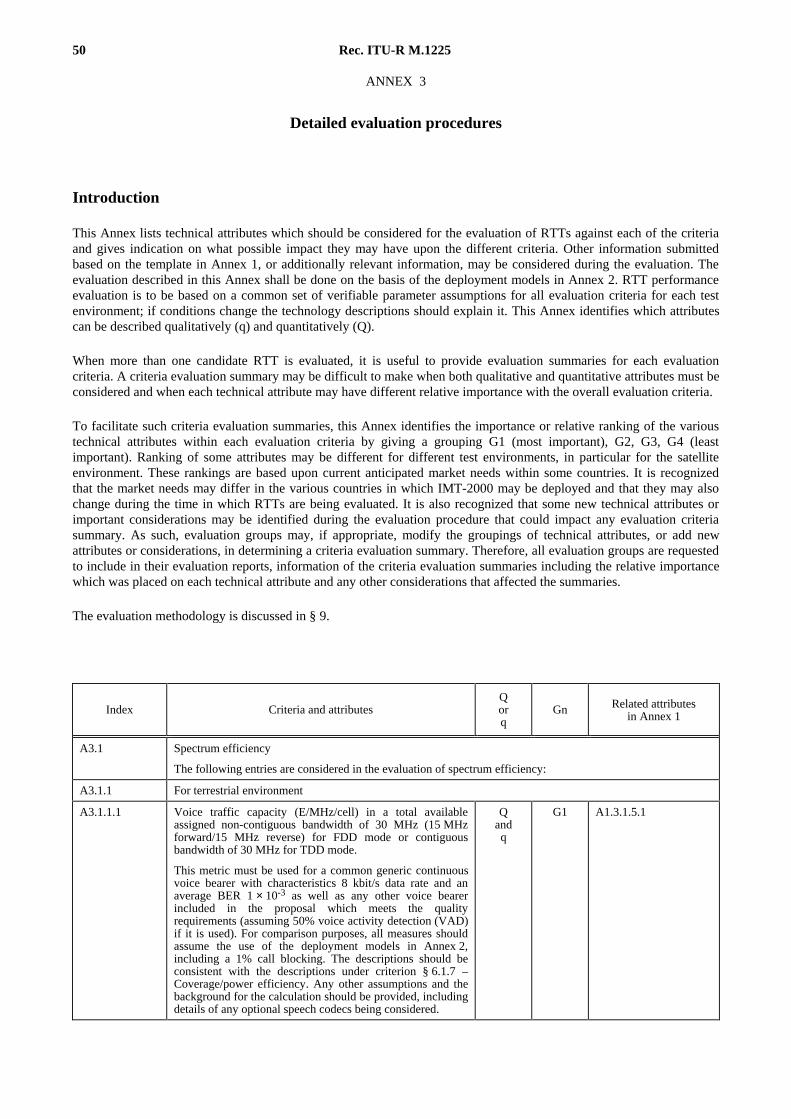
50 Rec. ITU-R M.1225
ANNEX 3
Detailed evaluation procedures
Introduction
This Annex lists technical attributes which should be considered for the evaluation of RTTs against each of the criteriaand gives indication on what possible impact they may have upon the different criteria. Other information submittedbased on the template in Annex 1, or additionally relevant information, may be considered during the evaluation. Theevaluation described in this Annex shall be done on the basis of the deployment models in Annex 2. RTT performanceevaluation is to be based on a common set of verifiable parameter assumptions for all evaluation criteria for each testenvironment; if conditions change the technology descriptions should explain it. This Annex identifies which attributescan be described qualitatively (q) and quantitatively (Q).
When more than one candidate RTT is evaluated, it is useful to provide evaluation summaries for each evaluationcriteria. A criteria evaluation summary may be difficult to make when both qualitative and quantitative attributes must beconsidered and when each technical attribute may have different relative importance with the overall evaluation criteria.
To facilitate such criteria evaluation summaries, this Annex identifies the importance or relative ranking of the varioustechnical attributes within each evaluation criteria by giving a grouping G1 (most important), G2, G3, G4 (leastimportant). Ranking of some attributes may be different for different test environments, in particular for the satelliteenvironment. These rankings are based upon current anticipated market needs within some countries. It is recognizedthat the market needs may differ in the various countries in which IMT-2000 may be deployed and that they may alsochange during the time in which RTTs are being evaluated. It is also recognized that some new technical attributes orimportant considerations may be identified during the evaluation procedure that could impact any evaluation criteriasummary. As such, evaluation groups may, if appropriate, modify the groupings of technical attributes, or add newattributes or considerations, in determining a criteria evaluation summary. Therefore, all evaluation groups are requestedto include in their evaluation reports, information of the criteria evaluation summaries including the relative importancewhich was placed on each technical attribute and any other considerations that affected the summaries.
The evaluation methodology is discussed in § 9.
Index Criteria and attributesQorq
Gn Related attributesin Annex 1
A3.1 Spectrum efficiency
The following entries are considered in the evaluation of spectrum efficiency:
A3.1.1 For terrestrial environment
A3.1.1.1 Voice traffic capacity (E/MHz/cell) in a total availableassigned non-contiguous bandwidth of 30 MHz (15 MHzforward/15 MHz reverse) for FDD mode or contiguousbandwidth of 30 MHz for TDD mode.
This metric must be used for a common generic continuousvoice bearer with characteristics 8 kbit/s data rate and anaverage BER 1 × 10⁻³ as well as any other voice bearerincluded in the proposal which meets the qualityrequirements (assuming 50% voice activity detection (VAD)if it is used). For comparison purposes, all measures shouldassume the use of the deployment models in Annex 2,including a 1% call blocking. The descriptions should beconsistent with the descriptions under criterion § 6.1.7 –Coverage/power efficiency. Any other assumptions and thebackground for the calculation should be provided, includingdetails of any optional speech codecs being considered.
Qandq
G1 A1.3.1.5.1

Rec. ITU-R M.1225 51
A3.1.1.2 Information capacity (Mbit/s/MHz/cell) in a total availableassigned non-contiguous bandwidth of 30 MHz (15 MHzforward/15 MHz reverse) for FDD mode or contiguousbandwidth of 30 MHz for TDD mode.
The information capacity is to be calculated for each testservice or traffic mix for the appropriate test environments.This is the only measure that would be used in the case ofmultimedia, or for classes of services using multiple speechcoding bit rates. Information capacity is the instantaneousaggregate user bit rate of all active users over all channelswithin the system on a per cell basis. If the user traffic (voiceand/or data) is asymmetric and the system can takeadvantage of this characteristic to increase capacity, itshould be described qualitatively for the purposes ofevaluation.
Qandq
G1 A1.3.1.5.2
A3.1.2 For satellite environment
These values (§ A3.1.2.1 and A3.1.2.2) assume the use of the simulation conditions in Annex 2. The firstdefinition is valuable for comparing systems with identical user channel rates. The second definition is valuablefor comparing systems with different voice and data channel rates.
A3.1.2.1 Voice information capacity per required RF bandwidth(bit/s/Hz)
Q G1 A1.3.2.3.1
A3.1.2.2 Voice plus data information capacity per required RFbandwidth (bit/s/Hz)
Q G1 A1.3.2.3.2
A3.2 Technology complexity – Effect on cost of installation and operation
The considerations under criterion § 6.1.2 – Technology complexity apply only to the infrastructure, includingBSs (the handportable performance is considered elsewhere).
A3.2.1 Need for echo control Q G4 A1.3.7.2
The need for echo control is affected by the round trip delay,which is calculated as shown in Fig. 6.
A1.3.7.3
Referring to Fig. 6, consider the round trip delay with thevocoder (D1, ms) and also without that contributed by thevocoder (D2, ms).
NOTE 1 – The delay of the codec should be that specifiedby ITU-T for the common generic voice bearer and if thereare any proposals for optional codecs include theinformation about those also.
A3.2.2 Transmitter power and system linearity requirements
NOTE 1 – Satellite e.i.r.p. is not suitable for evaluation and comparison of RTTs because it depends verymuch on satellite orbit.
The RTT attributes in this section impact system cost and complexity, with the resultant desirable effects ofimproving overall performance in other evaluation criteria. They are as follows.
A3.2.2.1 Peak transmitter/carrier (Pb) power (not applicable tosatellite)
Q G1 A1.2.16.2.1
Peak transmitter power for the BS should be consideredbecause lower peak power contributes to lower cost. Notethat Pb may vary with test environment application. This isthe same peak transmitter power assumed in Annex 2, linkbudget template (Table 6).
A3.2.2.2 Broadband power amplifier (PA) (not applicable to satellite) Q G1 A1.4.10A1.2.16.2.1
Is a broadband power amplifier used or required? If so, whatare the peak and average transmitted power requirementsinto the antenna as measured in watts.
A1.2.16.2.2A1.5.5A1.2.5
A3.2.2.3 Linear base transmitter and broadband amplifier requirements (not applicable to satellite)

52 Rec. ITU-R M.1225
A3.2.2.3.1 Adjacent channel splatter/emission and intermodulationaffect system capacity and performance. Describe theserequirements and the linearity and filtering of the basetransmitter and broadband PA required to achieve them.
q G3 A1.4.2A1.4.10
A3.2.2.3.2 Also state the base transmitter and broadband PA (if one isused) peak to average transmitter output power, as a higherratio requires greater linearity, heat dissipation and cost.
Qandq
G2 A1.4.10A1.2.16.2.1A1.2.16.2.2
A3.2.2.4 Receiver linearity requirements (not applicable to satellite) q G4 A1.4.11A1.4.12
Is BS receiver linearity required? If so, state the receiverdynamic range required and the impact of signal inputvariation exceeding this range, e.g., loss of sensitivity andblocking.
A3.2.3 Power control characteristics (not applicable to satellite)Does the proposed RTT utilize transmitter power control? Ifso, is it used in both forward and reverse links? State thepower control range, step size (dB) and required accuracy,number of possible step sizes and number of power controlsper second, which are concerned with BS technologycomplexity.
Qandq
G4 A1.2.22A1.2.22.1A1.2.22.2A1.2.22.3A1.2.22.4A1.2.22.5
A3.2.4 Transmitter/receiver isolation requirement (not applicable tosatellite)
If FDD is used, specify the noted requirement and how it isachieved.
q G3 A1.2.2A1.2.2.2A1.2.2.1
A3.2.5 Digital signal processing requirements
A3.2.5.1 Digital signal processing can be a significant proportion ofthe hardware for some radio interface proposals. It cancontribute to the cost, size, weight and power consumptionof the BS and influence secondary factors such as heatmanagement and reliability. Any digital circuitry associatedwith the network interfaces should not be included. Howeverany special requirements for interfacing with these functionsshould be included.
Qandq
G2 A1.4.13
This section of the evaluation should analyse the detaileddescription of the digital signal processing requirements,including performance characteristics, architecture andalgorithms, in order to estimate the impact on complexity ofthe BSs. At a minimum the evaluation should review thesignal processing estimates (MOPS, memory requirements,gate counts) required for demodulation, equalization,channel coding, error correction, diversity processing(including Rake receivers), adaptive antenna arrayprocessing, modulation, A-D and D-A converters andmultiplexing as well as some IF and baseband filtering. Fornew technologies, there may be additional or alternativerequirements (such as FFTs).
Although specific implementations are likely to vary, goodsample descriptions should allow the relative cost,complexity and power consumption to be compared for thecandidate RTTs, as well as the size and the weight of thecircuitry. The descriptions should allow the evaluators toverify the signal processing requirement metrics, such asMOPS, memory and gate count, provided by the RTTproponent.
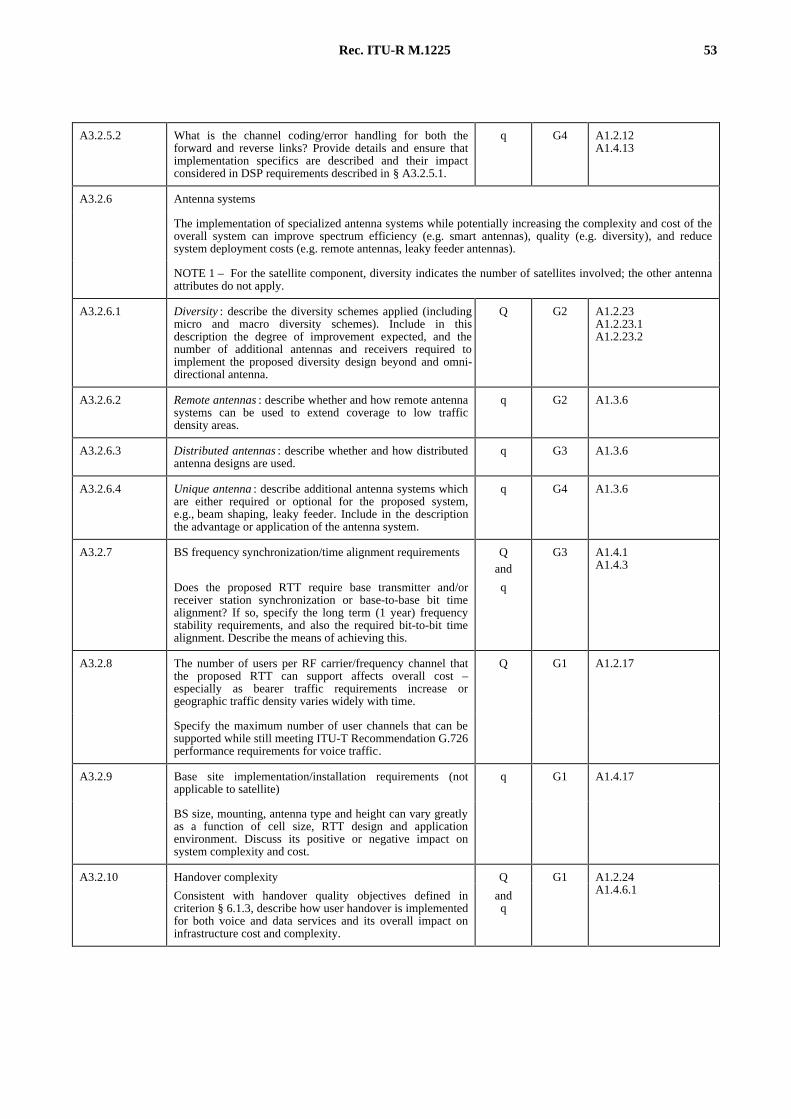
Rec. ITU-R M.1225 53
A3.2.5.2 What is the channel coding/error handling for both theforward and reverse links? Provide details and ensure thatimplementation specifics are described and their impactconsidered in DSP requirements described in § A3.2.5.1.
q G4 A1.2.12A1.4.13
A3.2.6 Antenna systems
The implementation of specialized antenna systems while potentially increasing the complexity and cost of theoverall system can improve spectrum efficiency (e.g. smart antennas), quality (e.g. diversity), and reducesystem deployment costs (e.g. remote antennas, leaky feeder antennas).
NOTE 1 – For the satellite component, diversity indicates the number of satellites involved; the other antennaattributes do not apply.
A3.2.6.1 Diversity : describe the diversity schemes applied (includingmicro and macro diversity schemes). Include in thisdescription the degree of improvement expected, and thenumber of additional antennas and receivers required toimplement the proposed diversity design beyond and omni-directional antenna.
Q G2 A1.2.23A1.2.23.1A1.2.23.2
A3.2.6.2 Remote antennas : describe whether and how remote antennasystems can be used to extend coverage to low trafficdensity areas.
q G2 A1.3.6
A3.2.6.3 Distributed antennas : describe whether and how distributedantenna designs are used.
q G3 A1.3.6
A3.2.6.4 Unique antenna : describe additional antenna systems whichare either required or optional for the proposed system,e.g., beam shaping, leaky feeder. Include in the descriptionthe advantage or application of the antenna system.
q G4 A1.3.6
A3.2.7 BS frequency synchronization/time alignment requirements Qand
G3 A1.4.1A1.4.3
Does the proposed RTT require base transmitter and/orreceiver station synchronization or base-to-base bit timealignment? If so, specify the long term (1 year) frequencystability requirements, and also the required bit-to-bit timealignment. Describe the means of achieving this.
q
A3.2.8 The number of users per RF carrier/frequency channel thatthe proposed RTT can support affects overall cost –especially as bearer traffic requirements increase orgeographic traffic density varies widely with time.
Q G1 A1.2.17
Specify the maximum number of user channels that can besupported while still meeting ITU-T Recommendation G.726performance requirements for voice traffic.
A3.2.9 Base site implementation/installation requirements (notapplicable to satellite)
q G1 A1.4.17
BS size, mounting, antenna type and height can vary greatlyas a function of cell size, RTT design and applicationenvironment. Discuss its positive or negative impact onsystem complexity and cost.
A3.2.10 Handover complexity Q G1 A1.2.24
Consistent with handover quality objectives defined incriterion § 6.1.3, describe how user handover is implementedfor both voice and data services and its overall impact oninfrastructure cost and complexity.
andq
A1.4.6.1
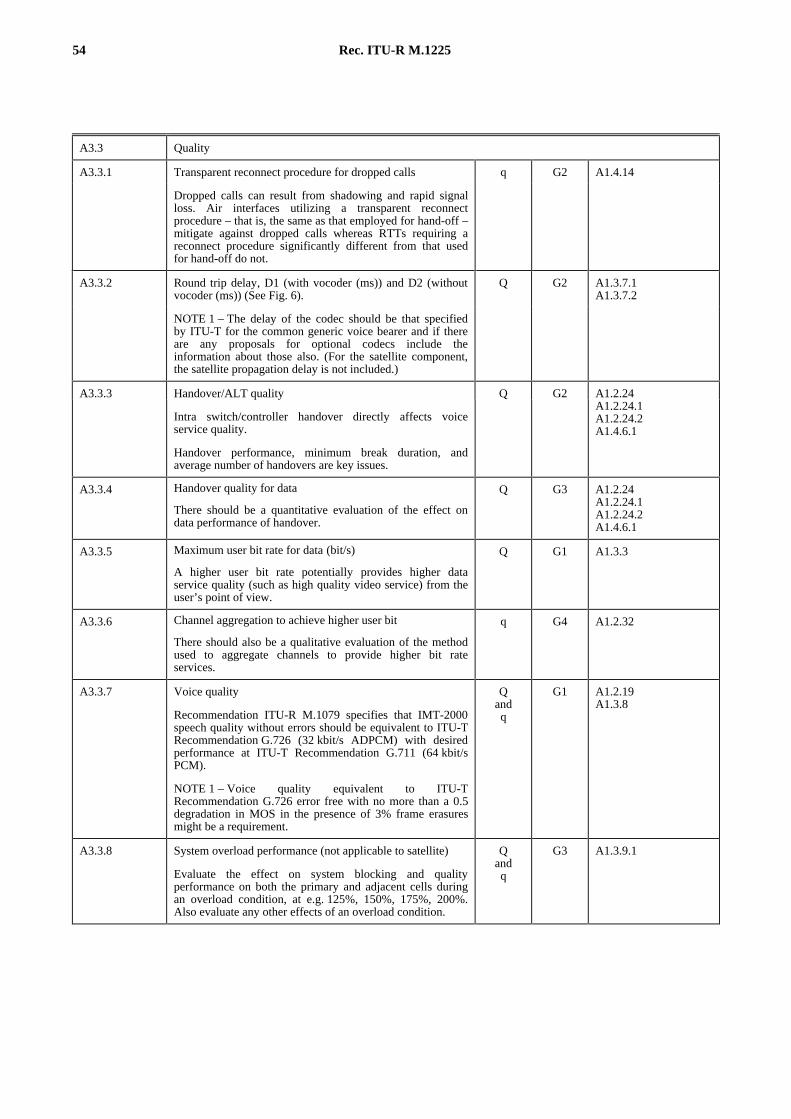
54 Rec. ITU-R M.1225
A3.3 Quality
A3.3.1 Transparent reconnect procedure for dropped calls q G2 A1.4.14
Dropped calls can result from shadowing and rapid signalloss. Air interfaces utilizing a transparent reconnectprocedure – that is, the same as that employed for hand-off –mitigate against dropped calls whereas RTTs requiring areconnect procedure significantly different from that usedfor hand-off do not.
A3.3.2 Round trip delay, D1 (with vocoder (ms)) and D2 (withoutvocoder (ms)) (See Fig. 6).
Q G2 A1.3.7.1A1.3.7.2
NOTE 1 – The delay of the codec should be that specifiedby ITU-T for the common generic voice bearer and if thereare any proposals for optional codecs include theinformation about those also. (For the satellite component,the satellite propagation delay is not included.)
A3.3.3 Handover/ALT quality Q G2 A1.2.24
Intra switch/controller handover directly affects voiceservice quality.
Handover performance, minimum break duration, andaverage number of handovers are key issues.
A1.2.24.1A1.2.24.2A1.4.6.1
A3.3.4 Handover quality for data
There should be a quantitative evaluation of the effect ondata performance of handover.
Q G3 A1.2.24A1.2.24.1A1.2.24.2A1.4.6.1
A3.3.5 Maximum user bit rate for data (bit/s)
A higher user bit rate potentially provides higher dataservice quality (such as high quality video service) from theuser’s point of view.
Q G1 A1.3.3
A3.3.6 Channel aggregation to achieve higher user bit
There should also be a qualitative evaluation of the methodused to aggregate channels to provide higher bit rateservices.
q G4 A1.2.32
A3.3.7 Voice quality
Recommendation ITU-R M.1079 specifies that IMT-2000speech quality without errors should be equivalent to ITU-TRecommendation G.726 (32 kbit/s ADPCM) with desiredperformance at ITU-T Recommendation G.711 (64 kbit/sPCM).
NOTE 1 – Voice quality equivalent to ITU-TRecommendation G.726 error free with no more than a 0.5degradation in MOS in the presence of 3% frame erasuresmight be a requirement.
Qandq
G1 A1.2.19A1.3.8
A3.3.8 System overload performance (not applicable to satellite)
Evaluate the effect on system blocking and qualityperformance on both the primary and adjacent cells duringan overload condition, at e.g. 125%, 150%, 175%, 200%.Also evaluate any other effects of an overload condition.
Qandq
G3 A1.3.9.1
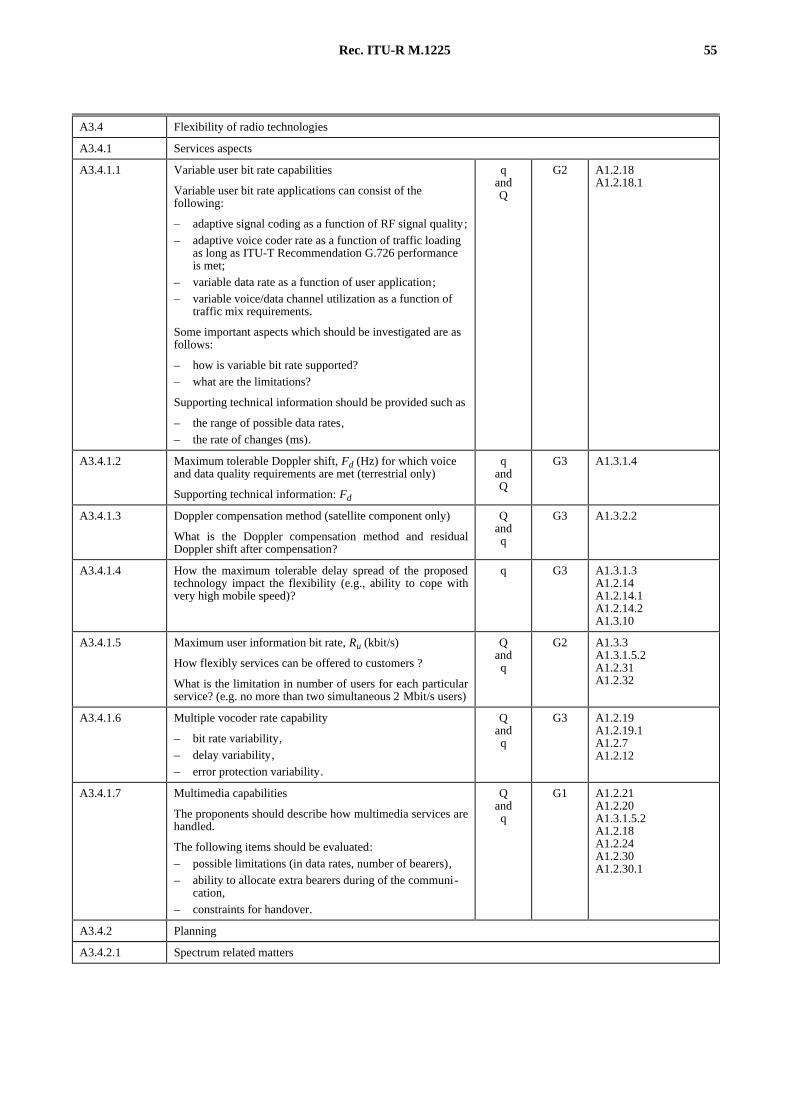
Rec. ITU-R M.1225 55
A3.4 Flexibility of radio technologies
A3.4.1 Services aspects
A3.4.1.1 Variable user bit rate capabilities
Variable user bit rate applications can consist of thefollowing:
– adaptive signal coding as a function of RF signal quality;– adaptive voice coder rate as a function of traffic loading
as long as ITU-T Recommendation G.726 performanceis met;
– variable data rate as a function of user application;– variable voice/data channel utilization as a function of
traffic mix requirements.
Some important aspects which should be investigated are asfollows:
– how is variable bit rate supported?– what are the limitations?
Supporting technical information should be provided such as
– the range of possible data rates,– the rate of changes (ms).
qandQ
G2 A1.2.18A1.2.18.1
A3.4.1.2 Maximum tolerable Doppler shift, Fd (Hz) for which voiceand data quality requirements are met (terrestrial only)
Supporting technical information: Fd
qandQ
G3 A1.3.1.4
A3.4.1.3 Doppler compensation method (satellite component only)
What is the Doppler compensation method and residualDoppler shift after compensation?
Qandq
G3 A1.3.2.2
A3.4.1.4 How the maximum tolerable delay spread of the proposedtechnology impact the flexibility (e.g., ability to cope withvery high mobile speed)?
q G3 A1.3.1.3A1.2.14A1.2.14.1A1.2.14.2A1.3.10
A3.4.1.5 Maximum user information bit rate, Ru (kbit/s)
How flexibly services can be offered to customers ?
What is the limitation in number of users for each particularservice? (e.g. no more than two simultaneous 2 Mbit/s users)
Qandq
G2 A1.3.3A1.3.1.5.2A1.2.31A1.2.32
A3.4.1.6 Multiple vocoder rate capability
– bit rate variability,– delay variability,– error protection variability.
Qandq
G3 A1.2.19A1.2.19.1A1.2.7A1.2.12
A3.4.1.7 Multimedia capabilities
The proponents should describe how multimedia services arehandled.
The following items should be evaluated:– possible limitations (in data rates, number of bearers),– ability to allocate extra bearers during of the communi-
cation,– constraints for handover.
Qandq
G1 A1.2.21A1.2.20A1.3.1.5.2A1.2.18A1.2.24A1.2.30A1.2.30.1
A3.4.2 Planning
A3.4.2.1 Spectrum related matters
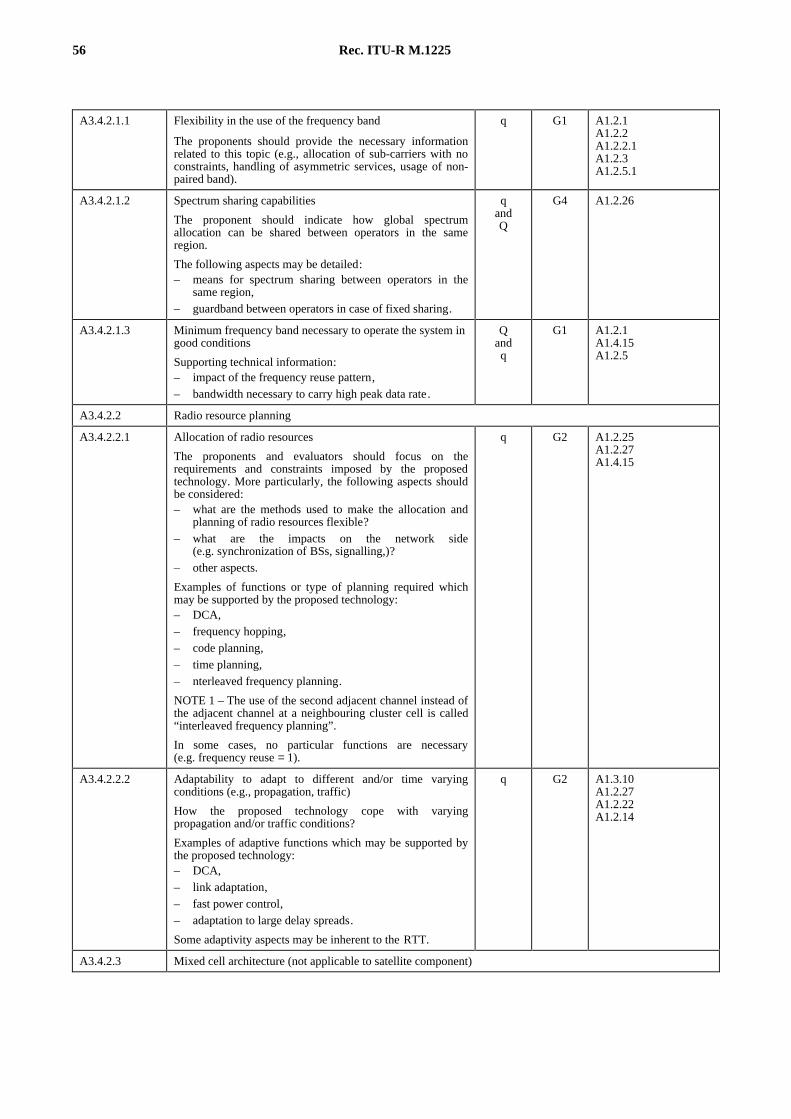
56 Rec. ITU-R M.1225
A3.4.2.1.1 Flexibility in the use of the frequency band
The proponents should provide the necessary informationrelated to this topic (e.g., allocation of sub-carriers with noconstraints, handling of asymmetric services, usage of non-paired band).
q G1 A1.2.1A1.2.2A1.2.2.1A1.2.3A1.2.5.1
A3.4.2.1.2 Spectrum sharing capabilities
The proponent should indicate how global spectrumallocation can be shared between operators in the sameregion.
The following aspects may be detailed:– means for spectrum sharing between operators in the
same region,– guardband between operators in case of fixed sharing.
qandQ
G4 A1.2.26
A3.4.2.1.3 Minimum frequency band necessary to operate the system ingood conditions
Supporting technical information:– impact of the frequency reuse pattern,– bandwidth necessary to carry high peak data rate.
Qandq
G1 A1.2.1A1.4.15A1.2.5
A3.4.2.2 Radio resource planning
A3.4.2.2.1 Allocation of radio resources
The proponents and evaluators should focus on therequirements and constraints imposed by the proposedtechnology. More particularly, the following aspects shouldbe considered:– what are the methods used to make the allocation and
planning of radio resources flexible?– what are the impacts on the network side
(e.g. synchronization of BSs, signalling,)?– other aspects.
Examples of functions or type of planning required whichmay be supported by the proposed technology:– DCA,– frequency hopping,– code planning,– time planning,– nterleaved frequency planning.
NOTE 1 – The use of the second adjacent channel instead ofthe adjacent channel at a neighbouring cluster cell is called“interleaved frequency planning”.
In some cases, no particular functions are necessary(e.g. frequency reuse = 1).
q G2 A1.2.25A1.2.27A1.4.15
A3.4.2.2.2 Adaptability to adapt to different and/or time varyingconditions (e.g., propagation, traffic)
How the proposed technology cope with varyingpropagation and/or traffic conditions?
Examples of adaptive functions which may be supported bythe proposed technology:– DCA,– link adaptation,– fast power control,– adaptation to large delay spreads.
Some adaptivity aspects may be inherent to the RTT.
q G2 A1.3.10A1.2.27A1.2.22A1.2.14
A3.4.2.3 Mixed cell architecture (not applicable to satellite component)

Rec. ITU-R M.1225 57
A3.4.2.3.1 Frequency management between different layersWhat kind of planning is required to manage frequenciesbetween the different layers? e.g.– fixed separation,– dynamic separation,– possibility to use the same frequencies between different
layers.Possible supporting technical information:– guard band.
qandQ
G1 A1.2.28A1.4.15
A3.4.2.3.2 User adaptation to the environmentWhat are the constraints to the management of usersbetween the different cell layers? e.g.– constraints for handover between different layers,– adaptation to the cell layers depending on services,
mobile speed, mobile power.
q G2 A1.2.28A1.3.10
A3.4.2.4 Fixed-wireless access
A3.4.2.4.1 The proponents should indicate how well its technology issuited for operation in the fixed wireless access environment.Areas which would need evaluation include (not applicableto satellite component):– ability to deploy small BSs easily,– use of repeaters,– use of large cells,– ability to support fixed and mobile users within a cell,– network and signalling simplification.
q G4 A1.1.3A1.3.5A1.4.17A1.4.7A1.4.7.1
A3.4.2.4.2 Possible use of adaptive antennas (how well suited is thetechnology) (not applicable to satellite component)Is RTT suited to introduce adaptive antennas? Explain thereason if it is.
q G4 A1.3.6
A3.4.2.4.3 Existing system migration capability q G1 A1.4.16
A3.5 Implication on network interface
A3.5.1 Examine the synchronization requirements with respect tothe network interfaces.
Best case : no special accommodation necessary to providesynchronization.
Worst case : special accommodation for synchronization isrequired, e.g. additional equipment at BS or specialconsideration for facilities.
q G4 A1.4.3
A3.5.2 Examine the RTTs ability to minimize the networkinfrastructure involvement in cell handover.
Best case : neither PSTN/ISDN nor mobile switchinvolvement in handover.
Worst case : landline network involvement essential forhandover.
q G3 A1.2.24A1.4.6.1
A3.5.3 Landline feature transparency
A3.5.3.1 Examine the network modifications required for the RTT topass the standard set of ISDN bearer services.
Best case : no modifications required.
Worst case: substantial modification required, such asinterworking functions.
q G1 A1.4.7.1

58 Rec. ITU-R M.1225
A3.5.3.2 Examine the extent of the PSTN/ISDN involvement inswitching functionality.
Best case : all switching of calls is handled by thePSTN/ISDN.
Worst case : a separate mobile switch is required.
q G2 A1.4.6A1.4.8
A3.5.3.3 Examine the depth and duration of fading that would resultin a dropped call to the PSTN/ISDN network. Therobustness of an RTTs ability to minimize dropped callscould be provided by techniques such as transparentreconnect.
Qandq
G3 A1.2.24A1.4.14
A3.5.3.4 Examine the quantity and type of network interfacesnecessary for the RTT based on the deployment model usedfor spectrum and coverage efficiencies. The assessmentshould include those connections necessary for traffic,signalling and control as well as any special requirements,such as soft handover or simulcast.
Q G2 A1.2.30A1.2.30.1A1.4.9
A3.6 Handportable performance optimization capability
A3.6.1 Isolation between transmitter and receiver
Isolation between transmitter and receiver has an impact onthe size and weight of the handportable.
Q G2 A1.2.2A1.2.2.1A1.2.2.2
A3.6.2 Average terminal power output P0 (mW)
Lower power gives longer battery life and greater operatingtime.
Q G2 A1.2.16.1.2
A3.6.3 System round trip delay impacts the amount of acousticalisolation required between handportable microphone andspeaker components and, as such, the physical size andmechanical design of the subscriber unit.
NOTE 1 – The delay of the codec should be that specifiedby ITU-T for the common generic voice bearer and if thereare any proposals for optional codecs include theinformation about those also. (For the satellite component,the satellite propagation delay is not included.)
Qandq
G2 A1.3.7A1.3.7.1A1.3.7.2A1.3.7.3
A3.6.4 Peak transmission power Q G1 A1.2.16.1.1
A3.6.5 Power control characteristics
Does the proposed RTT utilize transmitter power control? If so, is it used in both forward and reverse links?State the power control range, step size (dB) and required accuracy, number of possible step sizes and numberof power controls per second, which are concerned with mobile station technology complexity.
A3.6.5.1 Power control dynamic range
Larger power control dynamic range gives longer battery lifeand greater operating time.
Q G3 A1.2.22A1.2.22.3A1.2.22.4
A3.6.5.2 Power control step size, accuracy and speed Q G3 A1.2.22A1.2.22.1A1.2.22.2A1.2.22.5
A3.6.6 Linear transmitter requirements q G3 A1.4.10
A3.6.7 Linear receiver requirements (not applicable to satellite) q G3 A1.4.11
A3.6.8 Dynamic range of receiver
The lower the dynamic range requirement, the lower thecomplexity and ease of design implementation.
Q G3 A1.4.12
A3.6.9 Diversity schemes
Diversity has an impact on handportable complexity andsize. If utilized describe the type of diversity and address thefollowing two attributes.
Qandq
G1 A1.2.23A1.2.23.1A1.2.23.2

Rec. ITU-R M.1225 59
A3.6.10 The number of antennas Q G1 A1.2.23.1
A3.6.11 The number of receivers Q G1 A1.2.23.1
A3.6.12 Frequency stability
Tight frequency stability requirements contribute tohandportable complexity.
Q G3 A1.4.1.2
A3.6.13 The ratio of “off (sleep)” time to “on” time Q G1 A1.2.29A1.2.29.1
A3.6.14 Frequency generator step size, switched speed and frequencyrange
Tight step size, switch speed and wide frequency rangecontribute to handportable complexity. Conversely, theyincrease RTT flexibility.
Q G2 A1.4.5
A3.6.15 Digital signal processing requirements
Digital signal processing can be a significant proportion ofthe hardware for some radio interface proposals. It cancontribute to the cost, size, weight and power consumptionof the BS and influence secondary factors such as heatmanagement and reliability. Any digital circuitry associatedwith the network interfaces should not be included. Howeverany special requirements for interfacing with these functionsshould be included.
This section of the evaluation should analyse the detaileddescription of the digital signal processing requirements,including performance characteristics, architecture andalgorithms, in order to estimate the impact on complexity ofthe BSs. At a minimum the evaluation should review thesignal processing estimates (MOPS, memory requirements,gate counts) required for demodulation, equalization,channel coding, error correction, diversity processing(including Rake receivers), adaptive antenna arrayprocessing, modulation, A-D and D-A converters andmultiplexing as well as some IF and baseband filtering. Fornew technologies, there may be additional or alternativerequirements (such as FFTs).
Qandq
G1 A1.4.13
Although specific implementations are likely to vary, goodsample descriptions should allow the relative cost,complexity and power consumption to be compared for thecandidate RTTs, as well as the size and the weight of thecircuitry. The descriptions should allow the evaluators toverify the signal processing requirement metrics, such asMOPS, memory and gate count, provided by the RTTproponent.
A3.7 Coverage/power efficiency
A3.7.1 Terrestrial
Coverage efficiency:– the coverage efficiency is considered for the lowest traffic loadings;
– the base site coverage efficiency can be quantitatively determined by addressing coverage limitation and/orby calculating the maximum coverage range for the lowest traffic loading.
A3.7.1.1 Base site coverage efficiency
The number of base sites required to provide coverage atsystem start-up and ongoing traffic growth significantlyimpacts cost. From § 1.3.2 of Annex 2, determine thecoverage efficiency, C (km2/base sites), for the lowest trafficloadings. Proponent has to indicate the background of thecalculation and also to indicate the maximum coveragerange.
Q G1 A1.3.1.7A1.3.1.7.1A1.3.1.7.2A1.3.4
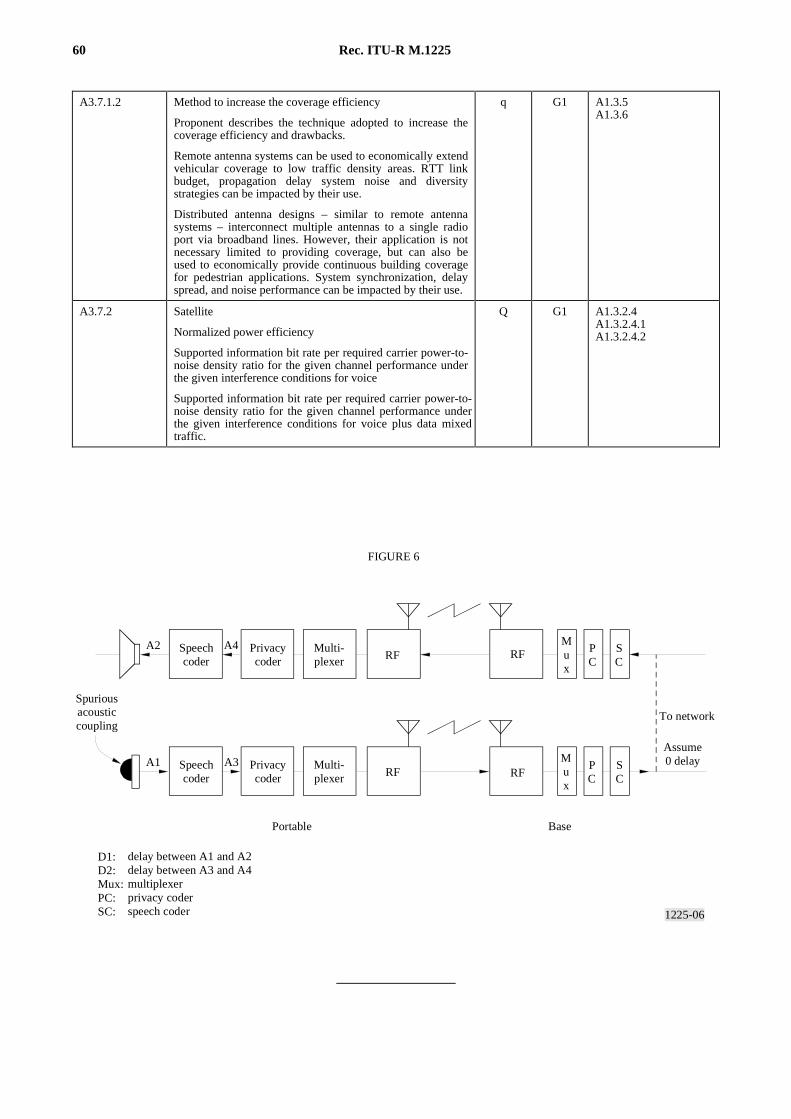
60 Rec. ITU-R M.1225
1225-06
RF RFMux
PC
SC
RF RFMux
PC
SC
D1:D2:Mux:PC:SC:
A2
A1
A4
A3
FIGURE 6
Assume0 delay
Portable Base
Spuriousacousticcoupling
Speechcoder
Privacycoder
Multi-plexer
Speechcoder
Privacycoder
Multi-plexer
delay between A1 and A2delay between A3 and A4multiplexerprivacy coderspeech coder
To network
FIGURE 6/M.1225-06 = 9 CM
A3.7.1.2 Method to increase the coverage efficiency
Proponent describes the technique adopted to increase thecoverage efficiency and drawbacks.
Remote antenna systems can be used to economically extendvehicular coverage to low traffic density areas. RTT linkbudget, propagation delay system noise and diversitystrategies can be impacted by their use.
Distributed antenna designs – similar to remote antennasystems – interconnect multiple antennas to a single radioport via broadband lines. However, their application is notnecessary limited to providing coverage, but can also beused to economically provide continuous building coveragefor pedestrian applications. System synchronization, delayspread, and noise performance can be impacted by their use.
q G1 A1.3.5A1.3.6
A3.7.2 Satellite
Normalized power efficiency
Supported information bit rate per required carrier power-to-noise density ratio for the given channel performance underthe given interference conditions for voice
Supported information bit rate per required carrier power-to-noise density ratio for the given channel performance underthe given interference conditions for voice plus data mixedtraffic.
Q G1 A1.3.2.4A1.3.2.4.1A1.3.2.4.2