m e s s a g e f r o m t h e - dmf.go.th · dmf’s responsibilities divided into divisional level 5...
TRANSCRIPT


1 2002AnnualR
eport
The year 2002 was a transitional year for government agency in energy sector to berelocated under Ministry of Energy in the line of Bureaucratic Reform. With co-oper-ation between these agencies, the state policy would be able to be implementedmore efficiently to bring great benefit to the people of Thailand.
The Department of Mineral Fuels (DMF) was established to be responsible for theexploration and production of mineral fuels throughout the Kingdom of Thailand aswell as Thailand-Malaysia Joint Development Area. Apart from that, DMF has beenworking on the development and management of the Thailand-Cambodia OverlappingClaimed Area. Negotiation between two countries is going on with satisfactoryprogress.
Thailandûs indigenous resources are very important for energy security. Provenreserve and Production Ratio (R/P) is widely used to monitor how long we can dependon our own resources. On the supply side, gas reserve of Thailand stands at about33.5 Tcf, and on the production side, the daily gas consumption is about 2,000million cubic feet from indigenous production and about 600 million cubic feet fromMyanmar. These give the R/P of about 19. DMF has been enhancing the co-operationbetween government sector and private sector in order to maximize the use of petro-leum fields and, managing the petroleum production. These would maintain the R/Pat a satisfactory level for the sustainable use of indigenous resources.
With dedication and working efficiently under the new strategies, DMF wouldguarantee the energy security and put Thailand on its prestigious position within theASEAN region.
M e s s a g e f r o m t h e
Nopadon Mantajit
Director-GeneralDepartment of Mineral Fuels
Director-General
2 2002AnnualR
eport
Message from the Director-General 1
Contents 2
Highlights 3
The Department of Mineral Fuels 4
● DMF’s obligations and responsibilities 4
● Mission 5
● Vision 5
● DMF’s responsibilities divided into divisional level 5
Benefits 7
Petroleum Balance 12
Petroleum Concessions 16
Petroleum Investment 26
Petroleum Exploration 28
Field Development 30
Petroleum Production 38
Petroleum Enviromental Activities 40
Activities in the Malaysia-Thailand 43
Joint Development Area (MTJDA)
Petroleum Resources && Reserves 47
Coal Activities 51
List of Petroleum Concessionaires 56
Government Agencies, State Enterprises and Institutes 61
Coal Operations in Thailand 64
Abbreviation 66
Contents

3 2002AnnualR
eport
HighlightsActivities 1999 2000 2001 2002 Unit
Geophysical Surveys• 2D seismic 2,534 493 - 1,128.6 line-km• 3D seismic 1,658 134 827.82 481.5 sq. km
Drilling• exploratory *35 *47 *43 *22 well• development 165 179 155 339 well
New Prospects• number of new prospects 8 7 11 **3
Production (Total Sale)• by 8 8 8 8 concessionaire• from 26 25 26 30 field
• natural gas 678 713 693 726 Bcf• condensate 17.8 19.1 18.9 19.6 MMbbl• oil 12.0 20.9 22.4 27.7 MMbbl
• values 68.58 107.27 116.29 123.49 billion baht• royalties 8.50 13.47 14.6 15.7 billion baht
• royalty allocation to the sub-district 203.43 330.63 342.51 273.48 million bahtadministration organization
• royalty allocation to the provincial 305.14 495.94 434.51 273.48 million bahtadministration organization
Concessions• number of concessions 26 25 25 22• number of concession blocks 33 32 32 29
* Include appraisal wells
** Phuhom-3, Pikul-2x and 11A-2
4 2002AnnualR
eport
For a long time, energy has been an indispensable necessity of dailylife and alsoplayed as an essential catalyst for Thailandûs economic, social and security development.The Thai government, realising the importance of efficient energy management, has initiatedpolicies that enhance domestic supply in order to reduce the degree of reliance of energyimports (especially, promoting natural gas as major energy supply). The policies also emphasizenational energy management to increase the competitiveness of the production sector andcreate energy price stability. To visualize the government policies, the Ministry of Energy wasformed by the unification of all governmental organizations involved in energy sector.
The Mineral Fuels Division was set up under the Department of Mineral Resources,Ministry of Industry, on 17 January 1972 with the obligation to develop Thailandûs energyresources. Thailandûs upstream petroleum industry has been continually developed overthe past 30 years with continual success and, consequently, petroleum has become a majorenergy resource for the nationûs development.
The Mineral Fuels Division, as the only organization managing petroleum explorationand production, was repositioned on 3 October 2002 to be the Department of Mineral Fuelsunder the Ministry of Energy as formalized by the Government Restructuring Act (NO 24) B.E.2545 with obligations and responsibilities to manage the up-stream petroleum industries.
DMFûs obligations and responsibilitiesAccording to the Ministerial Regulation on Reorganization of the Ministry of Energy
B.E.2545, the DMFûs obligations and responsibilitiesare given as follows;
DMF has the duty to promote and accelerate domestic petroleum exploration andproduction, and also to encourage collaboration with neighboring countries.
Such responsibilities include the following matters;
1. Managing and monitoring petroleum concession awards, exploration, production, storage,transportation and selling.
2. Collecting petroleum royalty payments and any other benefits.
3. To co-ordinate with concessionaires, operators and government agencies to ensure thatconcessionaires and operators are working in accordance to the Thai law and regulations.
4. Coal and oil shale exploration and potential evaluation
5. Mineral fuels research and development
6. Collaborating in developing petroleum fields in joint development areas, overlapping areasand other countries in the region.
7. Other matters as assigned by the ministry or the cabinet.
T h e D e p a r t m e n t o f
Mineral Fuels

5 2002AnnualR
eport
MissionTo promote the integration of petroleum exploration, development, production and
management, with more environmentally friendly and international standardized technologies.
VisionThe Department of Mineral Fuels is a first-grade organization administrating and
managing mineral fuel resources to secure and maintain the energy supply.
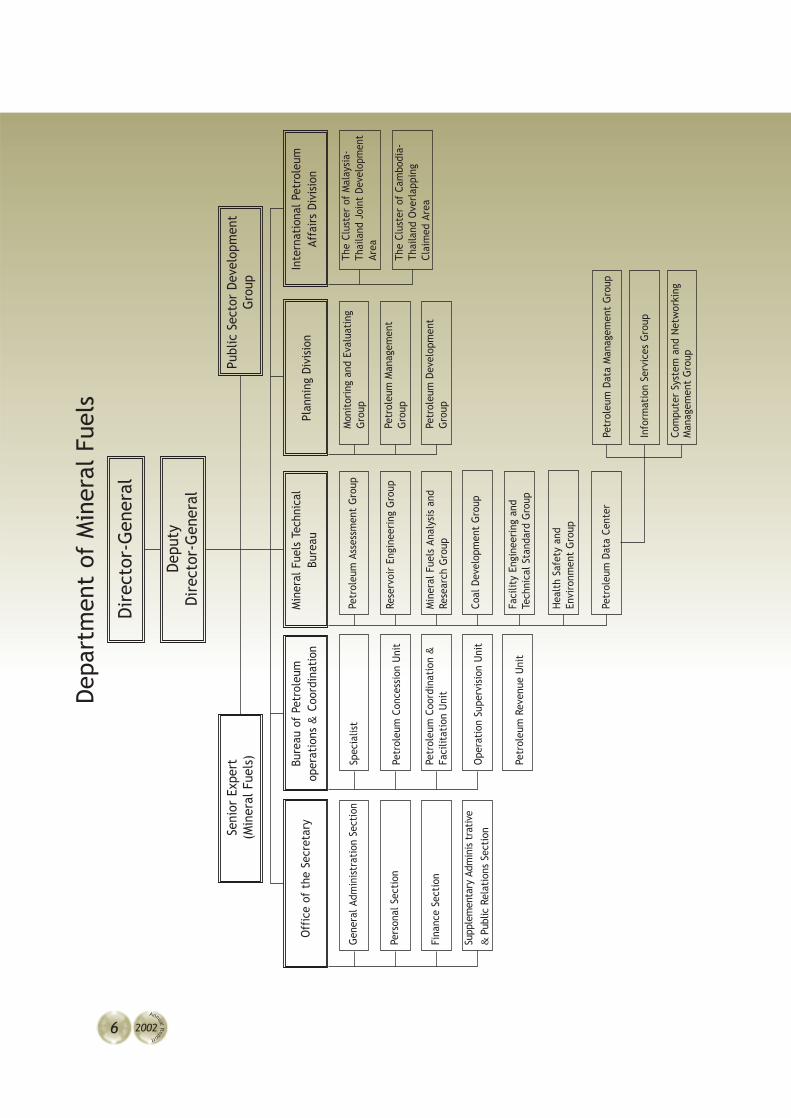
DMFûs responsibilities are divided into divisional levels as follows :• Office of the Secretary
Support executive and internal management who are responsible for departmentalpolicies and plans.
• Bureau of Petroleum Operations and Coordination
Promote and regulate all domestic petroleum exploration and production activitiesincluding concession awards, exploration and production supervision, concessionmanagement and facilitate concessionaireûs affairs as stipulated by law.
• Mineral Fuels Technical Bureau
Technically support the departmentûs responsibilities such as concession awards,exploration and production activities and natural fuels utilization by assessingdomestic natural fuels fields and study safety and environmental impact ofoperations.
• Petroleum Planning Division
Cooperate departmentûs policies and plans leading to effective service and accordingto natural policies by formulate strategic plans which address direction, strategiesand plan assessment.
• International Petroleum Operations Division
Endorse international collaboration in explorationand development of energy resources in the jointdevelopment areas andover-lapping areas bymanaging the operationsin accordance with thelaws and regulations ofThailand.
6 2002AnnualR
eport
Dep
artm
ent
of M
iner
al F
uels
Seni
or E
xper
tPu
blic
Sec
tor
Deve
lopm
ent
(Min
eral
Fue
ls)
Gro
up
Bure
au o
f Pe
trol
eum
oper
atio
ns &
Coor
dina
tion
Spec
ialis
t
Petr
oleu
m C
once
ssio
n U
nit
Petr
oleu
m C
oord
inat
ion
&Fa
cilit
atio
n U
nit
Ope
rati
on S
uper
visi
on U
nit
Petr
oleu
m R
even
ue U
nit
Min
eral
Fue
ls T
echn
ical
Bure
au
Petr
oleu
m A
sses
smen
t G
roup
Rese
rvoi
r En
gine
erin
g G
roup
Min
eral
Fue
ls A
naly
sis
and
Rese
arch
Gro
up
Coal
Dev
elop
men
t G
roup
Faci
lity
Engi
neer
ing
and
Tech
nica
l Sta
ndar
d G
roup
Hea
lth
Safe
ty a
ndEn
viro
nmen
t G
roup
Petr
oleu
m D
ata
Cent
er
Plan
ning
Div
isio
n
Mon
itor
ing
and
Eval
uati
ngG
roup
Petr
oleu
m M
anag
emen
tG
roup
Petr
oleu
m D
evel
opm
ent
Gro
up
Inte
rnat
iona
l Pet
role
umAf
fair
s Di
visi
on
The
Clus
ter
of M
alay
sia-
Thai
land
Joi
nt D
evel
opm
ent
Area
The
Clus
ter
of C
ambo
dia-
Thai
land
Ove
rlap
ping
Clai
med
Are
a
Petr
oleu
m D
ata
Man
agem
ent
Gro
up
Info
rmat
ion
Serv
ices
Gro
up
Com
pute
r Sy
stem
and
Net
wor
king
Man
agem
ent
Gro
up
Dir
ecto
r-G
ener
al
Depu
tyDi
rect
or-G
ener
al
Off
ice
of t
he S
ecre
tary
Gen
eral
Adm
inis
trat
ion
Sect
ion
Pers
onal
Sec
tion
Fina
nce
Sect
ion
Supp
lem
enta
ry A
dmin
is t
rati
ve
& P
ublic
Rela
tion
s Se
ctio
n

7 2002AnnualR
eport
Royalties from petroleum production in 2002 contributed 15.662 billion baht to thecountry. These royalties broke down into 61%, 15% and 24% collected from gas, condensate andoil, respectively. From 2001 to 2002 royalties increased by 7%.
Royalty payments made by onshore concessionaires from onshore blocks are devided asfollows;
• 20% is divided amongst the Sub-District Administration Organizations (SDAO) in the concession areas to be use by the local communities. (Table 1)
• 20% is divided amongst the others SDAOs throughout the country.
• 20% is divided amongst the Provincial Administration Organizations (PAO) within the concession areas.(Table 2)
• The remaining 40% is sent to the treasury.
100% of royalty payments made by concessionaires from offshore blocks are sent to thetreasury.
Benefits
Table 1 :
Block Province Sub-District Administration No. of SDAO Royalty allocation (baht)Organizations (SDAO) Each Subtotal
S1 Kamphaeng Phet Lan Krabu, Nong Luang*, 4 17,802,479 71,209,917Chonglom, Bueng Tab Rat, Non Pluang 1 17,802,479 17,802,479Tesaban Lan Krabu** 1 17,802,479 17,802,479
Phitsanulok Kui Muang, Chum Saeng Songkhram, 4 17,802,479 71,209,917Bung Kok, Nong Kula
Sukhothai Kong, Nong Tum 2 17,802,479 35,604,958NC Kamphaeng Phet Nong Luang* 1 1,197,920 1,197,920
Sukhothai Nong Chik 1 1,197,920 1,197,920E5 Khon Kaen Kudnamsai, Muang Wan, Nam Phong 3 18,389,404 55,168,213
PTTEP 1 Nakhon Pathom Thung Luk Nok 1 597,449 597,449Suphan Buri Suan Taeng, Chedi 2 597,449 1,194,899
SW Phetchabun Si Thep, Na Sanun, Bo Rang 3 122,475 367,425Ta Rong 1 122,475 122,475Total 23 273,476,051

8 2002AnnualR
eport
Block Province No. of Royalty allocation (baht)PAO Each Subtotal
S1 Kamphaeng Phet, Phitsanulok, Sukhothai 3 71,209,917 213,629,751
NC Kamphaeng Phet, Sukhothai 2 1,197,920 2,395,840
E5 Khon Kaen 1 55,168,213 55,168,213
PTTEP 1 Nakhon Pathom, Suphan Buri 2 896,174 1,792,348
SW Phetchabun 1 489,899 489,899
Total 7 273,476,051
Remarks : S1 Thai Shell Exploration and Production Co., Ltd. PTT Exploration and Production Public Co., Ltd.
NC Sino- U.S. Petroleum Inc.Combined Oil and Gas (Thailand) Inc.Thai Energy Resources Ltd.Sino Thai Energy Ltd.
E : Esso Exploration and Production Khorat Inc. PTT Exploration and Production Public Co., Ltd.
PTTEP1 PTTEP International Ltd.SW Pacific Tiger Energy (Thailand) Ltd.* Nong Luang SDAO has been allocated royalty from block S1 and NC.** Tesaban Lan Krabu and Ta Rong SDAO have been allocated royalty
since July, 2002
Table 2 :

9 2002AnnualR
eport
Sales, Value and Royalty of Crude Oil
Petroleum Field 1981-1985 1986-1990 1991-1995 1996-2000 2001 2002 Total
Sirikit (LPG)Sales (MMkg) * 41.10 489.74 107.61 109.60 108.89 1,277.77Value (million baht) 251.51 3,043.86 584.83 1,130.77 985.77 9,224.30Royalty (million baht) 31.44 380.48 73.10 141.35 123.22 1,153.02
Platong Sales (Mbbl) 196.06 888.20 1,084.25Value (million baht) 147.70 984.58 1,132.28Royalty (million baht) 18.46 123.07 141.53
KaphongSales (Mbbl) 176.51 216.28 392.79Value (million baht) 132.28 222.77 355.06Royalty (million baht) 16.54 27.85 44.38
Plamuk Sales (Mbbl) 158.38 1,570.97 1,729.35Value (million baht) 119.28 1,711.34 1,830.62Royalty (million baht) 14.91 213.92 228.83
SuratSales (Mbbl) 2.11 196.15 198.26Value (million baht) 1.67 210.47 212.13Royalty (million baht) 0.21 26.31 26.52
Yala U3Sales (Mbbl) 1,322.88 1,322.88Value (million baht) 1,500.73 1,500.73Royalty (million baht) 187.59 187.59
Sirikit et al.Sales (Mbbl) 14,663.18 35,528.54 39,319.39 6,800.62 7,803.85 7,450.19 142,587.03Value (million baht) 9,616.95 14,942.29 16,217.34 3,174.15 7,570.90 7,142.35 80,093.79Royalty (million baht) 1,202.11 1,867.79 2,027.23 396.77 946.36 892.79 10,011.77
Nang NuanSales (Mbbl) 475.75 1,687.87 1,908.64 0.00 0.00 4,506.46Value (million baht) 156.14 670.76 919.00 0.00 0.00 2,054.03Royalty (million baht) 19.52 83.84 114.88 0.00 0.00 256.74
Kamphang Saen + U-Thong + SangkrajaiSales (Mbbl) 1,826.07 350.91 213.01 215.77 3,525.83Value (million baht) 637.55 154.97 184.43 192.28 1,697.27Royalty (million baht) 31.88 7.75 9.22 9.61 84.37
Bung Ya + Bung MuangSales (Mbbl) 315.70 151.16 314.90 278.58 1,841.20Value (million baht) 112.75 66.96 276.58 247.06 1,183.33Royalty (million baht) 5.64 3.35 13.83 12.35 59.14
Wichian BuriSales (Mbbl) 54.70 101.66 69.01 59.46 572.88Value (million baht) 16.81 37.92 59.09 54.66 328.92Royalty (million baht) 0.84 1.90 2.94 2.73 16.23
TantawanSales (Mbbl) 2,947.39 2,111.64 13,541.97Value (million baht) 3,076.56 2,251.04 12,305.37Royalty (million baht) 413.93 304.13 1,590.90
BenchamasSales (Mbbl) 10,719.23 12,962.01 33,257.47Value (million baht) 11,166.79 13,751.43 36,337.45Royalty (million baht) 1,484.85 1,863.12 4,838.26
TotalSales (Mbbl) 14,663.18 36,004.29 43,203.73 60,816.62 22,600.44 27,272.11 204,560.37Value (million baht) 9,616.95 15,349.94 20,699.06 49,468.80 23,866.06 29,254.47 148,255.29Royalty (million baht) 1,202.11 1,918.74 2,529.91 6,139.24 3,062.60 3,786.70 18,639.29
* LPGû s sales not included in total salesPlatong, Kaphong, Kaphong, Plamuk and Surat started in 2001

10 2002AnnualR
eport
Sales, Value and Royalty of Condensate
Petroleum Field 1981-1985 1986-1990 1991-1995 1996-2000 2001 2002 Total
ErawanSales (Mbbl) 9,494.31 12,607.63 16,550.49 16,693.46 3,260.08 2,942.76 61,548.73Value (million baht) 6,625.16 5,632.17 7,457.98 11,219.09 3,348.09 2,910.39 37,192.88Royalty (million baht) 828.17 688.84 932.25 1,402.37 418.51 363.80 4,633.93
BaanpotSales (Mbbl) 1,005.31 2,106.17 727.86 963.40 83.96 122.28 5,008.98Value (million baht) 693.72 920.18 426.28 632.60 86.43 119.19 2,878.40Royalty (million baht) 86.71 113.21 53.28 79.06 10.80 14.90 357.98
Satun + South SatunSales (Mbbl) 976.98 9,309.86 14,301.36 14,334.32 1,869.01 1,546.32 42,337.85Value (million baht) 731.41 4,193.19 6,382.73 9,345.74 1,920.37 1,518.78 24,092.22Royalty (million baht) 91.42 552.07 797.83 1,168.19 240.06 189.85 3,039.41
Platong + KaphongSales (Mbbl) 1,119.40 7,290.49 4,548.15 7,432.73 560.54 174.90 21,126.21Value (million baht) 835.33 3,196.25 2,075.23 4,905.50 617.05 177.16 11,806.52Royalty (million baht) 104.42 392.53 259.40 613.13 77.13 22.14 1,468.78
FunanSales (Mbbl) 8,950.21 8,268.55 1,922.32 2,385.35 21,526.43Value (million baht) 3,912.72 5,606.69 1,946.91 2,366.93 13,833.24Royalty (million baht) 489.08 700.82 243.36 295.87 1,729.13
JakrawanSales (Mbbl) 362.64 3,395.74 491.70 441.12 4,691.20Value (million baht) 148.31 2,411.96 623.79 431.65 3,615.71Royalty (million baht) 18.53 301.47 77.97 53.96 451.94
SuratSales (Mbbl) 979.75 620.63 0 0 1,600.38Value (million baht) 412.12 364.68 0 0 776.81Royalty (million baht) 51.52 45.84 0 0 97.36
GominSales (Mbbl) 63.31 3,330.37 221.68 228.13 3,843.48Value (million baht) 25.45 2,060.29 226.39 222.69 2,534.83Royalty (million baht) 3.18 257.51 27.14 27.84 315.67
Pladang + TratSales (Mbbl) 2,430.88 1,291.11 1,152.83 4,874.83Value (million baht) 2,068.41 1,319.19 1,133.93 4,521.53Royalty (million baht) 258.53 164.90 141.74 565.18
PlamukSales (Mbbl) 146.36 0.90 0 147.27Value (million baht) 119.60 0.93 0 120.53Royalty (million baht) 14.94 0.12 0 15.06
PailinSales (Mbbl) 5,290.09 2,956.11 4,044.38 12,290.58Value (million baht) 4,879.21 3,066.88 4,150.15 12,096.24Royalty (million baht) 609.51 383.36 518.77 1,511.64
BongkotSales (Mbbl) 3,242.56 20,561.10 6,098.33 5,666.41 35,568.40Value (million baht) 1,303.19 14,464.83 6,168.21 5,584.53 27,520.76Royalty (million baht) 162.89 1,808.09 771.03 698.07 3,440.07
TotalSales (Mbbl) 12,595.99 31,314.14 49,726.33 83,467.63 18,755.73 18,704.48 214,564.34Value (million baht) 8,885.63 13,941.79 22,144.01 58,078.60 19,324.23 18,615.40 140,989.67Royalty (million baht) 1,110.72 1,746.65 2,767.98 7,259.46 2,414.37 2,326.94 17,626.15
11 2002AnnualR
eport
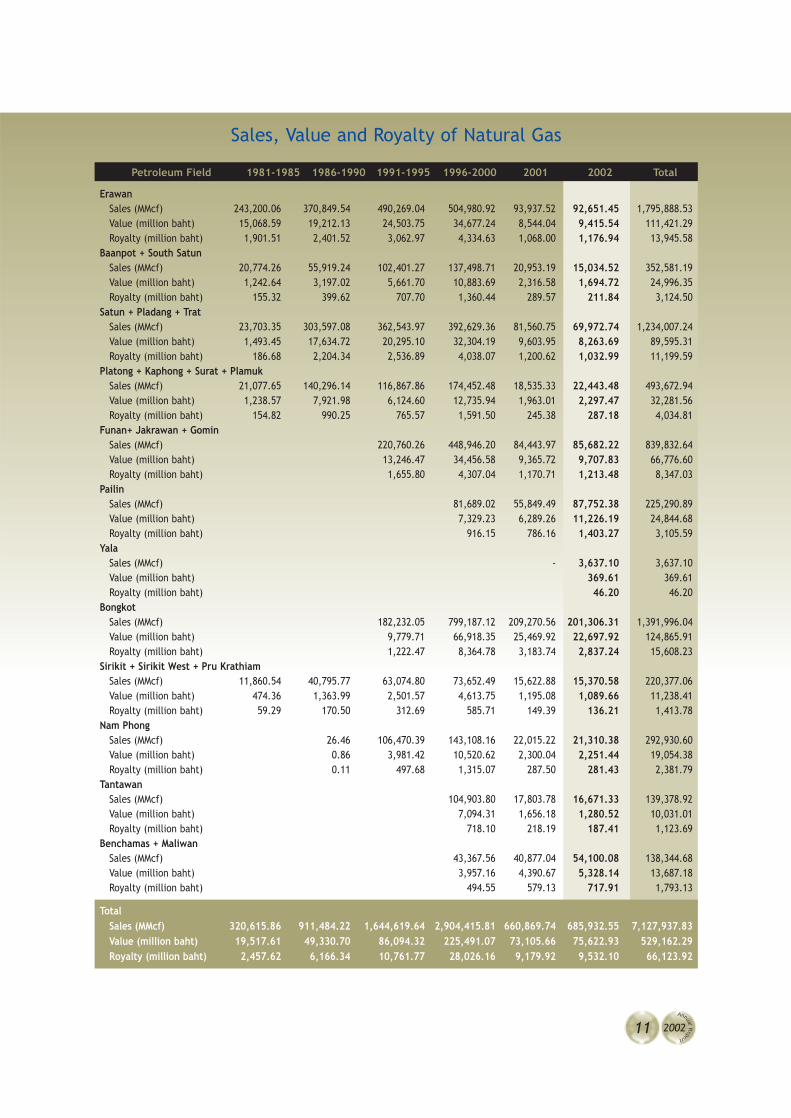
Sales, Value and Royalty of Natural Gas
Petroleum Field 1981-1985 1986-1990 1991-1995 1996-2000 2001 2002 Total
ErawanSales (MMcf) 243,200.06 370,849.54 490,269.04 504,980.92 93,937.52 92,651.45 1,795,888.53Value (million baht) 15,068.59 19,212.13 24,503.75 34,677.24 8,544.04 9,415.54 111,421.29Royalty (million baht) 1,901.51 2,401.52 3,062.97 4,334.63 1,068.00 1,176.94 13,945.58
Baanpot + South SatunSales (MMcf) 20,774.26 55,919.24 102,401.27 137,498.71 20,953.19 15,034.52 352,581.19Value (million baht) 1,242.64 3,197.02 5,661.70 10,883.69 2,316.58 1,694.72 24,996.35Royalty (million baht) 155.32 399.62 707.70 1,360.44 289.57 211.84 3,124.50
Satun + Pladang + TratSales (MMcf) 23,703.35 303,597.08 362,543.97 392,629.36 81,560.75 69,972.74 1,234,007.24Value (million baht) 1,493.45 17,634.72 20,295.10 32,304.19 9,603.95 8,263.69 89,595.31Royalty (million baht) 186.68 2,204.34 2,536.89 4,038.07 1,200.62 1,032.99 11,199.59
Platong + Kaphong + Surat + PlamukSales (MMcf) 21,077.65 140,296.14 116,867.86 174,452.48 18,535.33 22,443.48 493,672.94 Value (million baht) 1,238.57 7,921.98 6,124.60 12,735.94 1,963.01 2,297.47 32,281.56Royalty (million baht) 154.82 990.25 765.57 1,591.50 245.38 287.18 4,034.81
Funan+ Jakrawan + GominSales (MMcf) 220,760.26 448,946.20 84,443.97 85,682.22 839,832.64Value (million baht) 13,246.47 34,456.58 9,365.72 9,707.83 66,776.60Royalty (million baht) 1,655.80 4,307.04 1,170.71 1,213.48 8,347.03
PailinSales (MMcf) 81,689.02 55,849.49 87,752.38 225,290.89Value (million baht) 7,329.23 6,289.26 11,226.19 24,844.68Royalty (million baht) 916.15 786.16 1,403.27 3,105.59
YalaSales (MMcf) - 3,637.10 3,637.10Value (million baht) 369.61 369.61Royalty (million baht) 46.20 46.20
BongkotSales (MMcf) 182,232.05 799,187.12 209,270.56 201,306.31 1,391,996.04Value (million baht) 9,779.71 66,918.35 25,469.92 22,697.92 124,865.91Royalty (million baht) 1,222.47 8,364.78 3,183.74 2,837.24 15,608.23
Sirikit + Sirikit West + Pru KrathiamSales (MMcf) 11,860.54 40,795.77 63,074.80 73,652.49 15,622.88 15,370.58 220,377.06Value (million baht) 474.36 1,363.99 2,501.57 4,613.75 1,195.08 1,089.66 11,238.41Royalty (million baht) 59.29 170.50 312.69 585.71 149.39 136.21 1,413.78
Nam PhongSales (MMcf) 26.46 106,470.39 143,108.16 22,015.22 21,310.38 292,930.60Value (million baht) 0.86 3,981.42 10,520.62 2,300.04 2,251.44 19,054.38Royalty (million baht) 0.11 497.68 1,315.07 287.50 281.43 2,381.79
TantawanSales (MMcf) 104,903.80 17,803.78 16,671.33 139,378.92Value (million baht) 7,094.31 1,656.18 1,280.52 10,031.01Royalty (million baht) 718.10 218.19 187.41 1,123.69
Benchamas + MaliwanSales (MMcf) 43,367.56 40,877.04 54,100.08 138,344.68Value (million baht) 3,957.16 4,390.67 5,328.14 13,687.18Royalty (million baht) 494.55 579.13 717.91 1,793.13
TotalSales (MMcf) 320,615.86 911,484.22 1,644,619.64 2,904,415.81 660,869.74 685,932.55 7,127,937.83Value (million baht) 19,517.61 49,330.70 86,094.32 225,491.07 73,105.66 75,622.93 529,162.29Royalty (million baht) 2,457.62 6,166.34 10,761.77 28,026.16 9,179.92 9,532.10 66,123.92
12 2002AnnualR
eport
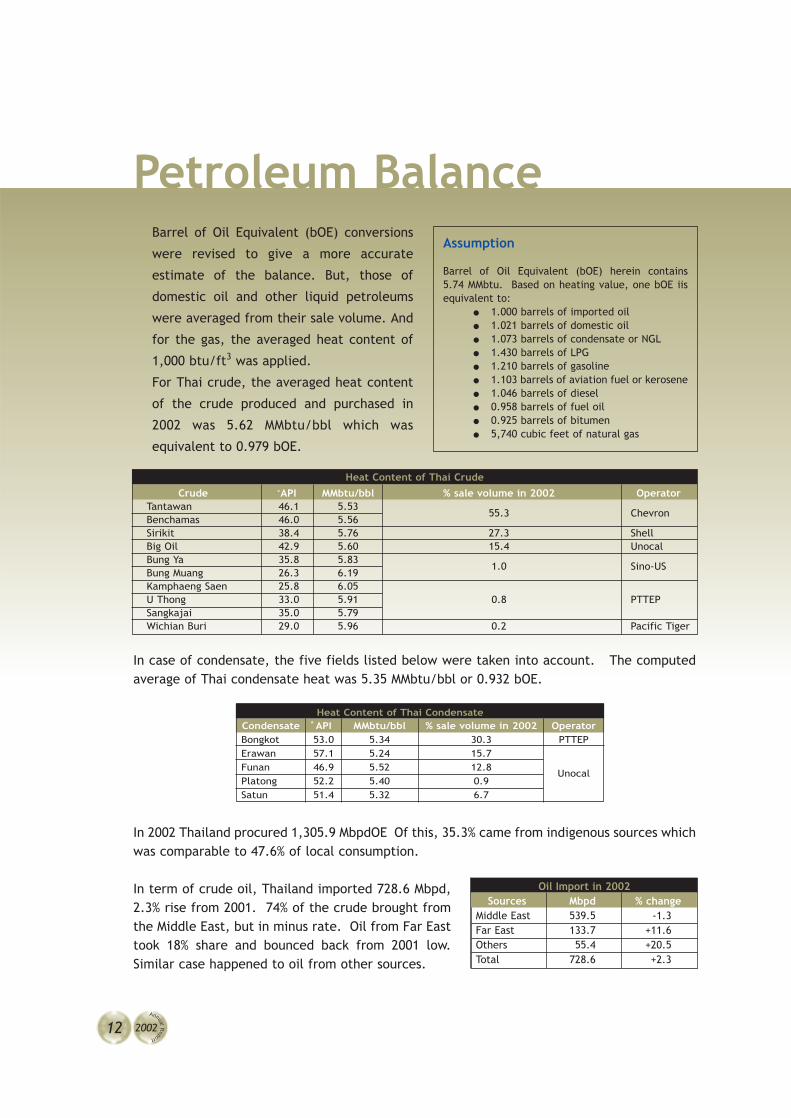
Petroleum BalanceAssumption
Barrel of Oil Equivalent (bOE) herein contains5.74 MMbtu. Based on heating value, one bOE iisequivalent to:
● 1.000 barrels of imported oil● 1.021 barrels of domestic oil● 1.073 barrels of condensate or NGL● 1.430 barrels of LPG● 1.210 barrels of gasoline● 1.103 barrels of aviation fuel or kerosene● 1.046 barrels of diesel● 0.958 barrels of fuel oil● 0.925 barrels of bitumen● 5,740 cubic feet of natural gas
Barrel of Oil Equivalent (bOE) conversions
were revised to give a more accurate
estimate of the balance. But, those of
domestic oil and other liquid petroleums
were averaged from their sale volume. And
for the gas, the averaged heat content of
1,000 btu/ft3 was applied.
For Thai crude, the averaged heat content
of the crude produced and purchased in
2002 was 5.62 MMbtu/bbl which was
equivalent to 0.979 bOE.
In case of condensate, the five fields listed below were taken into account. The computedaverage of Thai condensate heat was 5.35 MMbtu/bbl or 0.932 bOE.
Heat Content of Thai CondensateCondensate ÌAPI MMbtu/bbl % sale volume in 2002 OperatorBongkot 53.0 5.34 30.3 PTTEPErawan 57.1 5.24 15.7
UnocalFunan 46.9 5.52 12.8Platong 52.2 5.40 0.9Satun 51.4 5.32 6.7
Oil Import in 2002Sources Mbpd % change
Middle East 539.5 -1.3Far East 133.7 +11.6Others 55.4 +20.5Total 728.6 +2.3
In term of crude oil, Thailand imported 728.6 Mbpd,2.3% rise from 2001. 74% of the crude brought fromthe Middle East, but in minus rate. Oil from Far Easttook 18% share and bounced back from 2001 low.Similar case happened to oil from other sources.
In 2002 Thailand procured 1,305.9 MbpdOE Of this, 35.3% came from indigenous sources whichwas comparable to 47.6% of local consumption.
Heat Content of Thai Crude
Crude ÌAPI MMbtu/bbl % sale volume in 2002 OperatorTantawan 46.1 5.53
55.3 ChevronBenchamas 46.0 5.56Sirikit 38.4 5.76 27.3 ShellBig Oil 42.9 5.60 15.4 UnocalBung Ya 35.8 5.83
1.0 Sino-USBung Muang 26.3 6.19Kamphaeng Saen 25.8 6.05
0.8 PTTEPU Thong 33.0 5.91Sangkajai 35.0 5.79Wichian Buri 29.0 5.96 0.2 Pacific Tiger

13 2002AnnualR
eport
By country, the number of suppliers decreased from 23 to 18 in 2001. Middle East was still amajor source of oil for Thailand, but, in lower rate. In contrast, oil coming from Africa wasapparently growing, especially from Angola. Three of the new oil suppliers this year wereEquatorial Guinea, South Africa and Myanmar.
Oil Import by Country of Origin
No. Country2001 2002
Million liters % Million liters %1 UAE (1) 9,072 22.0 8,934 21.132 Oman (2) 7,942 19.2 8,452 19.993 Saudi Arabia (3) 6,149 14.9 5,586 13.214 Yemen (4) 4,582 11.1 4,735 11.205 Brunei (6) 2,977 7.2 3,075 7.276 Malaysia (5) 3,677 8.9 3,013 7.137 Qatar (8) 1,362 3.5 2,746 6.498 Indonesia (11) 505 1.2 1,738 4.119 Angola (14) 302 0.7 1,169 2.76
10 Iraq (9) 608 1.5 544 1.2911 Kuwait (7) 1,739 4.2 495 1.1712 Nigeria (16) 157 0.4 468 1.1113 Australia (10) 555 1.3 412 0.9714 Equatorial Guinea - - 314 0.7415 Vietnam (12) 372 0.9 230 0.5416 South Africa - - 164 0.3917 Pakistan (20) 33 0.1 138 0.3318 Myanmar - - 67 0.1619 Congo (former Zaire) (13) 324 0.8 - -20 Papua New Guinea (15) 212 0.5 - -21 Ecuador (17) 145 0.4 - -22 Russia (18) 140 0.3 - -23 China (19) 84 0.2 - -24 Japan (21) 29 0.1 - -25 Ukraine (22) 27 0.1 - -26 Singapore (23) 27 0.1 - -
Total 41,329 100.0 42,280 100.00
Number in bracket is the rank in 20011 barrel = 158.99 liters
Source: PTIT
Domestic production was up by 22%, and export alsogrew up 37%, compared to the total import, itûs netimport continued expanding.
After reaching zero export in 2001, again Thailandshipped out around 5,000 barrels a day of condensateduring the year.
Net Oil Import2000 2001 2002
Total import 643.5 680.0 728.6Total export 27.5 36.5 47.9Net import 616.0 643.5 680.5
Unit in MbpdOE

14 2002AnnualR
eport
Gas production increased by 4%. The increment was less than of the imported gas (16%).Deducted from petrochemical use, gas for fuelling shrinked around 3%. Most reductionmainly caused by 11% down of IPP and SPP consumption.
Refined Products
ItemImport Production Consumption Export
2001 2002 2001 2002 2001 2002 2001 2002LPG - - 101.4 101.6 76.4 78.8 24.2 21.7Gasoline 2.5 3.9 143.3 142.2 118.2 126.2 25.5 21.2Kerosene - - 10.1 9.5 1.0 1.1 6.8 5.5Jet Fuel 0.1 0.9 71.4 80.4 64.0 65.1 8.4 15.9Diesel 5.5 12.2 286.5 299.4 262.3 277.1 28.4 40.2Fuel Oil - - 110.1 102.8 78.1 82.4 26.5 13.2Bitumen 0.0 0.0 19.4 16.1 14.7 14.0 5.0 2.5
Unit in Mbpd
In terms of refined products, Thailand seemed to be a producer, importing crude oil, refiningit and using most of the production domestically. Thailand has exported petroleum productsmuch more than of its import for many years.
In 2002, changes varied differently in many items. LPG has no import for third year in a row.Its production as well as consumption went up in the same direction.
Gasoline and diesel, extensively used in transportation, kept growing. Uses nationwide wentup by 7% for gasoline and around 6% for diesel. Growth in consumption, production, importand export of diesel exceeded any other refined product in 2002.
Acted obviously as a kerosene supplier, Thailand used domestically only one fifth of its pro-duction in 2002.
Domestic Petroleum Substitution1997 1998 1999 2000 2001 2002
Domestic Production 333.6 350.9 385.6 429.1 429.7 461.1
Local Consumption 897.0 840.2 863.6 940.3 952.6 967.9
% Substitution 37.2 41.8 44.7 45.6 45.1 47.6
Unit in MbpdOE
The development of petroleum resources clearly benefit Thailand, as has been evidenced.

15 2002AnnualR
eport
THAI
LAN
Dû s
PETR
OLE
UM
BAL
ANCE
S (J
anua
ry-D
ecem
ber
2002
)
Uni
t :
Mbp
dOE
Sour
ce :
PT
IT

16 2002AnnualR
eport
Petroleum ConcessionsChronology of the 18th Petroleum Concession Bidding Round
For the 18th Bidding Round as announced on 11 July 2000, international oil companies wereinvited to apply for rights to explore and produce petroleum in any of 87 exploration blocksin Thailand. The submission period will be 3 years from the date of the Announcement (11 July2000 - 10 July 2003). Round of submission will be before the 15th of each month.
15 August 2000 5 oil companies submitted their applications as follows:Thai Shell/PTTEP applied for onshore Blocks L10/43, L11/43, L21/43and L22/43Harrods Energy applied for offshore Block G4/43CNPC (Hong Kong) applied for onshore Block L21/43Pacific Tiger applied for onshore Block L44/43Chevron applied for offshore Block G4/43Status Submitting for final approval by the Cabinet, 4 Blocks shall
be awarded to 4 oil companies as follows:L22/43 to Thai Shell/PTTEPL21/43 to CNPCL44/43 to Pacific TigerG4/43 to Chevron
15 March 2002 SVS Energy applied for onshore Block L71/43NuCoastal applied for offshore Block G5/43Pacific Tiger applied for onshore Block L33/43Status Submitting for final approval by the Cabinet, 3 Blocks shall
be awarded to 3 oil companies as follows:L71/43 to SVS EnergyG5/43 to NuCoastalL33/43 to Pacific Tiger
15 September 2002 NuCoastal applied for onshore Blocks L15/43 and L27/43Status Under the consideration of the Petroleum Committee
New Production Areas8 PLAs were granted to 6 Concessionaires as follows:
PLA Concessionaire Block Sq. Km. Approved Date
West YalaUnocal
B10 105.99 23 Apr 02
Greater Funan B12, B13 426.82
Jasmine Harrods B5/27 48.6388 30 Sep 02
Ton Rang PTT E&P B15 18.2784 30 Sep 02
Sang KajaiPTTEP Intû l
PTTEP1 1.98 8 May 02
Pikul B13/38 1.9264 30 Sep 02
South Pradoo Tao Thai Shell S1 90.4340 30 Sep 02
Wichian Buri Licence II Pacific Tiger SW1A 8.6411 30 Sep 02

17 2002AnnualR
eport
Unocal Thailand Limited planned to produce natural gas from West Yala at the rate of9 MMscf/d toward to the peak rate of 65 MMscf/d in 2005. The production of condensateand oil are expected at the peak rate of 4,300 bbl/d in first year. The production periodwill be 16 years. With regard to Greater Funan, Unocal planned to produce natural gas andcondensate at the rate of 185 MMscf/d and 6,200 bbl/d respectively. The production periodwill be 17 years.
Harrods Energy (Thailand) Limited planned to produce oil from Jasmine at the rate of 12,000bbl/d in early 2005 toward to the peak rate of 22,000 bbl/d in April 2006. The productionwill then decline and be completed in 2010.
PTT Exploration and Production Public Company Limited planned to share the productionfacilities with Bongkot Field for Ton Rangûûs production. The production of natural gas andcondensate are expected at the rate of 85 MMscf/d and 847 bbl/d respectively in 2003 thendecline and be completed in 2008.
PTTEP International Limited planned to produce oil with natural pressure from Sang Kajai atthe rate of 420 bbl/d for one year then using rod pump until completed the production in mid2006. With regard to Pikul, PTTEP planned to share the production facilities with BongkotField. The production of natural gas and condensate are expected at the rate of 20 MMscf/dand 200 bbl/d respectively in 2004 then decline and be completed in 2008.
Thai Shell Exploration and Production Company Limited planned to produce oil from SouthPradoo Tao with existing production equipment at the rate of 1,300 bbl/d toward the peakrate of 2,700 bbl/d. The production will then decline and be completed in 2013.
Pacific Tiger Energy (Thailand) Limited planned to produce oil from Wichian Buri Licence IIat the peak rate of 110 bbl/d in 2005. The production period will be 10 years.

18 2002AnnualR
eport
Bidding Areas

19 2002AnnualR
eport
Gulf of Thailand
1/ 2514 Thailand Blocks 5 and 6 LLC 50.00 B5 4,645.00 - -26 Nov 71 Idemitsu Oil & Gas Co., Ltd. 50.00 B6 5,510.00 - -
1/2515/5 Gas Sale Agreement No.2 (Unit Area I)1 Mar 72 Unocal Thailand, Ltd. (Operator) 70.00 B10 - 277.62 637.8924
Mitsui Oil Exploration Co., Ltd. 30.00 B11 - 213.02 977.6055
Gas Sale Agreement No.2 (Supplementary) (Unit Area II)Unocal Thailand, Ltd. (Operator) 71.25Mitsui Oil Exploration Co., Ltd. 23.75PTT Exploration and Production Public Co., Ltd. 5.00
Thailand-Cambodia Overlapping AreaUnocal Thailand, Ltd. (Operator) 60.00 B10 1,382.90 - -Mitsui Oil Exploration Co., Ltd. 40.00 B11 1,401.49 - -
17 Dec 97 Unocal Thailand, Ltd. (Operator) 60.00 B10A 166.00 - -Sup.No 9 Mitsui Oil Exploration Co., Ltd. 40.00 B11A 88.00 - -
2/2515/6 Gas Sale Agreement No.11Mar 72 Unocal Thailand, Ltd. (Operator) 80.00 B12 - 1,077.45 196.71
Mitsui Oil Exploration Co., Ltd. 20.00 B13 - 292.88 896.375
Gas Sale Agreement No.2 (Unit Area I)Unocal Thailand, Ltd. (Operator) 70.00Mitsui Oil Exploration Co., Ltd. 30.00
Gas Sale Agreement No.2 (Supplementary) (unit Area II)Unocal Thailand, Ltd. (Operator) 71.25Mitsui Oil Exploration Co., Ltd. 23.75PTT Exploration and Production Public Co., Ltd. 5.00
8 Jun 99 Thailand-Cambodia Overlapping AreaSup.No6 Unocal Thailand, Ltd. (Operator) 80.00 B12 (A) 294.00 - -
Mitsui Oil Exploration Co., Ltd. 20.00 B12 (B) 125.00 - -B13
3/2515/7 PTT Exploration and Production Public Co.,Ltd.(Operator) 44.45 B16 - 421.66 981.458 Mar 72 Total FinaElf E&P Thailand 33.33 B17 - 105.00 413.38
British Gas Thailand PTE Ltd. 22.22
1 June 98 PTT Exploration and Production Public Co., Ltd.(Operator) 80.00 B16A 719.00 - -Unocal Thailand, Ltd. 16.00Moeco Thailand Co.,Ltd. 4.00
4/2515/8 Thailand-Cambodia Overlapping Area9 Mar 72 British Gas Asia Inc. (Operator) 50.00 B7 4,760.00 - -
Chevron Overseas Petroleum Thailand Ltd. 33.33 B8 3,400.00 - -Petroleum Resources (Thailand) Pty., Ltd. 16.67 B9 2,260.00 - -
5/ 2515/9 PTT Exploration and Production Public Co.,Ltd.(Operator) 44.45 B15 - 272.2784 1,006.7210 Mar 72 Total FinaElf E&P Thailand 33.33
British Gas Thailand PTE Ltd. 22.22
1 June 98 PTT Exploration and Production Public Co., Ltd.(Operator) 80.00 B14A 1,887.00 - -Unocal Thailand, Ltd. 16.00Moeco Thailand Co., Ltd. 4.00
1 June 98 PTT Exploration and Production Public Co.,Ltd.(Operator) 80.00 B15A 1,460.00 - -Unocal Thailand ,Ltd. 16.00Moeco Thailand Co.,Ltd. 4.00
3/2528/28 Thai Shell Exploration and Production Co.,Ltd. 100.00 B6/27 - 4.00 1,302.606 Feb 85
Petroleum Concessionaires in Thailand(as of 31 December 2002)
Concess. No.Concessionaire (s) (as of Jan 2003)
ShareBlock
Concession area (sq. km)
Date of Issue (%) Exploration Production Reserves

20 2002AnnualR
eport
1/2529/33 Unocal Thailand, Ltd. (Operator) 35.00 B12/27 - 1,429.73 1,687.7115 Jan 86 PTT Exploration and Production Public Co.,Ltd. 45.00
Amerada Hess (Thailand) Co., Ltd. 15.00MOECO Thai Oil Development Co.,Ltd. 5.00
1/2532/35 Harrods Energy (Thailand) Ltd. 100.00 B5/27 - 48.6388 -9 Aug 89
6/2534/41 Chevron Offshore (Thailand) Ltd. (Operator) 31 2/3 B8/32 - 1,282.85 1,330.9211 Sep 91 Thaipo Ltd. 31 2/3
B 8/32 Partners Ltd. 31 2/3Palang Sophon Limited 5.00Tantawan Production AreaChevron Offshore (Thailand) Ltd. (Operator) 46.34 B8/32 - 274.70 -Thaipo Ltd. 46.34Palang Sophon Limited 7.32
6/2534/41 Unocal Petroleum Ltd. (Operator) 80.00 B10/32 - 5.06 252.286411 Sep 91 Mitsui Oil Exploration Co., Ltd. 20.00
1/2535/45 Harrods Energy (Thailand) Ltd. (Operator) 74.07 B12/32 2,715.08 121.92 -12 Mar 92 Songkhla Resources Ltd. 25.93
2/2539/49 PTTEP International Ltd. (Operator) 44.45 B13/38 161.63 1.9264 -27 Jun 96 TotalFinaElf E&P Thailand 33.33
Thai Energy Co., Ltd. 22.223/2539/50 Soco Exploration (Thailand) Co., Ltd. 50.00 B8/38 2,394.28 - -24 Oct 96
4/2539/51 Harrods Energy (Thailand) Ltd. 100.00 B11/38 2,165.00 - -28 Oct 96
1/2542/57 Devon Energy (Thailand) Ltd. 100.00 B7/38 9,238.00 - -03 Mar 99Onshore
1/2522/16 Thai Shell Exploration and Production Co.,Ltd.(Operator) 75.00 S1 - 189.604 1,136.6115 Mar 79 PTT Exploration and Production Public Co., Ltd. 25.00
2/2522/17 Namphong Area16 Mar 79 ExxonMobil Exploration and Production Khorat Inc. 80.00 E5 - 34.40 34.54
(Operator)PTT Exploration and Production Public Co., Ltd. 20.00Outside Namphong AreaAmerada Hess (Thailand) Co., Ltd. (Operator) 80.00 E5 - - 39.31PTT Exploration and Production Public Co., Ltd. 20.00
1/2524/19 Amerada Hess (Thailand) Co., Ltd. 100.00 EU1 - 1.96 190.933 Jun 81
1/2526/23 Sino-U.S. Petroleum Inc. (Operator) 33.33 NC - 11.244 -12 Apr 83 Combined Oil and Gas (Thailand) Inc. 33.33
Thai Energy Resources Ltd. 16.67Sino Thai Energy Ltd. 16.67
1/2527/24 Pacific Tiger Energy (Thailand) Ltd. 100.00 SW1A - 14.4611 -24 Jul 84
2/2528/27 PTTEP International Ltd. 100.00 PTTEP1 - 9.04 -5 Feb 85
Concess. No.Concessionaire (s) (as of Jan 2003)
ShareBlock
Concession area (sq. km)
Date of Issue (%) Exploration Production Reserves
Joint Development Area (MTJA)1. CTOC Block A-182. CPOC Block B-17, C-19
Area Concessions BlocksGulf of Thailand 16 23Onshore 6 6Total 22 29
Exploration Production ReserveOnshore - 260.7091 1,401.39Gulf of Thailand 45,243.38 5,828.73 10,708.65Total 45,243.38 6,089.44 12,110.0411
Total Concession Areas (sq.km.)
Total Petroleum Concessions In Thailand (as of 31 December 2002)

21 2002AnnualR
eport
Thailand Onshore Petroleum Concession Map (As of January 2003)

22 2002AnnualR
eport
Thailand Offshore Petroleum Concession Map (As of January 2003)

23 2002AnnualR
eport
Granted Petroleum Production Areas in Thailand(as of 31 December 2002)
Operator Production Area Name Issued Area IssuedConcession No. No. Block (sq. km) Date
Offshore (Gulf of Thailand)
PTT Exploration && Production Public Co., Ltd.3/2515/7 1 Bongkot 16B B16 280.0000 18 Mar 83
2 Bongkot 16E 40.0000 17 May 833 Bai Bua - 1 101.6590 16 Sep 974 Bongkot 17E B17 105.0000 17 May 83
PTT Exploration && Production Public Co., Ltd.5/2515/9 5 Bongkot 15B B15 254.0000 16 Aug 82
6 Tonsak 187.0900 6 Feb 017 Ton Rang 18.2784 30 Sep 02
Chevron Offshore (Thailand) Ltd1/2534/36 8 Tantawan B8/32 274.6670 23 Aug 95
9 Benchamas & Pakrakrong 411.1500 16 Jun 9710 Maliwan 368.5000 3 Nov 9711 North Jarmjuree 503.2000 2 Nov 00
Thai Shell Exploration && Production Co., Ltd.3/2528/28 12 Nang Nuan A02 B6/27 2.0000 24 Nov 87
13 Nang Nuan B01 2.0000 10 Feb 93
Unocal Thailand, Ltd.1/2515/5 14 Platong Area 1 B10 49.4800 29 Oct 82
15 Kaphong Area 2 32.8000 24 Oct 8316 Platong Area 0.2500 4 Dec 8417 Kaphong Area 2-Extension 17.0000 17 May 8918 Surat Area 3 7.5800 8 Apr 9119 Platong F Platform 1.7540 22 Apr 9420 Surat Area 5 1.9920 27 May 9421 Plamuk Area 6 50.0710 15 Sep 9722 Platong H Platform Area 7 7.1370 3 Nov 9723 Kaphong A Platform Area 8 3.3868 3 Mar 9924 West Yala 105.99 23 Apr 0225 North Pladang Area 2 B11 2.0000 29 Oct 8226 Pladang Area 3 40.2400 29 Oct 8227 Satun Area 1 3.2200 29 Oct 8228 Platong Area 2 11.0900 29 Oct 8229 Trat Area 5 2.0000 11 Jan 8330 Pakarang Area 6 2.0000 11 Jan 8331 Platong Area 2-Extension 1.7500 4 Dec 8432 Satun Area 1-Extension 20.5300 27 Dec 8433 Platong Area 7 9.7030 25 Dec 8734 North Satun 20.2380 30 Mar 9235 Platong F Platform 6.0260 22 Apr 9436 Pladang A & PDD-2 Area 10 18.7600 23 Jun 9737 Plamuk Area 11 9.7270 15 Sep 9738 Platong E Area 11 0.6740 3 Mar 9939 Trat Area 13 65.2198 26 Jul 99
Unocal Thailand, Ltd.2/2515/6 40 Erawan Area 1 B12 109.1600 26 Dec 79
41 Erawan Area 2 31.6700 24 Feb 8142 Satun Area 3 53.9800 29 Oct 8243 Erawan Area 1-2-Extension 17.9600 3 May 84

24 2002AnnualR
eport
Operator Production Area Name Issued Area IssuedConcession No. No. Block (sq. km) Date
44 Erawan Area 1-Extension 15.2100 3 May 8445 Satun Area 3-Extension (1) 16.2800 27 Dec 8446 Satun Area 3-Extension (2) 22.0500 27 Dec 8447 Erawan Area-Extension (1) 57.6000 29 Apr 8548 Erawan Area 1-Extension (M) 10.5600 11 Apr 8849 Erawan Area 1-Extension (N) 4.0000 13 Oct 8850 Jakrawan Area 4 3.2300 15 Nov 8951 Satun Area 5 10.3500 18 May 9052 Erawan Area 1-Extension (P) 2.3200 9 Aug 9053 Satun Area 6 18.5900 29 Oct 9054 Erawan Area 1-Extension (R & Q) 25.5030 3 Nov 9355 Funan G 2.7450 4 Oct 9456 Erawan S & T Platforms 30.8890 22 Nov 9457 Jakrawan B, C & D 50.0770 3 Apr 9658 Satun L Platform Area 10 23.4323 24 Feb 9759 Jakrawan E & I Area 11 5.5721 23 Sep 9760 Jakrawan F & H Area 12 8.7485 23 Sep 9761 East Dara Area 13 129.7000 6 Dec 00
Unocal Thailand, Ltd.2/2515/6 62 Erawan Area 1 B13 5.4200 26 Dec 79
63 Baanpot Area 2 35.4300 29 Oct 8264 Funan Area 4 2.0000 11 Jan 8365 Baanpot Area 3 7.9900 14 Dec 8366 Erawan Area 1-N-Extension 7.3200 29 Apr 8567 Erawan Area 1-Extension (s) 1.6900 3 Oct 8668 Baanpot Area 5 2.5360 20 Aug 8769 Baanpot Area 5-Extension 11.0000 26 Feb 8870 Jakrawan Area 3 12.7100 15 Nov 8971 Funan Area 4-Addition 99.0610 28 Aug 9172 Jakrawan Area 6 1.9380 6 Oct 9373 Funan G 6.3000 4 Oct 9474 Gomin A & B Area 8 20.1090 10 Jul 9575 Funan H & I 23.0110 22 Apr 9676 Jakrawan E & I Area 10 9.4498 23 Sep 9777 Jakrawan F & H Area 11 5.9641 23 Sep 9778 Funan J Platform (Area 12) 11.3900 26 Apr 0079 Funan B & H Infill Platform 9.6600 2 Nov 0080 Funan K Area 14 19.9000 2 Nov 0081 Greater Funan 426.82 23 Apr 02
Unocal Petroleum, Ltd.5/2534/41 82 West Dara B 10/32 5.0600 6 Dec 00
Unocal Thailand, Ltd.1/2529/33 83 Main Pailin Area 1 452.6200 5 Jan 94
84 North Pailin Area 2 325.4930 3 Nov 9785 South Pailin Area 3 B12/27 118.6290 27 Aug 9886 West Pailin Area 4 149.8510 27 Aug 9887 Moragot Area 5 383.1400 27 Aug 98
Harrods Energy (Thailand) Ltd.
1/2532/35 88 Jasmine B5/27 48.6388 30 Sep 02
Harrods Energy (Thailand) Ltd.
1/2535/45 89 Bussabong B12/32 121.9200 6 Feb 01
PTTEP International Ltd.
2/2539/49 90 Pikul B13/38 1.9264 30 Sep 02

25 2002AnnualR
eport
Operator Production Area Name Issued Area IssuedConcession No. No. Block (sq. km) Date
Onshore
ExxonMobil Exploration && Production Khorat Inc.
2/2522/17 1 Nam Phong E5 34.4000 5 Feb 88
Amerada Hess (Thailand) Co.Ltd.
1/2524/19 2 Phu Horm-1 EU1 1.9600 15 May 89
Pacific Tiger Energy (Thailand) Ltd.
1/2527/24 3 Wichian Buri SW1A 2.0000 24 Jan 924 Na Sanun 1.9720 12 May 955 Si Thep 1.8480 13 May 976 Wichian Buri Licence II 8.6411 30 Sep 02
PTTEP International Ltd.
2/2528/27 7 U-Thong PTTEP 1 5.0600 10 Aug 908 Kamphaeng Saen 2.0000 10 Aug 909 Sang Kajai 1.98 8 May 02
Sino-U.S. Petroleum Inc.
1/2526/23 10 Bung Ya Structure NC 5.4189 15 Jan 9111 Bung Muang-2 1.9970 5 Jan 9412 Bung Muang & Bung Ya Area I 0.9100 22 Jul 9613 Bung Muang & Bung Ya Area II 2.0020 12 Jul 9614 Bung Muang & Bung Ya Area III 0.9160 12 Jul 96
Thai Shell Exploration && Production Co., Ltd.
1/2522/16 15 Sirikit S1 25.0000 11 Jan 8316 Sirikit F01 10.7000 13 May 8317 Sirikit South 14.7500 20 Aug 8418 Sirikit West 2.9120 9 Oct 8419 Pru Krathiam 16.1172 15 Dec 8620 Wat Taen 2.0000 4 Mar 8821 Thap Rat 1.9490 27 Jan 8922 Nong Tum 1.9733 23 Feb 9023 Pratu Tao 1.9954 24 Mar 8924 Sirikit East 1.9300 10 Feb 9325 Nong Makhaam E 1.8600 19 Apr 9326 Sirikit T 2.4960 27 Aug 9827 Nong Makhaam 15.4920 19 Oct 9928 South Pradoo Tao 90.4340 30 Sep 02
Source : Bureau of Petroleum Operations and Coordination, DMF

26 2002AnnualR
eport
Petroleum InvestmentThere has been an enormous amount of money spent on petroleum exploration and productionactivities in Thailand. The expenditures can be grouped under three categories:
1. Exploration Costs include the cost of geological survey, seismic survey either 2D or 3D,exploratory drilling, development of drilling techniques.
2. Development Costs include cost of construction, installation platform, facilities, pipeline,tanker, infrastructure, research and development.
3. Operating Costs include the cost of maintaining the operation, acquisition cost, productioncost, administration, overhaead charge and royalty.
For 30 years in conducting petroleum operation, total petroleum expenditures were as follows:47% operating cost, 28% development cost and 25% exploration cost. Compared to year 2002,slightly increased for operating cost (49%) followed by exploration cost (31%) and developmentcost reduced to 20% as shown in the figures.
Cummulative 1981-2001
Cummulative 12002
Operating Cost
47 %
Exploration Cost
25 %
Development Cost
28 %
Operating Cost
49 %
Exploration Cost
31 %
Development Cost
20 %

27 2002AnnualR
eport
For more than 30 years, concessionaires have invested 536,668 million baht in upstreampetroleum activities. 17% onshore and 83% offshore investment cost. Petroleum productionmainly came from gas fields in offshore areas. Annual petroleum expenditures both onshoreand offshore area were summarized as illustrated in the following table.
Year Onshore Offshore Total1971 - 1991 35,412 92,597 128,008
1992 3,025 13,603 16,6281993 2,860 14,981 17,8411994 3,227 16,171 19,3991995 2,638 20,290 22,9281996 3,587 23,384 26,9711997 4,746 37,404 42,1501998 6,264 44,072 50,3351999 5,382 35,999 41,3822000 7,362 38,384 45,7462001 6,774 53,999 60,7732002 7,327 57,180 64,507
88,603 448,065 536,668

28 2002AnnualR
eport
Petroleum ExplorationSeismic surveyIn the year 2002, no extensive onshore seismic survey has been done as in previous years.There were only offshore seismic surveys. The main reasons were no new block awarded andthe seismic survey in the existing block itself was almost in mature stage. However, there wassome seismic acquisition in the gulf of Thailand for either complementing exploratorycommitment or future field development.Soco has contracted Multiwave Geological Company for further 2D seismic survey required inblock B8/38 to total recording distance of 1,128.6 km.Unocal has completed additional 3D seismic survey in North Surat Area (block B10) and NorthDara Area (block B12&B10/32) total area of 481.5 sq. km.Chevron hired Fugro Airborne Surveys Limited conducting gravity and magnetic survey in blockB8/32, total recording of 1,766 km. and 13,213 km. respectively.
Exploration DrillingExploration activities have been mainly focused on offshore areas with only one well beingdrilled onshore. Altogether 22 exploratory and delineation wells were drilled in 2002, just onlyhalf the number drilled in the previous year. All wells, except one reported hydrocarbons.
Amerada Hess drilled the onshore well Phu Horm-3 (located in the Watershed Area, Class 1Aof the National Reserved Forest) in June 2002. A sever gas kick was observed and shortly afterdrilling operations were suspended. Amerada Hess intend to resume drilling operations in early2003.
Chevron drilled 6 delineation wells, 2 in Benchamas, Tantawan and Jamjuree field. All wellsfound oil which well contribute to further field development.
PTTEP drilled 2 exploration wells, one in Arthit project another in Pikul structure both weregas well. Arthit-14-6X was the last well of Arthit drilling campaign and has convinced PTTEPof getting sufficient informative datas which essential for final field assessment prior totender production area application.Pikul-2X was the second well drilled in Pikul structure inblock B13/38 and the result proved economic viability for field development. In addition, twodelineation wells were drilled in Bongkot and Tonsak area and found gas as well, encouragingmore field development.
Unocal drilled 11 delineation wells to get more information from several existing fielddevelopments i.e. plamuk, 11A-2, Erawan, Moragot and Pailin in block B10, B11A, B12 &B12/27 respectively. Only one of the wells drilled was dry.

29 2002AnnualR
eport
Operator Block Well name Duration TD (m) Result
Onshore
Amerada Hess E5 Phu Horm-3 9 Jun-24 Aug 02 2,478 Suspended
Gulf of Thailand
Chevron B8/32 Benchamas North-4 1-13 Jul 02 3,538 Oil
Benchamas-26 14-20 Jul 02 2,399 Oil
Jamjuree-9 21-27 Jul 02 2,914 Oil
Jamjuree-10 23 Aug-2 Sep 02 2,860 Oil
Tantawan-21 28 Jul-7 Aug 02 3,333 Oil
Tantawan-22 9-21 Aug 02 3,546 Oil
PTTEP B14A Arthit-14-6x 7-17 Jan 02 3,325 Gas
B15 Tonsak-6 2-12 Jun 02 2,770 Gas
B16 BK-Del-22 27 Jan-4 Feb 02 3,064 Gas
B13/38 Pikul-2X 17-22 Jan 02 2,186 Gas
Unocal B10 Plamuk-6 15-22 Sep 02 3,528 Oil&Gas
B11A 11A-2 17-22 Apr 02 3,267 Oil&Gas
B12 Erawan12-48 27 Jul-4 Aug 02 3,403 Gas
Erawan12-49 21-27 Sep 02 3,440 Gas
B12/27 Moragot-05 24 Apr-1 May 02 3,284 Gas
Pailin-40 12-19 Mar 02 3,438 Gas
Pailin-41 3-8 May 02 3,404 Gas
Pailin-42 20-26 Mar 02 3,414 Gas
Pailin-43 9-14 Apr 02 2,712 Dry
Pailin-44 28 Mar-5 Apr 02 4,263 Gas
Pailin-45 25 Jul-2 Aug 02 3,637 Gas
Exploration Drilling in 2002

30 2002AnnualR
eport
Field DevelopmentDevelopment wellThis year field development has been dominated by the offshore sector with 310 offshore wellsbeing drilled and only 29 wells onshore.The number of wells drilled this year is nearly double when compared to the last year, due toimproved drilling practices and attractive petroleum prices.
Sino-U.S. drilled 4 wells in Bung Muang structure in order to regain the production rate whichdeclined rapidly after a few months of production.
Thai Shell drilled 21 development wells in block S1 which is still focusing on Sirikit main andNong Makhaam area of which 13 and 5 wells drilled respectively. The rest were drilled inGraeter Pratu Toa area. The production mechanism of some wells were changed over fromconventional artificial gaslift to Electrical Submersible Pump according to high base sedimentwater (BS&W). All produced water has been re-injected in to the depleted formation forflooding purpose. The waterflood project in order to fully develop Sirikit West area has beenstarted by drilling 4 water injection wells in the appropriately desired location. Also,2 shallow water source wells were drilled to support further the full scale waterflood projectof the whole area in the future.
PTTEP drilled only 16 development wells on the existing platforms due to rig inavailability. Inaddition, the latest wellhead platform, WP-14 is under construction and will be completedby early next year.
Chevron added 4 development wells in Tantawan and 5 platforms of Benchamas field havebeen drilled with 46 development wells to enhance its production rate. Furthermore, 6 waterinjection wells for the waterflood project in Benchamas field have been drilled back to back.After months of flooding, the increment of production rate on each targeted producer wellwas clearly observed.
Unocal is still the main producer in the gulf of Thailand. A large number of 343 developmentwells were drilled to boost up its gas and oil production especially in Erawan field followed byNorth Pailin and Plamuk with the number of well drilled 132, 59 and 42 respectively. To avoiddischarging produced water directly into the sea, 3 more water injection wells were employedin Pailin central production platform (PACPP) enhancing water disposal capacity.
Pacific Tiger has maitained its business by adding 4 development wells in the block andenhancing production performance by means of downhole device, called the progressivecavity pump(PCP) instead of beam pumping due to high viscosity of crude oil.
The existing small production field without drilling activities are Nam Phong, Authong andKhamphang Saen.

31 2002AnnualR
eport
Development Drilling in 2002Operator Block Well name Duration Active Days TD (m) Result
OnshorePacific Tiger SW1A Wichian Buri North-3 10 Jan-2 Feb 02 23 1,033 Oil
Wichian Buri North-4 11-14 Oct 02 4 1,565 OilWichian Buri North-5 5-8 Oct 02 4 1,284 OilWichian Buri North-6 8-11 Oct 02 4 1,312 Oil
Sino-U.S. NC Bung Muang 2-12 1-19 Feb 02 19 3,010 OilBung Muang 2-13 22 Feb-8 Mar 02 14 2,938 OilBung Muang 2-14 1-25 Nov 02 25 2,845 OilBung Muang 2-15 29 Nov-12 Dec 02 14 2,828 Oil
Thai Shell S1 Lan Krabu-W05 8-12 Jan 02 4 2,238 OilLan Krabu-CA02 14-21 Jan 02 7 2,566 OilNong Makhaam-C10 24-28 Jan 02 5 2,213 OilNong Tum-A02 31 Jan-13 Feb 02 14 3,792 OilNong Tum-A03 13-28 Feb 02 15 3,755 OilPratu Tao-A05 12-23 Apr 02 12 3,872 OilLan Krabu-A11 27 Apr-2 May 02 5 2,398 OilLan Krabu-A12 2-6 May 02 5 2,414 OilLan Krabu-A13 7-12 May 02 6 2,176 OilLan Krabu-A14 13-21 May 02 8 2,507 OilLan Krabu-A15 22-27 May 02 5 2,330 OilLan Krabu-S05 11-18 Jun 02 7 2,401 OilLan Krabu-S06 18-26 Jun 02 8 2,476 OilLan Krabu-R08 29 Jun-5 Jul 02 7 2,528 OilLan Krabu-R09 5-12 Jul 02 7 2,432 OilNong Makhaam-E02 15-20 Jul 02 6 2,325 OilLan Krabu-G07 21-27 Oct 02 6 2,490 OilLan Krabu-L15 30 Oct-3 Nov 02 5 2,706 OilNong Makhaam-C11 21-25 Nov 02 5 2,027 OilNong Makhaam-C14 9-14 Dec 02 5 2,367 OilNong Makhaam-F12 24-28 Dec 02 4 1,757 Oil
Gulf of ThailandChevron B8/32 Benchamas B-30 2-15 Jan 02 10 3,603 Oil
Benchamas B-32 5-21 Jan 02 9 3,362 Oil&GasBenchamas B-31 7 Feb-22 Mar 02 8 3,181 Oil&GasBenchamas H-1 7 Apr-2 May 02 11 3,162 GasBenchamas H-2 6 Apr-7 May 02 9 3,319 Oil&GasBenchamas H-3 13 Apr-11 May 02 8 2,918 GasBenchamas H-4 8 Apr-14 May 02 7 2,923 Oil&GasBenchamas H-5 14 Apr-17 Jun 02 8 2,802 OilBenchamas H-6 14 Apr-20 Jun 02 7 2,214 OilBenchamas H-7 9 Apr-24 May 02 16 3,296 Oil&GasBenchamas H-7ST2 9 Apr-27 Jun 02 27 3,338 Oil&GasBenchamas H-8ST1 9 Apr-12 Jun 02 25 4,316 OilBenchamas E-1 19 May-29 Jun 02 10 2,995 GasBenchamas E-2 22 May-24 Jun 02 17 2,818 Oil&GasBenchamas E-4 24 May-9 Jul 02 8 2,890 Oil&GasBenchamas E-5 21 May-12 Jul 02 7 3,291 Oil&GasBenchamas E-6ST1 28 May-29 Jul 02 14 3,723 Oil&Gas

32 2002AnnualR
eport
Operator Block Well name Duration Active Days TD (m) Result
Benchamas E-7 29 May-19 Jul 02 10 4,201 Oil&GasBenchamas E-9 19 May-1 Aug 02 8 2,688 Oil&GasBenchamas I-1 16 Aug-14 Sep 02 12 3,266 Oil&GasBenchamas I-2 21 Aug-18 Sep 02 6 2,948 Oil&GasBenchamas I-3 22 Aug-21 Sep 02 6 3,255 Oil&GasBenchamas I-4 11 Aug-26 Sep 02 9 2,817 Oil&GasBenchamas I-5ST1 15 Aug-24 Oct 02 15 3,628 Oil&GasBenchamas I-7 13 Aug-4 Oct 02 12 2,933 Oil&GasBenchamas I-8 9 Aug-8 Oct 02 10 3,112 Oil&GasBenchamas I-9 22 Aug-13 Oct 02 8 3,536 Oil&GasBenchamas I-10 14-27Oct 02 7 3,370 Oil&GasBenchamas G-1 9 Sep-10 Oct 02 10 3,364 Oil&GasBenchamas G-2 8 Sep-2 Oct 02 12 3,503 Oil&GasBenchamas G-3 11 Sep-20 Oct 02 7 3,033 Oil&GasBenchamas G-4 8 Sep-13 Oct 02 8 3,326 Oil&GasBenchamas G-5 12 Sep-6 Nov 02 11 2,664 Oil&GasBenchamas G-6 13 Sep-24 Oct 02 7 2,898 Oil&GasBenchamas G-7 7 Sep-5 Oct 02 7 3,568 Oil&GasBenchamas G-8 9 Sep-17 Oct 02 8 3,029 Oil&GasBenchamas G-9 7-15 Nov 02 7 2,898 Oil&GasBenchamas G-10 7-18 Nov 02 6 2,805 Oil&GasBenchamas D-1 9 Nov-3 Dec 02 12 3,254 Oil&GasBenchamas D-2 2 Nov-7 Dec 02 10 3,198 Oil&GasBenchamas D-3 5 Nov 02-7 Jan 03 8 3,722 Oil&GasBenchamas D-4 7 Nov-11 Dec 02 8 3,112 Oil&GasBenchamas D-5 3 Nov-17 Dec 02 12 3,173 Oil&GasBenchamas D-6 6 Nov-24 Dec 02 12 3,490 Oil&GasBenchamas D-7 11 Nov-30 Dec 02 10 3,285 Oil&GasBenchamas D-8 11 Nov 02-4 Jan 03 9 3,542 Oil&GasTantawan E-9 28 Nov-22 Dec 02 9 4,612 Oil&GasTantawan E-10 25 Nov-17 Dec 02 8 3,354 Oil&GasTantawan E-11 30 Nov-12 Dec 02 7 2,780 Oil&GasTantawan E-12 2-26 Dec 02 7 3,437 Oil&Gas
PTTEP B15 BK-11-J 28 Feb-12 Mar 02 12 3,420 GasBK-11-A 14 Aug-2 Oct 02 10 3,300 GasBK-11-B 13-22 Mar 02 10 3,035 GasBK-11-C 15-29 Aug 02 10 3,690 GasBK-11-D 19 Aug-18 Sep 02 8 3,645 GasBK-11-E 11 Aug-10 Oct 02 11 3,910 GasBK-11-F 16 Aug-11 Sep 02 9 3,910 GasBK-11-H 17 Aug-4 Sep 02 8 3,125 GasBK-11-K 9 Aug-25 Sep 02 9 3,662 GasBK-10-AE 18 May-4 Jun 02 9 2,610 GasBK-10-BW 21-29 May 02 8 2,775 GasBK-9-BWR 10-23 Jun 02 13 3,636 GasBK-9-JE 23 Jun-1 Jul 02 8 3,278 GasBK-9-FE 3-20 Jul 02 7 3,685 GasBK-9-FW 3-14 Jul 02 12 3,330 GasBK-9-BER 20 Jul-1 Aug 02 12 3,655 Gas

33 2002AnnualR
eport
Operator Block Well name Duration Active Days TD (m) Result
Unocal 10 Plamuk B -01 2 Jan-4 Feb 02 8 3,628 Oil&GasPlamuk B -02 21 Feb-3 Mar 02 10 3,477 Oil&GasPlamuk B -04 3-18 Mar 02 15 2,507 Oil&GasPlamuk B -07 5-18 Feb 02 8 3,552 Oil&GasPlamuk B -08 4-13 Feb 02 9 3,709 Oil&GasPlamuk B -15 3-30 Jan 02 8 3,589 Gas/Oil ?Plamuk B -16 3-16 Jan 02 7 3,826 Gas/OilPlamuk B -18 3-24 Jan 02 10 4,048 GasPlamuk C -01 24 Mar-14 Apr 02 8 3,951 Oil&GasPlamuk C -06 25 Mar-30 Apr 02 6 3,527 Oil&GasPlamuk C -07 25 Mar-8 Apr02 10 3,594 Oil&GasPlamuk C -10 7-30 May 02 8 3,537 Oil&GasPlamuk C -11 26 Mar-26 Apr 02 8 3,788 Oil&GasPlamuk C -12 7 May-6 Jun 02 9 4,203 Oil&GasPlamuk C -13 22 Mar-20 Apr 02 9 3,014 Oil&GasPlamuk C -14 8 May-11 Jun 02 8 3,174 Oil&GasPlamuk C -15 7-24 May 02 7 3,325 Oil&GasPlamuk C -16 11-18 Jun 02 8 3,523 Oil&GasPlamuk C -3 7-19 May 02 8 3,600 Oil&GasPlamuk C -8 26 Mar-6 May 02 8 3,912 Oil&GasPlamuk D-1 23 Jun-11 Jul 02 8 3,304 Oil&GasPlamuk D-10 23 Jun-18 Jul 02 9 3,252 Oil&GasPlamuk D-11 25 Jul-8 Aug 02 8 3,268 Oil&GasPlamuk D-12 26 Jul-22 Aug 02 8 2,975 Oil&GasPlamuk D-13 23 Jun-21 Jul 02 7 2,941 Oil&GasPlamuk D-14 26Jul-25 Aug 02 6 3,220 Oil&GasPlamuk D-2 26 Jul-17 Aug 02 6 3,195 Oil&GasPlamuk D-3 26 Aug-1 Sep 02 5 3,053 Oil&GasPlamuk D-6 26 Jul-13 Aug 02 7 3,217 Oil&GasPlamuk D-7 22 Jun-5 Jul 02 9 3,526 Oil&GasPlamuk D-9 22 Jun-25 Jul 02 9 2,758 Oil&GasPlatong G-21 27 May-2 Jun 02 7 1,902 GasPlamuk C-02 7-26 Oct 02 9 3,960 Oil&GasPlamuk C-04 7-16 Oct 02 8 3,303 Oil&GasPlamuk C-09 26 Oct-8 Nov 02 12 3,312 Oil&GasPlamuk C-17 7-31 Oct 02 8 3,914 Oil&GasPlamuk C-24 7-20 Oct 02 7 4,072 Oil&GasPlamuk D-15 12-24 Nov 02 8 3,193 Oil&GasPlamuk D-16 13-20 Nov 02 6 3,226 Oil&GasPlamuk D-17 13 Nov-7 Dec 02 6 2,740 Oil&GasPlamuk D-18 24-30 Nov 02 6 3,177 Oil&GasPlamuk D-19 24 Nov-3 Dec 02 6 3,216 Oil&GasSurat A-09 28 Oct-11 Nov 02 8 2,947 Oil&GasSurat A-10 28 Oct-16 Nov 02 7 2,822 Oil&GasSurat A-11 28 Oct-7 Nov 02 9 2,705 Oil&GasSurat A-12 27 Oct-20 Nov 02 7 3,065 Oil&GasYala B-04 9 Oct-3 Nov 02 8 3,864 Oil&GasYala B-05 10-24 Oct 02 8 3,609 Oil&GasYala B-06 10-20 Oct 02 7 3,625 Oil&Gas

34 2002AnnualR
eport
Operator Block Well name Duration Active Days TD (m) Result
Yala B-07 3-25 Nov 02 8 3,886 Oil&GasYala B-1 1 Jul-13 Aug 02 7 3,563 Gas&OilYala B-13 30 Jun-9 Aug 02 7 3,501 Gas&OilYala B-14 1-31 Jul 02 8 3,764 Oil&GasYala B-15 10-29 Oct 02 8 3,479 Oil&GasYala B-16 30 Jun-26 Jul 02 8 4,167 Oil&GasYala B-17 1 Jul-6 Aug 02 9 3,924 Gas&OilYala B-2 1-20 Jul 02 8 3,818 Oil&GasYala B-24 3-20 Nov 02 8 3,895 Oil&GasYala B-25 4-13 Nov 02 7 3,989 Oil&GasYala B-26 28 Jun-18 Aug 02 9 3,437 Gas&OilYala B-27 3-30 Nov 02 8 3,530 Oil&GasYala B-3 30 Jun-15 Jul 02 8 3,488 Oil&Gas
11 Pladang A-14 15-30 Aug 02 8 4,305 GasPladang A-15 21 Aug-3 Sep 02 8 4,421 GasPladang A-16 25 Aug-6 Sep 02 6 3,399 GasPladang A-17 16 Aug-10 Sep 02 6 4,355 GasPladang A-18 17 Aug-12 Sep 02 5 3,360 GasPladang A-19 20 Aug-17 Sep 02 8 3,463 GasTrat A-14 7-29 Dec 02 6 3,190 GasTrat A-19 14 Dec 02-1 Jan 03 6 3,214 GasTrat A-20 12 Dec 02-3 Jan 03 4 2,623 GasTrat A-21 8 Dec 02-11 Jan 03 17 3,989 GasTrat A-23 11-26 Dec 02 8 3,897 Gas
12 Erawan R-19 21 Apr-11 May 02 7 3,224 GasErawan R-20 21 Apr-7 May 02 9 4,073 GasErawan R-25 2-10 Apr 02 7 3,471 GasErawan R-26 31 Mar-16 Apr 02 9 4,028 GasErawan R-27 30 Mar-21 Apr 02 8 3,367 GasErawan R-29 21-30 Apr 02 7 3,635 GasErawan U-1 10-21 Apr 02 9 3,659 GasErawan U-2 10-26 Apr 02 7 3,968 GasErawan U-11 15-31 May 02 9 4,281 GasErawan U-12 15-21 Jun 02 7 3,865 GasErawan U-3 8 May-6 Jun 02 9 3,952 GasErawan U-4 10 Apr-8 May 02 7 3,417 GasErawan U-6 10-27 Jun 02 9 4,016 GasErawan U-7 9 May-10 Jun 02 8 3,716 GasErawan U-8 14-26 May 02 10 3,716 GasErawan F-14 8-17 Jun 02 6 3,700 GasErawan F-17 6 Jun-4 Jul 02 6 3,607 GasErawan F-18 13-28 Jul 02 6 4,331 GasErawan F-19 8-26 Jun 02 7 4,444 GasErawan F-20 9 Jun-8 Jul 02 6 3,667 GasErawan F-21 9-30 Jun 02 6 3,518 GasErawan F-22 14 Jul-5 Aug 02 8 2,638 GasErawan F-23 9-21 Jun 02 7 4,020 GasErawan F-24 13-24 Jul 02 8 4,141 GasErawan F-25 14 Jul-1 Aug 02 6 4,026 Gas

35 2002AnnualR
eport
Operator Block Well name Duration Active Days TD (m) Result
Erawan U-10 3-20 Sep 02 6 3,446 GasErawan U-13 26 Aug-29 Sep 02 6 4,284 GasErawan U-14 25 Aug-13 Sep 02 6 3,751 GasErawan U-15 26 Aug-26 Sep 02 6 3,582 GasErawan U-19 4-17 Sep 02 7 3,616 GasErawan U-22 26 Aug-10 Sep 02 7 3,521 GasErawan U-9 27 Aug-23 Sep 02 6 3,634 GasSatun J-11 30 Apr-12 May 02 6 3,790 GasSatun J-12 1-14 May 02 6 3,937 GasSatun J-13 1-18 May 02 7 3,191 GasSatun J-14 30 Apr-20 May 02 5 3,776 GasSatun J-15 1-23 May 02 6 3,115 GasSatun M-13 10-15 Jul 02 5 3,584 GasSatun M-14 26 Jun-21 Jul 02 6 3,839 GasSatun M-16 9-18 Jul 02 6 3,172 GasSatun M-17 5-24 Jul 02 7 3,212 Gas
12/27 North Pailin A - 01 15-27 Jan 02 4 3,096 GasNorth Pailin A - 02 16 Jan-1 Feb 02 5 2,851 GasNorth Pailin A - 04 15-30 Jan 02 6 3,277 GasNorth Pailin A - 05 2-11 Feb 02 5 3,471 GasNorth Pailin A - 06 3-13 Feb 02 4 2,818 GasNorth Pailin A - 08 2-9 Feb 02 5 2,887 GasNorth Pailin A - 09 3-18 Feb 02 4 2,523 GasNorth Pailin A - 10 3-16 Feb 02 5 2,877 GasNorth Pailin A - 13 3-14 Feb 02 4 3,003 GasNorth Pailin A - 15 16 Jan-2 Feb 02 4 2,850 GasNorth Pailin A - 16 16-26 Jan 02 5 2,773 GasNorth Pailin A -12 15-23 Jan 02 5 2,659 GasNorth Pailin B - 03 15 Jan-11 Feb 02 6 3,482 GasNorth Pailin B - 04 14 Jan-7 Feb 02 5 3,479 GasNorth Pailin B - 1 11 Feb-7 Mar 02 4 2,963 GasNorth Pailin B - 14 15-30 Jan 02 5 3,523 GasNorth Pailin B - 20 15 Jan-2 Feb 02 6 3,659 GasNorth Pailin B - 22 12 Feb-11 Mar 02 4 2,981 GasNorth Pailin B -09 12 Jan-5 Feb 02 6 3,338 GasNorth Pailin B -10 13-26 Jan 02 6 3,021 GasNorth Pailin B -11 13-28 Jan 02 6 3,603 GasNorth Pailin B -13 17-22 Mar 02 6 3,749 GasNorth Pailin B -17 13-27 Feb 02 7 3,313 GasNorth Pailin B -2 18 Feb-10 Mar 02 8 3,549 GasNorth Pailin B -23 14 Feb-6 Mar 02 6 3,098 GasNorth Pailin B -25 13 Feb-4 Mar 02 9 3,933 GasNorth Pailin B -27 19 Feb-1 Mar 02 6 3,953 GasNorth Pailin B -8 11-17 Mar 02 7 3,511 GasNorth Pailin C-02 11-24 Feb 02 8 3,219 GasNorth Pailin C-03 14-27 Feb 02 6 3,868 GasNorth Pailin C-06 12 Feb-4 Mar 02 11 3,7558 GasNorth Pailin C-08 13 Feb-12 Mar 02 8 3,5578 GasNorth Pailin C-09 13 Feb-8 Mar 02 5 3,581 Gas

36 2002AnnualR
eport
Operator Block Well name Duration Active Days TD (m) Result
North Pailin C-1 13 Mar-6 Apr 02 6 3,534 GasNorth Pailin C-10 13 Mar-3 Apr 02 5 3,869 GasNorth Pailin C-11 14 Feb-6 Mar 02 5 3,610 GasNorth Pailin C-4 13-25 Mar 02 6 3,609 GasNorth Pailin C-5 13-27 Mar 02 5 3,755 GasNorth Pailin C-7 12-22 Mar 02 6 3,766 GasNorth Pailin D -01 24-28 Jan 02 5 3,269 GasNorth Pailin D -03 15-21 Feb 02 7 3,299 GasNorth Pailin D -06 15-24 Feb 02 6 3,980 GasNorth Pailin D -08 18 Jan-9 Feb 02 7 3,559 GasNorth Pailin D -09 12 Feb-9 Mar 02 6 3,461 GasNorth Pailin D -11 18 Jan-12 Feb 02 6 3,712 GasNorth Pailin D -12 12-27 Feb 02 7 3,873 GasNorth Pailin D -13 16 Jan-6 Feb 02 6 3,795 GasNorth Pailin D -14 15 Jan-3 Feb 02 10 3,846 GasNorth Pailin D -15 12 Feb-5 Mar 02 8 3,942 GasNorth Pailin E-1 11 May-10 Jun 02 8 4,340 GasNorth Pailin E-11 14 May-1 Jun 02 7 3,915 GasNorth Pailin E-12 14 May-10 Jul 02 6 3,886 GasNorth Pailin E-14 16 Jun-15 Jul 02 9 3,760 GasNorth Pailin E-15 14-27 May 02 8 4,452 GasNorth Pailin E-16 14 May-15 Jun 02 8 4,261 GasNorth Pailin E-19 16 Jun-6 Jul 02 8 3,791 GasNorth Pailin E-5 16 Jun-1 Jul 02 10 4,033 GasNorth Pailin E-6 16 Jun-22 Jul 02 9 3,872 GasNorth Pailin E-9 14 May-5 Jun 02 8 4,363 GasPailin F - 14 7-23 Jun 02 11 3,520 GasPailin F -03 27 Apr-27 May 02 9 4,157 GasPailin F -07 28 Apr-13 Jun 02 8 3,995 GasPailin F -08 27 Apr-7 Jun 02 11 4,060 GasPailin F -09 29 Mar-26 Apr 02 9 3,967 GasPailin F -10 29 Mar-14 Apr 02 8 3,924 GasPailin F -11 29 Mar-20 Apr 02 9 4,077 GasPailin F -12 27 Apr-15 May 02 9 3,581 GasPailin F -13 27 Mar-11 Apr 02 5 3,493 GasPailin F -15 27 Apr-22 May 02 10 4,627 GasPailin F -17 27 Apr-1 Jun 02 7 4,130 GasPailin F-1 12 Sep-4 Nov 02 10 3,873 GasPailin F-16 10 Sep -3 Oct 02 14 4,704 GasPailin F-18 11 Sep-8 Oct 02 8 4,233 GasPailin F-4 11 Sep-16 Oct 02 9 3,793 GasPailin F-5 10 Sep-26 Oct 02 13 3,595 GasPailin G-02 28 Nov-21 Dec 02 14 4,347 GasPailin G-06 28 Nov-25 Dec 02 6 3,849 GasPailin G-12 28 Nov-11 Dec 02 10 3,904 Gas
13 Funan G-10 23 Feb-13 Mar 02 6 4,271 GasFunan G-11 23 Feb-22 Mar 02 9 3,127 GasFunan G-12 23 Mar-19 Apr 02 6 3,502 GasFunan G-13 24 Feb-7 Mar 02 7 3,057 Gas

37 2002AnnualR
eport
Operator Block Well name Duration Active Days TD (m) Result
Funan G-14 23 Mar-1 Apr 02 6 3,160 GasFunan G-15 22 Mar-11 Apr 02 13 4,096 GasFunan G-16 24 Mar-26 Apr 02 6 3,233 GasFunan G-17 23 Mar-23 Apr 02 8 3,235 GasFunan G-18 23 Mar-15 Apr 02 7 3,825 GasFunan G-4 24 Feb-10 Mar 02 6 3,482 GasFunan G-7 26 Feb-16 Mar 02 6 2,896 GasFunan F-24 13-23 Aug 02 6 3,252 GasFunan F-25 14-26 Aug 02 6 3,445 GasFunan F-29 14-29 Aug 02 6 3,268 GasFunan F-32 11 Aug-1 Sep 02 6 3,298 GasFunan F-33 15 Aug-5 Sep 02 8 3,322 GasGomin A-13 15 Nov-1 Dec 02 7 4,061 GasGomin A-15 15 Nov-4 Dec 02 7 4,374 GasGomin A-16 14-24 Nov 02 5 4,562 GasGomin A-17 8-14 Dec 02 5 3,694 GasGomin A-18 15-27 Nov 02 6 4,074 GasGomin A-19 14 Nov-7 Dec 02 6 4,177 GasGomin A-20 10-17 Dec 02 8 4,265 GasGomin C-01 22 Dec 02-16 Jan 03 4 3,669 GasGomin C-02 22 Dec 02-9 Jan 03 4 3,536 GasGomin C-04 21 Dec 02-18 Jan 03 4 3,282 GasGomin C-07 22 Dec 02-11 Jan 03 4 3,736 GasGomin C-15 22 Dec 02-13 Jan 03 4 4,012 GasGomin C-16 22 Dec 02-3 Jan 03 4 3,813 GasGomin C-18 23 Dec 02-6 Jan 03 4 3,516 GasGomin C-20 23 Dec 02-1 Jan 03 6 4,139 GasJakrawan F-01 28 Oct-16 Nov 02 6 2,964 GasJakrawan F-03 28 Oct-25 Nov 02 6 3,174 GasJakrawan F-04 5-15 Oct 02 7 3,587 GasJakrawan F-05 26 Nov-3 Dec 02 6 3,150 GasJakrawan F-06 25 Nov-6 Dec 02 6 3,632 GasJakrawan F-07 25 Nov-9 Dec 02 7 3,854 GasJakrawan F-08 4-18 Oct 02 6 3,682 GasJakrawan F-10 29 Dec 02-13 Jan 03 8 3,398 GasJakrawan F-11 5 Oct-19 Nov 02 7 3,709 GasJakrawan F-12 4-21 Oct 02 6 3,394 GasJakrawan F-13 5-27 Oct 02 6 3,097 GasJakrawan F-14 28 Oct -14 Nov 02 11 3,833 GasJakrawan F-15 4-24 Oct 02 6 3,484 GasJakrawan F-16 28 Oct-22 Nov 02 6 3,951 GasJakrawan F-17 9-20 Dec 02 7 3,190 GasJakrawan F-18 10-27 Dec 02 6 3,405 GasJakrawan F-19 9-22 Dec 02 5 3,477 GasJakrawan F-20 29 Dec 02-8 Jan 03 8 3,404 GasJakrawan F-21 10-24 Dec 02 6 3,558 GasJakrawan F-22 10-29 Dec 02 10 3,618 Gas

38 2002AnnualR
eport
Crude Oil Export in 2002
Petroleum ProductionDaily RateIn 2002 Thailand produced petroleum an equivalent to 471,736 boed, or 7.11% increase fromthe previous year. Based on heating content, shares of the produced petroleum were as follows: 74%natural gas, 10% oil and 16% condensate.
Total production of gas was 1,990 MMscfd (or 347,056 boed), 4.8% increase while domestic consumptionhad grown by 7.3%. The gap was filled with Myanmar gas. Main increments came from production ofthe Benchamas field by Chevron and Plamuk, Funan and North Pailin fields by Unocal.
Condensate was produced at 53,656 bcd (or 48,805 boed), 3.7% increase, Production by Unocal wasincreased by 7.6 %, mainly from Funan , Pailin and North Pailin fields while production from Bongkot fieldby PTTEP was decreased by 3.1%.
Crude oil production increased by 22.5% to 75,875 bod. Main increments came from offshore productionof Big Oil Project by Unocal Thailand, while onshore production mostly decreased.
Australia 5,990,406 195,979 6,186,385China 4,065,670 1,246,806 5,312,476Indonesia 4,182,442 0 4,182,442Korea 0 1,284,543 1,284,543U.S.A. 835,131 0 835,131Total 15,073,649 2,727,328 17,800,977
Unit in barrel
Exported ContentExport of petroleum liquids in 2002 was19,629,582 bbl, 47 % increase.
1,828,605 bbl Condensate was exported byUnocal and PTTEP. Unocal shipped 1,747,033bbl condensate out to Korea and PTTEPshipped 81,572 bbl to Vietnam.
Oil exports rose by 33.3%. Chevron shipped 15,073,649 bbl of their products to Australia,China, Indonesiaand U.S.A. (15.25 up) ,and Unocal Thailand delivered more oil from the Big Oil Project to Australia,China and Korea.
Unocal 1,028 1,109 7.9 35,524 37,893 6.7 1,196 11,820 888.3PTTEP 584 566 -3.1 16,208 15,763 -2.7Chevron 170 200 17.6 36,811 41,192 11.9Offshore Total 1,782 1,875 5.2 51,732 53,656 3.7 38,007 53,012 39.5Thai Shell 57 56 -1.8 21,570 20,598 -4.5ExxonMobil 60 59 -1.7PTTEPI 597 627 5.0Sino-US. 903 803 -11.1Pacific Tiger 196 174 -11.2DED 661 661 0.0Onshore Total 117 115 -1.7 0 0 0.0 23,927 22,863 -4.4Grand Total 1,899 1,990 4.8 51,732 53,656 3.7 61,934 75,875 22.5
Petroleum ProductionOperator
Gas (MMcfd) Condensate (bbl) Crude Oil (bbl)
2001 2002 Change(%) 2001 2002 Change(%) 2001 2002 Change(%)
New Production FieldsUnocal Thailand started up production from Yala and North Pailin since Q2 2002. Average productionof Yala were 15 MMscfd of natural gas and 5,900 bbld of crude oil and of North Pailin were 137 MMscfdof natural gas and 5,900 bbld of condensate in 2002.
Chevron Unocal Total

39 2002AnnualR
eport
FIELD Jan Feb Mar Apr May Jun Jul Aug Sep Oct Nov Dec TOTALNATURAL GAS (MMscf)
Erawan 7,654.041 7,608.805 8,880.322 8,128.427 8,425.515 7,889.112 8,284.741 8,644.840 8,460.778 7,565.749 7,262.339 8,189.726 96,994.395Baanpot 152.435 353.396 523.381 383.989 394.811 360.637 276.997 219.135 281.096 328.175 199.882 137.155 3,611.089South Satun 817.689 1,140.487 1,062.360 1,034.701 1,179.134 1,096.132 883.653 871.697 804.023 808.277 855.249 956.590 11,509.992Satun 3,479.506 3,373.344 3,888.893 3,817.604 3,947.178 3,709.817 3,304.049 3,518.712 2,989.053 3,152.615 2,926.297 3,593.165 41,700.233Pladang 582.349 495.675 557.657 597.156 465.269 461.218 319.086 62.629 95.634 506.625 654.810 1,140.960 5,939.068Trat 2,666.130 1,979.887 2,312.353 1,852.120 1,490.547 1,617.556 1,919.324 1,557.516 1,370.437 1,364.139 1,082.960 1,603.456 20,816.425Platong 579.924 618.596 758.707 684.973 350.152 426.257 380.540 512.144 673.594 701.151 809.581 667.421 7,163.040Kaphong 425.965 241.906 315.166 339.530 323.768 395.816 387.149 463.484 335.594 303.780 236.867 254.156 4,023.181Surat 49.159 62.234 80.700 55.060 54.378 45.938 38.458 35.672 34.503 25.820 26.062 31.172 539.156Plamuk 457.612 546.128 700.199 1,193.310 1,365.021 1,040.255 933.741 637.612 987.263 1,333.421 1,395.584 1,395.915 11,986.061Funan 4,996.357 4,559.149 5,230.105 4,983.411 5,445.363 5,779.964 4,359.675 5,110.580 5,068.546 5,903.557 5,236.152 5,450.247 62,123.106Jakrawan 314.267 250.776 282.636 267.602 328.567 278.283 220.245 202.808 200.151 200.844 214.603 252.579 3,013.361West Jakrawan 1,566.106 1,706.238 2,133.980 2,203.915 2,257.470 2,311.080 1,301.408 1,140.656 1,127.407 1,185.390 928.086 1,631.129 19,492.865Gomin 413.699 510.868 491.441 351.933 385.214 220.238 102.830 88.145 222.074 113.382 101.864 115.726 3,117.414Pailin 5,590.657 6,121.840 7,146.060 7,347.880 7,805.240 6,492.504 7,410.283 6,842.989 7,308.363 7,429.420 4,799.342 5,023.377 79,317.955Yala 0.000 0.000 0.000 14.070 366.417 460.903 645.626 319.213 366.973 697.163 537.910 433.247 3,841.522North Pailin 0.000 0.000 0.000 0.000 0.000 1,569.732 5,837.736 5,895.096 5,245.539 3,737.631 3,758.982 3,378.811 29,423.527Bongkot 17,069.961 15,470.221 20,028.731 18,353.118 18,764.820 18,520.502 18,054.978 19,460.426 17,433.361 16,911.807 14,656.987 11,905.342 206,630.254Tantawan 1,591.187 1,173.027 1,039.853 1,616.606 1,608.937 1,753.679 2,184.087 1,668.412 1,284.652 1,105.419 1,334.394 1,150.865 17,511.118Benchamas 4,117.697 3,992.746 5,003.735 4,396.902 4,893.047 4,325.737 4,502.053 4,634.816 4,586.531 4,854.923 4,548.063 5,462.069 55,318.319Maliwan 0.000 0.000 0.000 0.000 0.000 0.000 160.680 130.002 27.598 0.000 0.000 0.000 318.280Sirikit 1,700.086 1,736.865 1,763.534 1,742.297 1,732.745 1,613.284 1,741.399 1,770.787 1,682.397 1,723.997 1,646.006 1,738.999 20,592.396Nam Phong 1,899.444 1,720.327 1,902.405 1,832.446 1,830.994 1,705.629 1,742.010 1,833.997 1,736.841 1,778.196 1,691.662 1,692.749 21,366.700Total 56,124.271 53,662.515 64,102.218 61,197.050 63,414.587 62,074.273 64,990.748 65,621.368 62,322.408 61,731.481 54,903.682 56,204.856 726,349.457CONDENSATE (bbl)Erawan 238,081 235,603 269,275 232,571 239,544 236,041 322,170 328,685 344,480 293,054 283,414 272,852 3,295,770Baanpot 7,017 12,974 17,431 14,797 17,219 141,598 12,704 8,571 11,660 13,299 12,900 3,329 273,499South Satun 21,884 28,614 29,469 26,689 31,293 26,051 26,317 30,880 21,466 22,913 21,990 22,626 310,192Satun 104,434 130,740 134,973 112,937 115,790 98,268 80,124 80,382 66,835 82,151 79,292 138,037 1,223,963Pladang 31,737 15,866 38,461 24,849 20,734 27,368 11,296 1,505 1,743 24,337 23,211 54,662 275,769Trat 95,750 57,204 69,231 80,069 62,101 73,384 83,069 80,384 74,704 68,169 66,072 31,437 841,574Platong 12,398 8,510 14,581 8,659 8,240 8,596 18,224 24,810 35,847 35,715 34,448 13,171 223,199Funan 161,958 161,580 214,844 217,714 227,416 258,467 212,814 189,176 188,080 261,893 253,874 199,186 2,547,002Jakrawan 0 1,000 673 566 1,025 287 896 745 774 70 70 2,649 8,755West Jakrawan 34,270 36,901 46,704 51,372 51,338 50,825 33,886 34,770 33,563 27,616 26,585 31,236 459,066Gomin 30,254 31,277 13,165 11,132 23,166 11,972 9,404 25,807 40,471 11,288 10,993 17,100 236,029Pailin 220,006 238,031 287,845 295,226 315,929 258,939 223,026 235,807 221,561 282,993 273,489 203,549 3,056,401North Pailin 0 0 0 0 0 53,761 201,782 219,546 205,254 131,663 127,249 139,749 1,079,004Bongkot 440,511 423,313 551,141 505,833 502,922 482,933 522,928 496,299 477,809 492,664 476,353 380,749 5,753,455Total 1,398,300 1,381,613 1,687,793 1,582,414 1,616,717 1,728,490 1,758,640 1,757,367 1,724,247 1,747,825 1,689,940 1,510,332 19,583,678CRUDE OIL (bbl)Platong 41,707 25,124 61,597 42,097 19,579 56,299 104,052 83,637 112,318 110,656 103,892 130,596 891,554Kaphong 60,730 22,639 15,015 12,476 8,738 13,679 14,611 14,932 14,887 10,730 8,443 7,577 204,457Surat 16,305 17,510 24,430 26,063 16,728 14,622 10,972 12,016 16,756 13,969 15,871 18,442 203,684Plamuk 79,609 99,690 140,983 159,483 159,325 105,224 133,599 114,602 93,229 155,032 143,333 184,602 1,568,711Yala 0 0 0 0 103,193 141,051 210,490 144,827 168,164 238,569 222,464 217,022 1,445,780Tantawan 213,995 174,065 132,090 173,992 198,992 229,499 198,959 175,625 154,269 125,378 150,642 133,225 2,060,731Benchamas 1,117,644 1,002,234 1,062,826 941,990 1,046,819 974,112 1,175,279 1,173,900 1,159,615 1,149,978 943,564 1,149,823 12,897,784Maliwan 0 0 0 0 0 0 33,233 33,048 10,267 0 0 0 76,548Sirikit 590,647 570,518 594,579 620,844 650,805 666,362 687,716 694,648 601,773 626,198 600,843 613,467 7,518,400Kamphangsaen 864 501 817 801 789 794 758 851 876 887 918 943 9,799U-Thong 15,394 13,831 14,506 13,796 14,117 16,731 12,872 11,776 11,530 11,456 12,079 15,904 163,992SanKrajai 0 0 0 0 0 0 13,618 6,227 9,159 9,044 8,481 8,411 54,940Bung Ya 8,801 7,329 7,991 7,030 7,225 6,744 7,362 7,044 8,000 7,688 6,448 6,872 88,534Bung Muang 14,476 12,270 12,251 24,357 23,358 20,029 17,112 17,827 16,875 14,965 13,562 17,416 204,498Wichianburi 4,535 4,369 4,658 4,596 4,695 3,557 3,234 3,235 3,661 4,224 7,563 9,940 58,267Srithep 453 379 668 386 397 391 386 405 382 366 356 360 4,929Fang 21,302 20,460 18,466 18,995 17,189 14,623 14,609 21,454 22,868 23,042 24,979 23,140 241,127Total 2,186,462 1,970,919 2,090,877 2,046,906 2,271,949 2,263,717 2,638,862 2,516,054 2,404,629 2,502,182 2,263,438 2,537,740 27,693,735Sirikit (LPG,Tons) 9,085 8,379 9,041 8,801 9,143 9,194 9,439 9,705 8,934 9,051 8,831 9,327 108,930
Monthly Petroleum Production in Thailand in 2002

40 2002AnnualR
eport
Environmental Impacts Assessment (EIA) ReportsAs the result of the Notice (given on 22nd January 1996) from the Minister of Science,Technology, and Environment (MOSTE) No 3 (1996) concerning prescription of typesand capacity of projects or activities of government agencies, state enterprises orprivate sector requiring a submission for approval of report on environmental impactsassessment given on 22 January 1996, the upstream oil and gas activities are requiredto submit an environmental impacts assessment report (EIA) for çall capacitiesé.
In 2002, there were 2 Environmental Impact Assessment (EIA) reports for upstreamoil and gas activities submitted to the Department of Mineral Fuels (DMF) and Officeof Natural Resources and Environmental Policy and Planning (ONEP), as the approvalregulator authority, as follows: ● an EIA report for onshore development project of South Pratu Toa oil field, block S1,
Bang Rakham district, Phitsanuloak Province, implemented by Thai Shell Explorationand Production Ltd., conducted by Pro-En Technology Ltd. (Pro-En). The report wassubmitted to ONEP in November 2002 and was approved in February 2003.
● an EIA report for offshore hydrocarbon exploration and drilling project of çHong Fawellé, block B7/38 in the coastal area of the Gulf of Thailand , implemented byDevon Energy (Thailand) Ltd., conducted by International EnvironmentalManagement Co.Ltd. (IEM). The report was submitted to ONEP in February 2002 andwas approved in March 2003. See detail in table as below.
Upstream Oil && Gas Activity Environmental Impact Assessment Reports in 2002Concessionaire
Project name ConsultantSubmitted
(Project owner) date/Approved date
Devon Energy(Thailand) Ltd.
Thai ShellExploration andProduction Ltd.
Hydrocarbon Exploration & Drilling çHong Fa Wellé Project ,Block B7/38, Gulf of Thailand● Main Report (1 Thai copy)● Executive Summary Report (1 Thai, 1 English copy)● Appendices Report (1 English copy)● 1
stAdditional Information Report (2 Thai, 1
Englishcopies)● 2
ndAdditional Information Report (2 Thai, 1
English copies)
çSouth Pratu Toaé Development Project, Block S1, BangRakham District, Phitsanuloak Province ● Main Report (3 Thai copies)● Executive Summary Report (3 Thai copies)● Appendices Report (1 English copy)
IEM Ltd.
Pro-En Technology Ltd
27 February 2002
19 December 200210 February 2003/11 March 2003(Approved)
29 Nov 2002/ 12 February 2003
Environmental Monitoring ReportsIn conformance with the Environmental Regulation related to EIA requirement for theall capacities of upstream oil and gas activities, the concessionaire is required to followthe conditional approval i.e., several environmental impact prevention and correctionmeasures by ONEP. These conditions includes the requirement that environmentalmonitoring surveys be conducted by the concessionaire, and reported to ONEP and DMF.
During 2002, 10 reports of Environmental Monitoring program were submitted to DMFand ONEP, 6 of them were submitted by Unocal Thailand Ltd. and the other weresubmitted by Chevron Offshore (Thailand) Ltd. All of the Unocalûs monitoring reportwere about list of the activities/monitoring in line with ONEPûs conditional approvaldated 9 September 1998 for çPailin and North Pailin Drilling Phase DevelopmentProgramé. While Chevronûs monitoring reports were about 2001 annual HSE Monitoringreport and Gulf of Thailand Fish Monitoring program.
Petroleum EnvironmentalActivities
41 2002AnnualR
eport
DMFûs Mercury Investigations in the Gulf of Thailand Project
Mercury-related environmental effects, primarily from discharged produced watersat central processing platforms are the issues of concern in the Gulf of Thailand.Thus, DMF has initiated the Mercury Investigations in the Gulf of Thailand Projectcommencing in 1997 and up to the present. The project has been conducted by ChulaUnisearch, Chulalongkorn University. The main objective of the project is to monitor theenvironmental situation whether these discharge activities have had a significant impacton the marine environment around the central processing platforms and nearby areas.The focus of these studies was to investigate the bioaccumulation of mercury in fishtissue.
The first three year of project (1997-1999), the fish community near the Unocalûsprocessing platforms (Erawan, Platong, Funan and Satun) have been monitored.Additionally, fish samples were collected from a control site, Pranburi district, Prachupkhirikhan province. In year 2000 the scope of study was extended to monitor fisharound Pailin production platform of Unocal and Bongkot production platform of PTTEP,including fish at Songkla market.
In 2001 DMF still continue to carry out the project, however the methodology andobjective of the study were modified. The role of Chula Unisearch has been changed asthe DMFûs consultant in order to cooperate with the concessionaires for joint mercuryinvestigation program. Fish communities and marine sediment in the vicinity of thecentral processing platform of Unocal and Chevron were analyzed. The samples werecollected in two set, one was analyzed by Chula Unisearch and the other by theconcessionaire.
The result of all the monitoring program indicated that the marine environmentalquality around the processing platforms have no significant negative impacts. Most ofthe fish did not contain mercury levels elevated above average worldwide backgroundlevels (estimated to be 0.25 ppm). This value is well below the US Food and DrugAdministration action level of 1 ppm and even the median international standard of 0.5ppm (California Environmental Protection Agency). Mercury levels in most of fish met allapplicable international food consumption standards.
Sediment quality results found that mercury concentrations are greatest in the innerarcs closest to the platform (within 50 to 100 m) and they decline to levels just abovebackground within 250 m. The value is still under the US National Oceanic andAtmospheric Administration (NOAA) guidelines (0.7 mg/kg dry weight, biological effects)and Australia and Newzealandûs (1 mg/kg dry weight, biological effects). Form of themercury (total mercury) has been shown to be very stable biologically and it is notexpected to have a significant negative impact on the fish and benthic biota around theplatforms.
DMFûs Master Plan for Environmental Monitoring in the Gulfof Thailand
In 2002, DMF continued to carry out the Mercury Investigations in the Central Gulf ofThailand Project. The main target of the project was to focus on implimenting the Gulfof Thailand- Environmental Monitoring Master Plan and Codes of Practice. The scope ofthe master plan and codes of practice included all parameters of chemical substancesto be monitored which are related to upstream activities. The master plan will provideconcessionaires and environmental consultants with clear guidance for conducting of allenvironmental monitoring aspects related to their activities.
42 2002AnnualR
eport
DMFûs Environmental Database for Upstream Oil&&Gas IndustryProject
The project was carried out by the Petroleum Institute of Thailand (PTIT), sponsored bythe Department of Mineral Fuels (DMF) and endorsed by the Office of Natural Resourcesand Environmental Policy and Planning (ONEP). The project was a cooperate effortbetween the PTIT, DMF, and ONEP, which was intended to increase the relevancy,effectiveness and efficiency of environmental submissions for upstream oil & gasactivities. The main object of the project was to produce an EIA detailed guidelines andworked examples for the offshore and onshore exploration (Phase I), developmentand production of oil & gas activities (Phase II). To construction of an environmentalbase-line database, which will contain all of the data submitted with EIA reports,subsequent monitoring of activities, including a Geographical Information System (GIS)(Phase II) and to provide training and coaching program for DMF and ONEP personnel(Phase III).
The expected benefit of the project is to provide concessionaires and environmentalconsultants with clear detailed guidance as to the requirements and format of EIAsubmissions for upstream industry. The environmental database will facilitate acomplete reference on previous EIA approved and allow continual monitoring ofenvironmental activity and compliance with regulators (DMF and ONEP) requirements.
The Phase I of project was started on the 27 September 2000 and completed in early2002. At present (as of July 2003), the second Phase of the project is in the process ofbudget approval.
The results of Phase I were detailed produced an EIA guidelines and worked examplesfor the offshore and onshore drilling exploration, but not for seismic activities. Dueto, the project team had recommended to the government regulators that a fullEIA assessment for seismic acquisition projects should not be necessary if this codeis adopted and implemented in full by the concessionaires. If this recommendationis accepted, then it is envisaged that this code of practice can be adopted as agovernment regulation and imposed upon the concessionaires as part of the permit toconduct seismic operations.

43 2002AnnualR
eport
PRINCIPAL ACTIVITIESThe Malaysia-Thailand Joint Development Authority (MTJA) was established under the laws ofboth countries on 23 January 1991 as a statutory body to assume all rights and responsibilitieson behalf of the two Governments for the purpose of the exploration and exploitation of thenon-living natural resources, particularly petroleum, in the overlapping continental shelf areain the Gulf of Thailand known as the çJoint Development Areaé (JDA)
On 21 April 1994, MTJA awarded two Production Sharing Contracts (çPSCé) in the JDA to thefollowing Contractors:
● Block A-18 to Trition Oil Company of Thailand and Petronas Carigali (JDA) Sdn. Bhd. (eachwith 50% interest).
● Block B-17 & C-19 to PTTEP International Limited and Petronas Carigali (JDA) Sdn. Bhd.(each with 50% interest).
On 24 May 1995, MTJA approved of Triton Oil Company of Thailandûs (Triton) assignment of 99%of Tritonûs 50% participating interest in the PSC of Block A-18 to Triton Oil Company of Thailand(JDA) Limited (Triton JDA). With this assignment, the participating interest of the parties inthe PSC of Block A-18 are:
Petronas Carigali (JDA) Sdn. Bhd. 50.00%Triton Oil Company of Thailand 0.50%Triton Oil Company of Thailand (JDA) Limited 49.50%
The Contractors, in turn, set up two operating companies in July 1994 to act as Operators intheir respective contract areas:
● Carigali-Triton Operating Company Sdn.Bhd.(CTOC) as Operator for Block A-18 ; and● Carigali-PTTEPI Operating Company Sdn.Bhd.(CPOC) as Operator for Blocks B-17&C-19
REVIEW OF 2002 ACTIVITIES
EXPLORATION
The year 2002 marks the final year of the extended Exploration Period (another three yearsfrom 21 April 1999) of the Production Sharing Contracts (PSC) for Block A-18 and Blocks B-17& C-19. Before the expiry date of the Exploration Period on 20 April 2002, exploration in theunexplored area of these blocks had been centered on drilling the obligatory exploration wellsin Block A-18 and Blocks B-17&C-19, and evaluating and preparating of final drilling reports.Geological, geophysical and reserve evaluation of other discovered gas fields in JDA had alsobeen continued.
In Block A-18, CTOC drilled and completed 2 exploration wells namely, Samudra North-1in February 2002, and Senja West-1 in March 2002 using the ùVicksburgû jackup rig. TheSamudra North-1 well made gas discovery, while Senja West-1 encountered some gas shows.The drilling of the two wells brought the total number of exploration/appraisal wells drilledin this Block A-18 to 18 wells.
In Blocks B-17, CPOC drilled and completed 2 exploration wells namely, Jengka East-1andMuda South-1 in March 2002 using the Trident-16 jackup rig. Both wells discovered gas. Thedrilling of the two wells brought the total number of exploration/appraisal wells drilled in thisBlock B-17 to 15 wells.
Activities in the Malaysia-Thailand
Joint Development Area (MTJDA)

44 2002AnnualR
eport
The drilling of the 4 wells by CTOC and CPOC fulfilled the work commitments of theextended exploration period (21 April 1999 - 20 April 2002) under the SupplementaryContracts No. 1 of the PSCs for Block A-18 and Block B-17 & C-19, respectively. Accordingly,both CTOC and CPOC applied for the gas field holding areas for Samudra-North, Jengka-Eastand Muda-South gas fields (Figure 1); which were subsequently approved by MTJA pursuantto the Production Sharing Contracts.
In addition to the above activities, geological and geophysical evaluations of the discoveredgas fields in the JDA were also carried out. The re-mapping and reserve re-evaluation work onBumi, Bulan and Suriya gas fields in Block A-18 continued and were completed by year -end2002. The reserve evaluations of other remaining gas fields in JDA also continued throughoutthe year 2002. All of these works accomplished by the contractors have resulted in theincrease of total gas reserves in the JDA.
As of the end of year 2002, 18 geological structures have been drilled and tested, resultingin 18 gas discoveries; 9 fields in Block A-18 namely, Cakerawala, Bulan, Suriya, Bumi, BumiEast, Senja, Samudra, Wira, and Samudra North fields; and 9 fields in Block B-17, namely,Muda, Tapi, Jengka, Amarit, Mali, Jengka South, Jengka West, Jengka East and Muda Southfields. Some of these fields also have minor oil accumulations.
To date, approximately 9.0 Trillion Standard Cubic Feet of (Proved + Provable) gas reserves,exclusive of CO2, from 18 fields has been discovered in the JDA.
DEVELOPMENT
Cakerawala Gas Field Development Project, Block A-18The significant milestone of the year 2002 was the completion of the EPC Contract for theengineering - procurement - fabrication - installation - hook - up & commissioning of offshoreproduction facilities for the Cakerawala gas field.
The Cakerawala Gas Field Development Project consists of Cakerawala Processing Platform(CKP), Cakerawala Riser Platform (CKR), 3 wellhead platforms (CKA, CKB, and CKC) and thefloating Storage Offloading Vessel (FSO) (Figure 2 and Figure 3).
As part of MTJAûs local content requirement, Technip-Samsung-Saipem Consortium (TSSC), theEPC Subcontractor of CTOC for the project, confirmed its commitment to optimize theMalaysian and Thai local work contents in the fabrication of the Cakerawala platforms andfacilities. Riser Platform (CKR) deck and jacket, with its two compression Modules and MainSupport Frame were fabricated in Malaysia at Penang Shipyard & Construction (PSC) in Penang.Wellhead Platforms (CKA, CKB, CKC) decks and jackets, two interconnecting bridges and oneflare boom were fabricated in Thailand at Thai Nippon Steel Yard in Samutprakarn Province.
The main Jacket and Deck of the Central Processing platform (CKP) was built andfabricated at the Samsung Heavy Industries in Koje, South Korea while the Living Quarterswas sub-contracted to Emtunga yard in Gothenberg, Sweden.
During the year 2002, the Phase II installation of facilities proceeded according to schedulewith the installation of CKR-Topside, Module I and II the CKR, CKR-P Bridge and the flare-boomand the FSO. The phase II installation was fully completed in May 2002.

45 2002AnnualR
eport
Figure 1: Petroleum fields in the MTJA
Figure 2 : Complete Cakerawala production facilities offshore in the JDA

46 2002AnnualR
eport
Figure 3: Cakerawala Facilities Locations

47 2002AnnualR
eport
Total recoverable resource is internally termed çresource base.é Thailand petroleum resourcebase comprises cumulative production, reserves, potential recovery and undiscoveredresources.
Undiscovered Resources Refers to resources anticipated to be recoverable from accumulations that remain to bediscovered
Potential Recovery Means discovered resources that are recoverable but not economically producible at aspecific date due to economic, political, environmental or technological reasons.
ReservesMeans quantities of petroleum, which are anticipated to be commercially recovered fromknown accumulations from a given date forward. All estimates involve some degree of uncertainty depending on amount of reliable geologicand engineering data available at the time of the estimate. Reserves can be subdivided into3 categories according to their degree of uncertainty.
Proved Reserves are those quantities of petroleum which, by analysis of geological and engineering data, canbe estimated with reasonable certainty to be commercially recoverable, from a given dateforward, from known reservoirs and under current economic conditions, operating methodsand government regulations.
Probable Reserves are those unproved reserves which analysis of geological and engineering data suggests aremore likely than not to be recoverable.
Possible Reserves Are those unproved reserves which analysis of geological and engineering data suggests are
As of December 2002, total resource base are summarized as the following:
Oil Condensate Natural Gas(MMBBL) (MMBBL) (BCF)
Undiscovered Resources 260.00 256.00 17,200.00Possible Reserves 252.55 204.54 8,362.64Probable Reserves 97.26 257.91 9,088.26Proved Reserves 363.83 327.47 15,564.77Cumulative Production 216.41 216.06 7,466.12Total 1,190.05 1,261.97 57,681.79
Petroleum Resources && Reserves

48 2002AnnualR
eport
less likely to be recoverable than probable reserves.Detailed reserves are tabulated on the separate page. As of December 31, 2002, provedpetroleum reserves of the country are natural gas 15 trillion cubicfeet, Condensate 380million barrels and Crude Oil 310 million barrels. Natural Gas is the primary petroleumresource constituting 80% of the total in terms of volume of oil equivalent, while condensateand crude oil make up another 11 % and 9%, respectively. The Gulf of Thailand hosts themajority of petroleum fields containing 95% of gas reserves, all condensate and 70 % of crudeoil reserves.
Reserves to Production RatioReserves to Production Ratio (R/P Ratio) of any particular year is the ratio between provedreserves at the end of the year and the corresponding yearly production. It is a number ofyears that the reserves can sustain if production is kept constant throughout. It representsnational inventory of petroleum assets at the time it is calculated, but does not meanpetroleum reserves will run out after the number of years of R/P ratio. The ratio is to beoptimal, not too high, which means over-invested or too low, which means insecurity. Eachyear, as exploration & production activities continue, more reserves will be booked asproduction increases, resulting in a largely constant R/P Ratio at the optimal number.
Thailandûs R/P Ratio statistics are shown in the following figure;
The average R/P ratio of natural gas and condensate in the last 16 years are 18 and 12 years,respectively, while that of crude oil during the last 8 years is 13 years. Production in the year2002 amounts to 0.75 trillion cubicfeet resulting in R/P ration of 20 years in 2002.

49 2002AnnualR
eport
Thai
land
Pet
role
um R
eser
ves
as o
f D
ecem
ber
31,
2002
No
Fiel
d/Pr
ojec
t/Ba
sin
Conc
essi
onCu
mul
ativ
e Pr
oduc
tion
Prov
ed R
eser
ves
Prob
able
Res
erve
sPo
ssib
le R
eser
ves
Stru
ctur
eBl
ock
Oil
Cond
ensa
teN
atur
al G
asO
ilCo
nden
sate
Nat
ural
Gas
Oil
Cond
ensa
teN
atur
al G
asO
ilCo
nden
sate
Nat
ural
Gas
(MM
BBL)
(MM
BBL)
(BCF
)(M
MBB
L)(M
MBB
L)(B
CF)
(MM
BBL)
(MM
BBL)
(BCF
)(M
MBB
L)(M
MBB
L)(B
CF)
GU
LF O
F TH
AIL
AN
D57
.09
216.
066,
832.
8927
6.76
32
7.61
14,8
63.6
766
.38
257.
998,
830.
0317
6.76
204.
707,
669.
02U
NO
CAL
(Ope
rato
r)4.
7518
0.71
5,
116.
2755
.11
133.
694,
551.
9022
.64
159.
144,
308.
602.
1751
.70
1,34
1.70
1Ba
anpo
tPa
ttan
iB1
3-
5.21
125.
68-
2.98
88.5
0-
9.69
290.
90-
2.84
83.2
02
Dar
aPa
ttan
iB1
2-
--
--
--
14.6
519
1.90
-1.
5119
.80
3Er
awan
Patt
ani
B12-
B13
-62
.08
1,85
0.93
-19
.80
738.
00-
7.77
247.
80-
2.09
61.1
04
Funa
nPa
ttan
iB1
3-
21.5
553
8.39
-7.
2726
8.20
-6.
9922
2.20
-2.
0967
.00
5G
omin
Patt
ani
B11
-3.
8567
.19
-2.
5348
.60
-14
.56
318.
10-
6.84
141.
806
Jakr
awa
Patt
ani
B12-
B13
-4.
9822
9.14
-4.
2227
4.10
-3.
3320
5.40
-0.
7148
.30
7Ka
phon
g*Pa
ttan
iB1
00.
444.
1510
8.97
0.54
-17
.20
3.78
-55
.90
0.07
-1.
908
Kung
_N-
--
3.14
28.7
0-
0.17
1.60
9M
orag
otPa
ttan
iB1
2/27
--
--
4.49
95.7
0-
26.8
362
3.80
-7.
6522
4.60
10Pa
ilin
Patt
ani
B12/
27-
11.7
429
6.60
-68
.70
1,54
0.50
-40
.69
899.
90-
13.4
628
9.90
11Pa
kara
ngPa
ttan
iB1
1-
--
-7.
2520
4.20
-6.
0119
0.10
-2.
5884
.00
12Pl
adan
gPa
ttan
iB1
1-
2.16
50.5
4-
1.32
53.6
0-
1.45
40.2
0-
0.50
14.2
013
Plam
uk*
Patt
ani
B10
1.77
0.15
22.8
629
.70
-28
0.80
8.84
-10
9.10
1.26
-13
.50
14Pl
aton
gPa
ttan
iB1
0-B1
10.
8917
.41
349.
404.
161.
0414
1.30
1.23
0.31
42.2
00.
840.
2127
.10
15Ra
nong
_E-
--
--
--
7.74
91.4
0-
6.40
75.6
016
Satu
nPa
ttan
iB1
1-B1
2-
42.9
81,
357.
15-
5.46
202.
50-
6.73
245.
50-
1.38
46.6
017
Sura
t*Pa
ttan
iB1
00.
211.
5827
.14
5.43
-66
.00
3.36
-37
.20
--
-18
Trat
Patt
ani
B11
-2.
8888
.43
-8.
6434
7.10
-9.
2539
1.20
-3.
2814
1.50
19Ya
la*
Patt
ani
B11
1.45
-3.
8415
.27
-18
5.60
5.44
-77
.10
--
-PT
TEP
(Ope
rato
r)-
35.3
51,
426.
58-
135.
716,
462.
26-
45.8
42,
383.
24-
63.0
52,
852.
6520
Bong
kot
& S
attl
elit
eM
alay
B15-
B16
-35
.35
1,42
6.58
-53
.07
3,54
8.40
-20
.76
1,37
5.29
-25
.38
1,33
5.76
21Ar
thit
Mal
ayB1
4A,1
5A,1
6A-
--
-82
.50
2,90
0.00
-25
.00
1,00
0.00
-37
.50
1,50
0.00
22Pi
kul
Mal
ayB1
3/38
--
--
0.14
13.8
60.
087.
950.
1716
.89
HA
RRO
DS
(Ope
rato
r)-
--
15.9
00.
9613
2.00
5.90
1.61
155.
203.
985.
7149
0.00
23Bo
on D
arik
Patt
ani
B12/
32-
--
-0.
043.
90-
0.08
7.90
-0.
3024
.00
24Bu
a Lu
ang
Patt
ani
B12/
32-
--
-0.
144.
80-
0.29
9.60
-0.
9029
.00
25Bu
ssab
ong
Patt
ani
B12/
32-
--
-0.
2790
.00
-0.
2171
.00
-0.
5117
0.00
26Ch
ang
Dan
gPa
ttan
iB1
1/38
--
--
0.44
29.0
0-
0.90
58.0
0-
3.50
232.
0027
Chan
gphu
akPa
ttan
iB1
1/38
--
--
0.07
4.30
-0.
138.
70-
0.50
35.0
028
JASM
INE(
L-St
ruct
ure)
Patt
ani
B5/2
7-
--
15.9
0-
-5.
90-
-3.
98-
-CH
EVRO
N (
Ope
rato
r)47
.64
-29
0.05
200.
75-
904.
0127
.94
-24
9.99
78.2
6-
900.
0129
Benc
ham
as/P
akak
rong
Patt
ani
B8/3
233
.53
-14
4.72
105.
89-
279.
0010
.28
-24
.75
27.0
6-
156.
5630
Chab
a(Ku
ng)
Patt
ani
B8/
31-
--
23.9
7-
74.0
07.
74-
23.3
524
.70
-10
5.62
31Ja
rmju
ree
Patt
ani
B8/3
2-
--
32.1
5-
207.
005.
66-
145.
0714
.47
-30
2.73
32M
aliw
anPa
ttan
iB8
/32
0.08
-0.
3227
.05
-20
4.00
3.50
-42
.34
9.14
-22
0.53
33Ta
ntaw
anPa
ttan
iB8
/32
14.0
4-
145.
0211
.69
-14
0.01
0.76
-14
.48
2.89
-11
4.57
THA
ISH
ELL
(Ope
rato
r)4.
69-
--
--
5.00
--
35.0
0-
-34
Nan
g N
uanC
hum
pon
B6/2
74.
69-
--
--
5.00
--
35.0
0-
-M
TJA
--
-5.
0057
.25
2,81
3.50
4.90
51.4
01,
733.
009.
3584
.25
2,07
8.00
35CP
OC
**M
alay
B17
--
-0.
0513
.30
581.
000.
5017
.65
347.
000.
4043
.90
584.
0036
CTO
C **
Mal
ayA1
8-
--
4.95
43.9
52,
232.
504.
4033
.75
1,38
6.00
8.95
40.3
51,
494.
00O
PEN
--
--
--
--
-48
.00
-6.
6637
Bua_
Ban(
_res
ourc
es)
Song
khla
OPE
N-
--
--
--
--
17.0
02.
3438
Song
khla
(_re
sour
ces)
Song
khla
OPE
N-
--
--
--
--
31.0
04.
32KH
ORA
T PL
ATE
AU
--
295.
38-
-41
1.47
--
226.
00-
-64
9.00
ESSO
(O
pera
tor)
--
295.
38-
-13
5.22
--
11.0
0-
-15
.00
39N
am_P
hong
Khor
atE5
--
295.
38-
-13
5.22
--
11.0
0-
-15
.00
AM
ERA
DA
HES
S (O
pera
tor)
--
--
-27
6.25
--
215.
00-
-63
4.00
40Ph
u H
orm
Khor
atEU
1-
--
--
276.
25-
-21
5.00
--
634.
00CE
NTR
AL
PLA
IN14
9.57
-33
7.85
85.4
1-
303.
5027
.20
-40
.18
72.7
9-
61.5
1PA
CIFI
C TI
GER
(O
pera
tor)
0.59
--
0.24
--
0.10
--
0.76
--
41N
a Sa
nun
Phet
chab
unSW
1-
--
--
--
--
0.64
--
42Sr
i Th
epPh
etch
abun
SW1
0.04
--
0.24
--
0.10
--
0.12
--
43W
ichi
an B
uri
Phet
chab
unSW
10.
55-
-PT
TEPI
(O
pera
tor)
3.59
--
0.51
--
0.19
--
0.02
--
44Ka
mpa
eng_
Saen
Kam
paen
g Sa
enPT
TEP1
0.30
--
0.04
--
0.00
--
--
-45
Uth
ong
Suph
an B
uri
PTTE
P13.
24-
-0.
35-
-0.
09-
--
--
46Sa
ng K
ajai
0.06
--
0.13
--
0.10
--
0.02
--
SIN
O U
S (O
pera
tor)
1.92
--
2.34
--
1.06
--
3.67
--
47Bu
ng Y
aPh
itsa
nulo
kN
C10.
80-
-2.
34-
-1.
06-
-3.
67-
-48
Bung
Mau
ngPh
itsa
nulo
kN
C11.
12-
-TH
AIS
HEL
L (O
pera
tor)
143.
47-
337.
8582
.32
-30
3.50
25.8
5-
40.1
868
.34
-61
.51
49Si
riki
t et
al.
Phit
sanu
lok
S114
3.47
-33
7.85
82.3
2-
303.
5025
.85
-40
.18
68.3
4-
61.5
1N
ORT
HER
N IN
TERM
ON
TAN
E9.
75-
-1.
66-
-3.
68-
-3.
00-
-50
Fang
Fang
DED
9.75
--
1.66
--
3.68
--
3.00
--
GRA
ND
TO
TAL
216.
4121
6.06
7,46
6.12
363.
8332
7.61
15,5
78.6
397
.26
257.
999,
096.
2125
2.55
204.
708,
379.
53
* bi
g oi
l pr
ojec
t**
The
rep
orte
d fi
gure
s ar
e 50
% o
f to
tal
rese
rves

50 2002AnnualR
eport
Petroleum Fields

51 2002AnnualR
eport
Overview In the year 2002, coal situation in Thailand did not change much from the preceeding year.Domestic coal production decreased slightly while its consumption was little higher. At theyear-end, coal mining reserves as reported remained 1,334 million tonnes. In addition, coalcategoried as measured resource was estimated at 801 million tonnes. DMF finished its coalexploration in 2002 covering 3 basins with 12.58 million tonnes of measured coal resource.
Coal Production2002 coal production dropped by 0.08% to 19.602 million tonnes, making 2-year plateau onproduction history.
By operator, EGAT, the biggest producer took the lion share (77%), leaving the rest to Banpu(14%) and several smaller private companies (9%).
2002 Coal Production by OperatorOperator TonneEGAT 14,994,739Banpu 2,781,776Siam Cement 728,945Lanna 689,882Others 406,643
By basin produced coal in 2002 came from 8 Tertiary ones. 76% of the total was produced fromMae Moh basin by EGAT only. Mae Than produced the second largest, 14% of the total. Li, thedecade-long coal producing basin yielded 7%. And other 3% came from Chiang Muan, Krabi,Nong Ya Plong, Mae Lamao and Na Hong, respectively.
Coal Production
Coal Activities

52 2002AnnualR
eport
12 coal mines in 7 provinces throughout the country were in producing activity during the year.Lampang, the all-time biggest, shared 90%, whereas the second Lamphun retained only 7%,leaving the rest 3% to the 5 other provinces.
Coal ImportThailand imported coal in 2002 at volume of 5.596 million tonne, or 13.3% higher than of 2001.The major suppliers were Indonesia, Australia and Vietnam. This exceeding 5 million tonnesrecord was probably due to the economic recovery. The more higher quality import coal wasneeded for power and cement production. On the other hand, domestic coal could not beeasily pushed up production. Two possible reasons were (1) the final stage of Li mines and (2)no new coal mine.
New coal mines in Thailand tends to be difficult to develop due to NGO intervention. Themain reason of no coal mine refers to possible environmental adverse. This is the broaderopportunity for import coal to fulfil future demand of the country.
2002 Coal Import
Coal Type Tonne Million Baht
Bituminous 3,562,064 4,918.451Anthracite 581,254 826.570Coke & Semi-coke 70,620 315.837Other Coals 1,381,913 1,567.175Total 5,595,582 6,060.904
Source: Department of Custom
2002 Coal Production by BasinBasin Name Region Tonne
Mae Moh Northern 14,994,739Mae Than Northern 2,651,385Li Northern 1,278,902Chiang Muan Northern 327,352Krabi Southern 187,000Nong Ya Plong Central 72,140Na Hong Northern 650
2002 Coal Production by ProvinceProvince Region Tonne
Lampang Northern 17,646,124Lamphun Northern 1,278,902Phayao Northern 327,353Krabi Southern 187,000Petchaburi Central 89,816Tak Northern 72,140Chiang Mai Northern 650

53 2002AnnualR
eport
Figures of coal destination collected by Department of Primary Industry and Mine impliedthe uses of domestic coal in 8 groups. Power, cement and paper industry are the 3 majorconsumers. Of the total of 2002, 78% was used for electricty generation in the Mae Moh powerplant. Cement industry consumed the other 16% and paper manufacturing used 3%.
Coal ReservesAt 2002 year-end, domestic coal produced was 284.948 million tonnes. The coal remaining inmines was estimated at above 1,335.724 million tonnes.
Domestic Coal ConsumptionUtilization of domestic coal in 2002 slightly increased from 19.497 million tonnes in 2001 to19.570 million tonnes.
Coal Import
Domestic Coal Consumption
Industry 1998 1999 2000 2001 2002Electricity Generation 15.140 13.420 14.134 15.317 15.033Cement 3.214 3.820 2.540 2.822 3.195Paper 0.606 0.496 0.313 0.429 0.637Fiber 0.234 0.317 0.236 0.232 0.215Lime 0.285 0.026 0.039 0.052 0.037Tobacco Curing 0.103 0.018 0.024 0.032 0.033Food 0.070 0.020 0.077 0.073 0.078Others 0.388 0.354 0.279 0.540 0.340Total 20.040 18.471 17.642 19.497 19.568
Unit in million tonnesSource: Department of Primary Industry and Mine

54 2002AnnualR
eport
Mining Coal ReserveBasin Province Coal Rank Produced Remaining
Mae Moh Lampang Lignite to Sub-bituminous 209.286 1,196.320Mae Than Lampang Lignite to Bituminous 20.107 15.742Mae Teep Lampang Lignite to Bituminous 0.911 10.089Li Lamphun Lignite to Bituminous 37.086 NAChiang Muan Phayao Lignite to Bituminous 2.523 NANa Hong Chiang Mai Lignite to Sub-bituminous 2.477 NABo Luang Chiang Mai Lignite to Sub-bituminous 1.395 NAMae Lamao Tak Lignite to Bituminous 1.184 0.445Mae Tun Tak Lignite to Bituminous 0.323 0.897Nong Ya Plong Petchaburi Lignite to Bituminous 1.207 0.514Krabi Krabi Lignite to Sub-bituminous 8.282 111.717Kantang Trang Lignite 0.010 NANa Duang Loei Anthracite 0.151 NANa Klang Udon Thani Anthracite 0.006 NATotal 284.948 1,335.724
Unit in million tonnesNA, data not available
Source: Department of Primary Industry and Mine
Undeveloped Coal ResourcesFor many years of exploration, Department of Mineral Fuels (DMF) compiled and computeddata as resource as 801 million tonnes of coal in 30 basins. The biggest one is in Saba Yoi basinwith 349 million tonnes of measured coal.
Coal ResourceBasin Province Measured Indicated Coal Rank
1 Saba Yoi Songkhla 349.860 254.890 Lignite2 Wiang Haeng Chiang Mai 93.019 34.124 Lignite to Sub-bituminous3 Sin Pun Nakhon Si Thammarat 91.060 16.428 Lignite to Sub-bituminous4 Ngao Lampang 48.186 50.690 Lignite to Sub-bituminous5 Mae Ramat Tak 37.540 72.170 Lignite to Sub-bituminous6 Chiang Muan Phayao 25.275 17.989 Lignite to Sub-bituminous7 Mae Tha Lampang 22.487 55.065 Lignite to Sub-bituminous8 Chae Hom-Muang Pan Lampang 16.186 41.047 Lignite to Sub-bituminous9 Mae Lamao Tak 15.575 46.366 Lignite to Sub-bituminous10 Khian Sa Surat Thani 15.411 40.000 Lignite to Sub-bituminous11 Nong Phlub Prachuap Khirikhan 10.520 2.786 Lignite to Bituminous12 Hang Chat Lampang 10.320 28.260 Lignite to Sub-bituminous13 Phan Chiang Rai 9.810 26.610 Lignite14 Wang Nua Lampang 9.012 21.160 Lignite to Sub-bituminous15 Umphang-Pala Tha Tak 8.053 19.236 Lignite to Sub-bituminous16 Bung Sam Phun Petchabun 6.850 NA Lignite to Sub-bituminous17 Mae Chaem Chiang Mai 6.080 16.040 Lignite to Sub-bituminous18 Serm Ngam Lampang 5.730 12.040 Lignite to Sub-bituminous19 Nong Ya Plong Petchaburi 4.452 12.256 Lignite to Bituminous20 Kantang Trang 3.420 10.260 Lignite to Sub-bituminous21 Phob Phra Tak 2.330 7.040 Lignite to Sub-bituminous22 Mae Chang Lampang 2.009 5.003 Lignite to Sub-bituminous23 Mae Jai Phayao 1.790 5.360 Lignite24 Wichian Buri Petchabun 1.650 2.620 Lignite to Sub-bituminous25 Phrae Phrae 1.612 0.403 Lignite to Sub-bituminous26 Na Sai Lamphun 1.310 5.270 Lignite27 Fang Chiang Mai 1.120 NA Lignite to Sub-bituminous28 San Pa Tong Chiang Mai 0.500 NA Lignite to Sub-bituminous29 Bo Salee Chiang Mai 0.432 0.667 Sub-bituminous30 Pai Mae Hong Son 0.174 0.366 Lignite to Sub-bituminous
Total 801.773 804.146Unit in million tonnes
NA, data not availableMeasured coal refers to the amount in the radius of 200 m of an exploratory well.
Indicated coal refers to the amount in the adjacent annulus of 200-400 m apart.

55 2002AnnualR
eport
DMF Activities in 2002In 2002, DMF conducted a 55 kilometer seismic surveys of the Phan basin. The DMF also drilleda number of wells to an accumulative depth of 5,950 meters in 3 basins, i.e., Phan, Mae Chaemand Toen. The exploration resulted in an addition of measured coal of 12.58 million tonnes.
Summary of DMF Workdone in 2002Phan Mae Chaem Toen
Seimic Survey (Km) 55 - -Drilling Depth (m) 2,504 3,000 446Measured Coal (million tonnes) 6.50 6.08 0.00
Coal Production Areas in Thailand
Department of Mineral FuelsMaech 12, 2003

56 2002AnnualR
eport
Amerada Hess (Thailand) Ltd.17th Floor, Rama IV Building (Opposite Lumpini Park), 990 Rama IV Road, Bangkok 10500Tel : (66) 2636 1936-40Fax : (66) 2636 1941http://www.hess.com
Amoco Thailand Petroleum Co.24th Floor, Rajanakarn Building,183 South Sathorn Road, Yannawa,Sathorn, Bangkok 10120Tel: (66) 2684 3796Fax: (66) 2684 3795http://www.bpamoco.com
British Gas Thailand PTE Ltd.British Gas Asia Inc.Thai Energy Co., Ltd.
321 B, 21st Floor, SCB Park Plaza,Tower III East, 19 Ratchadapisek Road,Chatuchak, Bangkok 10900 Tel: (66) 2937 9280Fax : (66) 2937 9291-2http://www.bgplc.com
Chevron Overseas Petroleum Thailand Ltd.Chevron Offshore (Thailand) Ltd.B 8/32 Partners Ltd.
27th Floor, Suntowers Building B.,123 Vibhavadi-Rangsit Road, Ladyao,Chatuchak, Bangkok 10900Tel: (66) 2618 1000Fax: (66) 2618 1001http://www.chevron.com
List of Petroleum Concessionaires

57 2002AnnualR
eport
Devon Energy (Thailand) Ltd.4th Ritratana building,1769 Ramkhamhaeng Road, Hua Mark,Bangkapi, Bangkok 10240Tel: (66) 2319 9869Fax: (66) 2717 2863http://www.devonenergy.com
Defense Energy Department (DED)Ministry of Defense, 496 Phetchaburi Road,Bangkok 10400Tel: (66) 2208 9021-6Fax: (66) 2208 9444
ExxonMobil Exploration and Production Khorat Inc.3195/16 Rama IV Road (11th Floor),Klong Toey, Bangkok 10110Tel : (66) 2262 4000, 661 3100Fax: (66) 2262 4805http://www.exxonmobil.com
Forest Oil International (Thailand) Ltd.2469/8-9 A.P.C.I. Building, New Phetchaburi Road, Bangkapi,Huay Kwang, Bangkok 10320Tel : (66) 2319 1975-7Fax: (66) 2318 2257http://www.forestoil.com
Harrods Energy (Thailand) Limited26th Floor, Maison Maneeya Building, 1 Phaholyothin Road, Soi 9,Phayathai, Bangkok 10400Tel : (66) 2617-1620-2Fax: (66) 2617-1623, 2617-1615http://www.horrodsenergy.com

58 2002AnnualR
eport
Kerr - McGee (Thailand) Ltd.15th Floor, Thai Wah Tower II,21/117A South Sathorn Road, Thung Mahamek,Sathorn, Bangkok 10120Tel : (66) 2677 3093-7Fax: (66) 2267 3098
Moeco Thailand Co., Ltd.Mitsui Oil Exploration Co., Ltd.MOECO Thai Oil Development Co., Ltd.
12th Floor, Boonmitr Building,138 Silom Road, Suriwong,Bangruk, Bangkok 10500Tel : (66) 2236 6765-6, 2236 8176Fax: (66) 2236 8177http://www.mitsui.com/energy.htm
MMC Exploration and Production (Thailand) Ltd.14th Floor,Kamolsukosol Building317 Silom Road,Silom,BangrakBangkok 10500Tel: (66) 2237 6739Fax: (66) 2236 8333
Pacific Tiger Energy (Thailand) Ltd.Unit 46/20, 6th floor,The Nation Tower,46 Bangna-Trad Road,Moo 10,Bangna,Bangkok 10260Tel : (66) 2751 4025-8Fax: (66) 2751 4029-30http://www.pacific-tiger.com

59 2002AnnualR
eport
PTT Exploration and Production Public Co., Ltd.PTTEP International Ltd.PTTEP Office Building,555 Vibhavadi Rangsit Road,Chatuchak,Bangkok 10900Tel : (66) 2537 4000Fax : (66) 2537 4333, 2537 4444http://www.pttep.com
Sino-U.S. Petroleum Inc.Sino Thai Energy Ltd.Combined Oil and Gas (Thailand) Inc.Thai Energy Resources Ltd.
6th Floor,Ban Chang Glass Huas Bulding,1 Sukhumvit 25,Klong Toey, Bangkok 10110Tel: (66) 2260 6181-8Fax: (66) 2258 9926
SOCO Exploration (Thailand) Co., Ltd.4th Floor, 1769 Ritratana Building, Ramkhamhaeng Road, Hua Mark,Bangkapi, Bangkok 10240Tel: (66) 2319 9865, 2717 2644-6Fax: (66) 2319 6296http://www.socointernational.com
Songkhla Resources Ltd.3rd Floor, Sui Heng Lee Building,68 Soi Santiparp, Sap Road, Siphaya,Bangruk, Bangkok 10500Tel: (66) 2233 8607-8Fax: (66) 2236 7985

60 2002AnnualR
eport
The Palangsophon Co., Ltd.5th Floor, Bangkok Insurance /Y.W.C.A. Building 25 South Sathorn Road, Thung Mahamek,Sathorn, Bangkok 10120Tel: (66) 2285 8080Fax: (66) 2677 3900
Thai Shell Exploration and Production Co., Ltd.10 Soonthornkosa Road,Bangkok 10110Tel: (66) 2249 0483-4Fax: (66) 2249 0489, 2249 8393http://www.shell.com
Thaipo Ltd.8th Floor, All Season Place, 87 M. Thai Tower, Lumpini, Patumwan, Bangkok 10330Tel: (66) 2654 0686Fax: (66) 2654 0685
TotalFinaElf Exploration and Production Thailand22nd Floor, Suntower Building B,123 Vibhavadi Rangsit Road, Ladyao,Chatuchak, Bangkok 10900Tel: (66) 2617 6464Fax: (66) 2617 6454http://www.totalfinaelf.com
Unocal Thailand, Ltd.Unocal Petroleum, Ltd.5th Floor, Tower l l l, SCB Park Plaza,19 Ratchadapisek Road,Chatuchak, Bangkok 10900Tel: (66) 2545 5555Fax: (66) 2545 5554 , 2545 5352http://www.unocal.com

61 2002AnnualR
eport
Defense Energy Department (DED)Ministry of Defense,496 Petchaburi Road,Bangkok 10400Tel : (66) 2208-9021-6Fax : (66) 2208-9444
Department of Alternative Energy Development and Efficiency Ministry of Energy17 Rama I Road, Kasatsuk BridgePatumwan, Bangkok 10330Tel : (66) 2223-0021-9Fax : (66) 2226-1416http://www.dedp.go.th
Electricity Generating Authority of Thailand (EGAT)53 Moo 2, Charansanitwong Road,Bang Kruai, Nonthaburi 11130Tel : (66) 2424-0111, 424-0101Fax : (66) 2433-6317http://www.egat.or.th
Energy Policy and Planning Office, (EPPO)Ministry of Energy121/1-2 Petchaburi Road,Tungphyatai, Ratchatewi,Bangkok 10400 Tel : (66) 2612-1555Fax : (66) 2612-1358http://www.eppo.go.th
Office of the Board of Investment (BOI)555 Vibhavadi Rangsit Road, ChatuchakBangkok 10900Tel : (66) 2537-8111, 2537-8155Fax : (66) 2537-8177http://www.boi.go.th
Government Agencies, State Enterprises andInstitutes

62 2002AnnualR
eport
National Economic and Social Development Board (NESDB)962 Krung Kasem Road,Bangkok 10100Tel : (66) 2280-4085Fax : (66) 2280-0892http://www.nesdb.go.th
PTT Public Company Limited (PTT)PTT Office Building,555 Vibhavadi-Rangsit Road,Chatuchak, Bangkok 10900Tel : (66) 2537-2000Fax : (66) 2537-3498-9http://www.pttplc.com
Department of Energy Business, (DOEB) 14th Thansettakit Building!
222 Vibhavadi-Rangsit Road, Ladyao, Chatuchak, Bangkok 10900Tel. : (66) 2513 8940 - 1Fax : (66) 2513 8940 - 1http://www.dobe.go.th
Office of National Resources and Environmental Policyand Planning (ONEP)60/1 Soi Pibulwatana 7, Rama VI Road,Bangkok 10400Tel : (66) 2279-7180-9Fax : (66) 2271-3266http://www.onep.go.th
Department of Primary Industries and Mines (DPI&M)75/10 Rama VI Road, Ratchatewi,Bangkok 10400Tel : (66) 2202-3553Fax : (66) 2202-3733http://www.dpim.go.th

63 2002AnnualR
eport
Petroleum Institute of Thailand (PTIT)18th Floor, PTT Building ,555 Vibhavadi-Rangsit Road, Chatuchak, Bangkok 10900Tel : (66) 2537-3594-5Fax : (66) 2537-3591http://www.ptit.org
Technical Petroleum Training Institute (TPTI)Department of Mineral Fuels,75/10 Rama VI Road, Ratchatewi,Bangkok 10400Tel : (66) 2640-9859-60Fax : (66) 2640-9860http://www.tpti.org
Bangchak Petroleum Public Company Limited (BCP)210 Moo 1, Sukhumwit 64 Road, Bangchak, Prakanong,Bangkok 10260Tel : (66) 2335-4999Fax : (66) 2335-4009http://www.bangchak.co.th
64 2002AnnualR
eport
Ban Pu International Limited28th Floor, Grand Amarin Tower,1550 New Phetchaburi Road,Ratchatewi, Bangkok 10310Tel.: (66) 2207 0730-1, 2207 0752Fax: (66) 2207 0753
Ban Pu Public Co., Ltd.25-28th Floor, Grand Amarin Tower,1550 New Phetchaburi Road,Ratchatewi, Bangkok 10310Tel.: (66) 2207 0688, 2207 0730-1Fax: (66) 2207 0696http://www.banpu.co.th
Chiang Muan Mining Co., Ltd.25th Floor, Grand Amarin Tower,1550 New Phetchaburi Road,Ratchatewi, Bangkok 10310Tel.: (66) 2207 0754, 2207 0779, 2207 0688Fax : (66) 2207 0695
Laemthong Lignite Co., Ltd.195 Kaew Nawarat Road,Amphoe Muang,Chiang Mai 50000Tel.: (66) 5330 6366-9, 5324 2856 Fax : (66) 5324 2993
Lanna Resource Public Co., Ltd.9th Floor, Mahatun Plaza Building, B55,888/99 Ploenchit Road,Bangkok 10330Tel.: (66) 2253 8080Fax: (66) 2253 5014http://www.lannar.com
Coal Operators in Thailand

65 2002AnnualR
eport
Phrae Lignite Co., Ltd.6th Floor, Mankong Kehakarn Building,719 Bunthudthong Road,Prathunwan, Bangkok 10330
Siam Carbon Lignite (1978) Co., Ltd.18th Floor, ITF Silom Plaza160/679 Silom Road,Bang Rak, Bangkok 10500Tel.: (66) 2745 6099-100Fax: (66) 2745 6101
Siam Cement Public Co., Ltd.1 Siam Cement Road,Bang Sue, Bangkok 10800Tel.: (66) 2586 3333, 2586 4444, 2586 5385-6Fax: (66) 2587 2199, 2587 2201, 2586 2145
Siam Graphite Co., Ltd.32-34 Chiang Khan Road,Amphoe Muang,Loei 42000
Suche Lignite Co., Ltd.10/12 Mahardthaibumroong Road,Amphoe Muang,Tak 63000Tel.: (66) 2551 2242
Thai-Laos Lignite Co., Ltd.19/1 Soi Samanchan,Sukhumvit 42 Road, Prakanong,Bangkok 10110Tel.: (66) 2712 4422, Fax: (66) 2712 1190
EGCO Mining Co., Ltd.13th Floor, EGCO Tower222 Moo 5 Viphavadi Road,Tungsonghong, Luksee, BangkokTel.: (66) 2955 0955, 2955 0950-2 2998 5999Fax: (66) 2955 0934

66 2002AnnualR
eport
Bcf Billion cubic feetBcfd Billion cubic feet per daybbl barrelbpd Barrel per daybcd Barrel condensate per daybod Barrel oil per daybOE Barrel Oil Equivalencebtu British Thermal UnitEIA Environmental Impacts AssessmentGIS Geographical Information SystemMbbl Thousand barrelMbpd Thousand barrel per dayMbpdOE Thousand barrel per day of Oil EquivalentMMbbl Million barrelMMcf Million cubic feetMMcfd Million cubic feet per dayMMscf Million standard cubic feetMMscfd Million standard cubic feet per dayTcf Trillion cubic feetTcfd Trillion cubic feet per day
Amerada Hess Amerada Hess Exploration (Thailand) Co., Ltd.Amoco Amoco Thailand Petroleum Co.BG British Gas Thailand PTE Ltd. Chevron Chevron Offshore (Thailand) Ltd.EIA Environmental Impacts AssessmentExxonMobil ExxonMobil Exploration and Production Khorat Inc.Forest Oil Forest Oil International (Thailand) Ltd.GIS Geographical Information SystemHarrods Harrods Energy (Thailand) Ltd.IEM International Environmental Management Co. Ltd.MOSTE Minister of Science, Technology, and EnvironmentNOAA National Oceanic and Atmospheric AdministrationONEP Office of Natural Resources and Environmental PolicyPacific Tiger Pacific Tiger Energy (Thailand) Ltd.Pro-En Pro-En Technology Ltd.PTIT Petroleum Institute of ThailandPTTEP PTT Exploration and Production Public Co., LtdPTTEPI PTTEP International, LtdSanta Fe Santa Fe Energy Resources (Thailand) Ltd.Sino-U.S. Sino-U.S. Petroleum Inc.SOCO SOCO Exploration (Thailand) Co., Ltd.Thai Shell Thai Shell Exploration and Production Co., Ltd.Unocal Unocal Thailand, Ltd.
Abbreviation

