ltv and dti limits—going granular · studies treat ltv and dti limits as complementary measures...
TRANSCRIPT
WP/15/154
IMF Working Papers describe research in progress by the author(s) and are published to elicit comments and to encourage debate. The views expressed in IMF Working Papers are those of the author(s) and do not necessarily represent the views of the IMF, its Executive Board, or IMF management.
LTV and DTI Limits—Going Granular
Luis I. Jácome and Srobona Mitra

2
IMF Working Paper
Monetary and Capital Markets Department
LTV and DTI Limits—Going Granular1
Prepared by Luis I. Jácome and Srobona Mitra
Authorized for distribution by Karl Habermeier and James Morsink
July 2015
Abstract
There is increasing interest in loan-to-value (LTV) and debt-service-to-income (DTI) limits
as many countries face a new round of rising house prices. Yet, very little is known on how
these regulatory instruments work in practice. This paper contributes to fill this gap by
looking closely at their use and effectiveness in six economies—Brazil, Hong Kong SAR,
Korea, Malaysia, Poland, and Romania. Insights include: rapid growth in high-LTV loans
with long maturities or in the number of borrowers with multiple mortgages can be signs of
build up in systemic risk; monitoring nonperforming loans by loan characteristics can help in
calibrating changes in the LTV and DTI limits; as leakages are almost inevitable, countries
strive to address them at an early stage; and, in most cases, LTVs and DTIs were effective in
reducing loan-growth and improving debt-servicing performances of borrowers, but not
always in curbing house price growth.
JEL Classification Numbers: E44, E58, G21, G28
Keywords: financial stability, macroprudential policy, loan-to-value ratios, debt-service-to
income ratios, house price growth, credit growth.
Author’s E-Mail Address: [email protected]; [email protected]
1 The authors are very grateful to James Morsink and Miguel Savastano for detailed comments, and would also
like to thank Arabinda Basistha, Tam Bayoumi, Helge Berger, Enrica Detragiache, Jeanne Gobat, Daniel Hardy,
Deniz Igan, Karl Habermeier, Heedon Kang, Ivo Krznar, Ruy Lama, Dermot Monaghan, Erlend Nier, Sweta
Saxena, and Longmei Zhang, as well as seminar participants at the National Bank of Romania, Oesterreichische
National Bank, the IMF/ECB Workshop, and the Riksbank, for very useful suggestions. We are also grateful to
Zohair Alam and Lam Nguyen for excellent research assistance. All remaining errors are ours.
This Working Paper should not be reported as representing the views of the IMF.
The views expressed in this Working Paper are those of the author(s) and do not necessarily
represent those of the IMF or IMF policy. Working Papers describe research in progress by the
author(s) and are published to elicit comments and to further debate.
© 2015 International Monetary Fund WP/15/154
3
CONTENTS PAGE
ABSTRACT ...............................................................................................................................2
I. INTRODUCTION ..................................................................................................................4
II. STYLIZED FACTS ..............................................................................................................7
III. WHEN TO TIGHTEN—MONITORING SYSTEMIC RISK ..........................................11
IV. USING THE POLICY TOOLS .........................................................................................14
A. Calibration ...............................................................................................................14
B. Application and Enforcement..................................................................................18
C. Communication .......................................................................................................19
V. TAKING DECISIONS .......................................................................................................20
A. Institutions ...............................................................................................................20
B. Dealing with Policy “Leakages” .............................................................................21
VI. EVALUATING EFFECTIVENESS .................................................................................24
A. Panel Estimates: Small Effects of LTV on Mortgage Credit ..................................25
Results from ................................................................................................................26
B. Time-series Models with Rich Datasets ..................................................................26
VII. TEN TAKEAWAYS AND SUGGESTIONS FOR FURTHER RESEARCH ................29
Tables
1. Systemic Risk Monitoring Indicators and Models ..............................................................13
2. Calibration of the LTV-DTI Limits .....................................................................................16
3. Brazil: NPLs for Different LTVs and Loan Tenors Inform Risk Weights ..........................17
4. Leakages with LTV-DTI Limits ..........................................................................................23
5. Effectiveness of LTV-DTI Limits—Country Experiences ..................................................27
6. Korea: Impact of Lowering LTV and DTI Limits ...............................................................29
Figures
1. Use of LTV and DTI as Macroprudential Tools, 2000–13 ....................................................5
2. Range of Limits on LTV and DTI, 2013 ...............................................................................6
3. Credit Growth and Changes in LTV and DTI Ratios ............................................................9
4. Real House Price Growth and Changes in LTV and DTI Ratios ........................................10
5. Romania: NPLs Increase with Lower Household Income ...................................................15
6. Policy Interest Rates and LTV and DTI Ratios, 2007–13 ...................................................22
7. Effects of Lowering LTV Limits by Ten Percentage Points on Mortgage Cedit Level ......26
References ................................................................................................................................32
Annexes
I. Panel Estimates for the Impact of LTV on Credit ................................................................35
II. Data Sources for Country Case Studies ..............................................................................37

4
I. INTRODUCTION
Six years after the global financial crisis, a number of countries are facing a new round of
surging house prices and increasing private sector leverage (IMF Global Housing Watch). To
a great extent, this is the result of a prolonged period of very low interest rates aimed at
fostering economic recovery in the advanced economies. In some countries—like China,
Malaysia, and Turkey—the credit-to-GDP ratio grew more than five percentage points and
real house prices by more than five percent in 2013. Risks related to rapid growth in consumer
and real estate loans are well-known. There is ample empirical literature supporting the notion
that financial crises typically have been preceded by periods of rapid credit growth, often
accompanied by asset price bubbles.2
To cope with the systemic risks associated with a surge in house prices and credit extension,
limits on loan-to-value (LTV) and debt-service-to-income (DTI) ratios are becoming
increasingly popular. As part of the macroprudential policy toolkit, these limits help to create
buffers and curb excessive private sector leverage and this helps mitigate the effects of
shocks on the housing sector, and thus on economic and financial stability (IMF, 2013a,
2013b, 2014a, and 2014b). According to the IMF’s Global Macroprudential Policy
Instruments (GMPI) database, 47 countries have introduced limits on LTVs, although only
27 have changed these limits over time to mitigate, and build resilience, against systemic
risks.3 The use of limits on DTI ratios is less popular to date as 36 countries have them in
place and only 10 have actively changed them through time (Figure 1). Nonetheless, DTI
limits can offer an important complement to LTV ratios, since they tie indebtedness to
household income (IMF, 2014a and 2014b).
LTVs impose a down-payment requirement by capping the size of mortgage loans relative to
the value of the property associated with the loan. The limits on DTI restrict the size of debt
service payment to a fixed share of household income. LTV limits ensure that borrowers have
‘skin in the game’ while taking out a mortgage loan, and prevent buyers without savings from
borrowing for house purchase. Thus the LTV limits work like an entry barrier in the
mortgage market for borrowers, working through a credit demand channel (IMF 2014b).
Borrowers with lower LTVs are less likely to buy for speculative reasons. Lower LTV limits
also improve borrowers’ resilience against future house price shocks and lead to lower losses
on mortgage loans in case house prices decline. DTI caps ensure affordability of mortgage
2 See Claessens, Kose and Terrones (2012), Arregui and others (2013), Crowe and others (2011), IMF (2011),
and the references therein.
3 The GMPI compiles the information from a survey conducted by the IMF from its membership. The survey
contains answers to questions about the implementation of 17 macroprudential instruments, as of end 2013, and
has responses from 133 countries.

5
payments and liquidity of the buyers in the face of income and interest rate shocks (IMF,
2014b).
Figure 1. Use of LTV and DTI as Macroprudential Tools 2000–13
Sources: Global Macroprudential Policy Instruments database; IMF staff calculations.
Bangladesh China
Hong Kong SAR India
Indonesia Korea
Malaysia Nepal
Singapore Thailand
Bulgaria Cyprus
Hungary Israel
Netherlands Norway Poland
Romania Spain
Sweden
Oman Pakistan
Argentina Bahamas
Brazil Canada
Chile
0
2
4
6
8
10
12
Africa Asia & Pacific Europe Middle East & Central Asia
Western Hemisphere
Countries that changed loan-to-value ratios since 2000
Hong Kong SAR South Korea
Netherlands Romania
Serbia Poland
Kuwait Saudi Arabia
Bahamas Canada
0
1
2
3
4
Africa Asia & Pacific Europe Middle East & Central Asia
Western Hemisphere
Countries that changed debt-to-income ratios since 2000
6
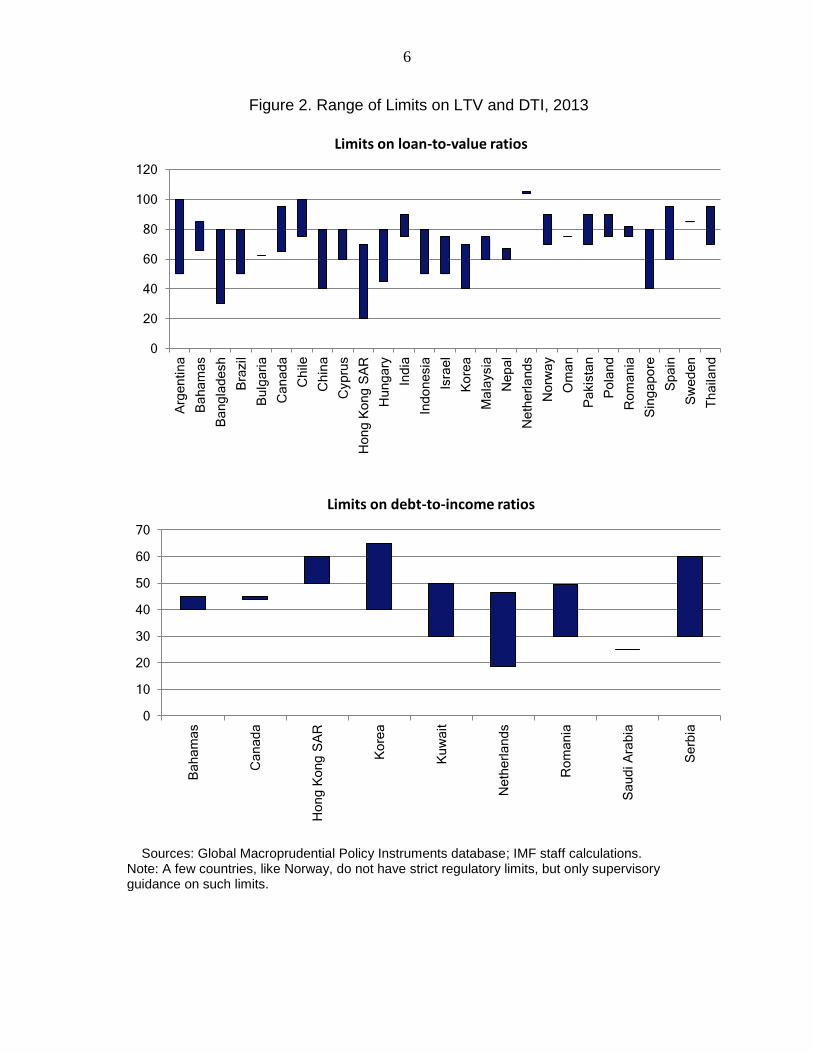
Figure 2. Range of Limits on LTV and DTI, 2013
Sources: Global Macroprudential Policy Instruments database; IMF staff calculations. Note: A few countries, like Norway, do not have strict regulatory limits, but only supervisory guidance on such limits.
0
20
40
60
80
100
120 A
rge
ntin
a
Ba
ha
ma
s
Ba
ng
lad
esh
Bra
zil
Bu
lga
ria
Ca
na
da
Ch
ile
Ch
ina
Cyp
rus
Ho
ng
Ko
ng
SA
R
Hu
ng
ary
Ind
ia
Ind
on
esia
Isra
el
Ko
rea
Ma
laysia
Ne
pa
l
Ne
the
rla
nd
s
No
rwa
y
Om
an
Pa
kis
tan
Po
lan
d
Ro
ma
nia
Sin
ga
po
re
Sp
ain
Sw
ed
en
Th
aila
nd
Limits on loan-to-value ratios
0
10
20
30
40
50
60
70
Ba
ha
ma
s
Ca
na
da
Ho
ng
Ko
ng
SA
R
Ko
rea
Ku
wa
it
Ne
the
rla
nd
s
Ro
ma
nia
Sa
ud
i A
rab
ia
Se
rbia
Limits on debt-to-income ratios

7
Yet little granular information is available on how exactly these tools have worked in practice.
It is known that countries have set different limits on LTV and DTI ratios, between 40 and
100 percent on LTVs and between 30 and 50 percent on DTIs (Figure 2). But aside from this,
there is a gap in the understanding of how countries actually implemented those tools. For
instance, which indicators triggered a tightening of the instruments? Which institutions were
responsible for the tools? What were the levels of LTV/DTI limits, and by how much were
they typically adjusted? How were the limits applied, enforced, and communicated to the
public? What were the typical interactions of these instruments with monetary and fiscal
policies? How was regulatory arbitrage prevented? And, finally, are LTV/DTIs effective and,
what kind of models can be used to evaluate their effectiveness on an ongoing basis?
This paper seeks to fill this gap by holding a “magnifying glass” on the experience of five
jurisdictions that set LTV and DTI limits on residential mortgages and one country that used
them on car loans. It discusses the findings from country-case studies (coordinated by the
authors) prepared by central bank staff from those six jurisdictions—Brazil, Korea,
Hong Kong SAR, Malaysia, Poland, and Romania. The studies describe in detail the
implementation of the tools and their effectiveness in their respective jurisdictions.4 The
studies treat LTV and DTI limits as complementary measures and, hence, do not try to test
their individual impact or their relative strength. The six jurisdictions include advanced and
emerging economies. They feature a diverse set of economic and financial structures with
various elements of systemic risk: foreign currency mortgages in Poland and Romania;
persistently high demand for housing in Hong Kong SAR; speculative demand for housing in
Malaysia; region-specific real estate booms in Korea; and, auto loans growth in Brazil.
The use of limits on LTV and DTI ratios through the cycle is relatively new and evolving.
Therefore, this paper does not aim at identifying best practices. Yet, this granular review of
experiences with these prudential instruments and their effectiveness shed light on practical
challenges, and can thereby provide country-specific information that complements IMF’s
detailed guidance on macroprudential policies (IMF, 2014a and 2014b).
The studies summarized in this paper provide valuable insights. The practice of systemic risk
monitoring involves a wide variety of indicators, from credit and house price growth to
household indebtedness, speculative activities and qualitative indicators on financial sector
risk-taking. Calibrating the limits on LTV/DTIs can be helped by paying close attention to
nonperforming loans (NPLs) by loan characteristics. The studies revealed that limits were
effective in reducing loan-growth and improving debt-servicing performances of the
borrowers. Moreover, targeting the tools towards the loan segment most at risk, like
speculative properties, were found more effective than aiming at overall credit or mortgage
loans.
4 See Afanasieff and others (2015), Bierut and others (2015), Kan (2015), Kim (2015), Abdul Rani and Lau
(2015), and Neagu and others (2015).
8
The paper is organized as follows. The next section sets the stage for LTV and DTI ratios in
the six jurisdictions analyzed. Section III discusses the indicators and data used by the
country authorities to analyze systemic risks and trigger policy decisions. Section IV
describes how the tools were calibrated, applied, enforced and discussed with stakeholders.
Section V lays out the organizational structures for taking decisions and dealing with
leakages. Section VI discusses the models that were used for evaluating the effectiveness of
LTV-DTI measures and their findings. Section VII spells out the ten main takeaways and
identifies areas for further research.
II. STYLIZED FACTS
The six country experiences reviewed in this paper cover mostly episodes starting in the late-
2000s, after the global financial crisis. At that time interest rates worldwide had fallen to
record low levels and domestic credit to the housing market in most of the countries in the
sample was growing at double-digit rates—in Poland and Romania, however, rapid credit
expansion had started in the mid-2000s (Figure 3).
The limits on LTV and DTI ratios adopted in the six countries aimed at mitigating sector
specific credit booms including, in most cases, large financing to the housing sector. In the
majority of cases, the stated objective was to stem excessive credit growth and prevent house
price booms. In Hong Kong SAR measures were also explicitly aimed at strengthening the
resilience of financial institutions and borrowers, while in Brazil, risk weights (guided by
LTV ratios) were used to slow the rapid growth in new auto loans and preserve loan quality.5
Most countries were experiencing large capital inflows when they decided to tighten
LTV/DTI limits. Also, countries differed in the extent of flexibility of their exchange rates
and whether they were targeting inflation. Poland and Romania differ from the other four
countries in that they have a high level of foreign currency lending.6
The prevailing rate of growth of (sectoral) credit when countries started to tighten the limits
on LTV/DTI ratios varied widely. Hong Kong SAR started tightening those limits when
year-on-year growth in nominal mortgage loans was six percent. In Romania, in comparison,
credit was growing at 60 percent. In the other countries, credit growth was in the range of
10–25 percent (Figure 3). On the other hand, real house price growth was only moderately
high, except in Hong Kong SAR and Malaysia, when tightening on the basis of credit growth
was going on (Figure 4). Real estate prices were declining in Poland and Romania, from the
fallout of the global financial crisis.
5 In November 2011, the Central Bank of Brazil recalibrated this measure, removing the link between risk
weights and LTV ratio for consumer loans. For detailed information, see Table 5 in the 2012 Brazil FSAP
technical note on macroprudential policy (http://www.imf.org/external/pubs/ft/scr/2013/cr13148.pdf).
6 In Poland, more than 50 percent of housing loans were denominated in foreign currency; in Romania that
figure exceeded 90 percent before the global financial crisis.
9
Figure 3. Nominal Credit Growth and Changes in LTV and DTI Ratios, 2007–13 (↓ = tightening)
Sources: Central banks from the countries in the sample, Afanasieff and others (2015), Bierut and others (2015), Kan (2015), Kim and others (2015), Abdul Rani and Lau (2015), and Neagu and others (2015).

10
Figure 4. Real House Price Growth and Changes in LTV and DTI Ratios, 2007–13
(↓ = tightening)
Sources: Central banks; IMF Global Housing Watch; IMF staff calculations, and, Bierut and others (2015), Kan (2015), Kim and others (2015), and Abdul Rani and Lau (2015).
The countries in the sample used very similar definitions to calculate the LTV and DTI
limits. For LTVs, most countries used the value of the mortgage loan or consumer loan in the
numerator and the value of the house price as the denominator. Korea, however, includes the
value of other debt and lease deposit together with the mortgage loan in the numerator, and
the value of the collateral in the denominator. For DTI, Romania, Hong Kong SAR, and
Poland imposed it on overall debt service, while the others imposed it on different types of
loans (Table 2).

11
LTV and DTI ratios were often accompanied by other prudential and fiscal policies in order
to strengthen their effectiveness. For example:
Malaysia increased risk weights for housing loans from 75 to 100 percent for loans
with LTV ratios higher than 90 percent and capped the tenor of property loans at
35 years. The government supplemented these measures by increasing the property
gains’ tax to limit speculative activities, discriminating non-residents by imposing
higher rates on them.
In Hong Kong SAR, a uniform 15 percent risk-weight floor for new residential
mortgage loans was introduced in February 2013; this followed the September 2012
cap of the tenor of new property mortgage loans at 30 years. The 15 percent risk-
weight was extended in February 2015 to cover the entire residential mortgage loan
portfolios. In addition, Hong Kong SAR imposed stamp duties in order to dampen
property transactions.
Korea raised the risk weight of risky mortgage loans from 35 to 50 percent and
introduced a range of taxes (local tax, composite real state tax, and income tax) to
tame the overheated housing market.
Romania used prudential measures—such as restrictions on banks’ direct and indirect
exposures to exchange rate risk and increases in reserve requirements—to mitigate
systemic risks. Monetary policy was also tightened sometimes.
Poland raised the minimum risk weight for foreign currency mortgage loans in 2007
and then again in 2012.
III. WHEN TO TIGHTEN—MONITORING SYSTEMIC RISK
The global financial crisis has underscored the importance of monitoring systemic risks. In
response, many countries have developed models and selected indicators and data that can
serve as warnings to alert policymakers about potential market distress.7 The six countries
developed their indicators drawing from various data sources to gauge systemic risk. Five
key features of the indicators used in these countries are worth highlighting.
Countries used granular data. Countries find that monitoring systemic risk can be helped
by monitoring developments/conditions in credit and housing markets, broken down into
sectors, sub-indicators and regions (Table 1). The indicators monitored cover both the supply
side (e.g., concentrations of financial institutions) as well as the demand side (e.g., borrower
characteristics such as indebtedness and debt-service ratios). Some countries closely monitor
the aggregate NPL ratio along with NPLs by LTV, loan-tenors and income levels to assess
the need for changes in policy settings. Detecting speculative activities is a key concern, but
7 See IMF (2011), IMF (2013a), IMF (2014b) and the references therein. See also Arregui and others (2013b)
and IMF (2014b) for risk measurements in the structural dimension.

12
indicators in this area are scarce. Also, qualitative information typically supplements
quantitative monitoring.
The indicators monitored come from a variety of sources. The case studies illustrate the
usefulness of having multiple data sources at hand and making creative use of indicators.
Property prices and credit growth, especially mortgage credit growth (including those in
foreign currencies) and consumer loan growth, are the indicators most commonly monitored.8
Banks’ concentration risk on real estate and consumer loans are also fairly common. The
canvas of risks assessed include the banking sector, households, corporates, asset prices,
macroeconomic indicators and qualitative information on lending practices (Table 1). There
are attempts at monitoring household indebtedness and debt service capacity, sourcing data
from credit registries and household surveys. Residential house price is a key indicator that is
used in a variety of forms (growth, in asset pricing models, as forecasts, and in assessments
of overvaluation or bubbles). Information on LTV (and DTI) is typically gathered from bank
lending surveys, periodic household surveys, and credit bureaus. While most countries get
information on average LTVs granted by banks, a few countries also try to get the range
(maximum, minimum) of LTVs used in banks’ internal norms.
A key takeaway from the six case studies is that information on loan tenors and LTVs,
together with data on mortgage (or auto) lending growth and property price growth can
provide useful signals. In fact, the combination of high LTV and long mortgage loan
maturities for new lending activity can alert policy makers that lending standards are being
relaxed. The difference in lending rates between comparable loans (such as auto loans and
payday loans in Brazil) is also an indicator that lending standards are being relaxed.
Speculative activities are a key concern for countries. A key motivation for tightening
LTV/DTI ratios in many countries has been to stop speculative activities in the housing
market. Korea, for instance, developed criteria to designate certain regions in the
“speculative zone.”9 A couple of relatively simple indicators together raise concerns for such
activity: growth of mortgage loans together with the number of borrowers with multiple
outstanding loans. Other indicators are confirmor transactions—deals in which properties are
sub-sold, before the original transaction is completed—short-term resales, and the rate of
subscription competition for new dwellings.
8 These indicators are identified as core indicators in the IMF’s framework for risk assessment in housing
markets, see IMF (2014b).
9 Korea uses the following criteria (IMF, 2014b): a region is a ‘speculative zone’ if (a) monthly nominal house
price index (HPI) rose more than 1.3 times nation-wide inflation rate in the previous month; and (b) either a
previous two-month average of the regional HPI growth rate (y-o-y) was 1.3 times higher than the two-month
average of the nation-wide HPI growth rate (y-o-y), or the 12-month average of the regional HPI growth rate
(y-o-y) was higher than the 12-month average of the nation-wide HPI growth rate (y-o-y) in the last three years.
13
Table 1. Systemic Risk Monitoring Indicators and Models
Sources: Afanasieff and others (2015), Bierut and others (2015), Kan (2015), Kim and others (2015), Abdul Rani and Lau (2015), and Neagu and others (2015).
14
Granular data on NPLs can help calibration. Although the changes in the aggregate
fraction of NPLs in gross loans are a lagging indicator of systemic risk, granular loan-by-loan
data on NPLs can inform policymakers of underlying problems. For instance, in Romania,
the parsing of NPLs by loan characteristics allowed the authorities to determine that NPLs
increase with higher LTVs, lower income levels (Figure 5) and longer loan tenors (greater
than five years). In addition, even when overall NPLs are declining (because of high credit
growth) analysis of NPLs by loan characteristics can point to elevated risks in certain
segments of the market. In fact, as is shown in the next section, cross-sectional information
on NPLs by loan category can help calibrate adjustments in the LTV/DTI ratios.
Countries use judgment and qualitative information in addition to quantitative
indicators. A supervisory sense of whether underwriting standards are deteriorating is
generally combined with quantitative indicators to get a sense of increases in systemic risk.
For example, one indicator that triggered policy action in Brazil was the steady decline in the
gap between interest rates on auto loans (a sector that was overheating) and payroll-deducted
loans (a comparator for auto loans). Keeping an eye out for “attractive” loan packages can
also help in this regard.
Summarizing, these countries monitored not only credit and house price growth but also a
wider variety of indicators. They found it useful to look at household indebtedness,
speculative activities and qualitative indicators on financial sector risk-taking. Three trends
especially sent an alert signal: (i) rapid growth in high-LTV loans with long maturities;
(ii) rapid growth in mortgage loans and the number of borrowers with multiple mortgages;
and (iii) increasing NPLs on particular loan characteristics, even if the overall NPL-ratio was
declining.
IV. USING THE POLICY TOOLS
This section sheds light on the operational aspects of LTVs and DTIs in the six countries,
namely: factors that influence the decision on the actual limits for LTV/DTI and when to
tighten or loosen; whether to enforce the measures at the time of the announcement or later,
after a period of consultation; and how the measures can be communicated to market
participants.
A. Calibration
With the exception of Brazil, the countries in the sample did not conduct formal quantitative
analysis to set the level or changes of the limits; and none of the countries had an ex-ante
assessment of the exact timing, along the cycle, to tighten or loosen these limits. In other
words, the management of these tools was largely discretionary. In some cases, the limits
were imposed initially on banks’ borrowers; over time, these were extended to borrowers
from other institutions to curb leakages.

15
Figure 5. Romania: NPLs, Household Income and LTVs
Source: Neagu and others, 2015. Note: The data comes from Central Credit Register, Credit Bureau, MPF and NBR. The information includes only households with bank loans and the net monthly income does not include the co-borrowers. The coverage ratio is around 70 percent of total exposures and 50 percent of NPLs (in December 2013). The LTV values are calculated at December 2013 (for all annual vintages) and therefore reflect the values of collateral in December 2013.

16
No magic numbers
In most cases, the caps on LTV and DTI started in the range of 60–85 percent and
30–45 percent, respectively, for mortgage loans. Subsequently the limits were tightened or
differentiated by type of borrower (Table 2). In some cases, the limits were lower for
mortgages denominated in foreign currency, especially for unhedged borrowers, or for
borrowers with income derived from crossborder sources. Limits on commercial properties
were set at lower levels; for example, in Hong Kong SAR, where LTV was set as low as
20 percent for borrowers that had multiple mortgages and used net-worth based on income
derived from abroad.
Table 2. Calibration of the LTV-DTI Limits
Sources: Afanasieff and others (2015), Bierut and others (2015), Kan (2015), Kim and others (2015), Abdul Rani and Lau (2015), and Neagu and others (2015).

17
Use of NPLs by loan characteristics
In Brazil, LTV caps were built into banks’ risk weights, calibrated by quantitative analysis of
NPLs on combinations of LTVs and loan maturities on several loan vintages. For instance, it
was observed that as LTVs increased and maturities increased (moving to the south-east
portion of the left-side table in Table 3), so did the NPL-ratio. This cross-sectional analysis
informed a decision to adjust risk weights for a combination of high LTV and/or long loan
tenors from 75 percent to 150 percent.
Table 3. Brazil: NPLs for Different LTVs and Loan Tenors Inform Risk Weights
Frequent changes in caps
In all countries, there were changes to the limits of LTV/DTIs typically because the
authorities noted that they were not having the desired effect. In some cases, house price and
mortgage growth did not fall, and in other cases, the limits did not bind. Concerned with
speculative activities, authorities in some countries lowered the caps selectively either for
speculative prone (geographical) areas or for individuals with multiple mortgages. In one
case, the centrally set caps were removed and banks were allowed to set their own limits,
validated by supervisors. However, this did not work, and stricter requirements were put back
in place.
Mostly housing mortgages, but also other loans
Although limits on LTV-DTIs were most common for housing loans, in some countries they
also covered commercial real estate, auto loans, and consumer credit. Typically, the loan
amount was the numerator of the LTV; but in one country the numerator comprised the loan
amount and other debts (senior debt plus deposits for lease). For the DTI, the numerator was
typically debt service—annual repayment of principal and interest on mortgage loans—but
the type of debt varied. For instance, in one case interest payments on other debt was
included. The denominator for the DTI was usually disposable income, but in one country it

18
was changed over time to the “minimum expense required for daily existence.” The attempts
in both cases were aimed at making the limits binding.
Starting with banks, extended to other institutions
To curb leakages, the limits were extended in some of the countries to insurance companies,
mutual funds and finance companies that advertised mortgage products. It was also extended
to development financial institutions.
Challenges with cross-border housing demand
LTV-DTIs may not be binding on all borrowers in situations where foreign buyers flock to
buy houses with cash. A similar situation occurs if residents buy houses with foreign
financing. In such cases, other policy tools that directly impact the level of transactions (such
as stamp duties and capital gains taxes) have been employed. In one case, the LTV limits
were lowered for individuals deriving income from cross-border sources and further lowered
for those with multiple mortgages to manage financial stability risks from shocks arising in
another country.
No quantitative cost-benefit analysis
Possible side-effects were analyzed only in qualitatively terms. The main concern was for the
first-time borrowers, for whom the limits were removed, lowered, or dealt with a separate
government-sponsored scheme that lessened the burden.
B. Application and Enforcement
Mostly immediate application
In most countries, the caps took immediate effect, but some flexibility was kept in some
cases. Where LTV and DTI ratios were changed or adopted without previous notice, there
was a chance that some loan requests had been made just before the announcement of the
new ratios. To deal with these cases, Hong Kong SAR allowed financial institutions to be
flexible and exempt those buyers who had already signed the provisional sales and purchase
agreements from being subject to the new regulations. Korea allowed periods of 5 to 15 days
between the date of announcement and the date when the new regulation became effective, to
provide time for financial institutions to do preparatory work. In Romania this period varied
between 30 and 60 days. Because its measure involved capital requirements, the Central
Bank of Brazil followed a somewhat different approach. After defining a cut-off date, it
approved a seven month phase-in period for having the new risk weight enter into effect. In
Poland, on the other hand, measures were always announced at least five months in advance.

19
Close monitoring
Countries developed a variety of procedures to enforce the compliance with the new
regulations. The main distortion that is likely to appear is that the same bank, or another
institution, provides a loan to finance the down payment, in addition to the loan subject to the
LTV limits; such co-financing would undermine the effectiveness of the limit. In the six
countries, this did not seem to occur frequently as it could be detected early and be subject to
penalties. Another form of circumventing the measure is when housing loans are recorded by
non-individuals, like in Malaysia. In general, supervisory agencies monitor the correct
implementation of LTV and DTI tightening through offsite procedures and via onsite
inspections. For instance, Hong Kong SAR can take several measures in response to non-
compliance, including the requirement of external auditors, holding bank staff accountable,
and factoring incidents of non-compliance into their CAMEL rating system. Such non-
compliance could lead to a downgrade of the composite CAMEL ratings and, hence, to an
increase in the premium under the deposit insurance mechanism.10 Incidents of non-
compliance can also be factored into the assessment of banks’ statutory minimum capital
adequacy ratio.
C. Communication
Communication related to prudential measures typically has two stages. The first takes place
ex ante, when the new regulation is in a draft stage, and regulators are interested in
discussing and agreeing with financial institutions the content and scope of the new
legislation to enhance the effectiveness of the policy. The second occurs ex post, with the aim
of disseminating the information on the new rules to the public on a timely, transparent, and
clear basis.
Usually not discussed prior to adoption
Contrary to common practices for prudential regulations, in several countries in the sample,
the introduction or changes on LTV and DTI was not preceded by discussions with the
financial industry. They preferred to issue the new regulations without prior consultation, to
avoid a last-minute rush toward purchasing properties or cars. Such a rush could cause
acceleration of asset prices and/or a surge in credit, precisely what the new measure was
trying to avoid.
Poland and Romania followed the practice of consulting with the financial industry before
introducing new prudential regulations or changes to existing ones. Consultations took place
at the drafting stage, sometimes eliciting adverse reactions, in particular in Poland, where
10
CAMEL refers to a system of supervisory rating that covers six aspects of soundness—Capital adequacy,
Asset quality, Management capability, Earnings, and Liquidity.
20
banks openly criticized some of the proposals. Korea, on the other hand, gave financial
institutions 5 to 15 days so as to strike a balance between the benefits and costs of pre-
announcing the measure. Communicating in advance with the Ministry of Finance or the
Treasury occurred in some cases in order to coordinate the LTV/DTI with tax measures,
which could be used as complements to the macroprudential policies, as in Hong Kong SAR
and Korea.
Communication strategy key
Ex post, all the countries developed a communication strategy once decisions were made.
Decision-takers sought to disseminate the content and the details of the regulation beyond the
official publication.
V. TAKING DECISIONS
In most countries in the sample, the institutional arrangement for decisions on LTV and DTI
ratios were already in place. They pre-dated the discussion that has taken place recently on
the optimal design of institutional arrangements for macroprudential policy, based on
incentives that aim at avoiding an inaction bias and also at preventing the influence of
possible vested interests from the financial industry.11
A. Institutions
Central banks monitor systemic risks in most countries
The countries in the sample show a range of institutional arrangements. In most countries, the
central bank is the key institution in charge of monitoring systemic risks—including
developments in the housing market—and of executing and enforcing macroprudential
policies, such as LTV and DTI ratios (Brazil, Hong Kong SAR, and Romania). In Korea,
however, the implementation and enforcement of macroprudential tools is a shared
responsibility between the central bank and the financial supervision agency. In Poland only
the latter agency was responsible. In Malaysia, there are two committees that monitor
systemic risks—the Financial Stability Committee, on entities regulated by the central bank,
and the Financial Stability Executive Committee, on entities outside the bank’s regulatory
perimeter. In addition, a Joint Policy Committee coordinates monetary policy and
macroprudential policy decisions.
11
While there is no one-size-fits-all model, there are basic principles that should be present in any institutional
arrangement to be effective. These include: (i) the central bank should play a key role; (ii) a fragmentation of
agencies in charge of monitoring systemic risks and regulating corrective actions should be avoided; (iii) the
participation of the treasury is important, but should not have a dominant role; and (iv) systemic risk prevention
and crisis management should be assigned to separate agencies as they are different policy functions (see Nier
and others, 2011). See further also IMF (2013a) and IMF (2014a).

21
Decisions on policy tools taken by different entities
The institutional setup for decision-making on the policy tools is somewhat more diverse.
There is a first group of countries, comprising Brazil and Romania, where there is a single
committee in charge of taking decisions on both monetary policy and financial stability,
chaired by the central bank governor.12 In Hong Kong SAR, there is a Macro Surveillance
Committee (MSC) within the Hong Kong Monetary Authority (HKMA), which meets
regularly to assess emerging risks in the monetary and financial systems and formulate
appropriate policy responses. The MSC is chaired by the Chief Executive of the HKMA. In
turn, Malaysia has a dedicated committee, the Financial Stability Executive Committee, also
chaired by the central bank governor.
The institutional arrangement in Korea and Poland has evolved in recent years. Until 2012,
macroprudential policy in Korea was coordinated through different institutions, but there was
no formal policy-decision inter-agency committee. In 2012, the Macroeconomic and Finance
Meeting was established, with a mandate to provide recommendations on macroprudential
policies. However, the recommendations of this committee are not binding since the
responsibility for approving and executing macroprudential policies remain with the
regulatory and supervisory agencies. In Poland, banking supervision and regulation were part
of the central bank until 2006, when a unified financial supervisor was created. While a
Financial Stability Committee was created that same year, this committee is rather a
consultative body in charge of coordinating the exchange of information and conducting
crisis management.
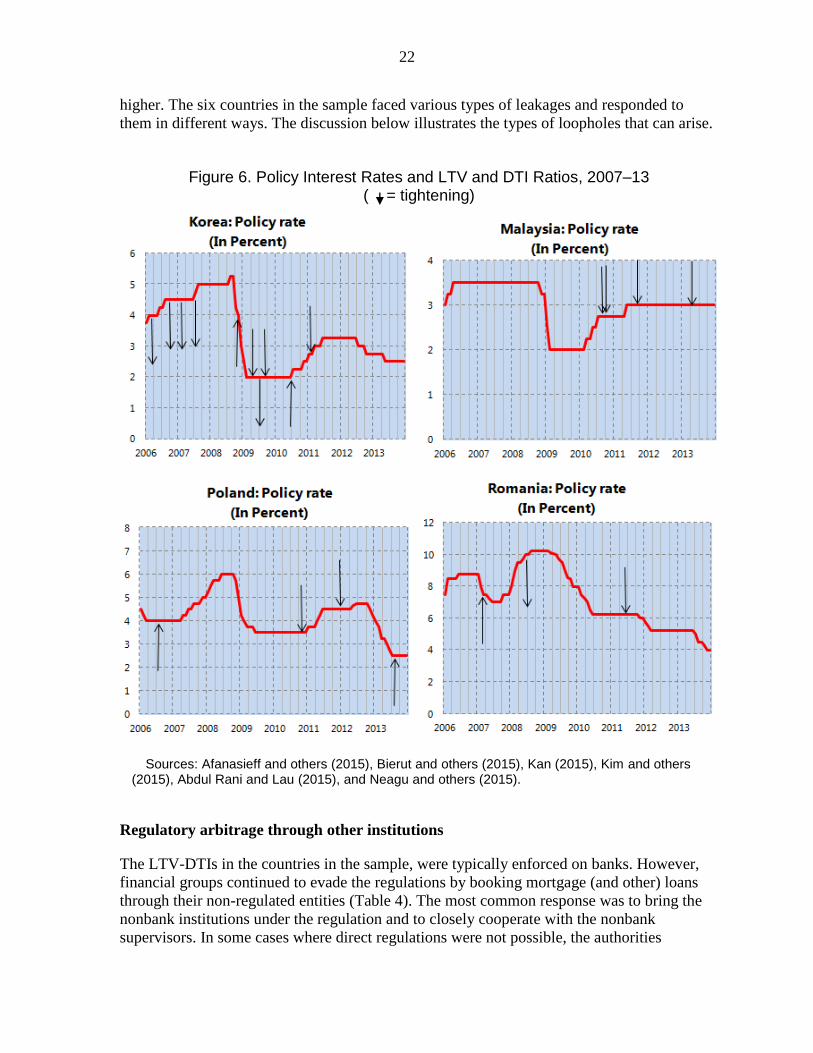
Decisions rarely coordinated with monetary policy
In the countries in the sample, decisions on LTV and DTI ratios were not always coordinated
with monetary policy. The majority of countries deployed the tools to restrain mortgage
credit growth without much coordination with monetary policy. Only in Korea, during
2006–08, and to some extent in Malaysia, LTV and DTI ratios were tightened at the same
time as the policy rate was being raised (Figure 6).
B. Dealing with Policy “Leakages”
Leakages are an inevitable consequence of changes in macroprudential policy, as different
kinds of financial institutions are involved in similar but slightly differentiated types of
activities. In economies open to cross-border banking flows the potential for leakages is even
12 Strictly speaking, in Brazil, the National Monetary Council (CMN), chaired by the Minister of Finance and
comprising the President of the Central bank of Brazil and the Minister of Planning is the highest policy-making
authority for financial stability. However, the CMN delegated to the central bank the decisions on the risk
weights for auto loans. In Romania, following a recommendation from the European Systemic Risk Board
(ESRB), a new national committee (National Committee on Macro-prudential Supervision) will be in charge
with all decisions on macroprudential policy.
22
higher. The six countries in the sample faced various types of leakages and responded to
them in different ways. The discussion below illustrates the types of loopholes that can arise.
Figure 6. Policy Interest Rates and LTV and DTI Ratios, 2007–13 ( = tightening)
Sources: Afanasieff and others (2015), Bierut and others (2015), Kan (2015), Kim and others (2015), Abdul Rani and Lau (2015), and Neagu and others (2015).
Regulatory arbitrage through other institutions
The LTV-DTIs in the countries in the sample, were typically enforced on banks. However,
financial groups continued to evade the regulations by booking mortgage (and other) loans
through their non-regulated entities (Table 4). The most common response was to bring the
nonbank institutions under the regulation and to closely cooperate with the nonbank
supervisors. In some cases where direct regulations were not possible, the authorities

23
garnered additional powers to request information from the nonbank lenders or sought to
impose the LTV-DTI limits from a consumer protection perspective/agency.
Table 4. Leakages with LTV-DTI Limits
Sources: Neagu and others (2015), Kan (2015), Kim and others (2015), Abdul Rani and Lau (2015), Bierut and others (2015), Afanasieff and others (2015).
Branches of foreign banks are another source of loopholes, especially in the European
countries. In such cases, foreign banks were requested to follow the host-country regulations
and the home-supervisors were asked to support it. Similarly, direct cross-border mortgage
lending by foreign financial institutions is another possible leakage. In such cases, close
monitoring was the main mode of surveillance.
Modifying loans to meet standards
DTI restrictions, which have been used less than LTV limits, put a cap on monthly payments
on interest and principal as a share of disposable income. A common way for financial
institutions to get around that limit was to lengthen the maturity of the loan or to give
promotional interest rates in the first few months of the loan. The authorities tried to curb

24
these practices by ensuring debtors fulfill the DTI restrictions for the entire life of the loan
and by limiting maximum loan tenors.
Less leakages when policies are well targeted
In Brazil and Malaysia, policies were targeted at the auto-loans market or at speculative
activities (borrowers with three or more mortgage loans only), respectively. In both cases,
authorities did not find significant policy leakages. In Malaysia, the bulk of the housing loans
reside with regulated entities under the central bank, which minimizes both the need for
extensive inter-agency coordination for implementation.
Supranational agencies help coordinate
In countries with open capital accounts and free movements in crossborder banking flows, a
supranational multilateral agency could help facilitate coordination between supervisors. In
Europe, this role is being played by the ESRB, which helped coordinate home-host
macroprudential policies among European emerging economies implementing LTV-DTI
limits after it was established in 2010. Another way to contain the leakages would be to
require foreign banks to be locally incorporated subsidiaries in both countries, bringing these
entities naturally under the host supervisors, and discussing macroprudential policies with
home supervisors of foreign banks either bilaterally or in supervisory colleges.
VI. EVALUATING EFFECTIVENESS
How effective were the LTV-DTI limits in achieving their objectives? Some empirical
evidence suggests that a ten percentage point increase in the maximum-allowed LTV ratio
is associated with a 13 percent increase in nominal house prices (Crowe et al, 2011); while
other studies find that a ten percentage point decrease in the LTV ratio is associated with a
ten percentage point decline in the house price appreciation rate (Duca and others, 2011).
McDonald (2015) has found that the tightening of LTV and DTI limits are more effective
when credit is expanding quickly or when house prices are high relative to income. Other
cross country experience, using panel data regressions and dummy variables for tightening or
the loosening phases, show that LTVs and DTIs help curb, and have long-lasting effects on,
credit and real house price growth.13
A few other studies, like Vandenbussche and others
(2015), do not find empirical support for these measures.
We investigate these questions in the six countries of our sample from a cross-country panel
analysis and time-series perspectives. Specifically, we first report panel estimates on the
effect of LTV-tightening on mortgage credit levels for Hong Kong SAR, Korea, Malaysia,
Poland, and Romania.14 The panel estimates are based on the methodology in Romer and
13
See Lim and others (2011), Arregui and others (2013a), and Cerutti and others (2015) for cross-country
evidence, and see Igan and Kang (2011) on Korea, Krznar and Morsink (2014) on Canada, Ahuja and Nabar
(2011) and He (2014) on Hong Kong SAR, and Crowe and others (2013) for the United States.
14 Brazil did not implement an LTV ratio directly and, hence, is left out of this exercise.

25
Romer (2004), Cerra and Saxena (2008), and IMF (2010) and the narrative description of
episodes of LTV-tightening found in Lim and others (2013) and in each of the studies for the
five jurisdictions.15 We find that the panel estimates yield small but significant effects of
tighter LTVs on mortgage credit level. Moreover, similar panel estimates for real house price
growth yield small and counterintuitive effects.
These results further validate the need for taking a closer look at the time-series evidence.
The time-series estimates show that the effectiveness of the measures could be evaluated on
many dimensions, including on (a) curbing excessive household or consumer credit
expansion; (b) moderating real estate price growth; and (c) improving the resilience of the
system by curbing household leverage and banks’ NPLs.
A. Panel Estimates: Small Effects of LTV on Mortgage Credit
To ascertain the effects of tighter LTV limits (lower ratios) on mortgage credit growth, we
estimate the following regression (see Annex I for details):
30 24
0
1 1
(1) it i i it s i it i it
s i
C LTV C e
where C is log of mortgage credit, itC is the monthly growth in mortgage credit, LTV is
the change in the LTV limits, and i are country fixed effects. Our monthly sample period is
July 2002–December 2013. The LTV is a simple version of a very complex policy variable.
As described in earlier sections, these countries had multiple LTVs for various loan-
characteristics and authorities tend to change various ratios together with other policies. Our
attempt is to isolate only the LTV-tightening episodes to see if these limits work when risks
are building up. We thus acknowledge that tightening and relaxing LTVs work differently,
and we are attempting to capture just one side of the measure.
In the months that LTV is tightened for each of the five jurisdictions, we take the change in
the limit for the most restrictive loan component. To ensure that the LTV-tightening reflects
policy ex ante, we take the LTV-changes at the time of decisions, not at the time of
implementation. We obtain this data from Lim and others (2013) and supplement it with
information from the case studies of the five countries. There can be long gaps between the
time of decisions and the time of implementation (see section on Application). We have also
taken 24 lags of mortgage credit growth, to absorb all other sources of information that can
influence the dependent variable, and 30 lags of LTV , to allow for prolonged impact of the
policy on mortgage credit.
The results from the panel regression suggest that a ten percentage point tightening of LTV
has a maximum cumulative impact of lowering the level of mortgage credit by about
0.7 percent (Figure 7). The data on LTV and point estimates of the panel regression are
15
See details are in Annex I.

26
presented in Annex 1. Results are similar when Poland and Romania (both hit by the global
financial crisis) are removed from the five-country group.
Figure 7. Effects of Lowering LTV Limits by Ten Percentage Points on Mortgage Credit Level (in percent)
Sources: Authors’ estimates; see Annex I for details.
When the regression is run using quarterly changes in real house price growth for the five
countries (since monthly data is not available) as the dependent variable, the results are
counterintuitive but not significant.
To summarize, panel estimates show that a ten percentage point lower LTV limit has a small
but significant effect in lowering the level of mortgage credit by 0.7 percent over time, and
counterintuitive effects on real house prices.
B. Results from Time-Series Models with Rich Datasets
The country studies used a wide array of models to examine the effectiveness of LTV and
DTI measures (Table 5). Besides, countries used a plethora of data sources, both micro and
macro datasets, from various agencies (see Annex II).
The study on Romania (Neagu and others, 2015) used a panel Generalized Method of
Moments (GMM) model of loan-growth for 14 banks, and tested whether a dummy
variable for quarters when LTV and/or DTI were introduced or modified had a
significant effect on loan-growth. The regression controlled for monetary policy,
reserve requirements, macroeconomic variables and bank-specific characteristics. The
study also estimated another panel data regression using GMM to explain NPL ratios
of several vintages of loans granted over a seven-year span. This regression sought to

27
ascertain whether prudential regulations had helped reduce NPLs, and consequently
loan servicing capacity of the households.
The study on Hong Kong SAR (HKMA, 2014) estimated a vector auto-
regression (VAR) model to evaluate the short-run impact of macroprudential
measures on (time-series of) mortgage loan growth, house prices and transaction
volume, controlling for the impact of other economic and financial factors. The
framework distinguishes between prudential tools and stamp-duty measures. The
study also estimated a demand-supply econometric model for mortgage loans to
evaluate how tightening LTVs strengthens banks’ resilience to property price shocks
by dampening both credit growth and borrowers’ leverage (Wong and others 2014).
Table 5. Effectiveness of LTV-DTI Limits—Country Experiences
Sources: Neagu and others (2015), Kan (2015), Kim and others (2015), Abdul Rani and Lau (2015), Bierut and others (2015), Afanasieff and others (2015).
The study on Korea (Kim and others, 2015) used a global VAR model of house prices
and mortgage loans, for 43 regions and estimated the impact of LTV and DTI limits
(separately) on the two housing-related variables and overall GDP growth.
The study on Malaysia (Abdul Rani and Lau, 2015) used an event study (LTV-
announcements) to gauge if the growth rate of loans extended to individuals for the
Objectives Ro
ma
nia
Ho
ng
Ko
ng
SA
R
Ko
rea
Ma
lay
sia
Po
lan
d
Bra
zil
Curbing excessive credit growth, including speculative growth
Consumer/auto loans x X
Mortgage X x X
Curbing house price growth X
Improving the resilience of the system to future adverse shocks
Curbing household leverage X X
Curbing banks' NPLs X x X X
Methodology Dynamic Panel
Data,
Generalized
Method of
Moments
(GMM)
Vector Auto-
Regression
(VAR); Demand-
Supply
econometric
model for
mortgage loans
Global Vector
Auto-Regression
(GVAR)
Event Study;
Quadratic
regression
Survey data
analysis
Difference-in-
Differences
Policy
LTV, DTI:
together
LTV, DTI:
together
LTV, DTI:
separately
LTV LTV,DTI:
separately
Other policy instruments Stamp duties;
loan tenor cap of
30 years
Capital risk
weights based
on LTV
1Stated objective, successful (Green), Stated objective, unsuccessful (Pink); Not a stated objective (Blank).

28
third and above outstanding housing loan fell significantly and persistently following
the announcement.16
The study on Poland (Bierut and others, 2015) analyzed survey data to evaluate
whether prudential measures led to changes in the distribution of (values of) LTV and
DTIs, as well as proxies for credit risk within the population of borrowers.
Finally, the study on Brazil (Afanasieff and others, 2015) used a difference-in-
differences method to investigate whether new targeted loans was affected by the
measure (higher risk-weights for certain combinations of LTV and maturity), when
compared to a control variable (new untargeted auto loans).
Effective in taming credit growth and NPLs
The findings from the country studies broadly suggest that LTV and/or DTI measures were
mostly effective in curbing credit growth but not house price growth. In Romania, for
example, the estimates show that the measures arrested consumer credit growth but not
mortgage credit growth or house price growth. The results for Korea, however, suggest that
house price growth was indeed tamed. The results for Brazil suggest that the measures
successfully curbed high-LTV loans and improved debt-servicing of the auto loans; whereas
the results for Hong Kong SAR and Poland show that the measures helped to clamp down on
household leverage. The study for Malaysia found the measures effective in limiting the
number of speculative borrowers. The three studies that examined NPLs by loan-
characteristics reported significant improvements in the performance of the loan portfolio
following the prudential measures. With the exception of Korea, none of the studies found
that the macroprudential measures were effective in reducing house price growth; this was
especially so for countries that faced persistent housing demand and capital inflows.
Quantitative effects of LTV changes
Most of the studies used binary variables to proxy for tightening LTVs (one for tightening,
zero for no movement), which makes it difficult to interpret the impact on intermediate
variables for systemic risk. The study on Korea (Kim and others, 2015), however, used actual
LTV ratios in its cross-regional global VAR model. Results from that study suggest that a ten
percentage point decrease in the LTV limit lowered the level of mortgage credit by about two
percent, house prices by about 3 percent, and real GDP by 0.8 percent in the long run. In
comparison, changes in DTI limits had a lower impact (Table 6).
16
Malaysia also used two other models that are explained in Abdul Rani and Lau (2015).

29
Striking at the transactions level, rather than credit
The study on Hong Kong SAR shows that the stamp duties that are tied to house purchases,
rather than macroprudential measures targeting housing loans, were very effective at curbing
house price appreciations. The reason for this was the stamp duties directly affected prices at
the level of housing transactions and were not related to the origination of mortgage credit.
Table 6. Korea: Impact of Lowering LTV and DTI Limits
Long run effect on: (in percent)
Ten percentage point lower LTV limit
Ten percentage point lower DTI limit
Mortgage loans -2.2 -2.0 House prices Nominal GDP
-2.8
-0.8
-1.1
-0.3
Source: Kim and others (2015).
Summarizing, time series evidence from each country that dug deep into the measures show
that LTV limits were effective in reducing loan-growth and improving debt-servicing
performances of the borrowers. However, these measures were not effective in curbing house
price growth, especially in countries that faced persistent capital flows. Targeting the tools
towards the loan segment most at risk, like speculative properties, were more effective than
aiming at overall credit or mortgage loans.
VII. TEN TAKEAWAYS AND SUGGESTIONS FOR FURTHER RESEARCH
The paper tries to shed light on the actual practice of macroprudential policy. Based on the
evidence analyzed in the six country studies for Brazil, Hong Kong SAR, Korea, Malaysia,
Poland, and Romania, granular details emerged on systemic risk measurement, institutional
arrangements, calibration and enforcement of tools and their effectiveness. In these six
episodes, our analysis points to key takeaways for implementing LTV-DTI policies in
practice that are set out below. These observations do not attempt to distill best practice, but
should be read to complement the framework for macroprudential policy instruments
provided in IMF (2013a), IMF(2013b), IMF (2014a), and IMF (2014b).
Monitoring systemic risk—going beyond credit and house prices
1. Countries monitor systemic risks, especially sectoral risks, by tracking and being
attentive to a range of indicators, beyond aggregate credit and house prices (see Section III).
Examples include:
a. Growth in high LTV loans with long maturities;

30
b. Growth in mortgage loans and the number of borrowers with multiple
mortgages;
c. Cross-sectional differences in NPLs on loans with specific characteristics
based on LTV, foreign-currency, borrower income, loan tenors, even when
the overall NPL-ratio (in percent of gross loans) is flat or decreasing due to
rapid credit growth; and
d. Widening difference in interest rates on comparable loans (such as auto loans
versus payday loans) suggesting that lending standards on one of them is
falling.
2. Countries monitor a wide range of indicators, including those for borrowers,
speculative activities and other qualitative indicators on risk-taking. Creative design and use
is made of indicators (such as those listed in 1) based on macroeconomic and supervisory
data, as well as from credit bureaus and surveys of households and financial institutions. In
order to do this, the macroprudential authority needs access to various types of data sources.
Using the tools
3. In the six countries, the range for limits on LTVs was 60–85 percent, and that for
DTIs was 30–45 percent. Also, the criteria used for setting those ranges, and for changing
them were mostly discretionary.
4. NPLs by LTV-specific or DTI-specific loan characteristics can help in calibrating the
limit adopted. In particular, combinations of high-LTV loans with longer loan tenors were
associated with higher NPL ratios. And, this information was used to increase (capital) risk-
weights on auto loans from 75 percent to 150 percent in Brazil (see Section IV).
5. The LTV/DTI measures were often complemented by other prudential and fiscal
measures to enhance effectiveness. For example, capital gains tax on property, stamp duties,
reserve requirements, a range of taxes, and risk weights.
Taking decisions
6. The case studies found that in the six countries reducing the time between
announcement and implementation limited regulatory arbitrage. This suggests that, faced
with emerging risks, it can be preferable to announce and implement the measures without
consulting with financial institutions in advance. That said, the measures have to be well
communicated to the public once adopted (see Section V).
7. Central banks are often in charge of monitoring systemic risk but a diverse set of
institutions take decisions on macroprudential policy. However, for the specific exercises for
the case studies, the central banks had access to a wide range of data from other institutions.
31
8. Some leakages are unavoidable. Their effects could be moderated where the
authorities cooperate with other supervisory authorities in advance, including supranational
agencies, and are flexible in closing them where they arise.
Evaluating effectiveness
9. Time-series estimates from the country studies suggest that decreases in LTV and
DTI limits were effective in reducing loan-growth, improving debt-servicing capacities of the
borrowers and thus making the financial sector more resilient against downside risks (see
Section VI). However, the measures, in general, did not affect house price growth, except in
one case. Capital flows in the real-estate market and direct lending by foreign banks may
hinder the effectiveness of the measures.
10. Targeted measures (those aimed at the most risky group of mortgage loans) were
more effective than those applicable to overall mortgages. For instance, measures aimed at
speculative properties and regions in Korea seemed to be effective in reducing the
acceleration of real estate prices in these regions.
Issues for further research
The vast evidence gathered in the six country studies suggests that there remain important
gaps in our understanding of macroprudential policies. We would like to emphasize five
areas. First, further work could look at whether there are benefits to being more rules-based
when deciding on how much to tighten or loosen policies (IMF, 2013a and 2014a). Second,
the exact transmission channels through which the LTV/DTIs work in practice and interact
with other policies need further analysis. Third, further work is needed on how to make
macroprudential policies more effective in situations where there are surges in capital flows
and strong and persistent demand for housing from cross-border sources. Fourth, more work
is needed to analyze the trade-off between social policies aimed at home-ownership versus
the high economic costs of housing-related financial crisis. And fifth, little is known as to
when, by how much, and based on what information, countries should ease LTV/DTI limits.

32
REFERENCES
Abdul Rani, Muhamad Shukri, and Chin Ching Lau, 2015, “Implementing Loan-to-Value
and Debt-to-Income Ratios: Learning from Malaysia’s Experiences,” Bank Negara
Malaysia Working Paper, forthcoming.
Afanasieff, Tarsila S., Fabiana L. C. A. Carvalho, Eduardo C. de Castro, Rodrigo L. P.
Coelho, and Jaime Gregório, 2015, “Implementing Loan-to-Value Ratios: The Case
of Auto Loans in Brazil (2010-2011),” Banco Central Do Brasil, Working Paper No.
380, March. http://www.bcb.gov.br/pec/wps/ingl/wps380.pdf
Ahuja, Ashvin, and Malhar Nabar, 2011, “Safeguarding Banks and Containing Property
Booms: Cross-Country Evidence on Macroprudential Policies and Lessons from
Hong Kong SAR,” IMF Working Paper 11/284,
https://www.imf.org/external/pubs/ft/wp/2011/wp11284.pdf
Arregui, Nicolas Jaromír Beneš, Ivo Krznar, Srobona Mitra, Andre O Santos, 2013a,
“Evaluating the Net Benefits of Macroprudential Policy: A Cookbook,” IMF
Working Paper No. 13/167,
http://www.imf.org/external/pubs/cat/longres.aspx?sk=40790.
Arregui Nicolas, Mohamed Norat, Antonio Pancorbo, and Jodi Scarlata, 2013b, “Addressing
Interconnectedness: Concepts and Prudential Tools,” IMF Working Paper
No. 13/199, http://www.imf.org/external/pubs/ft/wp/2013/wp13199.pdf .
Bierut, Beata, Tomasz Chmielewski, Adam Glogowski, Andrzej Stopczynski, 2015,
“Implementing Loan-to-Value and Debt-to-Income Ratios: Learning from Poland’s
Experiences,” Narodowy Bank Polski Working Paper, forthcoming.
Cerra, Valerie, and Sweta Chaman Saxena. 2008. "Growth Dynamics: The Myth of
Economic Recovery." American Economic Review, 98(1): 439-57.
Cerutti, Eugenio, Stijn Claessens, and Luc Laeven, 2015, “The Use and Effectiveness of
Macroprudential Policies: New Evidence,” IMF Working Paper 15/61,
http://www.imf.org/external/pubs/ft/wp/2015/wp1561.pdf
Claessens, Stijn, M. Ayhan Kose, and Marco E. Terrones, 2012, “How do Business and
Financial Cycles Interact?” Journal of International Economics, Elsevier, Vol. 87(1),
pp. 178–190.
Crowe, Christopher, Giovanni Dell'Ariccia, Deniz Igan, and Pau Rabanal, 2011, “Policies to
Deal with Macrofinancial Stability: Options to Deal with Real Estate Booms,”
https://www.imf.org/external/pubs/ft/sdn/2011/sdn1102.pdf.
He, Dong, 2014, “The effects of macroprudential policies on housing market risks: evidence
from Hong Kong,” Banque de France Financial Stability Review, No. 18, April,
33
available at https://www.banque-
france.fr/fileadmin/user_upload/banque_de_france/publications/FSR18_DONG-
HE.pdf .
HKMA, 2014, “The Impact of Counter-cyclical Prudential and Demand-management
Measures on Hong Kong’s Housing Market,” HKMA Half-Yearly Monetary and
Financial Stability Report, September, 53–56,
http://www.hkma.gov.hk/media/eng/publication-and-research/quarterly-
bulletin/qb201409/chapter4.pdf
Igan, Deniz and Heedon Kang, 2011, “Do Loan-to-Value and Debt-to-Income Limits Work?
Evidence from Korea,” IMF Working Paper 11/297,
https://www.imf.org/external/pubs/ft/wp/2011/wp11297.pdf.
International Monetary Fund, 2010, “Will It Hurt? Macroeconomic Effects of Fiscal
Consolidation,” Chapter 3 of the World Economic Outlook, October.
_______, 2011, “Towards Operationalizing Macroprudential Policies—When to Act,”
Chapter 3 in the Global Financial Stability Report, September.
http://www.imf.org/External/Pubs/FT/GFSR/2011/02/index.htm.
_______, 2013a, “Key Aspects of Macroprudential Policy,” IMF Policy Paper,
http://www.imf.org/external/np/pp/eng/2013/061013b.pdf.
_______, 2013b, “Key Aspects of Macroprudential Policy: Background Paper,” IMF Policy
Paper, http://www.imf.org/external/np/pp/eng/2013/061013c.pdf .
_______, 2014a, “IMF Staff Guidance Note on Macroprudential Policy, IMF Policy Paper,
http://www.imf.org/external/np/pp/eng/2014/110614.pdf.
_______, 2014b, “IMF Staff Guidance Note on Macroprudential Policy: Detailed Guidance
on Instruments, IMF Policy Paper,
https://www.imf.org/external/np/pp/eng/2014/110614a.pdf.
IMF Global Housing Watch, Quarterly Update,
http://www.imf.org/external/research/housing/report/pdf/1014.pdf
Kan, Eric, 2015, “Implementing Loan-to-Value and Debt-to-Income Ratios: Learning from
Hong Kong SAR’s Experiences,” mimeo.
Kim, Yong Min, J.Y. Lee, H. Jang, 2015, “Implementing Loan-to-Value and Debt-to-Income
Ratios: Learning from Korea’s Experiences,” mimeo.
Krznar, Ivo, and James Morsink, 2014, “With Great Power Comes Great Responsibility:
Macroprudential Tools at Work in Canada,” IMF Working Paper 14/83,
http://www.imf.org/external/pubs/cat/longres.aspx?sk=41551.0.
34
Lim, Cheng Hoon, F. Columba, A. Costa, P. Kongsamut, A. Otani, M. Saiyid, T. Wezel, and
X. Wu, 2011, “Macroprudential Policy: What Instruments and How to Use Them?
Lessons from Country Experiences,” IMF Working Paper 11/238,
https://www.imf.org/external/pubs/ft/wp/2011/wp11238.pdf.
Lim, C.H., I. Krznar, F. Lipinsky, A. Otani, X. Wu, 2013, “The Macroprudential Framework:
Policy Responsiveness and Institutional Arrangements,” IMF Working Paper 13/166,
http://www.imf.org/external/pubs/ft/wp/2013/wp13166.pdf.
McDonald, Chris, 2015, “When is Macroprudential Policy Effective?” BIS Working Paper
496, March.
Neagu, Florian, Luminita Tatarici and Irina Mihai, 2015, “Implementing Loan-to-Value and
Debt-to-Income Ratios: Learning from Romania’s Experiences,” National Bank of
Romania Working Paper, forthcoming.
Nier, Erlend W., Jacek Osiński, Luis I. Jácome, and Pamela Madrid, 2011, “Institutional
Models of Macroprudential Policy,” IMF Staff Discussion Note 11/18,
http://www.imf.org/external/pubs/ft/sdn/2011/sdn1118.pdf.
Romer, Christina D., and David H. Romer, 2004, “A New Measure of Monetary Shocks:
Derivation and Implications,” The American Economic Review, Vol. 94, No. 4.
Vandenbussche, Jerome, Ursula Vogel, and Enrica Detragiache, 2015, “Macroprudential
Policies and Housing Prices – A New Database and Empirical Evidence for Central,
Eastern, and Southeastern Europe,” Journal of Money, Credit and Banking
(forthcoming).
Wong, E., A. Tsang, A., and S. Kong, 2014, “How Does Loan-to-Value Policy Strengthen
Banks’ Resilience to Property Price Shocks—Evidence from Hong Kong,” HKIMR
Working Paper 03/2014, forthcoming in International Real Estate Review.
35
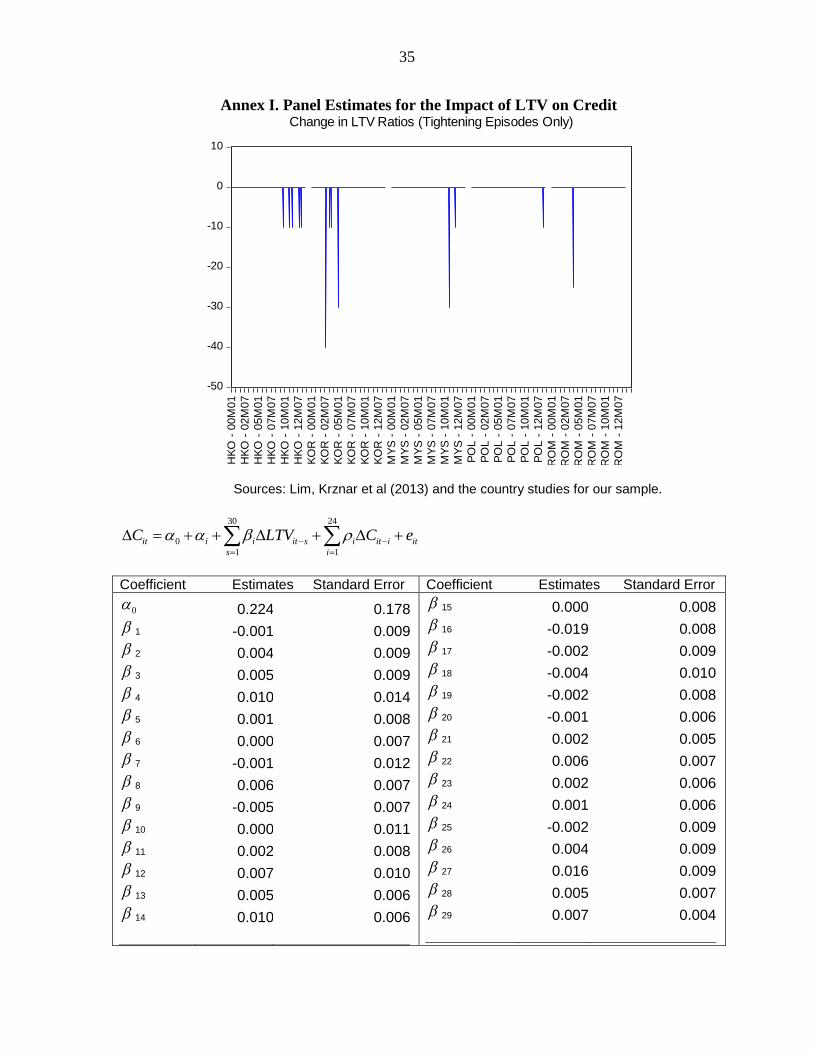
Annex I. Panel Estimates for the Impact of LTV on Credit
Sources: Lim, Krznar et al (2013) and the country studies for our sample.
30 24
0
1 1
it i i it s i it i it
s i
C LTV C e
Coefficient Estimates Standard Error Coefficient Estimates Standard Error
0 0.224 0.178
1 -0.001 0.009
2 0.004 0.009
3 0.005 0.009
4 0.010 0.014
5 0.001 0.008
6 0.000 0.007
7 -0.001 0.012
8 0.006 0.007
9 -0.005 0.007
10 0.000 0.011
11 0.002 0.008
12 0.007 0.010
13 0.005 0.006
14 0.010 0.006
15 0.000 0.008
16 -0.019 0.008
17 -0.002 0.009
18 -0.004 0.010
19 -0.002 0.008
20 -0.001 0.006
21 0.002 0.005
22 0.006 0.007
23 0.002 0.006
24 0.001 0.006
25 -0.002 0.009
26 0.004 0.009
27 0.016 0.009
28 0.005 0.007
29 0.007 0.004
-50
-40
-30
-20
-10
0
10
HK
O -
00M
01
HK
O -
02M
07
HK
O -
05M
01
HK
O -
07M
07
HK
O -
10M
01
HK
O -
12M
07
KO
R -
00M
01
KO
R -
02M
07
KO
R -
05M
01
KO
R -
07M
07
KO
R -
10M
01
KO
R -
12M
07
MY
S -
00M
01
MY
S -
02M
07
MY
S -
05M
01
MY
S -
07M
07
MY
S -
10M
01
MY
S -
12M
07
PO
L -
00M
01
PO
L -
02M
07
PO
L -
05M
01
PO
L -
07M
07
PO
L -
10M
01
PO
L -
12M
07
RO
M -
00
M0
1
RO
M -
02
M0
7
RO
M -
05
M0
1
RO
M -
07
M0
7
RO
M -
10
M0
1
RO
M -
12
M0
7
Change in LTV Ratios (Tightening Episodes Only)

36
Coefficient
Estimate
Standard Error
30 0.001 0.007
1 0.150 0.093
2 0.186 0.088
3 0.100 0.086
4 0.063 0.087
5 0.002 0.085
6 -0.021 0.075
7 -0.016 0.083
8 -0.009 0.078
9 0.062 0.080
10 -0.025 0.066
11 0.078 0.077
12 0.064 0.069
Coefficient
Estimate
Standard Error
13 0.058 0.076
14 0.032 0.072
15 0.015 0.076
16 -0.075 0.070
17 0.102 0.072
18 0.106 0.087
19 -0.116 0.085
20 -0.036 0.069
21 0.095 0.071
22 -0.008 0.064
23 0.009 0.069
24 -0.034 0.063
R2 = 0.33
DW = 1.99 Country Fixed Effects, unbalanced panel Cross-section: Hong Kong SAR, Korea, Malaysia, Poland and Romania Time: July 2002–December 2012, monthly Number of observations: 501 Standard Errors: White corrected
The estimated responses of mortgage credit growth in the months following one percentage
point lower LTV tightening are calculated as follows (Figure 7, top panel):
Month 1 = 1
Month 2 = 2 + 1 1
Month 3 = 3 + 1( 2 + 1 1) + 2 1
…..and so on.
The cumulative impact (Figure 7, bottom panel) on the level of credit is derived by adding up
the monthly effects:
1 + ( 2 + 1 1) + ( 3 + 1( 2 + 1 1) + 2 1) + ……………..
The standard error bands are derived by generating the distribution of coefficients from 1000
random draws based on the estimated variance-covariance matrix for the coefficients.

37
Annex II. Data Sources for Country Case Studies
BRAZIL (Afanasieff et al, 2015)
Variable Data Sources
Dependent Variable
Auto loans Auto loan granting BCB's Financial System Monitoring Department
Explanatory Variables
1. Dummy treatment Zero for new untargeted loans and one for new targeted loans (new loans with certain LTV and maturities combinations)
BCB's Financial System Monitoring Department
2. Dummy measure Dummy measure is zero before the event and one after the event (the events are the introduction of the measure in the first case study and its withdrawal in the second case)
BCB's Financial System Monitoring Department
3.Dummytreatment*dummy-measure
The interaction among the two dummies BCB's Financial System Monitoring Department
4. New auto sales Sales of new auto FENABRAVE
HONG KONG SAR (Wong and others, 2015)
Variable Data Sources
Dependent Variable
New mortgage loans as a share of outstanding mortgage loans
New mortgage loans drawn down during the month
HKMA
Outstanding mortgage loans (in the previous month)
HKMA
Explanatory Variables
1. Annual change in the market LTV ratio
Average LTV ratio for new loans approved during the month
HKMA
2. Returns on equity for property investment
Average LTV ratio for new loans approved during the month
HKMA
Residential property prices Rating and Valuation Department, HKSARG
Rental yield of residential properties Rating and Valuation Department, HKSARG
Mortgage rate HKMA
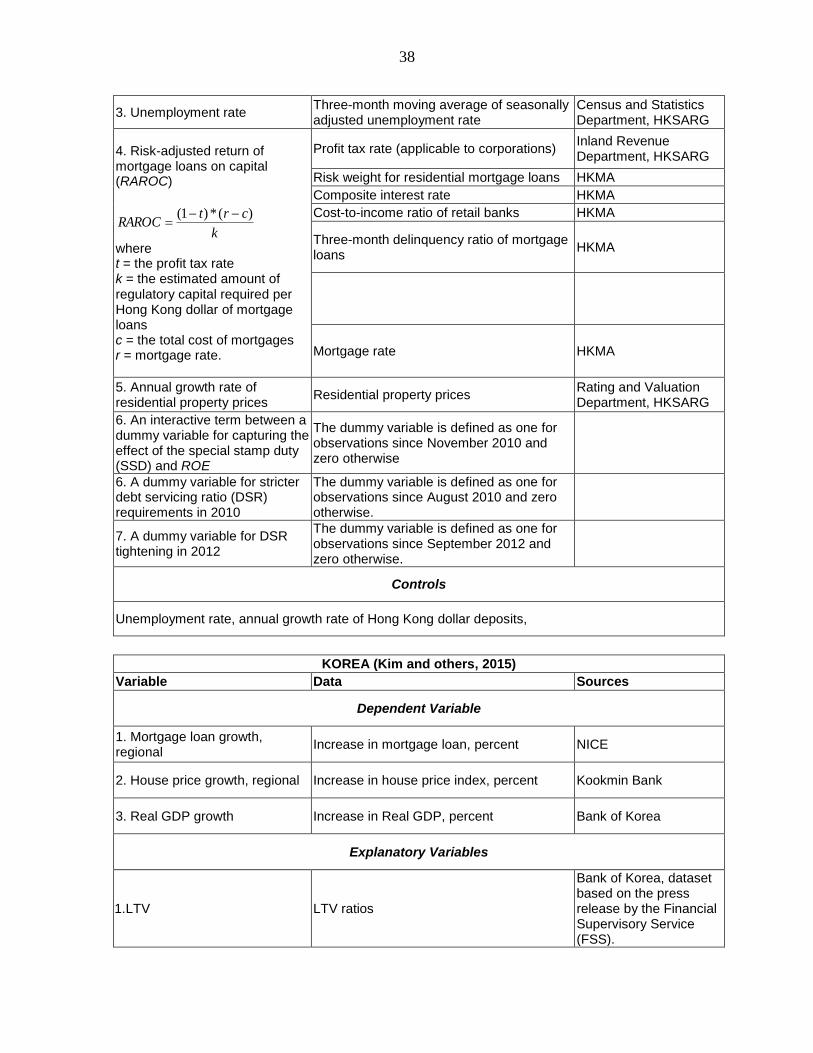
38
3. Unemployment rate Three-month moving average of seasonally adjusted unemployment rate
Census and Statistics Department, HKSARG
4. Risk-adjusted return of mortgage loans on capital (RAROC)
k
crtRAROC
)(*)1(
where t = the profit tax rate k = the estimated amount of regulatory capital required per Hong Kong dollar of mortgage loans c = the total cost of mortgages r = mortgage rate.
Profit tax rate (applicable to corporations) Inland Revenue Department, HKSARG
Risk weight for residential mortgage loans HKMA
Composite interest rate HKMA
Cost-to-income ratio of retail banks HKMA
Three-month delinquency ratio of mortgage loans
HKMA
Mortgage rate HKMA
5. Annual growth rate of residential property prices
Residential property prices Rating and Valuation Department, HKSARG
6. An interactive term between a dummy variable for capturing the effect of the special stamp duty (SSD) and ROE
The dummy variable is defined as one for observations since November 2010 and zero otherwise
6. A dummy variable for stricter debt servicing ratio (DSR) requirements in 2010
The dummy variable is defined as one for observations since August 2010 and zero otherwise.
7. A dummy variable for DSR tightening in 2012
The dummy variable is defined as one for observations since September 2012 and zero otherwise.
Controls
Unemployment rate, annual growth rate of Hong Kong dollar deposits,
KOREA (Kim and others, 2015)
Variable Data Sources
Dependent Variable
1. Mortgage loan growth, regional
Increase in mortgage loan, percent NICE
2. House price growth, regional Increase in house price index, percent Kookmin Bank
3. Real GDP growth Increase in Real GDP, percent Bank of Korea
Explanatory Variables
1. LTV LTV ratios
Bank of Korea, dataset based on the press release by the Financial Supervisory Service (FSS).

39
2. DTI Debt Service to Income Ratios Bank of Korea
3. Interest rate Overnight call rate Bank of Korea
4. SPA Dummy for Speculative Area
Bank of Korea, dataset based on the press release by the Ministry of Strategy and Finance
MALAYSIA (Abdul Rani and Lau, 2015)
Variables Data Sources
Event study
Loans for residential property, by individuals
Loans for residential property, domestic businesses
Housing loans by loan-to-value (LTV) ratio buckets (<60 percent, 60-<70 percent, 70-<80 percent, 80-<90 percent and >90 percent)
Third and above outstanding housing loans per borrower
Outstanding RM amount of housing loans granted to individuals by banks and non-bank lenders
17 in Malaysia
Outstanding RM amount of housing loans granted to domestic businesses (including sole proprietors) by banks and non-bank lenders in Malaysia Ratio of outstanding RM amount of total housing loans to outstanding RM value of the financed property for banks in Malaysia Annual growth of borrowers with three and above outstanding housing loans from banks and non-bank lenders in Malaysia
Central Credit Reference Information System, CCRIS
18
(BNM) CCRIS (BNM) CCRIS (BNM) CCRIS (BNM)
POLAND (Bierut et al, 2015)
Variables Data Sources
1. Average LTV for new
mortgage loans
Bank survey NBP surveys
2. LTV structure for new
mortgage loans
Volumes of new mortgage loans by LTV Polish Bank
Association
3. Average DTI for indebted
households
DTI calculated using self-reported debt
payments and disposable income per
household
Annual Polish
Household Budget
Survey (PHBS) carried
out by the Central
Statistical Office of
17
Comprises non-bank lenders that report credit data in CCRIS, including development financial institutions
and cooperative banks
18 CCRIS collects credit information on individuals, businesses (sole proprietors and partnerships), companies,
and even Government entities borrowers.

40
Poland
4. Share of households with
high DTI
See above See above
5. Average LTV for
households with mortgage
Mortgage value estimated using self-
reported mortgage debt service payments
and information on mortgage maturity,
currency composition and interest rates
Real estate values estimated based on
information on location and size (from the
household survey) and unit price
information
National Bank of
Poland estimations
based on PHBS,
banking sector
statistics for maturity
and currency structure
and interest rates
(source: NBP) and
Pont-Info database
(real estate prices)
6. Share of households with
high LTV
See above See above
7. Average income buffer for
indebted households
Income buffer calculated using:
Self-reported debt payments and
disposable income per household;
Minimum existence costs per person;
The average national salary
PBHS;
The Polish Institute of
Labor and Social
Studies;
The Central Statistical
Office of Poland
8. Distribution of the income
buffer for low- and highly-
indebted households
See above See above
7. Distribution of the income
buffer for low- and highly-
indebted households
(measured by LTV)
Income buffer calculated as above.
LTV calculated using:
Self-reported mortgage debt payments;
Mortgage interest rates.
See above
9. Number of housing loans in
arrears of more than 90 days
in relation to total number of
loans extended in a given
year
Credit Information Bureau definition Credit Information
Bureau (BIK)
10. Structure of debt service
payments—banks and non-
bank financial institutions
Self-reported debt payments (related to
bank debt and non-bank debt) per
household
PBHS
ROMANIA (Neagu et al, 2015)
Variables Data Sources
Dependent variables
1. Credit growth rate Growth rate of total loans granted to households and its components
Public Credit Register
2. NPL ratio Nonperforming loan to total outstanding amount for each vintage
Public Credit Register (only exposure per debtor higher than 20,000 RON).
41
Explanatory variables
1. Real Estate Price Index Logarithm of real estate index. The index of residential real estate prices (2009=100). The index is reconstructed for 2004-2008 period from an internal estimation on residential prices.
National Institute of Statistics, Central Bank estimations prior 2009
2. Regulation enforcement (easing) dummy
The regulation dummy variable is taking a value of one when the prudential measure that includes DSTI and/or LTV is introduced or modified (enforcement). On the contrary, the dummy variable for easing of regulation refers to the period when the measures targeting DSTI and/or LTV were removed (March 2007–September 2008).
Central Bank
3. Prima Casă dummy This dummy variable takes the value of one starting with Q2/2009—the moment of implementation of Prima Casă program
Central Bank
Controls
Monetary policy rate, minimum reserve ratio, inflation rate, real annual GDP growth rate, unemployment rate, financial expectations over the next year, size of bank, loan/deposit ratio, solvency rate, leverage ratio, interest rate, bank external debt, imports/GDP.