low-cost carriers in the airline industry - diana...
TRANSCRIPT

Dvorkin 1
Low-Cost Carriers in the Airline Industry:
An In-Depth Analysis of Southwest Airlines, JetBlue Airways and EasyJet Airlines
Diana Dvorkin
MS2103 Operations Management Individual Assessment of Exchange Students
Prof. Lilian M. de Menezes Dr. Aristides Matopoulos

Dvorkin 2
Diana Dvorkin MS2013
The Airline Industry: Low Cost Carriers
Low Cost Carriers: Background Due to increased globalization in the 90s, the airline industry greatly expanded.
Businesses were starting to grow more global connections, thus needing a more developed air transport system to accommodate business travel (Whitlegg, 2005). The airline industry rapidly grew to accommodate these needs, with major airlines dominating the skies (Franke, 2004). The industry hit a major downturn after 11 September 2001, as people became apprehensive towards travel, creating a fear in consumers. This also popped the previous airline bubble, due to the rapid development (Franke, 2004). This was coupled with the great economic crisis, as people began to cut expenses where they could, especially with air travel. This consumer trend changed the market, as flying on mainstream airlines, or Network Carriers (NCs), was no longer economically practical, thus Low Cost Carriers began to emerge (Whitelegg, 2005). Low Cost Carriers, or LCCs we able to thrive, as they created a market for flyers who would not normally fly under the expensive and logistically complicated NCs (Whitelegg, 2005). This led to industry expansion, which benefited LCCs, as fare competition drove prices downs, attracting their customers (Graham & Shaw, 2008).
Low Cost Carriers were able to efficiently grow due to a change in their operational platforms, as they began to utilize a point-to-point structure (Alderighi et al, 2007). This eliminates unnecessary expenses, while providing a more efficient travel structure (Graham & Shaw, 2008). The hub and spoke structure uses a ‘hub’ in which most flights are flown through, getting passenger’s to their final destinations or to their connecting flight, via a ‘spoke’ as seen in Exhibit 1 (Alderighi et al, 2007).
Exhibit 1: Point-to-Point and Hub and Spoke Flight Configuration
Originally, the hub and spoke structure was thought to be effective because it would allow larger amounts of passengers on larger flights, however due to the high number of flights between major hubs there is little product differentiation. Without product differentiation, fares are driven up (Franke, 2004). In addition, the hub and spoke structure decreases efficiency due to

Dvorkin 3
longer delays, due to hub traffic, which in turn leads to high time costs for airlines. This led to an increased demand for direct flights (Rubin, 2005).
LCCs provide a point-to-point system, which eliminates the need for a hub altogether, leading to lower operational costs (Alderighi et al, 2007). Since two-thirds of cost structure are fixed costs, eliminating unnecessary costs that are tied to the hubs, leads to a decrease in overall costs (Rubin, 2005). This allows LCCs to charge lower prices for their flights, attracting consumers. (Rubin, 2005)
In addition to low fares, LCCs have many characteristics that make them a more attractive and efficient alternative to NC (Alderighi et al, 2007). s. LCCs have been strategically structured to be more efficient, both logistically and financially (Alderighi et al, 2007). By having smaller more fuel-efficient aircrafts, they are able to easily fill planes to capacity, while also enjoying better fuel efficiency (Alderighi et al, 2007). This process leads to economies of scale, as unfilled seats represent lost revenue (Rubin, 2005). Once the flight departs, the airline seats are perishable goods, making it essential to fill as many seats as possible (Rubin, 2005). This gives them the power to leverage overhead costs (Rubin, 2005). They have quicker turnaround times, due to their point-to-point flight plans, leading to less delay, an attractive feature for customers. In addition, they have a “no frills” approach, cutting down on unnecessary extra costs, diagramed in Exhibit 2 (Morrell, 2005).
Exhibit 2: Low Cost Carrier’s Characteristics
Many ways exist to operationally analyze top low cost carriers, however major focus will
be given to specific processes. In order for LCCs to gain dominance in the market, they must be competitive in the diversity of flights and their efficiency in doing so. Analysis of the 4 V’s in airline’s end product, their flights, along with, key performance criteria and supply chain configuration will be discussed. Due to the complex nature of the airline industry, the focus will be on the level of the process, and the flow between resources.

Dvorkin 4
The Airlines
Southwest Airlines was the pioneer of the revolutionary low cost model, utilizing the point-to-point system that other airlines began to adopt, characteristics of which are seen in Exhibit 3 (Morrell, 2005). Southwest starting operations in the Southwest, and expanding its successful model across North America, building market share against NCs (Southwest, 2012).
Exhibit 3: The Southwest Model
JetBlue Airway is smaller American airline, which follows the ‘Southwest Model’ while
providing more in-flight services to match consumer needs. It directly competes with Southwest due to overlapping airports, however their marketing and heightened in-flight experience lead to more experience conscious consumer (JetBlue, 2012). However this heightens operating costs, a major avoidance in Southwest’s low-cost model (Wu, 2012).
EasyJet Airlines, is a European LCC originating in the UK, using its island advantage to create the first point-to-point networks throughout Europe (Dobson and Piga, 2013). They are able to attract a loyal customer base through their cost conscious buyers that are looking for a high volume of flights from popular European cities (EasyJet, 2012). EasyJet is known for using less congested airports in many popular cities, improving on-time statistics, reducing costs, and attracting lower fares (Dobson and Piga, 2013). The Four V’s of Airline Operations
The Four V’s of LCCs include Volume, Variety, Variation and Visibility. Southwest, JetBlue and Easy Jet follow similar patterns in their distributions, seen in Exhibit 4, the differences of which are analyzed below. Since the airlines have strong similarities and trends in characteristics, in order to differentiate the different airlines, a range of factors were analyzed.

Dvorkin 5
These reflect the efficiency of airlines operations and their response to customers needs, based on each airlines annual report for 2012.
• Volume: Capability of Flight Operations • Variety: Destinations • Variation: Airline Fleet • Visibility: Ticket Operations
Exhibit 4: The Four V’s of Airline Operations
Volume has been measured through Available Seats per Mile, or ASM (Kilometers for EasyJet) in Exhibit 5. This reflects both the total capacity and mileage of each airline for the year of 2012. The high volume these flights reflects the high repeatability, specialization, and systemization of the airlines. Additionally, the more passengers and miles, the lower the unit costs, as the costs are spread, utilizing economies of scale. JetBlue has the lowest ASM, which could reflect negatively on its finances, as unit costs are more concentrated, leading to more pressure to fill seats to spread costs.
Exhibit 5: Volume of The Four V’s of Airline Operations
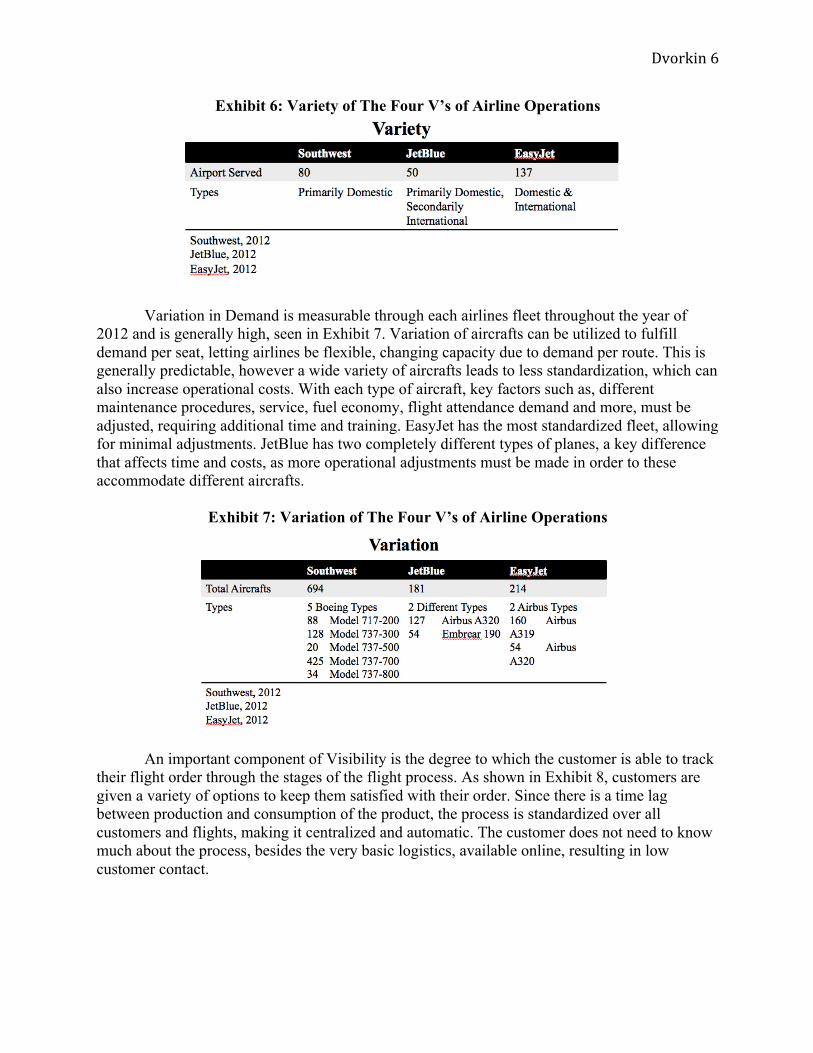
The variety of locations is portrayed in Exhibit 6, display that there is a relatively high level of variety that is flexible to match consumer needs. This shows that they are in touch with customer demand, with stable and routine routes that utilize demand efficiently to maintain a low unit cost.
Dvorkin 6
Exhibit 6: Variety of The Four V’s of Airline Operations
Variation in Demand is measurable through each airlines fleet throughout the year of
2012 and is generally high, seen in Exhibit 7. Variation of aircrafts can be utilized to fulfill demand per seat, letting airlines be flexible, changing capacity due to demand per route. This is generally predictable, however a wide variety of aircrafts leads to less standardization, which can also increase operational costs. With each type of aircraft, key factors such as, different maintenance procedures, service, fuel economy, flight attendance demand and more, must be adjusted, requiring additional time and training. EasyJet has the most standardized fleet, allowing for minimal adjustments. JetBlue has two completely different types of planes, a key difference that affects time and costs, as more operational adjustments must be made in order to these accommodate different aircrafts.
Exhibit 7: Variation of The Four V’s of Airline Operations
An important component of Visibility is the degree to which the customer is able to track
their flight order through the stages of the flight process. As shown in Exhibit 8, customers are given a variety of options to keep them satisfied with their order. Since there is a time lag between production and consumption of the product, the process is standardized over all customers and flights, making it centralized and automatic. The customer does not need to know much about the process, besides the very basic logistics, available online, resulting in low customer contact.

Dvorkin 7
Exhibit 8: Visibility of The Four V’s of Airline Operations
The ultimate lowest processing cost requires high volume, low variety, low variation and low visibility (Matopoulos, 2013). The airlines experience high volume, high variety, in most cases low variation and low variable. The higher variety in locations is cannot be comprised, as it is the core of the airline industry, even if it doesn’t lead to the lowest processing cost. However JetBlues high variation in its fleet leads to higher processing cost, reflected in its financials. Key Performance Criteria:
Key Performance Criteria were based on five aspects of performance, quality, speed, dependability, flexibility and cost. These parameters were assessed using statistics from each airlines annual report, for the year of 2012. Quality, as seen in Exhibit 9, reflects how well the airlines were doing filling their planes, represented by Total Passengers Boarded, Available Seats per Mile (ASM), and Passenger Load Factor. These represent how well the plane is using its capacity. Southwest has the highest Passenger Load Factor, meaning they are able to fill their planes the most out of the three airlines. This is important, as empty seats do not contribute to economies of scale and are perishable goods once the flight has departed. Additional research to assess quality would include safety statistics.
Exhibit 9: Key Performance Criteria – Quality

Dvorkin 8
Speed, seen in Exhibit 10, assessed the time between order and delivery, analyzed through on-time flights, and delays. Efficient flight operations are essential to airlines, as time management is an important asset to customers. Southwest had the best flight statistics, with minimal delays in both time and percentage. JetBlue had average delay percentages in the 80% range, however their delays were much more dramatic, with a range that included 45+ minutes. This shows a lack of efficiency in their flight operations, however more research would need to be conducted to find the correlation affected flight process and the delays. EasyJet displayed the worst on-time arrivals, a strange statistic in regards to their high on-time departures rate. This signifies a problem with their flight operations, as on-time departures usually correlates to on-time arrivals. In order to more thoroughly analyze each airlines speed, research on turnaround time once the aircraft lands, would assess on-ground operations effectiveness.
Exhibit 10: Key Performance Criteria – Speed
Dependability has been measured by cancelled flights and mishandled baggage, seen in
Exhibit 11. Since handling of luggage and the flights themselves are main components the customers depend on, their statistics are essential. JetBlue has the highest cancellation rate since January, 2013. There is no information posted on the reasons for these cancellations, but that lowers their dependability. However both JetBlue and Southwest have low baggage mishandling scores, proving efficient luggage operations, increasing their dependability. EasyJet has not released their baggage mishandling information due to competitive reasons.
Exhibit 11: Key Performance Criteria – Dependability
Airline flexibility, the ability to adapt and provide customers with individual treatment
has been assessed through the services that the airlines provide. Each additional service adds to

Dvorkin 9
the flight’s operating costs. In-flight entertainment and WiFi requires investment in equipment that may take many flights to pay off. Food and Beverage must be plentiful enough to accommodate passengers, while still not wasting food. This balance is difficult to achieve, as additional food options may be perishable, resulting in sunk costs. Baggage costs may affect passenger’s airline chose, however the additional weight results in corresponding fuel, labor and time costs. EasyJet offers the least amount of services, streamlining its operations and cutting down on unnecessary costs. JetBlue has more variables with the highest amount of in-flight options, leading to unstable operating costs per flight.
Exhibit 12: Key Performance Criteria – Flexibility
Airline Costs are diagramed in Exhibit 12, and reflect the revenue and the costs of the
flights. Measured through PRASM, Passenger Revenue per Available Seat Mile and CASM, Cost per Available Seat Mile, revenue and costs can be assessed. Southwest has the highest difference in PRASM and CASM, profiting $0.56 per passenger. This could be due to their high passenger load factor, as the difference between PRASM and CASM measures passengers and overall operating costs per seat, filled or not. EasyJet has similar passenger load factor and profit per seat as Southwest, while JetBlue is the lowest in both categories. By not filling seats, and lowering economies of scale JetBlue is unable to make as much profit.

Dvorkin 10
Exhibit 13: Key Performance Criteria – Costs
Airline Supply Configurations The core of these airlines are their configurations of flight routes using the point-to-point system, each to a different degree. For each airline’s success, they started with a local configuration, building local support while establishing their flight model (Peanuts). They then expanded internationally, each on a different scale. Southwest has just begun expansion to logistically close international destinations in North America, as it still works to use the point-to-point system, displayed on their website, see in Appendix A (Southwest, 2012). JetBlue has expanded to twelve countries in attempts to differentiate themselves in North America’s LCC market, seen in Appendix B. This has brought success both in North American consumers and in Caribbean and Latin American markets (JetBlue, 2012). EasyJet has expanded from the UK to Western and now Eastern Europe, seen in Appendix C, while taking market share from established NCs like Virgin Airlines (Topham, 2012). Each airlines strong focus on the point-to-point structure as outlined earilier, has led to success in the airline industry (Alderighi et al, 2007). They have been able to lower operating costs while providing a more logistically efficient service to customers. They have been able to extend these networks over large land masses in North America and Europe. Within this, some microhubs have been created, out of logistical necessity (Alderighi et al, 2007). Southwest, the originator of the point-to-point system has their main operations occur out of Dallas, close to the center of the U.S. (Southwest, 2012). This could be an emerging trend in LCCs, as their success brings on greater volume of flights, leading to possible changes in supply configurations.

Dvorkin 11
References Alderighi, M. et al. (2007) Assessment of New Hub-and-Spoke and Point-to-Point, Airline
Network Configurations. Transport Reviews, 27 (5), p.529-549. Dobson, P. and Piga, C. (2011) THE IMPACT OF MERGERS ON FARES STRUCTURE:
EVIDENCE FROM EUROPEAN LOW-COST AIRLINES. Economic Inquiry, 51 (2), p.1196-1217. Available at: http://onlinelibrary.wiley.com.libproxy.chapman.edu/doi/10.1111/j.1465-7295.2011.00392.x/references [Accessed: 4th April 2013].
EasyJet Airlines. 2012 Annual Report and Accounts 2012. PDF. EasyJet. 2013 'Performance'http://corporate.easyjet.com/about-easyjet/our-per
formance.aspx?sc_lang=en (accessed: 9 April 2013). FlightStats. 2013 'Airline Information'http://www.flightstats.com/go/Airline/airlineDetai
ls.do (accessed: 9 April 2013). Franke, M. (2013) Competition between network carriers and low-cost carriers—retreat battle or
breakthrough to a new level of efficiency?. Journal of Air Transport Management, 10 (1), p.15-21.
Graham, B. and Shaw, J. (2008) Low-cost airlines in Europe: Reconciling liberalization and
sustainability. GeoForum, 39 (3), p.1439-1451. JetBlue Airways Corporation. 2012 2012 Annual Report. PDF. JetBlue. 2013 'JetBlue Investor Relations 'http://investor.jetblue.com/phoenix.zhtml?c=131045
&p=irol-irhome (accessed: 9 April 2013). Morrell, P. (2005) Airlines within airlines: An analysis of US network airline responses to Low
Cost Carriers. Journal of Air Transport Management, 11 (5), p.303-312. Available at: http://0-www.sciencedirect.com.wam.city.ac.uk/science/article/pii/S0969699705000566 [Accessed: 4th April 2013].
Rubin, R. (2005) Where are the airlines headed? Implications of airline industry structure and
change for consumers. Journal of Consumer Affairs, 39 (1), p.215. Southwest Airlines. 2012 2012 One Report. PDF. Southwest. 2013 'Southwest Investor Relations' http://southwest.investorroom.com/ (accessed: 9
April 2013). Whitelegg, D. (2005) Flying for peanuts: the rise of low-cost carriers in the airline industry.
Journal of Transport History, 26 (2), p.125.

Dvorkin 12
Wu, S. (2012) The "Southwest Effect" Revisited: An Empirical Analysis of the Effects of Southwest Airlines and JetBlue Airways on Incumbent Airlines from 1993 to 2009.. Michigan Journal of Business, 5 (2), p.11-40. Available at: http://michiganjb.org/issues/52/text52a.pdf [Accessed: 1st April 2013].

Dvorkin 13
Appendix A: Southwest Destinations
Southwest.com, 2013
Appendix B: JetBlue Destinations
JetBlue.com, 2013

Dvorkin 14
Appendix C: EasyJet Destinations
Easyjet.com, 2013