louisiana traffic records data report 2019
TRANSCRIPT

Center for Analytics & Research in Transportation Safety
Louisiana Traffic Records Data Report 2019
Dr. Helmut Schneider
September 2020
CARTS.lsu.edu

Center for Analytics & Research in Transportation Safety
Overview
• Trends in Crashes, Fatalities & Injuries• Explanation of trends • Driving Under the Influence of Alcohol: Crashes and DWI Arrests• Occupant Protection• Crash Costs

Center for Analytics & Research in Transportation Safety
Some Notes about Interpretation of Data • Regression to the mean
• Explaining versus predicting• Predicting: Does it continue to happen?• Explaining: Why did it happen?
• Causation versus correlation• Drunk driving is associated with fatal crashes. (Correlation)• Does an increase in drunk driving result in an increase of fatal crashes? (Causation)• Drugged driving is associated with fatal crashes. (Correlation)• Does an increase in drugged driving result in an increase of fatal crashes? (Causation)
• Confounding • Confounding of factors make it difficult to interpret which factor caused the crashes to go up
or down.

Center for Analytics & Research in Transportation Safety
Trends• What are the trends in crashes, fatalities and injuries?• What are the trend in rates?• What are one-year changes?• What are changes from 2010 to 2019?• Highlights:
• Interstates• Bicycles• Pedestrians• Motorcycles• Young drivers• Crash costs

Center for Analytics & Research in Transportation Safety
Trends in Fatalities & Fatality RateWhile the fatalities have been on the rise again since 2012, there was no change from 2017 to 2018, but a decline of 44 fatalities from 2018 to 2019 or 5.7%.
Fatalities per 100 million miles traveled declined by 8.4% from 2018 to 2019.
What is the cause for this “Z” curve?
966993
677
771
727
2.152.19
1.461.54
1.411.3
1.4
1.5
1.6
1.7
1.8
1.9
2
2.1
2.2
2.3
300
400
500
600
700
800
900
1000
2005 2006 2007 2008 2009 2010 2011 2012 2013 2014 2015 2016 2017 2018 2019
Fatalities Fatality Rates

Center for Analytics & Research in Transportation Safety
Crashes, Vehicles, Occupants (1,000)Number of • # of crashes
• # Occupants in Crashes• # Vehicles in crashes
437
398
468
434
302279
333307
158 148 174
160
100
150
200
250
300
350
400
450
500
2005 2006 2007 2008 2009 2010 2011 2012 2013 2014 2015 2016 2017 2018 2019
Occuopants Vehicles Crashes
Center for Analytics & Research in Transportation Safety
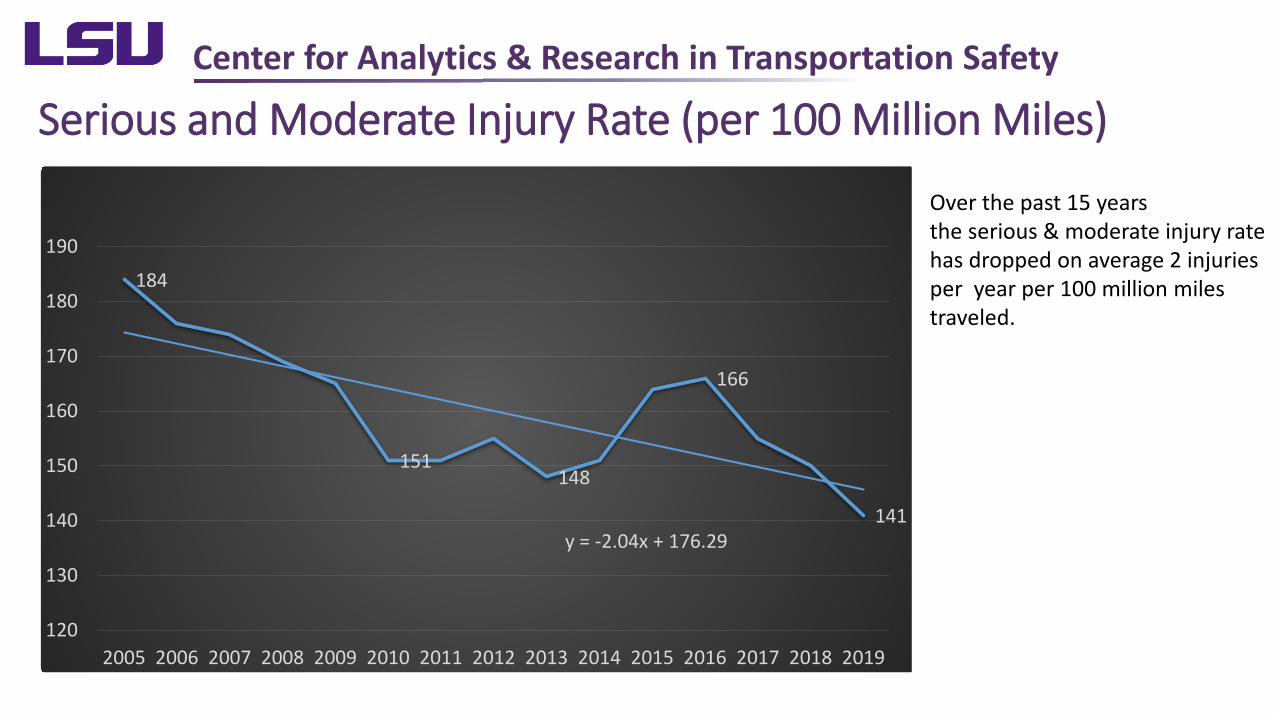
Serious and Moderate Injury Rate (per 100 Million Miles)
Over the past 15 yearsthe serious & moderate injury rate has dropped on average 2 injuries per year per 100 million miles traveled.
184
151148
166
141y = -2.04x + 176.29
120
130
140
150
160
170
180
190
2005 2006 2007 2008 2009 2010 2011 2012 2013 2014 2015 2016 2017 2018 2019

Center for Analytics & Research in Transportation Safety
Fatality Rate per 1,000 Occupants of Cars, Light Trucks, SUVs, and Vans
If we still had the same fatality rate per occupant as in 2006 (1.81) we would have had 287 more fatalities in 2019.
The fatality rate per occupant seems to have shifted to a lower level starting in 2008.
713
462501
457
1.81
1.221.31
1.15
0.90
1.10
1.30
1.50
1.70
1.90
2.10
200
300
400
500
600
700
800
2005
2006
2007
2008
2009
2010
2011
2012
2013
2014
2015
2016
2017
2018
2019
Fatality Trends (Cars, Light Trucks, SUVs, and Vans)
Fatal Fatal Rate (per 1,000 OCC)

Center for Analytics & Research in Transportation Safety Moderate and Severe Injury(Cars, Light Trucks, SUVs, and Vans)Moderate-to- Severe Injuries:Decreased from 13,997 in 2005 to 10,556 in 2019
The Moderate-to- Severe-Injury Rate: (per 1,000 Occupants)Decreased from 35.58 in 2005 to 26.67 in 2019. Has been flat between 26.71 (2017), 26.51 (2018) And 26.67 (2019).
If we had the same injury rate as in 2005,we would have had 3, 528 more moderate to severe injuries in 2019.
13,997
11,045 11,879
10,556
35.58
29.4128.15
26.67
20.00
22.00
24.00
26.00
28.00
30.00
32.00
34.00
36.00
38.00
40.00
10,000
10,500
11,000
11,500
12,000
12,500
13,000
13,500
14,000
14,500
2005
2006
2007
2008
2009
2010
2011
2012
2013
2014
2015
2016
2017
2018
2019
Serious & Moderate Trends (Cars, Light Trucks, SUVs, and Vans)
Serious & Moderate Injuries SMI Rate (per 1,000 OCC)

Center for Analytics & Research in Transportation Safety
Conclusion from the Trend Data
A comparison between 2005 and 2019 crash data for LA show:• about the same number of crashes• about the same number of vehicles in crashes • about the same number of occupants in crashesHowever, LA had • 35.9% fewer fatalities in (Cars, Light Trucks, SUVs, and Vans)• 24.6% fewer serious and moderate injuries in (Cars, Light Trucks,
SUVs, and Vans)

Explaining Injury & Fatality Trends• 1984 (FMVSS 208) to require cars produced after 1 April 1989
to be equipped with a passive restraint for the driver.• September 1998 Federal legislation makes front airbags on both sides
mandatory. • 2009 NHTSA mandate that all automakers must phase in additional
side-impact protection as a standard feature for their cars, trucks and SUVs goes in effect.

Fatality and Injury Rates by Vehicle Model Year(Per 100,000 Occupants in crashes)
The rate of serious to fatal injuries declined by 78.4% from 1988 model vehicle to a 2000 model vehicle.The rate of fatalities declined by 90.5% from 1988 model vehicle to a 2000 model vehicle.
-
1.00
2.00
3.00
4.00
5.00
6.00
7.00
8.00
9.00
-
10.00
20.00
30.00
40.00
50.00
60.00
1988 1990 1992 1994 1996 1998 2000 2002 2004 2006 2008 2010 2012 2014 2016 2018 2020
Fatal and Injury Rates by Vehicle Year
% Minor to Fatal Rate Fatal Rate Serious to Fatal Rate
46%
22%
7%
0%
5%
10%
15%
20%
25%
30%
35%
40%
45%
50%
2005 2006 2007 2008 2009 2010 2011 2012 2013 2014 2015 2016 2017 2018 2019
% Vehicles Year <1999

Center for Analytics & Research in Transportation Safety Explaining Injury & Fatality Trends versus Unemployment
Louisiana Unemployment Rate
966 993
677771
727
2.15 2.19
1.461.54
1.41 1.3
1.5
1.7
1.9
2.1
2.3
300400500600700800900
1000
2005 2006 2007 2008 2009 2010 2011 2012 2013 2014 2015 2016 2017 2018 2019
Fatalities Fatality Rates

Center for Analytics & Research in Transportation Safety Explaining Injury & Fatality Trends versus Seat Belt Use
713
462 501 4571.81
1.22 1.311.15 0.90
1.40
1.90
2.40
200
400
600
800
2005 2006 2007 2008 2009 2010 2011 2012 2013 2014 2015 2016 2017 2018 2019
Fatality Trends (Cars, Light Trucks, SUVs, and Vans)
Fatal Fatal Rate (per 1,000 OCC)

Center for Analytics & Research in Transportation Safety
Conclusion• Safer cars beginning with the 1999 models (airbags)
• Resulting in a permanent lower injury and fatality rate per vehicle in a crash
• 2007-2011 three things where happening• Older less safe cars (<1999) where phased out• The economy had a downturn, fewer vehicles in crashes• Seat belt use increased by 2.5 percentage points
• 2011-2019 experienced an increase in vehicles in crashes due to increased economic activities. But
• at much lower injury rates of safer cars, and • A 10 percentage point increase in seat belt use
• The result is more like a “Z” curve rather than a “V” curve

Other Trends

Center for Analytics & Research in Transportation Safety
Crashes on State Routes and Local Roads
101792
89533
71833 70879
17.1%
15.5%
16.0%
16.5%
17.0%
17.5%
18.0%
18.5%
19.0%
19.5%
20.0%
40000
50000
60000
70000
80000
90000
100000
110000
2007 2008 2009 2010 2011 2012 2013 2014 2015 2016 2017 2018 2019
STATE LOCAL %-Single Veh Linear (%-Single Veh)

Interstate Fatalities
From 2018 to 2019• Fatalities down 15.8%• Fatality rate down 15.2%
165180
141 133 135 140
93106 115 110
96114 112 114
96
1.35
0.740.67 0.67
0.40
0.60
0.80
1.00
1.20
1.40
1.60
020406080
100120140160180200
FATAL CRASHES
FATALITIES
FATALITIES PER 100 MILLION MILES TRAVELED
Center for Analytics & Research in Transportation Safety
• 2017-2019 number of crashes trending downwards on state roads, US HWY & Interstates while number of crashes on local roads have not changed much.
• Single vehicle crashes on state routes US HWY & Interstates have declined by one percentage point over the past 10 years.

Bicyclist Fatalities
• 2018-2019 • Bicyclist fatalities down 26.7%• Alcohol involved bicyclist's death
unchanged
• All injuries went up 9.7%. • Over the past 15 years on
average Louisiana had 19.8 bicyclist fatalities per year.
611 648739
727
0
100
200
300
400
500
600
700
800
0
5
10
15
20
25
30
35
40Bicycles
FATALITIES FATALITIES WITH ALCOHOL
INJURIES & FATALITIES

Motorcyclist Fatalities
2018-2019 Change• Motorcyclist fatalities up 10.1%.• Alcohol involved motorcyclist's
death up 14.3%.• Injuries down 4.3%. • Injuries have been trending
downward for the past decade.
1,483
1,784
1,480 1,405
1,194
-
200
400
600
800
1,000
1,200
1,400
1,600
1,800
2,000
0
20
40
60
80
100
120
2005
2006
2007
2008
2009
2010
2011
2012
2013
2014
2015
2016
2017
2018
2019
Motorcycles
FATALITIES FATALITIES WITH ALCOHOL
INJURIES & FATALITIES

Pedestrian Fatalities & Injuries
2018-2019 change• 26.1% decrease in pedestrian
fatalities• 6.6% decrease in pedestrian
injuries• Injuries have trended
upwards since 2006.
1,296
1,053
1,464
1,635
1,527
- 200 400 600 800 1,000 1,200 1,400 1,600 1,800
020406080
100120140160180
2005
2006
2007
2008
2009
2010
2011
2012
2013
2014
2015
2016
2017
2018
2019
Pedestrians
FATALITIES FATALITIES WITH ALCOHOL
INJURIES & FATALITIES


Center for Analytics & Research in Transportation Safety
Young Drivers in Fatal Crashes
71
21
43
27
17
29
91
33
4740
77
44
58 57
44
0
10
20
30
40
50
60
70
80
90
100
2005 2006 2007 2008 2009 2010 2011 2012 2013 2014 2015 2016 2017 2018 2019
Crash Rates Per 100,000 Licensed Drivers
15-17 18-20 21-24 Poly. (18-20)

Center for Analytics & Research in Transportation Safety
The four Major Contributing Factors
Alcohol
Aggressive Driving
Safety Belt
DistractionThe 5-year average is 78% of fatal crashes involves one of the four factors.

Center for Analytics & Research in Transportation Safety
Distractions

Center for Analytics & Research in Transportation Safety
Cell Phone Distraction Distracted & Inattentive Fatalities
2,154
2,278 2,217
2,178 2,241
2,343 2,404 2,406
2,174
2,279
3
6
13
9
56
3
87
17
0
2
4
6
8
10
12
14
16
18
1,500
1,600
1,700
1,800
1,900
2,000
2,100
2,200
2,300
2,400
2,500
2010 2011 2012 2013 2014 2015 2016 2017 2018 2019
Drivers Driver Fatalities
214 213 214204
187
166154
168155
137
172156
168158
187
0
50
100
150
200
250

Center for Analytics & Research in Transportation Safety
Aggressive Driving
Aggressive Driving is defined as either• Exceeding stated speed limit• Exceeding safe speed limit• Failure to Yield• Following too closely• Improper passing• Disregarded traffic control• Careless operation
Center for Analytics & Research in Transportation Safety
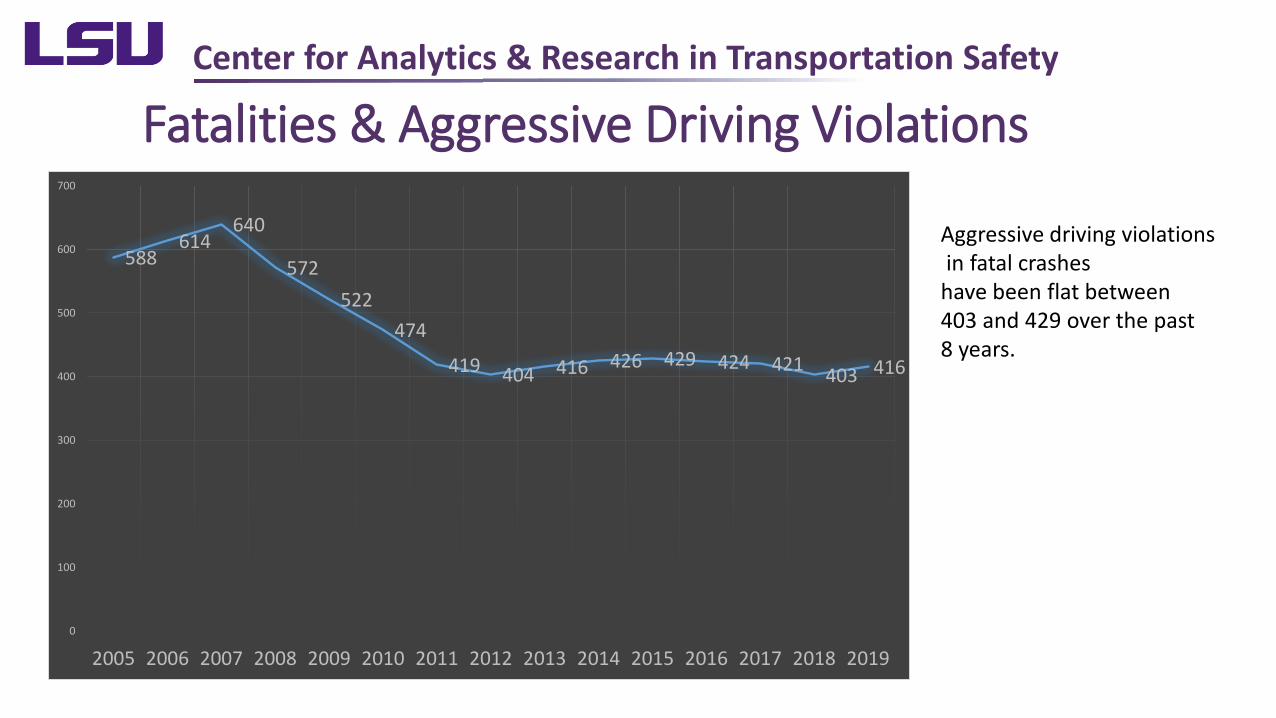
Fatalities & Aggressive Driving Violations
Aggressive driving violationsin fatal crashes
have been flat between 403 and 429 over the past 8 years.
588614
640
572522
474
419 404 416 426 429 424 421 403 416
0
100
200
300
400
500
600
700
2005 2006 2007 2008 2009 2010 2011 2012 2013 2014 2015 2016 2017 2018 2019
Center for Analytics & Research in Transportation Safety
Drinking and Driving
Center for Analytics & Research in Transportation Safety
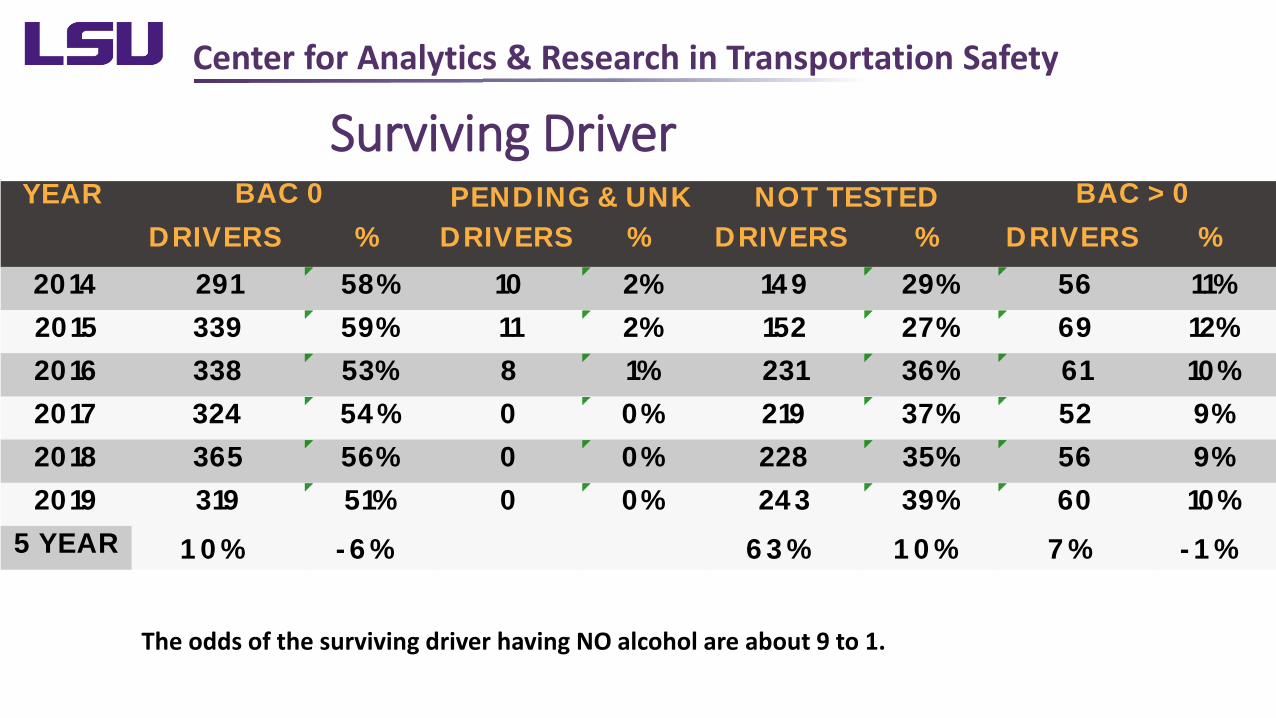
Surviving Driver
The odds of the surviving driver having NO alcohol are about 9 to 1.
YEAR DRIVERS % DRIVERS % DRIVERS % DRIVERS %
2014 291 58% 10 2% 14 9 29% 56 11%2015 339 59% 11 2% 152 27% 69 12%2016 338 53% 8 1% 231 36% 61 10%2017 324 54 % 0 0% 219 37% 52 9%2018 365 56% 0 0% 228 35% 56 9%2019 319 51% 0 0% 24 3 39% 60 10%
5 YEAR 10% -6% 63% 10% 7% -1%
BAC 0 PENDING & UNK NOT TESTED BAC > 0

Center for Analytics & Research in Transportation Safety
Fatalities
The odds of the killed driver having NO alcohol are about 2 to 1. The odds of the fatal driver to have BAC>0 are about 5 times the odds of the surviving driver.
YEAR DRIVERS % DRIVERS % DRIVERS % DRIVERS %
2014 206 4 2% 4 3 8.8% 73 15% 166 34 %2015 24 5 4 7% 22 4 .2% 72 14 % 184 35%2016 24 8 50% 3 0.6% 74 15% 167 34 %2017 277 54 % 0 0.0% 67 13% 173 34 %2018 251 51% 0 0.0% 92 19% 150 30%2019 257 54 % 0 0.0% 53 11% 167 35%
5 YEAR 25% 12% -27% -4% 1% 1%
BAC 0 PENDING & UNK NOT TESTED BAC > 0
Center for Analytics & Research in Transportation Safety
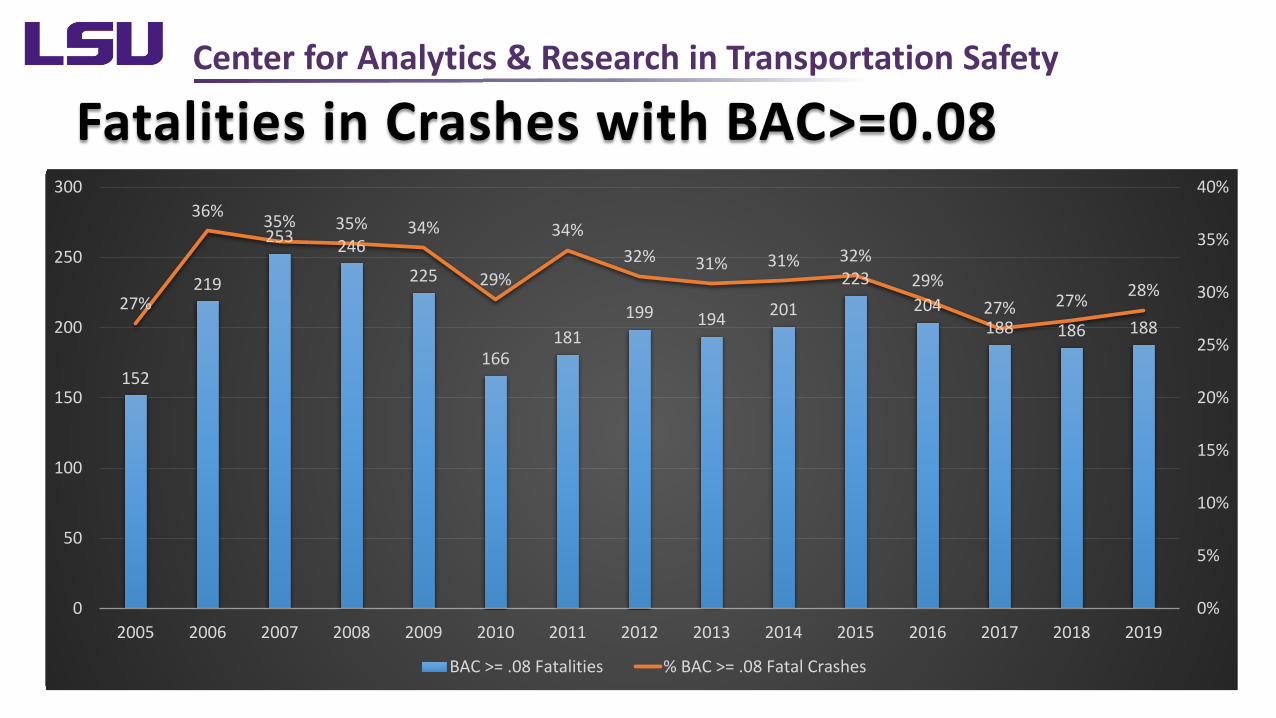
Fatalities in Crashes with BAC>=0.08
152
219
253 246225
166181
199 194 201
223204
188 186 18827%
36% 35% 35% 34%
29%
34%32% 31% 31% 32%
29%27% 27% 28%
0%
5%
10%
15%
20%
25%
30%
35%
40%
0
50
100
150
200
250
300
2005 2006 2007 2008 2009 2010 2011 2012 2013 2014 2015 2016 2017 2018 2019
BAC >= .08 Fatalities % BAC >= .08 Fatal Crashes

Center for Analytics & Research in Transportation Safety
Rate (per 100,000 lic. Drivers) Youth Drivers and Alcohol Involvement in Fatal Crashes
17
3 2 1 1
17
29
86 7
21
35
16
11
0
5
10
15
20
25
30
35
40
2005 2006 2007 2008 2009 2010 2011 2012 2013 2014 2015 2016 2017 2018 2019
Youth Drivers with Predicted Alcohol Involved in Fatal Crashes
15-17 18-20 21-24

Center for Analytics & Research in Transportation Safety DWI Fatalities and % DWI Fatalities Involving of BAC>=0.08 by Troop Area
Size of bubble represents total number of fatalities.
AB
C D
EF
G I
L
0%
5%
10%
15%
20%
25%
30%
35%
40%
45%
50%
0 10 20 30 40 50 60Number of Fatalities BAC>08
%Al
coho
l-Rel
ated
Fat
aliti
es

Center for Analytics & Research in Transportation Safety
DWI Arrests from COBRA Rule of Thumb:
For every 1,000 hours Saturation Patrol 4 fewer fatalities.
For every SFST conducted 3 fewer fatalities.
Source: Target of Opportunity Report.
6,125 5,679 5,308 4,565 4,587 4,497 4,064 4,078 3,721 3,434
16,185 15,659 14,93112,450 11,753 9,678 8,378 10,014 9,356 9,244
2,019 1,770 1,609
1,120 1,004800
717756 641 580
7,4486,833
6,123
5,428 5,5233,598
2,7883,963 3,715 3,822
0
5000
10000
15000
20000
25000
30000
35000
2010 2011 2012 2013 2014 2015 2016 2017 2018 2019
COBRA DATA
No DWI ADULT-DWI UNDERAGE-DWI REFUSED

Center for Analytics & Research in Transportation Safety
COBRA: Refused Tests
8,579
3,822
33.2%
22.4%
0.0%
5.0%
10.0%
15.0%
20.0%
25.0%
30.0%
35.0%
0
1,000
2,000
3,000
4,000
5,000
6,000
7,000
8,000
9,000
10,000
2004 2005 2006 2007 2008 2009 2010 2011 2012 2013 2014 2015 2016 2017 2018 2019
Refused % Refused

Center for Analytics & Research in Transportation Safety
COBRA: Average BAC
0.125
0.119
0.12
0.121
0.122
0.123
0.124
0.125
0.126
2008 2009 2010 2011 2012 2013 2014 2015 2016 2017 2018 2019

Center for Analytics & Research in Transportation Safety
Youth (17-20) DWI Arrests
2,750
817
0.096
0.089
0.078
0.08
0.082
0.084
0.086
0.088
0.09
0.092
0.094
0.096
0.098
0
500
1,000
1,500
2,000
2,500
3,000
2009 2010 2011 2012 2013 2014 2015 2016 2017 2018 2019# TESTS POSIVE AVERAGE BAC

Center for Analytics & Research in Transportation Safety
Average Age in DWI Arrests
35
38
33.5
34
34.5
35
35.5
36
36.5
37
37.5
38
38.5
2009 2010 2011 2012 2013 2014 2015 2016 2017 2018 2019

Center for Analytics & Research in Transportation Safety
Drugs in Fatal Crashes (Crime Lab Data)
38 42 4150
93
158
3343
2741
213435
49
34
5340 40
0
20
40
60
80
100
120
140
160
180
2014 2015 2016 2017 2018 2019
Cannabinoid Narcotics Stimulants

Center for Analytics & Research in Transportation Safety
Occupant Protection
What progress has Louisiana made over the past 20 years?

Center for Analytics & Research in Transportation Safety
Seat Belt Usage (1999-2019)
67.0%68.2%
68.1%68.6%
73.8%75.0%
77.7%
74.8%
75.2%
75.5%74.5%
75.9%77.7%
79.3%
82.0%84.1%
85.9%87.8% 87.1%
86.9%
87.5%
y = 1.1%x + 66.1%
60.0%
65.0%
70.0%
75.0%
80.0%
85.0%
90.0%19
99
2000
2001
2002
2003
2004
2005
2006
2007
2008
2009
2010
2011
2012
2013
2014
2015
2016
2017
2018
2019

Center for Analytics & Research in Transportation Safety
Seat Belt Use by Region 2016-2019Region Estimate STD Error
1-New Orleans 87.0% 0.2%
2-Baton Rouge 84.4% 0.2%
3-Houma 91.3% 0.2%
4-Lafayette 86.6% 0.2%
5-Lake Charles 91.1% 0.3%
6-Alexandria 81.3% 0.3%
7-Shreveport 90.1% 0.2%
8-Monroe 84.9% 0.3%LA total 87.7% 0.1%
FIGURE 1: LOUISIANA SURVEY REGIONS
2. Baton Rouge
1. New Orleans
8. Monroe
6. Alexandria
3. Houma
4. Lafayette
7. Shreveport
5. Lake Charles
2019Louisiana 87.5% Texas 90.9%Arkansas 81.9%Mississippi 80.5%Alabama 92.3%

Center for Analytics & Research in Transportation Safety
Seat Belt Use by Troop 2016-2019
Troop Estimate STD ErrorA-Baton Rouge 84.8% 0.2%B-New Orleans
86.1% 0.2%C-Houma 93.4% 0.2%
D-Calcasieu 91.1% 0.3%E-Natchitoches
81.3% 0.3%F-Monroe 85.1% 0.3%
G-Shreveport90.4% 0.2%
I-Lafayette 86.6% 0.2%L-Hammond 88.3% 0.2%
LA 87.7%

Center for Analytics & Research in Transportation Safety
Seat Belt Use of Fatalities versus Seat Belt Use Survey by Troop
y = 1.0x - 40R² = 0.65
35%
40%
45%
50%
55%
60%
80.0% 82.0% 84.0% 86.0% 88.0% 90.0% 92.0% 94.0% 96.0%
Seat Belt Use (Survey)
Seat
Bel
t Use
(Fat
ality
)

Center for Analytics & Research in Transportation Safety
Seat Belt Tickets by Age Group per 100,000 licensed Drivers

Center for Analytics & Research in Transportation Safety
Set Belt Tickets by Age Group, Gender and Race per 100,000 licensed drivers

Center for Analytics & Research in Transportation Safety
Multiple Tickets

Center for Analytics & Research in Transportation Safety
Ratio of Estimated Percentage of Driver Receiving Seat Belt Tickets over Percentage of Drivers not Wearing a Seat Belt
FEMALE MALESeat Belt Tickets BLACK OTHER WHITE BLACK OTHER WHITE
10.91 0.85 1.18 0.86 1.15 1.01
20.84 0.47 0.84 1.13 1.21 1.10
30.73 0.47 0.65 1.31 1.33 1.15
40.65 0.28 0.58 1.40 1.27 1.18
5+0.53 0.19 0.47 1.54 1.15 1.23
Table 5: Ratio of Estimated Percentage of Driver Receiving Seat Belt Tickets over Percentage of Drivers not Wearing a Seat Belt

Center for Analytics & Research in Transportation Safety
Cost of Crashes The Economic and Societal Impact Of Motor Vehicle Crashes, 2010, page 12, unit cost are adjusted by CPI.
Type Average Cost per Person InjuriesTotal Cost by Injury Category in Billion
Dollars
Total Cost by Injury Category in Billions
Including Loss of Quality of Life
Fatal Injuries $1,650,721 727 $1.20 $7.85Severe Injuries $422,227 1,348 $0.57 $2.44
Moderate Injuries $123,869 11,536 $1.43 $6.07Complaint Injuries $26,879 59,629 $1.60 $3.24
Occupants with No Injury$5,168 360,402 $1.86 $1.86
Property Damage $7,170 307,202 $2.20 $2.20Grand Total Cost 740,844 $8.87 $23.66
Cost per licensed Driver $2,993 $7,989Percent change from past year -0.4% -0.9%
Moderate, sever & fatality make up only 36% of the economic costs but 89% of quality of life costs.
For comparison Louisiana’s fiscal year 2019 executive budget was $9.74 Billion.

Center for Analytics & Research in Transportation Safety
Summary
• While the number of crashes and number of people involved in crashes are about the same as in 2005, fatalities are about 25% lower than in 2005.
• Factors contributing to this are:• Safer vehicles. • Higher seat belt use, (+10%) over past 10 years• Alcohol impaired fatalities (BAC>0.08) slightly down over the past three years
• Cost of crashes decreased slightly from 2018 to 2019.

COVID-19 Year Outlook
01020304050607080
killed-2015-2019 Killed-2020
02000400060008000
10000120001400016000
Crashes: 2015-2019 Crashes: 2020