loss allocation reduction to customers by optimal … · loss allocation reduction to customers by...
TRANSCRIPT

International Journal on Electrical Engineering and Informatics - Volume 9, Number 4, December 2017
Loss Allocation reduction to customers by optimal location and sizing of
DG in electrical distribution systems
Thiruveedula Ramana1, Valasula Ganesh2 and Sirigiri Sivanagaraju3
1EIT Services India Pvt. Ltd., DXC Technologies, Bangalore 560100, India 2Dept. of EEE, JNTUA, Anantapur 515002, India 3Dept. of EEE, JNTUK, Kakinada 533003, India
[email protected], [email protected], [email protected]
Abstract: This paper deals radial distribution system power losses allocation to connected
consumers before and after distribution generator (DG) in a deregulated environment.
Allocation of power loss is made in a proposed exact method way, which is calculated
based on allocating power losses to consumers by taking each branch current suppling to
customer load from substation to customer load. Proposes a new methodology to reduce
the burden of loss allocation to customers by allocating the optimal DG size at best
location. The best location derive based on highest value line of power stability index
(PSI) and increase in small steps of DG values in best location obtain the optimal DG size
at the best location. The impact of DG on voltage profile, system losses and customer
losses allocation are visualized by an analytical approach. The robustness and scalability
of proposed method is tested on 12 bus and 69-bus radial distribution networks and
compared with the existing Golden Section Search (GSS) algorithm
Keywords: Electrical distribution system; power loss allocation; distributed generator;
PSI, voltage profile
1. Introduction
Deregulation of the power industry was intended to acquaint rivalry and with cut down costs,
enhance productivity and make a hard and fast change in the business. It was principally gone
for annihilating the monopolistic, defensive and vertically incorporated structure of the industry
and giving an opportunity to the new contestants to make their commitments to the business.
Dissimilar to era and offer of electrical vitality, exercises of transmission and distribution are for
the most part considered as a characteristic syndication. The cost of transmission and distribution
exercises should be designated to the clients of these systems. Allocation should be possible
through system utilize tariffs, with an attention on the genuine effect they have on these expenses.
Among others, distribution power losses are one of the expenses to be allocated. The primary
trouble confronted in allocating power losses is the nonlinearity between the losses and delivered
power which complicates the impact of each client on system losses, which is discussed in
Gomez et al. [1].
Various techniques have been published in the publications for allocation of losses, most of
them dedicated to transmission networks and can be classified into three groups – pro rata
procedures, marginal procedures, proportional sharing procedures, and circuit-based procedures.
Pro rata procedure in Gonzalez et al. [2] and Bialek et al. [3] are the simplest one in which the
total losses are first assigned to generators and loads, generally 50% of losses are assigned to
each category. Then the losses are allocated to individual generators proportional to their active
power generated or consumed irrespective of their location within the network. Thus remotely
located generators or loads will be benefited at the expense of the others. In marginal procedures
in [4-7], losses are assigned to generators and demands through the so-called incremental
transmission loss (ITL) coefficients. This method depends on the location of the slack bus.
Hence, different slack buses will give different ITL coefficients. The method has the
disadvantage that it results in over recovery and needs normalization. The ITL coefficients can
be positive or negative. The negative ones can be interpreted as cross subsidies in [5]. In
Received: June 10th, 2017. Accepted: December 25th, 2017 DOI: 10.15676/ijeei.2017.9.4.5 703

proportional sharing procedures in [8-13], losses are allocated to the generators and consumers
by using the results of a converged power flow. The losses are then allocated to different
generators or consumers based on a linear proportional sharing principle.
Conejo et al.[14] have proposed a circuit-based procedure for allocating transmission losses
to generation and loads based on the networks Z-bus matrix. Z-bus loss allocation technique can
also yield negative allocation to those participants who contribute to reduce network losses due
to their strategically well positioned location in the system, which again can be interpreted as
cross subsidies. Conejo et al. [15] have also presented a comparison of different practical
algorithms available for loss allocation in transmission systems. Costa and Matos [16] have
addresses the allocation of losses in distribution networks with embedded generation by
considering quadratic loss allocation technique.
In recent years, with the Distributed Generation (DG), many power companies are investing
in small scale renewable energy resources such as wind, photo-voltaic cells, micro-turbines,
small hydro turbines, CHP or hybrid. DG was only 1.2 GW during 1993–1994, however today
this figure has increased substantially and reached up to over 12GW in [17-18].
It is also expected with the KYOTO protocol commitment by various countries to reduce
CO2 emission, the market for DGs as a ‘‘Clean Energy’’ resource is promising. According to
Energy Network Association (ENA) report (2010) [19] is implying rapid growth in DG and
investment in the power infrastructure. However there are several issues concerning the
integration of DGs with existing power system networks; that needs to be addressed in [19-20].
The integration of DG changes the system from passive to active networks, which affects the
reliability and operation of a power system network as given in [21-22]. Furthermore, the non-
optimal placement of DG can result in an increase of the system losses and thus making the
voltage profile lower than the allowable limit by referring to Griffin et al [23]. Since utilities are
already facing technical and non-technical issues, they cannot tolerate such additional issues.
Hence an optimum placement of DG is needed in order to minimize overall system losses and
therefore improve voltage profiles.
A few specialists have focused on the static voltage stability studies in the conveyance
frameworks [24]. The effect of coordinating wind-driven squirrel case induction generator-based
Distribution generator (DG) on the static voltage stability of radial distribution system (RDN)
has been examined in [25]. Ref. [26] has tackled the issue of static voltage soundness
advancement in a distribution framework with DG utilizing continuation power flow (CPF). In
addition, in [27], a continuation technique is utilized to think about the voltage stability of
conveyance framework. The CPF permits the assurance of the most extreme stacking purpose of
distribution system. Be that as it may, the computational weight of CPF is high a result of the
refresh of Jacobian network for indicator and corrector steps [28]. Proposed an approach for the
voltage stability evaluation in radial systems in [29]. In any case, the proposed model is valid
just at the operating point [30]. The analysts have proposed different static VSIs to distinguish
the critical buses and lines of distribution frameworks. Steady state VSIs can be grouped into
two sorts [31]: local indices and system indices. The system indices estimate the voltage stability
margin of system. The system load margin indices are generally proposed based on the
optimization methods or CPF. Then again, the local indices measure the stability margin of each
node or branch, furthermore, along these lines the system critical bus or branch can be
distinguished. Paper [32] has proposed diverse local branch based indices. Be that as it may, they
have a few mistakes in the hypothetical inductions [33]. In [30] have proposed a VSI for all buses
of RDNs. In this strategy, the bus with least value of VSI is the most sensitive bus to the voltage
collapse. In [34], a VSI is proposed for finding the most critical bus to the voltage instability in
RDN. The investigation depends on the catastrophe theory.
In the past, the methodologies for DG are either based on analytical tools or on optimization
programming methods. Analytical approaches have been proposed by several authors. In [35],
the authors presented analytical approach to determine the optimal location for the DG with an
objective of loss minimization for distribution and transmission networks. In Acharya et al. [36],
the author used the loss sensitivity equation to determine the optimum size of DG and the exact
Thiruveedula Ramana, et al.
704

loss equation to determine the optimum location of DG based on minimum losses.
A method proposes for DG placement and sizing based on the line voltage stability index.
Previously the author in [37-38] has used the continuation power flow method to determine the
most voltage-sensitive bus in the distribution system which could results in voltage instability in
the system. DG is placed on the identified sensitive bus and the size of DG on that bus is
increased gradually till the objective function (voltage constraints) is achieved. Also, in the
deregulated environment, the losses are allocated to different consumers in the network.
In this work, impact of placement and size of DG on loss allocation in radial distribution
networks is presented. This work formulates loss allocation based on exact loss allocation
scheme to consumers in a radial distribution network. It is assumed that consumers have to pay
for losses. The problem formulation proposed herein considers the following aspects:
A new algorithm to identify sensitive bus and DG size on that bus by gradually increasing till
the objective function is satisfied.
Loss allocation to consumers before and after distributed generator placement and size
calculation.
This paper is organized as follows: Section 2 introduces the mathematical equations and
also derived the equation for the PSI. Algorithm for the placement and sizing of the DG and loss
allocation to customer before and after the DG placement in section 3. Numerical example is
given in Section 4 to verify the results proposed in this paper.
A. Mathematical Formulation for Electrical Distribution System
A.1. Load flow equations and customer loss calculation
Consider an equivalent circuit model of typical branch between buses p and q of the radial
distribution system as shown in figure 1.
Figure 1. Simple two bus distribution system
In figure 1, Vpδp and Vqδq are the voltage magnitudes and phase angles of two buses p
and q respectively and current flowing through the line pq is Ipq. The substation voltage is
assumed to be (1+j0) p.u.
From figure 1 we can write
𝑺𝑳𝒒 = 𝑷𝑳𝒒 + 𝒋𝑸𝑳𝒒 = 𝑽𝒒𝑰𝑳𝒒∗ (1)
Receiving end voltage can be calculated by
𝑽𝒒 = 𝑽𝒑 − 𝑰𝒑𝒒𝒁𝒑𝒒
(2)
where,
𝐼𝑝𝑞 =𝑃𝐿𝑞−𝑗𝑄𝐺𝑞
𝑉𝑞∗ (3)
The power loss is calculating as
𝑃𝑙𝑜𝑠𝑠pq = 𝑅𝑒𝑎𝑙 {(Vp − V𝑞)Ipq∗ } (4)
The contribution of the q bus customer in the line pq is shown below
Loss Allocation reduction to customers by optimal location and sizing
705
𝑝𝑙𝑜𝑠𝑠(𝑝𝑞, 𝑞) = 𝑅𝑒𝑎𝑙 {(Vp − V𝑞)I𝐿q∗ }
The global value of losses to be supported by consumers results from the sum of the losses
allocated to it in each line pq of the system, i.e.,
𝑇𝑝𝑙𝑜𝑠𝑠(𝑞) = ∑ 𝑝𝑙𝑜𝑠𝑠(𝑝𝑞, 𝑞)𝑏𝑟𝑝𝑞=1 (5)
Note that bus 1 is substation. Each consumer has allocated losses only at branches to which
power flow contributes in equation (5).
A.2 Development of an index for DG placement
The important factor in maintaining the voltage between two buses is the drop in the line
connecting the two buses, commonly known as voltage regulation. Ideally voltage regulation
should be zero, but there are drops due to resistance and reactance of a line. In transmission lines,
resistance is much less than the reactance of the transmission lines (R/X); while in overhead
distribution system, reactance is much less than the resistance of the line (X/R). There is no anti-
resistance element which could improve the voltage regulation. The series capacitor is commonly
connected in long transmission lines having high reactance than a distribution network, in order
to improve the voltage profile and increasing the system efficiency. However by supporting the
active and reactive power demands locally could significantly reduce the voltage drop in the line
by reduction in line current and losses and thus improves the system efficiency.
An index is derived for finding the most optimum site of DG based on the most critical bus
in the system that can lead to system voltage instability when the load increases above certain
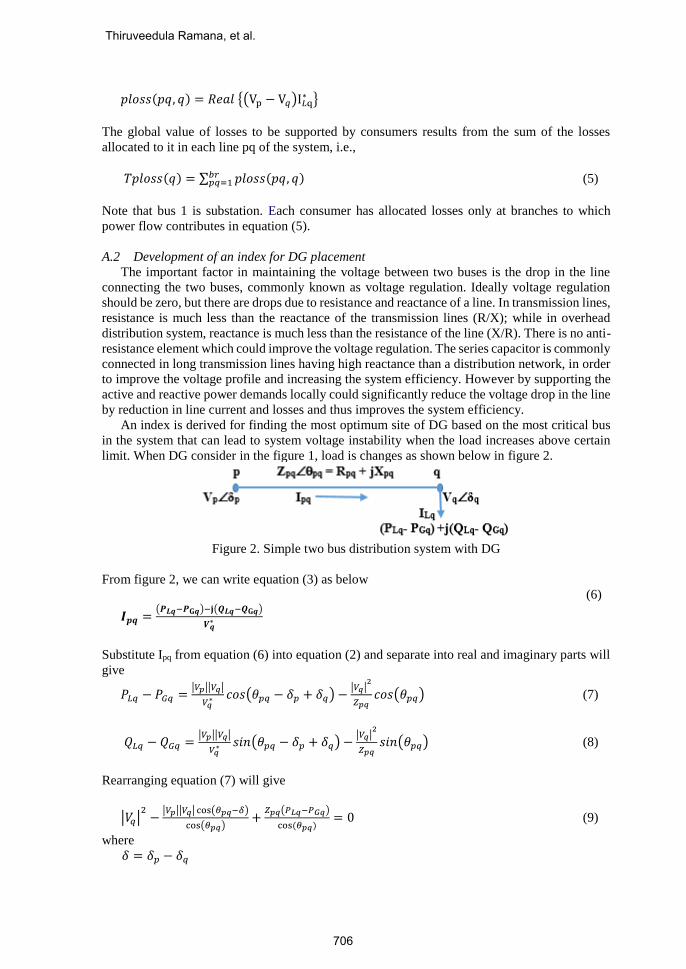
limit. When DG consider in the figure 1, load is changes as shown below in figure 2.
Figure 2. Simple two bus distribution system with DG
From figure 2, we can write equation (3) as below
(6)
𝑰𝒑𝒒 =(𝑷𝑳𝒒−𝑷𝐆𝒒)−𝐣(𝑸𝑳𝒒−𝑸𝐆𝒒)
𝑽𝒒∗
Substitute Ipq from equation (6) into equation (2) and separate into real and imaginary parts will
give
𝑃𝐿𝑞 − 𝑃𝐺𝑞 =|𝑉𝑝||𝑉𝑞|
𝑉𝑞∗ 𝑐𝑜𝑠(𝜃𝑝𝑞 − 𝛿𝑝 + 𝛿𝑞) −
|𝑉𝑞|2
𝑍𝑝𝑞𝑐𝑜𝑠(𝜃𝑝𝑞) (7)
𝑄𝐿𝑞 − 𝑄𝐺𝑞 =|𝑉𝑝||𝑉𝑞|
𝑉𝑞∗ 𝑠𝑖𝑛(𝜃𝑝𝑞 − 𝛿𝑝 + 𝛿𝑞) −
|𝑉𝑞|2
𝑍𝑝𝑞𝑠𝑖𝑛(𝜃𝑝𝑞) (8)
Rearranging equation (7) will give
|𝑉𝑞|2
−|𝑉𝑝||𝑉𝑞| cos(𝜃𝑝𝑞−𝛿)
cos(𝜃𝑝𝑞)+
𝑍𝑝𝑞(𝑃𝐿𝑞−𝑃𝐺𝑞)
cos (𝜃𝑝𝑞)= 0 (9)
where
𝛿 = 𝛿𝑝 − 𝛿𝑞
Thiruveedula Ramana, et al.
706

The equation (9) is a quadratic equation. For stable node voltages, equation (9) should have
real roots, i.e. discriminant B2 - 4AC > 0, which results in the proposed index referred as Power
Stability Index (PSI) given by equation (10)
𝑃𝑆𝐼 =4𝑅𝑝𝑞(𝑃𝐿𝑞−𝑃𝐺𝑞)
[|𝑉𝑝| cos(𝜃𝑝𝑞−𝛿)]2 ≤ 1 (10)
Under stable operation, this value should be less than unity; closer the value of PSI to zero,
more stable will be the system. The above index is used to find the optimum placement of DG.
The PSI value is calculated for each line in the given network and sorted from the highest to the
lowest value. For the p-q line having the highest value of PSI, the DG should be placed at q-bus.
For multi DG placement, the location of the second DG will be based on the effect of first DG
on PSI using equation (10). PSI value for each line will be re-calculated and sorted in the same
fashion from highest to lowest. The DG will be placed at the end of the line having the highest
value of PSI.
A.3 Objective function for DG size and constraint
In [27], the author used the following mathematical formulation which needs to be considered
in DG placement.
Minimize total active power losses
𝑀𝑖𝑛{∑ 𝑃𝑙𝑜𝑠𝑠𝑝𝑞𝑏𝑟𝑝𝑞=1 } (11)
Subject to the following generation and voltage constraints
0 ≤ 𝑃𝐺𝑞 ≤ ∑ 𝑃𝑙𝑜𝑎𝑑 (12)
|𝑉𝑞𝑚𝑖𝑛| ≤ |𝑉𝑞| ≤ |𝑉𝑞
𝑚𝑎𝑥| (13)
|𝑉𝑞| ≤ 1 ± 0.05 𝑝𝑢 q = 1, 2, ….., n (14)
where br is the no. of lines; n the no. of buses; PGq the distributed generation power at q bus; and
Pload is the total connected load.
The main constraints as defined in equations (12-14) are to restrain the voltages at each bus
along the radial system within the acceptable range and the total active power support should not
exceed the system load.
Once the optimum location of DG is identified, the amount of active power from DG changes
from 0% to 100% of the total active load, with generation and voltage constraint given in
equations (12–14). The main objective in selecting DG size is to minimize total system power
losses (Ploss) by injecting active power (PGq), given in equation (11). The relation between DG
size and losses follow the parabolic curve, first decreases and then start increases, thus the
accuracy of the DG size estimated will depend on the step size selected. In the present case, the
step size is maintained 1% of total load. However much smaller size could also be used, but the
computation will take much longer time.
Algorithm for loss allocation for customers before and after the DG placement and size for
Electrical Distribution System
For a radial distribution network, load flow analysis is carried out, calculate the loss
allocation to each customer using equation (5) and PSI value is computed for each line using
equation (10). For pq line having the highest value of PSI, the DG will be placed at qth bus. The
search algorithm is used for finding the optimum size of DG at optimum location based on a
Loss Allocation reduction to customers by optimal location and sizing
707

minimum total power loss, with constraints given in equations (12–14). After DG placement and
size, calculate the loss allocation to each customer using equation (5). The complete algorithm
steps summarized below for DG allocation and sizing is explained along with the loss allocation
to each customer.
Step 1. Read the bus data and line data for the electric distribution test system.
Step 2. Identify the loads for each branch and calculate the voltage of receiving buses, system
losses using the load flow solution using equations (2-4).
Step 3. Calculate the total active power loss and also calculate each customer loss allocation
from each branch using equation (5).
Step 4. Calculate PSI values for the each line of the distribution system using equation (10).
Find the maximum value of PSI line whose receiving bus is DG optimal placement.
Step 5. By setting small increment of PGq at bus q, run the load flow solution and check the
constraints of using equations (12-14).
Step 6. Store the system losses and voltages for present and previous DG size.
Step 7. Check losses and constrains, if decreased the step 5 should continue, otherwise consider
the previous solution and consider the previous DG size as optimal size of system
Step 8. Once optimal size of DG obtained, calculate the each customer loss allocation from each
branch using equation (5) after DG placement.
Step 9. Stop the process.
4. Numerical examples for electrical distribution systems
The proposed algorithm for DG placement and sizing is presented. For verification, the
proposed algorithm is applied on 12-bus and 69-bus radial distribution networks. A computer
program has been written in MATLAB 8.0 and run on AMD A10 PRO 2.10 GHz processor. The
load flow analysis is carried out with [17] in this method. As conventional load flows are not
suitable for radial distribution systems because they got diverges, due to high X/R ratio which
results in singularity of Jacobian matrix.
A. Basic information of the system
The 11 kV 12-bus [39] and 12.66kV 69-bus [40] radial distribution test systems are shown
in figures. 3 and 4 respectively. The total active and reactive loads are 435 kW and 405 kVAr
for 12-bus distribution system and 3791.80 kW and 2683.40 kVAr for 69-bus distribution
system.
Figure 3. Single line diagram of 12-bus radial distribution system
Figure 4. Single line diagram of 69-bus radial distribution system
Thiruveedula Ramana, et al.
708

B. Identifying the DG placement bus for test systems using PSI
The load flow analysis is carried out on 12-bus system and the PSI value is computed for
each line using equation (10) considering initially no DG. From Fig. 5, the PSI value for each
line, it could be observed that the 8th line connected bus 8 to bus 9 has the highest value than the
others. So the installation of DG at bus 9 will be the optimum place in 12-bus system. The same
approach is carried out for 69-bus test system with PSI values in figure 6, it could be observed
that the 60th line in 69-bus test system has the highest value. Hence, the optimum location of
DG is at bus 9 and bus 61 for 12-bus and 69-bus test systems respectively. All lines PSI values
are shown the figure 5 and figure 6 for 12-bus and 69-bus radial distribution system respectively.
Figure 5. PSI value for each line in 12-bus system
Figure 6. PSI value for each line in 69-bus system
Loss Allocation reduction to customers by optimal location and sizing
709

C. Optimal DG Size Calculation and Analysis of effectiveness
To determine the optimum size of DG, the proposed algorithm is applied on all test systems
and the results are tabulated in Table 1. The proposed algorithm is also compared with the GSS
Algorithm, implemented using VS&OP power tool [41]. The results are shown in Table 1, from
where it could be seen the close agreement of the propose method with the existing one. From
the Table 2, it is also observed that the base case minimum voltage and losses with respect to
proposed algorithm.
Table 1. Application of proposed algorithm on radial distribution networks
Bus
System
Proposed Algorithm Golden Section Search
Algorithm [41]
Max PSI
Value
Bus
No
Optimum
Size, MW
CPU
Time (s)
Bus
No
Optimum
Size, MW
CPU
Time (s)
12-Bus 0.0081 9 0.2349 0.302 9 0.23545 0.892
69-Bus 0.0192 61 1.8580 9.047 61 1.87270 26.681
Table 2. Comparison of base case to proposed algorithm on radial distribution networks
Bus
System
Base Case Proposed Algorithm
Minimum
Voltage
Active
Power
Loss, kW
Reactive
Power Loss,
kVAr
Minimum
Voltage
Active
Power
Loss, kW
Reactive
Power Loss,
kVAr
12-Bus 0.9434 20.71 8.04 0.9835 10.77 4.13
69-Bus 0.9098 224.61 101.98 0.9683 82.88 40.40
From Tables 1 and 2, it could be observed that:
• The proposed method results are in close agreement with GSS algorithm
• The computation time has been decreased considerably for two test systems (53.6%, and
58.45% respectively with the 12-bus and 69-bus).
• The minimum voltage is improved in 12-bus and 69-bus distribution systems and also
observed the system losses also reduced.
• There is 4.5% improvement in the voltage, active and reactive power losses are reduced
48.00% and 48.63% respectively in 12-bus radial distribution system after placement of DG
as compared with before DG placement.
• Similarly, there is 6.42% improvement in the voltage, active and reactive power losses are
reduced 63.10% and 60.38% respectively in 69-bus radial distribution system after placement
of DG as compared with before DG placement.
Figure 7. Effect of DG on system voltage profile of 12-bus system
(DG size = 0.2349 MW @ bus 9th)
Thiruveedula Ramana, et al.
710

Figure 8. Effect of DG on system voltage profile of 69-bus system
(DG size = 1.8580 MW @ bus 61st)
From Figures 7 and 8, this could be visualized where by the optimum placement of DG at 9th
bus and 61st have improved the overall voltage profile for 12-bus and 69-bus radial distribution
system.
D. Loss allocation to the customer before and after DG placement
Comparison of loss allocation to consumers before and after DG placement for 12-bus and
69-bus respectively, it can be concluded that the active power minimization objective considered
for distribution generation have greater influence on the loss allocated to each consumer. It can
be seen from figures 9 and 10, the losses allocated to most of the heavily loaded consumers after
DG placement considering only power loss reduction for consumers at all buses for 12-bus and
at bus nos. 51, 52, 53, 54, 55, 59, 61, 62, 64, 65, etc. for 69-bus system. Although, most of the
consumers are benefited due to loss allocation after DG placement but it appears that some of
the consumers may have to pay same after DG placement. For example, consumers at bus nos.
28, 29, 33, 36, 37, 40, 48 etc. have to pay same after DG placement and their tariff structure need
to be modified such that they need not pay same for this constant in loss allocation. It has been
observed that there is a negative losses are showing in the figure 9 which will be injected power
to the system and will help the customer to boost the voltage and reduce the losses and help the
system to work more efficient during the high loads.
Figure 9. Effect of DG on system on loss allocation to customer of 12-bus system
Loss Allocation reduction to customers by optimal location and sizing
711
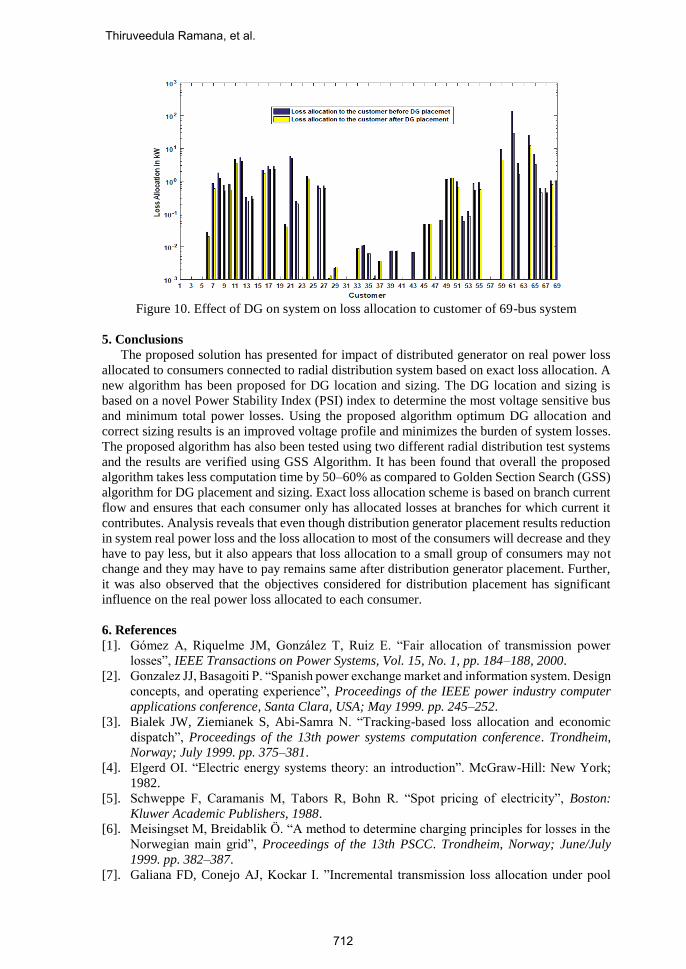
Figure 10. Effect of DG on system on loss allocation to customer of 69-bus system
5. Conclusions
The proposed solution has presented for impact of distributed generator on real power loss
allocated to consumers connected to radial distribution system based on exact loss allocation. A
new algorithm has been proposed for DG location and sizing. The DG location and sizing is
based on a novel Power Stability Index (PSI) index to determine the most voltage sensitive bus
and minimum total power losses. Using the proposed algorithm optimum DG allocation and
correct sizing results is an improved voltage profile and minimizes the burden of system losses.
The proposed algorithm has also been tested using two different radial distribution test systems
and the results are verified using GSS Algorithm. It has been found that overall the proposed
algorithm takes less computation time by 50–60% as compared to Golden Section Search (GSS)
algorithm for DG placement and sizing. Exact loss allocation scheme is based on branch current
flow and ensures that each consumer only has allocated losses at branches for which current it
contributes. Analysis reveals that even though distribution generator placement results reduction
in system real power loss and the loss allocation to most of the consumers will decrease and they
have to pay less, but it also appears that loss allocation to a small group of consumers may not
change and they may have to pay remains same after distribution generator placement. Further,
it was also observed that the objectives considered for distribution placement has significant
influence on the real power loss allocated to each consumer.
6. References
[1]. Gómez A, Riquelme JM, González T, Ruiz E. “Fair allocation of transmission power
losses”, IEEE Transactions on Power Systems, Vol. 15, No. 1, pp. 184–188, 2000.
[2]. Gonzalez JJ, Basagoiti P. “Spanish power exchange market and information system. Design
concepts, and operating experience”, Proceedings of the IEEE power industry computer
applications conference, Santa Clara, USA; May 1999. pp. 245–252.
[3]. Bialek JW, Ziemianek S, Abi-Samra N. “Tracking-based loss allocation and economic
dispatch”, Proceedings of the 13th power systems computation conference. Trondheim,
Norway; July 1999. pp. 375–381.
[4]. Elgerd OI. “Electric energy systems theory: an introduction”. McGraw-Hill: New York;
1982.
[5]. Schweppe F, Caramanis M, Tabors R, Bohn R. “Spot pricing of electricity”, Boston:
Kluwer Academic Publishers, 1988.
[6]. Meisingset M, Breidablik Ö. “A method to determine charging principles for losses in the
Norwegian main grid”, Proceedings of the 13th PSCC. Trondheim, Norway; June/July
1999. pp. 382–387.
[7]. Galiana FD, Conejo AJ, Kockar I. ”Incremental transmission loss allocation under pool
Thiruveedula Ramana, et al.
712

dispatch”, IEEE Transactions on Power Systems, Vol. 17, No.1, pp. 26–33, 2002.
[8]. Bialek JW. “Identification of source-ink connections in transmission networks”,
Proceedings of the 4th international IEE conference on power system control and
management. London, UK; April 16–18 1996. pp. 200–204.
[9]. Bialek JW. “Tracing the flow of electricity”, Proceeding of IEE Generation Transmission
Distribution, Vol. 143, No.4, pp. 313-320, 1996.
[10]. Kirschen D, Allan R, Strbac G. "Contributions of individual generators to loads and flows”,
IEEE Transactions on Power Systems, Vol. 12, No.1, pp. 52–60, 1997.
[11]. Bialek JW. “Topological generation and load distribution factors for supplement charge
allocation in transmission open access”, IEEE Transaction on Power Systems, Vol. 12, No.
3, pp. 1185–1193, 1997.
[12]. Strbac G, Kirschen D, Ahmed S. “Allocating transmission system usage on the basis of
traceable contributions of generators and loads to flows”, IEEE Transactions on Power
Systems, Vol. 13, No. 2, pp. 527–534, 1998.
[13]. Kirschen D, Strbac G. “Tracing active and reactive power between generators and loads
using real and imaginary currents”, IEEE Transactions on Power Systems, Vol. 14, No. 4,
pp.1312–1319, 1999.
[14]. Conejo AJ, Galiana FD, Ivana Kockar I. “Z-bus loss allocation”, IEEE Transactions on
Power Systems, Vol. 16, No. 1, pp. 105–110, 2001.
[15]. Conejo AJ, Arroyo JM, Alguacil N, Guijarro AL. “Transmission loss allocation: a
comparison of different practical algorithms”, IEEE Transactions on Power Systems, Vol.
17, No. 3, pp. 571–576, 2001.
[16]. Costa PM, Matos MA. “Loss allocation in distribution networks with embedded
generation”, IEEE Transactions on Power Systems, Vol. 19, No. 1, pp. 384–389, 2004.
[17]. Ramana1 T, Ganesh V, Sivanagaraju S. “Simple and fast load flow solution for electrical
power distribution systems”, International Journal Electrical Engineering and
Informatica, Vol. 5, No. 3, pp. 245–255, 2013.
[18]. Jenkins N, Ekanayake J, Strbac G. (2010) ‘Distributed generation’ – IET Factfiles,
http://www.theiet.org/factfiles/energy/distributed-generation.cfm [accessed 10.08.11].
[19]. Energy Networks Association (UK). (2010) <http://2010.energynetworks.org/distributed-
generation> [accessed 10.08.11].
[20]. Koeppel. G. “Distributed generation-literature review and outline of the Swiss station”,
Internal Report, ETH Zurich, 2003.
[21]. Hadjsaid N, Canard JF, Dumas F. “Dispersed generation impact on distribution networks’,
IEEE Transactions on Computer Applications in Power, Vol. 12, No. 2, pp. 22–28, 1999.
[22]. Tuitemwong K, Premrudeepreechacharn S. “Expert system for protection coordination of
distribution system with distributed generators”, International Journal of Electrical Power
& Energy Systems, Vol. 33, No. 3, pp. 466–471,2011.
[23]. Griffin T, Tomosovic K, Secrest D, Law A. “Placement of dispersed generations systems
for reduced losses”, Proceedings of the 33rd International conference on sciences. Hawaii,
pp. 1-9, 2000.
[24]. Aman MM, Jasmon GB, Bakar AHA, Mokhlis H. “A new approach for optimum DG
placement and sizing based on voltage stability maximization and minimization of power
losses”, Energy Conversion and Management, Vol. 70, pp. 202–210, 2013.
[25]. Raja P, Selvan MP, Kumaresan N. “Enhancement of voltage stability margin in radial
distribution system with squirrel cage induction generator based distributed generators”,
IET Generation Transmission and Distribution, Vol. 7, No. 8, pp. 898–906, 2013.
[26]. Liu K, Sheng W, Hu L, Liu Y, Meng X, Jia D. “Simplified probabilistic voltage stability
evaluation considering variable renewable distributed generation in distribution systems”,
IET Generation Transmission and Distribution, Vol. 9, No. 12, pp. 1464-1473, 2015.
[27]. Almeida AB, Lorenci EVD, Leme RC, Souza1 AC Zambronid D, Lopes BIL, Lo K.
“Probabilistic voltage stability assessment considering renewable sources with the help of
the PV and QV Curves”, IET Renewable Power Generation, Vol. 7, No. 5, pp. 521-530,
Loss Allocation reduction to customers by optimal location and sizing
713

2013.
[28]. Akher MA. “Voltage stability analysis of unbalanced distribution systems using
backward/forward sweep load-flow analysis method with secant predictor”, IET
Generation Transmission and Distribution, Vol. 7, No. 3, pp. 209-317, 2013.
[29]. Gubina F, Strmcnik B. A “simple approach to voltage stability assessment in radial
networks”, IEEE Transactions on Power System, Vol. 12, No. 3, pp. 1121-1128, 1997.
[30]. Chakravorty M, Das D. “Voltage stability analysis of radial distribution networks”,
International Journal on Electrical Power and Energy System, Vol. 23, pp. 129-135, 2001.
[31]. Yu J, Li W, Ajjarapu V, Yan W, Zhao X. “Identification and location of long-term voltage
instability based on branch equivalent”, IET Generation Transmission and Distribution,
Vol. 8, No. 1, pp. 46-54, 2014.
[32]. Moghavvemi M, Faruque MO. “Technique for assessment of voltage stability in ill-
conditioned radial distribution network”, IEEE Power Engineering Review, Vol. 21, No. 1
pp. 58-60, 2001.
[33]. Yu J, Li W, Yan W. “A new line loadability index for radial distribution systems”,
Electrical Power Components and Systems, Vol. 36. No. 11, pp. 1245-1252, 2008.
[34]. Mahmoud GA. “Voltage stability analysis of radial distribution networks using catastrophe
theory”, IET Generation Transmission and Distribution, Vol. 6, No. 7, pp. 612-618, 2012.
[35]. Caisheng W, Nehrir MH. “Analytical approaches for optimal placement of distributed
generation sources in power systems”, IEEE Transactions on Power Systems, Vol. 19, No.
4, pp. 2068–2076, 2004.
[36]. Acharya N, Mahat P, Mithulananthan N. “An analytical approach for DG allocation in
primary distribution network”, International Journal of Electrical Power & Energy
Systems, Vol. 28, No. 10, pp. 669–678, 2006.
[37]. Hedayati H, Nabaviniaki SA, Akbarimajd A. “A method for placement of DG units in
distribution networks”, IEEE Transactions on Power Delivery, Vol. 23, No. 3, pp. 1620–
1628, 2008.
[38]. Lalitha MP, Reddy VCV, Usha V. “Optimal DG placement for minimum real power loss
in radial distribution systems using PSO”, Journal of Theoretical and Applied Information
Technology, Vol. 13, No. 2, pp. 107–116, 2010.
[39]. Das D, Nagi HS, Kothari DP. “Novel method for solving radial distribution networks”, IEE
Proceeding on Generation, Transmission and Distribution, Vol. 141, No. 4, pp. 291–298,
1994.
[40]. Baran ME, Wu FF. “Optimum sizing of capacitor placed on radial distribution systems”,
IEEE Transactions on Power Delivery, Vol.4, No. 1, pp. 735–743, 1989.
[41]. Gözel T, Eminoglu U, Hocaoglu MH. “A tool for voltage stability and optimization
(VS&OP) in radial distribution systems using matlab graphical user interface (GUI)”,
Simulation Modelling Practice and Theory, Vol. 16, No. 5, pp. 505–518, 2008.
Thiruveedula Ramana was born in Proddatur, Andhra Pradesh on July 04,
1978. He received the B.Tech. degree in electrical and electronics engineering
from the JNT University, Hyderabad and the M.Tech degree in power and
industrial drives from JNT University, Kakinada. He is currently pursuing the
Ph.D. degree at the JNT University, Anantapur, Andhra Pradesh, India.
Currently, he is working as Business Analyst in EIT Services India Private
Limited, DXC Technologies, Bangalore, Karnataka. He was an Assistant
Professor with the Vignan's Engineering College, Vadlamudi, Andhra
Pradesh, India. His research interests are Distribution System Planning, Power Quality,
Reliability, Distributed Generation and Flexible AC Transmission Systems (FACTS). He has
published more than 30 research papers in refereed journals and conferences proceedings.
Mr. Ramana is Associate Member of Institute of Engineers (India), Life member of Indian
Society for Technical Education.
Thiruveedula Ramana, et al.
714

Valasula Ganesh was born in Jammalamadugu, Andhra Pradesh on June 15,
1974. He received the B.Tech. degree in electrical and electronics engineering
from the JNT University, Hyderabad in 1998 and the M.Tech degree in power
system operation and control from SV University, Tirupati and the Ph.D.
degree in electrical engineering from JNT University, Anantapur in 2010.
Currently, he is Professor in Department of Electrical and Electronics
Engineering, JNTUCE, Pulivendula, Kadapa, Andhra Pradesh. His research
interests are Distribution System Planning, Power Quality, Reliability,
Distributed Generation, Flexible AC Transmission Systems (FACTS) and Smart Grid. He has
published more than 15 research papers in refereed journals and conferences proceedings.
Mr. Ganesh is Life membership of System Society of India, Life membership of Indian Society
for Technical Education.
Sirigiri Sivanagaraju was born in Kadapa, Andhra Pradesh on July 01, 1970.
He received the B.Tech. degree in electrical and electronics engineering from
the Andhra University, Visakhapatnam in 1998, the M.Tech degree in Power
Systems from IIT, Kharagpur in 2010 and the Ph.D. degree in Electrical
Power System from JNT University, Hyderabad in 2004.
Currently, he is Professor in Department of Electrical and Electronics
Engineering in JNT University College of Engineering, Kakinada, Andhra
Pradesh. He was an Associate Professor with the JNT University College of
Engineering, Anantapur, Andhra Pradesh, India. His research interests are Distribution System
Planning, Power Quality, Distributed Generation and Flexible AC Transmission Systems
(FACTS). He has published more than 100 research papers in refereed journals and conferences
proceedings. He received two national awards (Pandit Madan Mohan Malaviya memorial prize
and Best paper prize award). He is author for various text books in the discipline of Electrical
and Electronics Engineering. He is also the Memberships in IEEE and IE (India)
Loss Allocation reduction to customers by optimal location and sizing
715