delay-constrainted optimal traffic allocation in
TRANSCRIPT
Delay-Constrainted Optimal Traffic Allocation in
Heterogeneous Wireless Networks for Smart Grid
Siya Xu1, Ningzhe Xing
2, 3, Shaoyong Guo
1, and Luoming Meng
1
1 State Key Laboratory of Networking and Switching Technology, Beijing University of Posts and Telecommunications,
100876, Beijing, China 2 School of Electronic and Information Engineering, Beijing Jiaotong University, 100044, Beijing, China
3State Grid Jibei Electric Power Company Limited Information & Communication Dispatch, 100053, Beijing, China
Email: [email protected]; [email protected]; {syguo, lmmeng}@bupt.edu.cn
Abstract—In the smart distribution gird, various
communication technologies are adopted to form a seamless
heterogeneous communication network to deliver control and
protection signals. However, most scheduling strategies
designed for smart gird aim at optimizing system operation
performance without considering the transmission cost. To
address this problem, we construct a delay-constrainted cost
optimization model to accomplish the following two goals: to
optimize the cost and to satisfy QoS requirements. Firstly, we
establish a queuing model according to the characteristics of
heterogeneous services and output networks for smart grid.
Then, a delay-constrainted optimal traffic allocation strategy is
designed to dynamically allocate heterogeneous service data to
different output networks. The allocation strategy herein is
based on the Lyapunov theory. Finally, simulation results show
that our proposed allocation strategy significantly reduces the
cost and meets transmission delay constraints for all service
traffic. Index Terms—Smart distribution grid, cost, traffic allocation
strategy, queuing model, Lyapunov theory, transmission delay
I. INTRODUCTION
Smart grid is recognized as a promising technology
that will improve efficiency, reliability, and stability of
the power grid by managing and controlling grid
2] in
smart grid communication network have more
heterogeneous characteristics compared with the general
communications network s, and have greater difference in
QoS requirements. For instance, smart grid control and
protection applications have more demanding
requirements for delay and reliability (e.g., distributed
feeder automation applications require low-latency and
high-data-rate communications among substations and
intelligent electronic devices in order to timely detect and
isolate faults). On the other hand, smart metering
applications require latency-tolerant information
exchange between the meters and utility management
center [3]. Since heterogeneous service traffic has diverse
requirements of QoS, there is no single technology that
can solve all the needs by itself [4]. A variety of
Manuscript received May 20, 2015; revised September 22, 2015.
This work is supported by the National Science and Technology Support Program of China (2015BAG10B01).
doi:10.12720/jcm.10.10.821-827
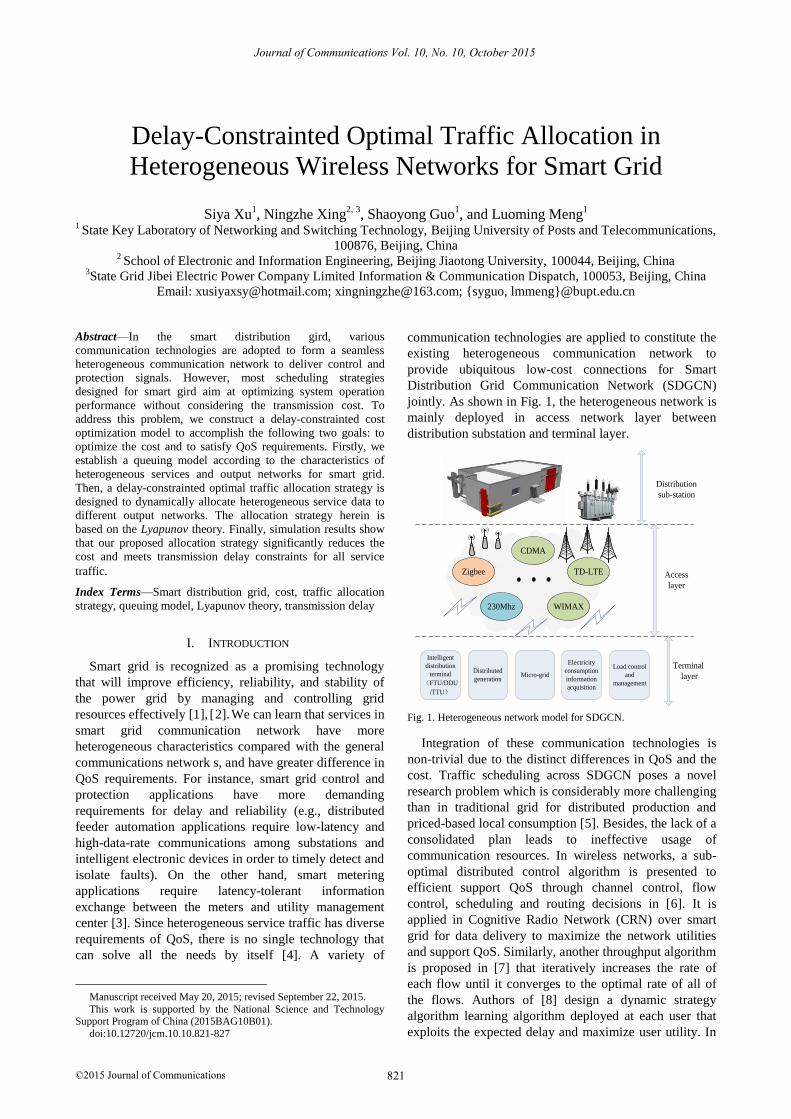
communication technologies are applied to constitute the
existing heterogeneous communication network to
provide ubiquitous low-cost connections for Smart
Distribution Grid Communication Network (SDGCN)
jointly. As shown in Fig. 1, the heterogeneous network is
mainly deployed in access network layer between
distribution substation and terminal layer.
Zigbee
CDMA
TD-LTE
230Mhz WIMAX
Intelligent
distribution
terminal
(FTU/DDU
/TTU)
Distributed
generationMicro-grid
Electricity
consumption
information
acquisition
Load control
and
management
Distribution
sub-station
Access
layer
Terminal
layer
Fig. 1. Heterogeneous network model for SDGCN.
Integration of these communication technologies is
non-trivial due to the distinct differences in QoS and the
cost. Traffic scheduling across SDGCN poses a novel
research problem which is considerably more challenging
than in traditional grid for distributed production and
priced-based local consumption [5]. Besides, the lack of a
consolidated plan leads to ineffective usage of
communication resources. In wireless networks, a sub-
optimal distributed control algorithm is presented to
efficient support QoS through channel control, flow
control, scheduling and routing decisions in [6]. It is
applied in Cognitive Radio Network (CRN) over smart
grid for data delivery to maximize the network utilities
and support QoS. Similarly, another throughput algorithm
is proposed in [7] that iteratively increases the rate of
each flow until it converges to the optimal rate of all of
the flows. Authors of [8] design a dynamic strategy
algorithm learning algorithm deployed at each user that
exploits the expected delay and maximize user utility. In
821
Journal of Communications Vol. 10, No. 10, October 2015
©2015 Journal of Communications
. We can learn that services resources effectively [1], [
heterogeneous network environment, an optimal control
for general networks with both wireless and wired
components and time varying channels is developed in
[9]. It is decoupled into separate algorithms for flow
control, routing, and resource allocation to make
optimally fair decisions about which data to serve when
inputs exceed network capacity.
Due to the late recognition of economic cost and
extremely strict QoS constrains (e.g. delay tolerance),
there exists no proper solution that provide a cost-optimal
yet QoS-constrained allocation mechanism for divers set
of applications in SDGCN. With growing need and cost
in communication network for SG, the transmission costs
under QoS constrains can not be ignored anymore.
To solve the cost optimization problem, we adopt
Lyapunov theories and propose a delay-constrainted
allocation strategy tailored to unique characteristics of
SDGCN. By making output network access control, it
minimizes cost and meets the QoS requirements of smart
grid applications. Technically, using Lyapunov drift-plus-
penalty analysis, we show that the strategy realizes cost
optimization with a corresponding tradeoff in average
queue backlog.
The reminder of this paper is organized as follows.
Firstly, the network model along with detailed system
model is constructed in Section II. Then, Section III
defines system delay as a performance metric and designs
a lyapunov-based cost optimization allocation strategy for
our system. Next, Section IV describes simulation
environments and illustrates performance evaluation
results. Finally, Section V draws conclusions.
II. NETWORK MODEL
Consider the system with three parts: input queue set,
output queue set and time-varying fading channels
between these two queue sets. Input queues are used to
store input traffic data. Assume that heterogeneous
service traffic flows are properly differentiated into M
classes and be allocated priorities for classification. Each
traffic priority corresponds to a dedicated input queue,
which means that input queue i only admit arrival of
traffic flow with priority i. So, the number of input
queues is M. The N output networks represent different
choices for delivery under different communication
technologies including LTE, WCDMA, WIMAX, Zigbee
and ect.. In each time slot t, new data randomly arrives to
input queues and waits to be transmitted from input
queues to output queues, and then be delivered into
output networks. The network controller adopts allocation
strategies to decide which packet to be served, which
output network to be connected and how many packets to
be transmitted at each scheduling time.
A. Input Queues
Assumed all queue buffers are described in time slots,
and the fixed duration of time slot is equal to s. To this
end, our system can be regarded as a discrete-time system,
in slotted time 0,1,2,t . Traffic flows with similar
QoS requirements inject into the same input queue. When
a network controller makes allocation decisions, it cares
the service priority rather than the actual size of a packet.
Let iA t , 1,2,i N be the packet set of class i
arrives in time slot t, and iA t be the packet number. If
i,xS is the actual size of packet x in units, then the average
packet size of class i is ,=i,x i xS E S units. The arrivals
of the class i on slot t is i ia t = Si
A t . So the time
average arrival rate i of class i can be computed as:
1
0
1lim sup ,for 1,2,
T
i iT
t
S i MT
iA t (1)
iQ t is the backlog in input queue i at the beginning
of time slot t, that is, the amount of data need to be
transmitted. 1 2 Mt = Q t ,Q t , Q tQ is the vector
of backlogs in all input queues over integer time slot
0,1,2t .
The allocation strategies represented by
1,1 1,2 ,, , M Nt U t U t U t U are subjected by the
current channel capacity. Then, we have:
min , CAP
ij i ijU t Q t C t (2)
In time slot t, network controller selects ijU t units
of data to be removed from input queue i to output queue
j.
Future states of input queue i are driven by stochastic
arrival and allocation process according to the following
dynamic equation:
1 ,for 0,1,2i i i iQ t Q t a t u t t (3)
where ia t is traffic arrival rate in input queue i over
slot t and iu t is the total transmission rate for all
output networks, that is
1
N
i ij
j
u t U t
(4)
B. Output Queues
The hybrid access network consists of N individual
output networks. Let jP t represents the backlog of
output network queue j on slot t, and
1 2, , Nt P t P t Q t P be vector of the current
backlogs in all output network queues for 0,1,2t .
ju t is the quantity of data injecting into output
network queue j. Therefore, we have:
1
M
j ij
i
u t U t
(5)
822
Journal of Communications Vol. 10, No. 10, October 2015
©2015 Journal of Communications
So, the update rule for output network queue j can be
described as:
1 max ,0j j j j
j j j
P t P t b t u t
P t u t b t
(6)
where jb t is the service rate of output network j over
timeslot t and min ,j j jb t b t P t is the actual
service rate due to lack of packets storing in output
queues.
III. OPTIMIZATION MODEL AND TRAFFIC ALLOCATION
STRATEGY
A. System Delay
The system delay, denoted by D, consists of three
parts. They are input queuing delay, output queuing delay,
and delivery delay in the output network. Input queuing
delay Din represents the waiting time of a packet before
transmitting to output queues. By Little’s law, the
average waiting time in input queue i expressed in time
slots is
1
0
1lim sup
Tin
i iT
ti
D E Q tT
(7)
Output queuing delay Dout is the waiting time in output
queues before being served. Once a packet injects into
output network j, Dout is determined by the total
transmission rate ju t and service rate jb t . The
average assignment ratio ijT t between input queue i
and output queue j is
1
0
lim supT
ij
ijT
t i
U tT t E
a t
(8)
where ijU t is the data transmission quantity from input
queue i to output queue j; ia t is the amount of traffic
arrives in input queue i.
For jP t is the backlog of output queue j at time t,
the waiting time out
jD before being served is
jout
j
j
P tD
b t (9)
From (1), (9), (10), the time average waiting time in
output queues can be described as
1
0 1
1lim sup
T Nij jout
iT
t ji j
U t P tD E
T b t
(10)
Once transferred to an output network, the output
network is in charge of forwarding the packet to its final
destination. Transmitting through different output
networks will result in different delivery delays. For
instance, the delivery delay in Zigbee is less than in LTE.
Assumed that delivery delay in output network j is dj, we
can calculate the mean delivery delay among all output
networks by
1
0 1
1lim sup
T Ntr
i j ijT
t ji
D d E U tT
(11)
The overall system delay D is the sum of all delays
both in input queues and output queues, as well as in
output networks. Hence
in out tr
i i i iD D D D (12)
From the expressions, we can find that the mean output
queuing delay out
iD and the mean delivery delay tr
iD are
all functions of allocation strategies tU .
B. Lyapunov-Based Optimization Problem Model
As discussed in previous sections, the performance of
our system is determined by allocation policies. Unlike
most prior works that only care about operation
performance of throughput, system utilization, as well as
data blocking and dropping [10-11], the strategy
presented herein especially focus on cost. For this
purpose, we design a delay-constrainted optimal traffic
allocation strategy (DOTAS) to pursuit a higher
economic efficiency while meeting delay requirements.
To optimize the cost, we formulate allocation
strategies by applying Lyapunov theories to our queuing
system [12]. For y t is cost function, we can obtain the
average cost by computing
1
0
1limsup
t
tY y
t
(13)
The optimization problem can be formulated as
Min: Y (14)
Subject to
lim , 1,2,i iD d i M (15)
All iQ t and jP t queues are mean rate stable (16)
To solve problems given in (14), we transform all
inequality and equality constraints into queue stability
problems. Define virtual queues ( )iH t to monitor, in
each traffic priority class, the amount of past observed
delay violating delay constraints. Assumed that (0)iH is
non-negative and finite and ( )iH t is finite for
{1,2, }i M , the update equations of ( )iH t are
computed according to
*
, ,1 max ,0i i i x i j
x
H t H t W d
ijA t
(16)
where ( )tij
A is the packet set of class i removed from
input queue i to output queue j. Define
* lim
,i j i jd d d x t ij
A as the total queuing delay
823
Journal of Communications Vol. 10, No. 10, October 2015
©2015 Journal of Communications
bound for packets with priority i before being served by output network server.
C. Delay-Constrainted Optimal Traffic Allocation
Strategy (DOTAS)
We design a Delay-Constrainted Optimal Traffic
Allocation Strategy (DOTAS) to optimize cost while
satisfying delay constraints by making scheduling
decisions. It can be decomposed into 7 steps:
Step 1: At the beginning of each time slot t, traffic
data is classified into M classes and be sent into input
queue buffers according to priorities.
Step 2: Network controller checks the system to find
out if there are packets need to be sent by input queue
priority order and observe input queues to get the
current backlog iQ t .
Step 3: Check the system to obtain the current
capacity CAP
ijC t of transmission channels.
Step 4: Check all output queues to obtain the current
backlog jP t .
Step 5: By taking output network access control,
ijU t units of data selected to be transferred
to output queue j based on delay and cost constrains,
where ijU t is the solution to minimize Y and be
subjected to lim
i iD d .
Step 6: The server of output network j services
packets at service rate min ,j j jb t b t P t ,
which is influenced by allocation strategy ijU t .
Step 7: At the boundary of every scheduling process,
all queues update according to system dynamic
evolution models.
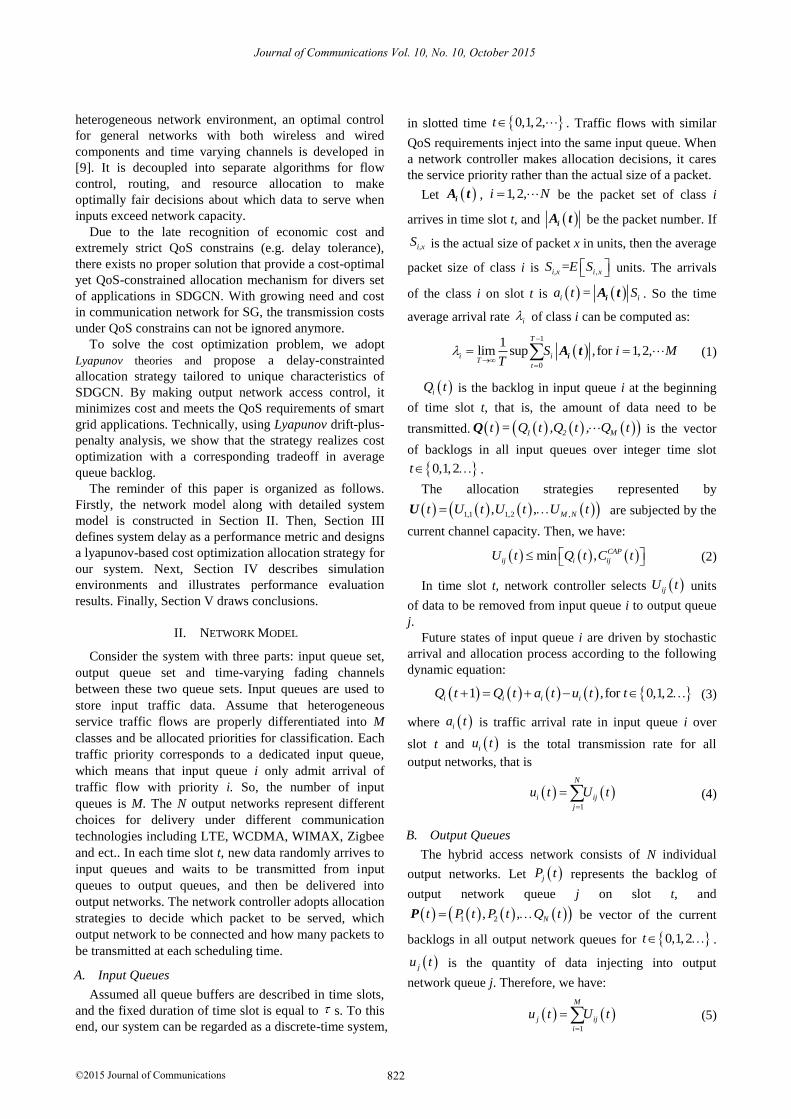
The flow-chart depicted in Fig. 2 shows the working
process of DOTAS proposed in this paper.
D. Lyapunov Drift-Plus-Plenty Analysis
Let , ,t t t t Q P HΘ be a concatenated
vector of all actual and virtual queues, and define the
Lyapunov function:
2 2 2
1 1 1
1
2
M N M
i j i
i j i
L t Q t P t H t
(17)
where weighting coefficients , and are assigned
to intensify and balance each of constraints.
Define t as the conditional Lyapunov drift in
slot t:
1t E L t L t t (18)
where the expectation relys on control policies tU . It
is with respect to channel states and the control actions
made in response to these channel states. Instead of
taking a control action by formulating allocation
strategies to minimize a bound on t , we
minimize a bound on the following drift-plus-penalty
expectation:
t VE y t (19)
where E y t is the average cost in our system
over time slot t, and 0V is a control parameter chosen
to represent how much we emphasize the cost
minimization and to tradeoff between the costs and QoS
constrains.
We need to develop strategies tU to achieve the
minimum bound of Lyapunov drift-plus-penalty greedly,
while keeping system stable. Let*y be the optimal, and
assume 0E L , we have
* 1/Y y O V (20)
As (20) shows, any feasible allocation strategies can
help us to get a value 1/O V away from the optimal
cost *y . We can approach the optimal value
*y by
amplifying V, which may cause the enlargement of queue
backlog in return.
Check input
queue i
( )iQ t
Check transmission
channel to obtain
channel capacity
Select Uij(t) data to be
transferred to output
queue j
( )CAP
ijC t
Be serviced in output
queues at
service rate bj(t)
Start
End
For i=1:M
Network
controller
determines
allocation
strategy
Uij(t)
( )ijU t
Influences
service rate
Check all output
queues
( )P t
Update all queues by
evolution models
Fig. 2. Flow-chart of DOTAS
IV.
In this section, we present the performance results of
the proposed allocation strategy simulated using
MATLAB. We run each simulation scenario 100 times
and acquire an average value of for comparison. In our
824
Journal of Communications Vol. 10, No. 10, October 2015
©2015 Journal of Communications
IMULATIONSS
experiments, we define a heterogeneous network model
with three kinds of input traffic and three different output
networks.
A. Network Setting
The priorities of input queues are set according to
service data storing in their buffers. The communication
is characterized by the fact that most of interactions must
take place in real time with hard time bound, while others
are insensitive to latency. To cope with the diverse delay
requirements [3], we set three input queues described in
Table I.
TABLE I: S
Input queue
Applications Packet
size
(unit)
Priority Arrival rate
(packet/slot)
Delay Constraint
(slot)
1 Tele-protection 5 1 40/30/20 High
2
Automated
demand response
3 2 30/20/10 Medium
3 Smart metering 5 3 4/3/2 Low
In order to model the heterogeneous access networks,
we consider three possible deployment options for
SDGCN which are public access networks, private access
networks, and hybrid access networks. Private network
and public network each have advantages and
disadvantages in many aspects such as cost, safety,
available transmission ability, etc. [13]-[15]. So, the third
option turns out to be the best by taking advantages of
both public and private networks. At present, wireless
technologies are applied between distribution stations and
distribution terminals [16]. We choose three typical kinds
of access networks to form our hybrid output networks,
which are listed in table II. In fact, low-cost will always
be along with low service rates. In other words, packets
routed through output network 3 incur a larger buffer
latency, while those assigned to output network 1 and 2
incur larger costs.
TABLE II: SYSTEM PARAMETERS FOR OUTPUT NETWORKS
Output network
Mode Networking Technology
Delivery
Delay
(slot)
Transmission
rate
(bps)
Cost
(dollar
/slot)
1 Public LTE High 10M 4
2 Private CDMA Medium 1M 2
3 Micro-
power Zigbee Low 250k 1
B. Results Analysis
We design a series of simulations at alternative traffic
arrival rates and under specific delay constraints to assess
the performance of the DOTAS with packet-level
simulations. Tthree typical scenarios are considered
which represent low-load condition, medium-load
condition and high-load condition respectively.
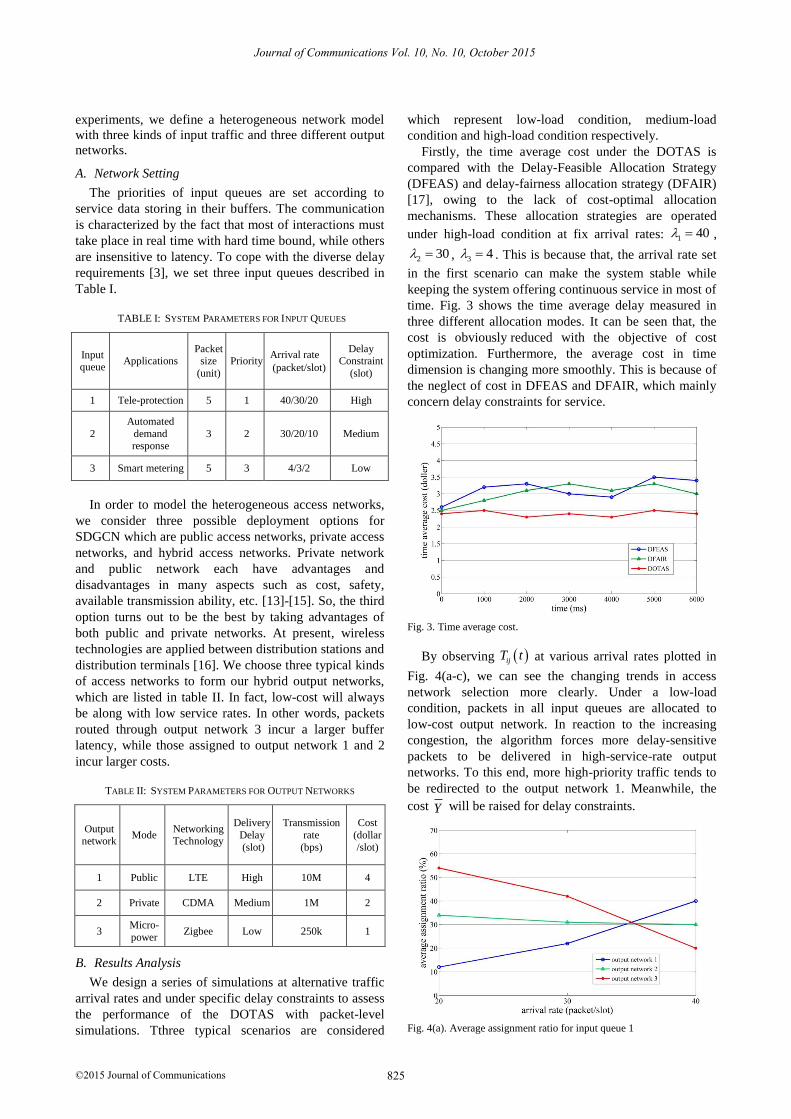
Firstly, the time average cost under the DOTAS is
compared with the Delay-Feasible Allocation Strategy
(DFEAS) and delay-fairness allocation strategy (DFAIR)
[17], owing to the lack of cost-optimal allocation
mechanisms. These allocation strategies are operated
under high-load condition at fix arrival rates: 1 40 ,
2 30 , 3 4 . This is because that, the arrival rate set
in the first scenario can make the system stable while
keeping the system offering continuous service in most of
time. Fig. 3 shows the time average delay measured in
three different allocation modes. It can be seen that, the
cost is obviously reduced with the objective of cost
optimization. Furthermore, the average cost in time
dimension is changing more smoothly. This is because of
the neglect of cost in DFEAS and DFAIR, which mainly
concern delay constraints for service.
Fig. 3. Time average cost.
By observing ijT t at various arrival rates plotted in
Fig. 4(a-c), we can see the changing trends in access
network selection more clearly. Under a low-load
condition, packets in all input queues are allocated to
low-cost output network. In reaction to the increasing
congestion, the algorithm forces more delay-sensitive
packets to be delivered in high-service-rate output
networks. To this end, more high-priority traffic tends to
be redirected to the output network 1. Meanwhile, the
cost Y will be raised for delay constraints.
Fig. 4(a). Average assignment ratio for input queue 1
825
Journal of Communications Vol. 10, No. 10, October 2015
©2015 Journal of Communications
YSTEM ARAMETERS FOR NPUT UEUESP I Q

Fig. 4(b). Average assignment ratio for input queue 2
Fig. 4(c). Average assignment ratio for input queue 3
On the other hand, Fig. 4(a-c) reveal that the low-
service-rate and low-cost output network is critical to
guarantee QoS and optimize transmission cost. It can be
explained that most of service traffic without strict delay
requirements tends to be assigned to this output network
for cost saving.
V.
To address the cost-saving problem, we establish a
queuing based network system to model the
characteristics of smart grid communication networks. A
Delay-Constrainted Optimal Traffic Allocation Strategy
(DOTAS) is formulated as an on-line solution to realize
efficient and economic communication. In our system,
smart grid terminals can choose the most appropriate
output networks for heterogeneous traffic according to
the current real-time performance of access networks and
the actual needs of smart grid applications themselves.
Performance results reveal that the cost is reduced by
taking the proposed DOTAS. Moreover, the delay
constraints are satisfied in all service priority classes,
which means that DOTAS can balance the cost and
operation performance well.
ACKNOWLEDGMENT
This work is supported by the National Key
Technology R&D Program (2015BAG10B01) and the
State Grid Technology Project of China
(SGIT0000KJJS1500008).
REFERENCES
[1] R. Yu, et al., “Hybrid spectrum access in cognitive-radio-based
smart-grid communications systems,” IEEE Syst. J, vol. 8, no. 2,
pp. 577-587, 2013.
[2] O. Al-Khatib, W. Hardjawana, and B. Vucetic, “Traffic modeling
and optimization in public and private wireless access networks
for smart grids,” IEEE Trans. Smart Grid, 2014, vol. 5, no. 4, pp.
1949-1960.
[3] G. A. Shah, V. C. Gungor, and O. B. Akan, “A cross-layer design
for QoS support in cognitive radio sensor networks for smart grid
applications,” in Proc. IEEE ICC, Ottawa, Canada, 2012.
[4] Y. Yan, Y. Qian, H. Sharif, and D. Tipper, “A survey on smart
grid communication infrastructures: motivations, requirements and
challenges,” IEEE Commun. Surv. Tut., vol. 15, no. 1, pp. 5-20,
2012.
[5] G. Heydt, “The next generation of power distribution systems,”
IEEE Trans. Smart Grid, vol. 1, no. 3, pp. 225-235, Dec. 2010.
[6] G. A. Shah, V. C. Gungor, and O. B. Akan, “A cross-layer qos-
aware communication framework in cognitive radio sensor
networks for smart grid applications,” IEEE Trans. Ind. Informat.,
vol. 9, no. 3, pp. 1477-1485, 2013.
[7] Y. Shi, et al., “A distributed optimization algorithm for multi-hop
cognitive radio networks,” in Proc. IEEE INFOCOM, 2008, pp.
1292-1300.
[8] S. Hsien-Po and M. V. D. Schaar, “Queuing-based dynamic
channel selection for heterogeneous multimedia applications over
cognitive radio networks,” IEEE Trans. Multimedia, vol. 10, no. 5,
pp. 896-909, 2008.
[9] M. Neely, E. Modiano, and C. Li, “Fairness and optimal stochastic
control for heterogeneous networks,” IEEE/ACM Trans. Netw.,
vol. 16, no. 2, pp. 396-409, 2008.
[10] L. Georgiadis, M. J. Neely, and L. Tassiulas, “Resource allocation
and cross-layer control in wireless networks,” Foundations and
Trends in Networking, vol. 1, no. 1, pp. 1-144, 2006.
[11] H. Li, W. Huang, C. Wu, Z. Li, and F. C. M. Lau, “Utility-
maximizing data dissemination in socially selfish cognitive radio
networks,” in Proc. IEEE MASS, 2011, pp. 212-221.
[13] J. D. McDonald, “The role of communications in smart grid,”
White Paper, Radio Resource Mission-Critical Communications,
Apr. 2013.
[14] V. C. Gungor, et al., “Smart grid technologies: Communication
technologies and standards,” IEEE Trans. Ind. Informat., vol. 7,
no. 4, pp. 529-539, 2011.
[17] L. Chih-Ping and M. J. Neely, “Delay and rate-optimal control in a
multi-class priority queue with adjustable service rates,” in Proc.
INFOCOM, 2012, pp. 2976-2980.
Siya Xu (M’15), received the B.E. degree
from University Of Science and Technology
Beijing, China, in 2010.
She is currently working towards the Ph.D.
degree in Beijing University of Posts and
Telecommunication. Her research interests
include communication network management
and QoS for Smart Grid Communication
Networks.
826
Journal of Communications Vol. 10, No. 10, October 2015
©2015 Journal of Communications
ONCLUSIONSC
[12] M. J. Neely, “Stochastic network optimization with application to
communication and queueing systems,” M & Claypool, pp. 15-80,
2010.
[15] T. Sauter and M. Lobashov, “End-to-End Communication
Architecture for Smart Grids,” IEEE Trans. Ind. Electron., vol. 58,
no. 4, pp. 1218-1228, 2011.
[16] K. C. Budka, et al., “Communication network architecture and
design principles for smart grids,” Bell Labs Technical Journal,
vol. 15, no. 2, pp. 205-227, 2010.
Ningzhe Xing was born in Hebei, China in
1978. He is a Ph. d student in Beijing Jiaotong
University.
He is working for the IT section in State Grid
Corporation of China. His research interests
include Smart Grid communication Network,
IT and information Security.
ShaoYong Guo (M’15), received the Ph.D.
degree from Beijing University of Posts and
Telecommunication in 2013 and B.E. degree
from HeBei University in 2008 respectively.
He is currently a post-doctoral in Beijing
Jiaotong University. His research interests
include device management, Internet of
Things, Ubiquitous Network and Smart Grids.
Luoming Meng, received the M.S. degree
from Tsinghua University, Beijing, China, in
1987.
He is currently a professor and Ph.D.
supervisor. He is the director of
Communications Software Technical
Committee of China Institute of
Communications and the chairman of the
National Network Management Standards
Study Group. He has published about 20 SCI index papers. He has been
responsible for several key research projects including the projects
supported by National Natural Science Foundation and National High-
Tech Research and Development Program of China. Professor Meng is
the project chief scientist of China 973 Program, the winner of Yangtse
River Scholar, and the Outstanding Youth Science Fund Receiver.
827
Journal of Communications Vol. 10, No. 10, October 2015
©2015 Journal of Communications