losed -e&s ny avenue nd oteers pportuni · tekla healthcare opportunitiesfund..... 164,759...
TRANSCRIPT

COHEN&STEERS
CLOSED-E
NDOPPORTUNITYFUND
280PARKAVENUE
NEW
YORK,
NY10017
eDelivery
AVAILA
BLE
Stoptraditionalm
aildelivery;receive
yourshareholderreports
andprosp
ectusonline.
Signupatco
hen
andsteers.co
m
Annual Report December 31, 2017
Cohen & SteersClosed-EndOpportunityFund
FOFAR

COHEN & STEERS CLOSED-END OPPORTUNITY FUND, INC.
To Our Shareholders:
We would like to share with you our report for the year ended December 31, 2017. The total returnsfor the Fund and its comparative benchmarks were:
Six Months EndedDecember 31, 2017
Year EndedDecember 31, 2017
Cohen & Steers Closed-End OpportunityFund at Net Asset Valuea . . . . . . . . . . . . . . 5.90% 16.67%
Cohen & Steers Closed-End OpportunityFund at Market Valuea . . . . . . . . . . . . . . . . 6.57% 23.26%
Morningstar US All Taxable Ex-ForeignEquity Indexb . . . . . . . . . . . . . . . . . . . . . . . 4.69% 15.55%
S&P 500 Indexb . . . . . . . . . . . . . . . . . . . . . . . . 11.42% 21.83%
The performance data quoted represent past performance. Past performance is no guarantee offuture results. The investment return and the principal value of an investment will fluctuate and shares, ifsold, may be worth more or less than their original cost. Current performance may be lower or higherthan the performance data quoted. Current total returns of the Fund can be obtained by visiting ourwebsite at cohenandsteers.com. The Fund’s returns assume the reinvestment of all dividends anddistributions at prices obtained under the Fund’s dividend reinvestment plan. Net asset value (NAV)returns reflect fee waivers and/or expense reimbursements, without which the returns would be lower.Index performance does not reflect the deduction of any fees, taxes or expenses. An investor cannotinvest directly in an index. Performance figures for periods shorter than one year are not annualized.
The Fund makes regular monthly distributions at a level rate (the Policy). Distributions paid by theFund are subject to recharacterization for tax purposes and are taxable up to the amount of the Fund’sinvestment company taxable income and net realized gains. As a result of the Policy, the Fund may paydistributions in excess of the Fund’s investment company taxable income and net realized gains. Thisexcess would be a return of capital distributed from the Fund’s assets. Distributions of capital decreasethe Fund’s total assets and, therefore, could have the effect of increasing the Fund’s expense ratio. Inaddition, in order to make these distributions, the Fund may have to sell portfolio securities at a less thanopportune time.
Market Review
Closed-end funds experienced strong returns in 2017 as global equities reached record highs.The year was defined by a broad-based acceleration in global growth—the most expansive since theInternational Monetary Fund began collecting data in 1980—as well as subdued inflation, low interestrates, accommodative monetary policies and a strong investor appetite for income.
a As a closed-end investment company, the price of the Fund’s exchange-traded shares will be set bymarket forces and can deviate from the NAV per share of the Fund.
b The Morningstar US All Taxable Ex-Foreign Equity Index measures the market-capitalization-weightedtotal return of taxable equity and fixed income closed-end funds; it excludes international, regional, andcountry closed-end funds. Index returns update frequently and are subject to change. The S&P 500Index is an unmanaged index of 500 large-capitalization stocks that is frequently used as a generalmeasure of U.S. stock market performance.
1

COHEN & STEERS CLOSED-END OPPORTUNITY FUND, INC.
The yield on the 10-year U.S. Treasury note touched a 2017 low in September as the chances ofpassing substantial pro-growth legislation faded, but rallied to end the year relatively unchanged as theTax Cut and Jobs Act was enacted in late December, which could stimulate the economy further.Sovereign yields in Europe rose modestly from negative levels, as the region’s economy continued toimprove.
Closed-end funds in both the equity and taxable fixed income categories generally saw discountsto underlying NAVs narrow during the year. The average discount for equity funds narrowed significantlyfrom 8.4% to 3.8%, while taxable fixed income funds narrowed modestly from 4.4% to 4.1%. Municipalfunds experienced a modest discount widening, from 4.8% to 5.4%.
Fund Performance
The Fund had a positive total return in the period and outperformed its benchmark on both amarket price and NAV basis. Emerging market equity funds were among the strongest performers in theentire closed-end-fund universe, benefiting from improving economic growth and the general rise inequity markets during the year. The Fund’s out-of-index position in emerging market equity fundscontributed to relative performance.
Other contributing factors included the Fund’s overweight in equity tax-advantaged funds, anothertop-performing sector in the period, and underweight in high yield funds, which had a relatively modestgain. Fund selection in the multi-sector group, which has the flexibility to shift assets among a widerange of fixed income classes, also aided performance.
Fund selection within Master Limited Partnership (MLP) funds was a positive contributor toperformance. As a group, MLP funds were the weakest performers in equity closed-end funds amidheadwinds in energy markets and investors’ negative reaction to certain distribution cuts among theunderlying MLPs.
Our decision to have a substantial underweight in utilities funds, based on valuation, detractedfrom relative performance. The historically interest-rate-sensitive sector benefited from relatively stablebond yields. The Fund’s out-of-index allocation to tax-exempt municipal bond funds also detracted fromrelative performance; our holdings had a positive return but trailed the index. The Fund’s overweight inhealth-biotech funds and fund selection in real estate further detracted from performance.
2

COHEN & STEERS CLOSED-END OPPORTUNITY FUND, INC.
Sincerely,
DOUGLAS R. BOND
Portfolio Manager
The views and opinions in the preceding commentary are subject to change without notice andare as of the date of the report. There is no guarantee that any market forecast set forth in thecommentary will be realized. This material represents an assessment of the market environment at aspecific point in time, should not be relied upon as investment advice and is not intended to predict ordepict performance of any investment.
Visit Cohen & Steers online at cohenandsteers.comFor more information about the Cohen & Steers family of mutual funds, visit cohenandsteers.com.Here you will find fund net asset values, fund fact sheets and portfolio highlights, as well aseducational resources and timely market updates.Our website also provides comprehensive information about Cohen & Steers, including our mostrecent press releases, profiles of our senior investment professionals and their investmentapproach to each asset class. The Cohen & Steers family of mutual funds invests in major realasset categories including real estate securities, listed infrastructure, commodities and naturalresource equities, as well as preferred securities and other income solutions.
3

COHEN & STEERS CLOSED-END OPPORTUNITY FUND, INC.
December 31, 2017Top Ten Holdings
(Unaudited)
Closed-End Fund Value
% ofNet
Assets
First Trust Energy Income and Growth Fund . . . . . . . . . . . . . . . . . . . . . . . . . . $14,467,674 3.8SPDR S&P 500 ETF Trust . . . . . . . . . . . . . . . . . . . . . . . . . . . . . . . . . . . . . . . . . 12,293,707 3.2Financial Select Sector SPDR ETF . . . . . . . . . . . . . . . . . . . . . . . . . . . . . . . . . . 11,350,467 3.0Central Fund of Canada Ltd., Class A . . . . . . . . . . . . . . . . . . . . . . . . . . . . . . . 10,706,734 2.8Nuveen Credit Strategies Income Fund . . . . . . . . . . . . . . . . . . . . . . . . . . . . . . 10,705,671 2.8PIMCO Dynamic Credit Income Fund . . . . . . . . . . . . . . . . . . . . . . . . . . . . . . . 10,550,884 2.8Reaves Utility Income Fund . . . . . . . . . . . . . . . . . . . . . . . . . . . . . . . . . . . . . . . . 9,598,454 2.5PIMCO Dynamic Income Fund . . . . . . . . . . . . . . . . . . . . . . . . . . . . . . . . . . . . . 9,576,514 2.5Eaton Vance Tax-Managed Global Diversified Equity Income Fund . . . . . . . . 9,564,082 2.5PIMCO Income Strategy Fund II . . . . . . . . . . . . . . . . . . . . . . . . . . . . . . . . . . . . 8,745,545 2.3
Sector Breakdown(Based on Net Assets)
(Unaudited)
Financial 4.8%
U.S. GeneralEquity 11.5%
Master LimitedPartnerships 10.9%
Other 25.4%Senior Loan 7.3%
Covered Call 9.5%
Multi-Sector 11.0%
Municipal 8.9%
Emerging Markets Equity 4.5%
Equity Tax—Advantaged 6.2%
4

COHEN & STEERS CLOSED-END OPPORTUNITY FUND, INC.
SCHEDULE OF INVESTMENTSDecember 31, 2017
Number ofShares Value
CLOSED-END FUNDS 96.3%COMMODITIES 4.1%
Central Fund of Canada Ltd., Class A . . . . . . . . . . . . . . . . . . . . 799,010 $ 10,706,734SPDR Gold Shares ETFa,b . . . . . . . . . . . . . . . . . . . . . . . . . . . . . . 24,261 2,999,872Sprott Physical Platinum & Palladium Trusta . . . . . . . . . . . . . . . . 184,373 1,722,044
15,428,650
COVERED CALL 9.5%AllianzGI NFJ Dividend, Interest & Premium Strategy Fund . . . 169,039 2,205,959BlackRock Enhanced Capital and Income Fund . . . . . . . . . . . . 84,303 1,380,883BlackRock Enhanced Dividend Achievers Trust . . . . . . . . . . . . 213,573 1,971,279Eaton Vance Tax-Managed Buy-Write Income Fund . . . . . . . . . 187,047 3,129,296Eaton Vance Tax-Managed Buy-Write Opportunities Fund . . . . 395,356 6,076,622Eaton Vance Tax-Managed Diversified Equity Income Fund . . 367,550 4,480,435Eaton Vance Tax-Managed Global Buy-Write Opportunities
Fund . . . . . . . . . . . . . . . . . . . . . . . . . . . . . . . . . . . . . . . . . . . . . 427,959 5,101,271Eaton Vance Tax-Managed Global Diversified Equity Income
Fund . . . . . . . . . . . . . . . . . . . . . . . . . . . . . . . . . . . . . . . . . . . . . 1,019,625 9,564,082Nuveen S&P 500 Buy-Write Income Fund . . . . . . . . . . . . . . . . . 164,203 2,339,893
36,249,720
EMERGING MARKETS EQUITY 4.5%iShares MSCI Emerging Markets ETFb . . . . . . . . . . . . . . . . . . . . 152,270 7,174,962Templeton Emerging Markets Fund . . . . . . . . . . . . . . . . . . . . . . 332,772 5,460,789Templeton Emerging Markets Investment Trust PLC (GBP)
(United Kingdom) . . . . . . . . . . . . . . . . . . . . . . . . . . . . . . . . . . 439,271 4,623,075
17,258,826
EQUITY TAX-ADVANTAGED 6.2%Eaton Vance Tax-Advantaged Dividend Income Fund . . . . . . . 291,309 6,778,761Eaton Vance Tax-Advantaged Global Dividend Income
Fund . . . . . . . . . . . . . . . . . . . . . . . . . . . . . . . . . . . . . . . . . . . . . 169,739 2,941,577Eaton Vance Tax-Advantaged Global Dividend Opportunities
Fund . . . . . . . . . . . . . . . . . . . . . . . . . . . . . . . . . . . . . . . . . . . . . 60,018 1,524,457Gabelli Dividend & Income Trust . . . . . . . . . . . . . . . . . . . . . . . . 228,286 5,344,175John Hancock Tax-Advantaged Dividend Income Fund . . . . . . 151,849 3,744,596Nuveen Tax-Advantaged Dividend Growth Fund . . . . . . . . . . . 104,483 1,836,811
See accompanying notes to financial statements.
5

COHEN & STEERS CLOSED-END OPPORTUNITY FUND, INC.
SCHEDULE OF INVESTMENTS—(Continued)December 31, 2017
Number ofShares Value
Nuveen Tax-Advantaged Total Return Strategy Fund . . . . . . . . 94,743 $ 1,321,665
23,492,042
FINANCIAL 4.8%Financial Select Sector SPDR ETFb . . . . . . . . . . . . . . . . . . . . . . . 406,681 11,350,467iShares MSCI Europe Financials ETFb . . . . . . . . . . . . . . . . . . . . 96,899 2,258,716John Hancock Bank and Thrift Opportunity Fund . . . . . . . . . . . 79,629 3,131,808SPDR S&P Bank ETFb . . . . . . . . . . . . . . . . . . . . . . . . . . . . . . . . . 35,335 1,672,759
18,413,750
GLOBAL EQUITY 2.5%Altabaa . . . . . . . . . . . . . . . . . . . . . . . . . . . . . . . . . . . . . . . . . . . . . 26,279 1,835,588Blackrock Science & Technology Trust . . . . . . . . . . . . . . . . . . . 104,829 2,797,886Fidelity European Values PLC (GBP) (United Kingdom) . . . . . . 917,477 2,808,206Henderson EuroTrust PLC (GBP) (United Kingdom) . . . . . . . . . 117,564 1,920,623
9,362,303
GLOBAL HYBRID (GROWTH & INCOME) 0.4%LMP Capital and Income Fund . . . . . . . . . . . . . . . . . . . . . . . . . . 111,359 1,553,458
HEALTH/BIOTECH 4.5%Gabelli Healthcare and WellnessRx Trust . . . . . . . . . . . . . . . . . 302,508 3,124,908iShares Nasdaq Biotechnology ETFb . . . . . . . . . . . . . . . . . . . . . 31,422 3,354,927Tekla Healthcare Investors . . . . . . . . . . . . . . . . . . . . . . . . . . . . . 125,179 2,822,786Tekla Healthcare Opportunities Fund . . . . . . . . . . . . . . . . . . . . . 164,759 2,886,578Tekla Life Sciences Investors . . . . . . . . . . . . . . . . . . . . . . . . . . . 146,796 2,881,605Tekla World Healthcare Fund . . . . . . . . . . . . . . . . . . . . . . . . . . . 153,649 2,091,163
17,161,967
INVESTMENT GRADE 0.8%PIMCO Corporate and Income Opportunity Fund . . . . . . . . . . . 192,244 3,164,336
LIMITED DURATION 0.8%Eaton Vance Limited Duration Income Fund . . . . . . . . . . . . . . . 121,993 1,665,205Franklin Templeton Limited Duration Income Trust . . . . . . . . . . 131,111 1,551,043
3,216,248
MASTER LIMITED PARTNERSHIPS 10.9%First Trust Energy Income and Growth Fund . . . . . . . . . . . . . . . 545,744 14,467,674First Trust MLP and Energy Income Fund . . . . . . . . . . . . . . . . . 156,405 2,447,738First Trust New Opportunities MLP & Energy Fund . . . . . . . . . . 320,962 3,841,594
See accompanying notes to financial statements.
6

COHEN & STEERS CLOSED-END OPPORTUNITY FUND, INC.
SCHEDULE OF INVESTMENTS—(Continued)December 31, 2017
Number ofShares Value
Kayne Anderson Energy Total Return Fund . . . . . . . . . . . . . . . . 220,807 $ 2,221,319Kayne Anderson MLP Investment Company . . . . . . . . . . . . . . . 382,945 7,295,102Neuberger Berman MLP Income Fund . . . . . . . . . . . . . . . . . . . . 509,971 4,783,528Tortoise Energy Infrastructure Corp. . . . . . . . . . . . . . . . . . . . . . . 147,729 4,295,959Tortoise MLP Fund . . . . . . . . . . . . . . . . . . . . . . . . . . . . . . . . . . . . 123,997 2,177,387
41,530,301
MULTI-SECTOR 11.0%AllianzGI Convertible & Income Fund II . . . . . . . . . . . . . . . . . . . 169,975 1,055,545PIMCO Dynamic Credit Income Fund . . . . . . . . . . . . . . . . . . . . 470,182 10,550,884PIMCO Dynamic Income Fund . . . . . . . . . . . . . . . . . . . . . . . . . . 318,686 9,576,514PIMCO High Income Fund . . . . . . . . . . . . . . . . . . . . . . . . . . . . . 497,541 3,711,656PIMCO Income Opportunity Fund . . . . . . . . . . . . . . . . . . . . . . . . 326,730 8,465,574PIMCO Income Strategy Fund II . . . . . . . . . . . . . . . . . . . . . . . . . 838,499 8,745,545
42,105,718
MUNICIPAL 8.9%BlackRock Investment Quality Municipal Trust . . . . . . . . . . . . . 58,136 867,389BlackRock Municipal Income Investment Quality Trust . . . . . . . 29,058 429,768BlackRock MuniEnhanced Fund . . . . . . . . . . . . . . . . . . . . . . . . . 86,352 1,006,864BlackRock MuniHoldings Investment Quality Fund . . . . . . . . . . 71,785 1,049,497BlackRock MuniHoldings Quality Fund . . . . . . . . . . . . . . . . . . . . 27,121 362,879BlackRock MuniHoldings Quality Fund II . . . . . . . . . . . . . . . . . . 29,060 404,225BlackRock MuniVest Fund . . . . . . . . . . . . . . . . . . . . . . . . . . . . . . 106,813 1,026,473BlackRock MuniYield Fund . . . . . . . . . . . . . . . . . . . . . . . . . . . . . 43,702 634,553BlackRock MuniYield Quality Fund . . . . . . . . . . . . . . . . . . . . . . . 37,324 566,205BlackRock MuniYield Quality Fund II . . . . . . . . . . . . . . . . . . . . . 59,626 781,101BlackRock MuniYield Quality Fund III . . . . . . . . . . . . . . . . . . . . . 38,194 527,459BlackRock Strategic Municipal Trust . . . . . . . . . . . . . . . . . . . . . 32,165 440,017Eaton Vance Municipal Income Trust . . . . . . . . . . . . . . . . . . . . . 97,171 1,204,920Invesco Municipal Trust . . . . . . . . . . . . . . . . . . . . . . . . . . . . . . . . 100,865 1,260,812Nuveen AMT-Free Quality Municipal Income Fund . . . . . . . . . . 175,636 2,414,995Nuveen Enhanced AMT-Free Municipal Credit Opportunities
Fund . . . . . . . . . . . . . . . . . . . . . . . . . . . . . . . . . . . . . . . . . . . . . 202,434 3,125,581Nuveen Enhanced Municipal Value Fund . . . . . . . . . . . . . . . . . . 108,368 1,538,826Nuveen Municipal Credit Income Fund . . . . . . . . . . . . . . . . . . . 496,610 7,568,336Nuveen Municipal Value Fund . . . . . . . . . . . . . . . . . . . . . . . . . . 300,272 3,041,755Nuveen Quality Municipal Income Fund . . . . . . . . . . . . . . . . . . . 161,652 2,272,827
See accompanying notes to financial statements.
7

COHEN & STEERS CLOSED-END OPPORTUNITY FUND, INC.
SCHEDULE OF INVESTMENTS—(Continued)December 31, 2017
Number ofShares Value
PIMCO Municipal Income Fund . . . . . . . . . . . . . . . . . . . . . . . . . 42,433 $ 551,629Pioneer Municipal High Income Trust . . . . . . . . . . . . . . . . . . . . . 27,493 325,792Putnam Managed Municipal Income Trust . . . . . . . . . . . . . . . . . 221,133 1,638,596Western Asset Municipal Partners Fund . . . . . . . . . . . . . . . . . . . 49,131 748,265
33,788,764
PREFERRED 1.8%John Hancock Preferred Income Fund III . . . . . . . . . . . . . . . . . . 39,783 745,931Nuveen Preferred & Income Term Fund . . . . . . . . . . . . . . . . . . . 81,610 2,020,664Nuveen Preferred Income Opportunities Fund . . . . . . . . . . . . . . 391,950 4,052,763
6,819,358
REAL ESTATE 2.5%CBRE Clarion Global Real Estate Income Fund . . . . . . . . . . . . . 202,767 1,605,915Neuberger Berman Real Estate Securities Income Fund . . . . . 826,879 4,572,641Nuveen Real Estate Income Fund . . . . . . . . . . . . . . . . . . . . . . . . 309,274 3,483,971
9,662,527
SENIOR LOAN 7.3%Ares Dynamic Credit Allocation Fund . . . . . . . . . . . . . . . . . . . . . 55,824 916,630BlackRock Floating Rate Income Trust Fund . . . . . . . . . . . . . . . 48,884 680,465Eaton Vance Floating-Rate Income Trust . . . . . . . . . . . . . . . . . . 101,352 1,452,374Eaton Vance Senior Floating-Rate Trust . . . . . . . . . . . . . . . . . . . 149,204 2,154,506Eaton Vance Senior Income Trust . . . . . . . . . . . . . . . . . . . . . . . . 272,133 1,774,307First Trust Senior Floating Rate Income Fund II . . . . . . . . . . . . . 106,469 1,373,450Invesco Dynamic Credit Opportunities Fund . . . . . . . . . . . . . . . 406,598 4,761,263Nuveen Credit Strategies Income Fund . . . . . . . . . . . . . . . . . . . 1,302,393 10,705,671Nuveen Floating Rate Income Fund . . . . . . . . . . . . . . . . . . . . . . 133,713 1,498,923Nuveen Floating Rate Income Opportunity Fund . . . . . . . . . . . . 126,108 1,437,631Nuveen Senior Income Fund . . . . . . . . . . . . . . . . . . . . . . . . . . . . 159,018 1,035,207
27,790,427
U.S. GENERAL EQUITY 11.5%Consumer Discretionary Select Sector SPDR ETFb . . . . . . . . . . 57,525 5,677,142Consumer Staples Select Sector SPDR ETFb . . . . . . . . . . . . . . . 47,035 2,675,821Gabelli Equity Trust . . . . . . . . . . . . . . . . . . . . . . . . . . . . . . . . . . . 1,186,604 7,345,079Liberty All-Star Equity Fund . . . . . . . . . . . . . . . . . . . . . . . . . . . . . 320,517 2,019,257Nuveen Core Equity Alpha Fund . . . . . . . . . . . . . . . . . . . . . . . . . 146,075 2,132,695Royce Value Trust . . . . . . . . . . . . . . . . . . . . . . . . . . . . . . . . . . . . 188,079 3,041,237
See accompanying notes to financial statements.
8

COHEN & STEERS CLOSED-END OPPORTUNITY FUND, INC.
SCHEDULE OF INVESTMENTS—(Continued)December 31, 2017
Number ofShares Value
Source Capital . . . . . . . . . . . . . . . . . . . . . . . . . . . . . . . . . . . . . . . 68,073 $ 2,774,656SPDR S&P 500 ETF Trustb . . . . . . . . . . . . . . . . . . . . . . . . . . . . . . 46,068 12,293,707Tri-Continental Corp. . . . . . . . . . . . . . . . . . . . . . . . . . . . . . . . . . . 78,911 2,125,862Vanguard S&P 500 ETF Trustb . . . . . . . . . . . . . . . . . . . . . . . . . . 15,440 3,787,278
43,872,734
U.S. HYBRID (GROWTH & INCOME) 1.8%Calamos Strategic Total Return Fund . . . . . . . . . . . . . . . . . . . . . 160,126 1,934,322Delaware Investments Dividend & Income Fund . . . . . . . . . . . . 115,868 1,247,898Guggenheim Strategic Opportunities Fund . . . . . . . . . . . . . . . . 164,553 3,551,054
6,733,274
UTILITY 2.5%Reaves Utility Income Fund . . . . . . . . . . . . . . . . . . . . . . . . . . . . . 310,228 9,598,454
TOTAL CLOSED-END FUNDS
(Identified cost—$357,075,004) . . . . . . . . . . . . . . . . . . . 367,202,857
SHORT-TERM INVESTMENTS 3.5%MONEY MARKET FUNDS
State Street Institutional Treasury Money Market Fund,Premier Class, 1.15%c . . . . . . . . . . . . . . . . . . . . . . . . . . . . . . 13,479,802 13,479,802
TOTAL SHORT-TERM INVESTMENTS
(Identified cost—$13,479,802) . . . . . . . . . . . . . . . . . . . . 13,479,802
TOTAL INVESTMENTS IN SECURITIES
(Identified cost—$370,554,806) . . . . . . . . . . . . . . . . . . . . . . . . . . 99.8% 380,682,659OTHER ASSETS IN EXCESS OF LIABILITIES . . . . . . . . . . . . . . . . . . . . . . 0.2 697,145
NET ASSETS (Equivalent to $14.02 per share based on 27,209,148shares of common stock outstanding) . . . . . . . . . . . . . . . . . . . . . 100.0% $381,379,804
See accompanying notes to financial statements.
9

COHEN & STEERS CLOSED-END OPPORTUNITY FUND, INC.
SCHEDULE OF INVESTMENTS—(Continued)December 31, 2017
Glossary of Portfolio Abbreviations
ETF Exchange-Traded FundGBP Great British PoundMLP Master Limited PartnershipSPDR Standard & Poor’s Depositary Receipt
Note: Percentages indicated are based on the net assets of the Fund.a Non-income producing security.b Security represents an exchange-traded fund which is continuously offered.c Rate quoted represents the annualized seven-day yield of the fund.
See accompanying notes to financial statements.
10
COHEN & STEERS CLOSED-END OPPORTUNITY FUND, INC.
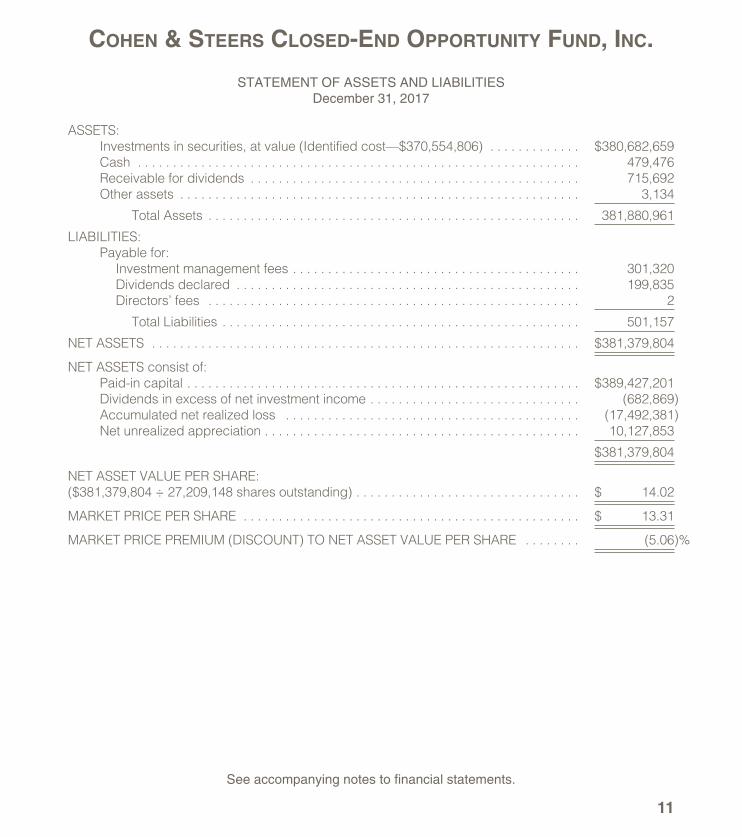
STATEMENT OF ASSETS AND LIABILITIESDecember 31, 2017
ASSETS:Investments in securities, at value (Identified cost—$370,554,806) . . . . . . . . . . . . . $380,682,659Cash . . . . . . . . . . . . . . . . . . . . . . . . . . . . . . . . . . . . . . . . . . . . . . . . . . . . . . . . . . . . . . . 479,476Receivable for dividends . . . . . . . . . . . . . . . . . . . . . . . . . . . . . . . . . . . . . . . . . . . . . . . 715,692Other assets . . . . . . . . . . . . . . . . . . . . . . . . . . . . . . . . . . . . . . . . . . . . . . . . . . . . . . . . . 3,134
Total Assets . . . . . . . . . . . . . . . . . . . . . . . . . . . . . . . . . . . . . . . . . . . . . . . . . . . . . 381,880,961
LIABILITIES:Payable for:
Investment management fees . . . . . . . . . . . . . . . . . . . . . . . . . . . . . . . . . . . . . . . . . 301,320Dividends declared . . . . . . . . . . . . . . . . . . . . . . . . . . . . . . . . . . . . . . . . . . . . . . . . . 199,835Directors’ fees . . . . . . . . . . . . . . . . . . . . . . . . . . . . . . . . . . . . . . . . . . . . . . . . . . . . . 2
Total Liabilities . . . . . . . . . . . . . . . . . . . . . . . . . . . . . . . . . . . . . . . . . . . . . . . . . . . 501,157
NET ASSETS . . . . . . . . . . . . . . . . . . . . . . . . . . . . . . . . . . . . . . . . . . . . . . . . . . . . . . . . . . . . . $381,379,804
NET ASSETS consist of:Paid-in capital . . . . . . . . . . . . . . . . . . . . . . . . . . . . . . . . . . . . . . . . . . . . . . . . . . . . . . . . $389,427,201Dividends in excess of net investment income . . . . . . . . . . . . . . . . . . . . . . . . . . . . . . (682,869)Accumulated net realized loss . . . . . . . . . . . . . . . . . . . . . . . . . . . . . . . . . . . . . . . . . . (17,492,381)Net unrealized appreciation . . . . . . . . . . . . . . . . . . . . . . . . . . . . . . . . . . . . . . . . . . . . . 10,127,853
$381,379,804
NET ASSET VALUE PER SHARE:($381,379,804 ÷ 27,209,148 shares outstanding) . . . . . . . . . . . . . . . . . . . . . . . . . . . . . . . . $ 14.02
MARKET PRICE PER SHARE . . . . . . . . . . . . . . . . . . . . . . . . . . . . . . . . . . . . . . . . . . . . . . . . $ 13.31
MARKET PRICE PREMIUM (DISCOUNT) TO NET ASSET VALUE PER SHARE . . . . . . . . (5.06)%
See accompanying notes to financial statements.
11
COHEN & STEERS CLOSED-END OPPORTUNITY FUND, INC.
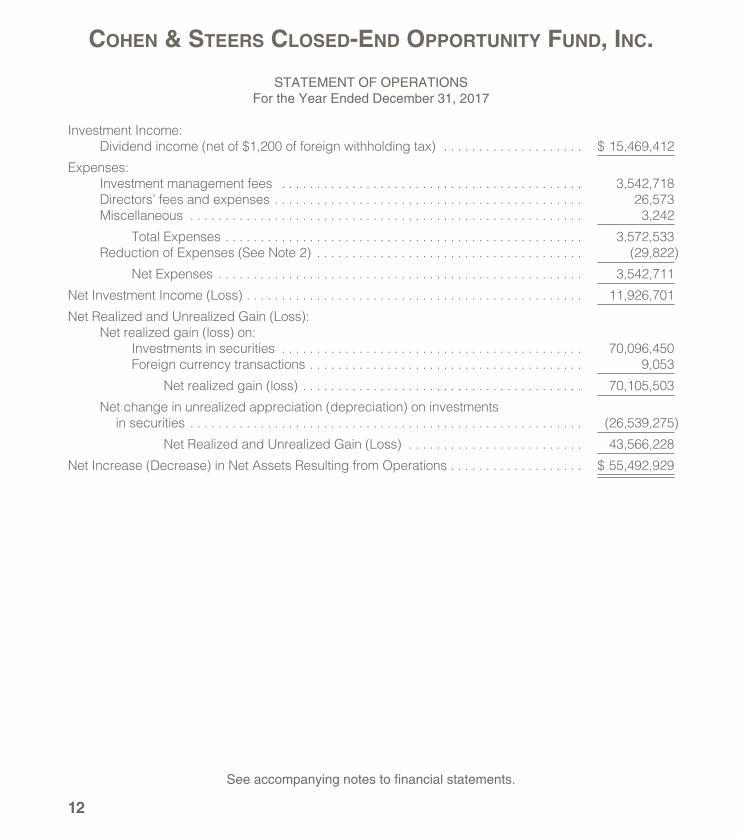
STATEMENT OF OPERATIONSFor the Year Ended December 31, 2017
Investment Income:Dividend income (net of $1,200 of foreign withholding tax) . . . . . . . . . . . . . . . . . . . . $ 15,469,412
Expenses:Investment management fees . . . . . . . . . . . . . . . . . . . . . . . . . . . . . . . . . . . . . . . . . . . 3,542,718Directors’ fees and expenses . . . . . . . . . . . . . . . . . . . . . . . . . . . . . . . . . . . . . . . . . . . . 26,573Miscellaneous . . . . . . . . . . . . . . . . . . . . . . . . . . . . . . . . . . . . . . . . . . . . . . . . . . . . . . . . 3,242
Total Expenses . . . . . . . . . . . . . . . . . . . . . . . . . . . . . . . . . . . . . . . . . . . . . . . . . . . 3,572,533Reduction of Expenses (See Note 2) . . . . . . . . . . . . . . . . . . . . . . . . . . . . . . . . . . . . . . (29,822)
Net Expenses . . . . . . . . . . . . . . . . . . . . . . . . . . . . . . . . . . . . . . . . . . . . . . . . . . . . 3,542,711
Net Investment Income (Loss) . . . . . . . . . . . . . . . . . . . . . . . . . . . . . . . . . . . . . . . . . . . . . . . . 11,926,701
Net Realized and Unrealized Gain (Loss):Net realized gain (loss) on:
Investments in securities . . . . . . . . . . . . . . . . . . . . . . . . . . . . . . . . . . . . . . . . . . . 70,096,450Foreign currency transactions . . . . . . . . . . . . . . . . . . . . . . . . . . . . . . . . . . . . . . . 9,053
Net realized gain (loss) . . . . . . . . . . . . . . . . . . . . . . . . . . . . . . . . . . . . . . . . 70,105,503
Net change in unrealized appreciation (depreciation) on investmentsin securities . . . . . . . . . . . . . . . . . . . . . . . . . . . . . . . . . . . . . . . . . . . . . . . . . . . . . . . . (26,539,275)
Net Realized and Unrealized Gain (Loss) . . . . . . . . . . . . . . . . . . . . . . . . . 43,566,228
Net Increase (Decrease) in Net Assets Resulting from Operations . . . . . . . . . . . . . . . . . . . $ 55,492,929
See accompanying notes to financial statements.
12

COHEN & STEERS CLOSED-END OPPORTUNITY FUND, INC.
STATEMENT OF CHANGES IN NET ASSETS
For theYear Ended
December 31, 2017
For theYear Ended
December 31, 2016
Change in Net Assets:From Operations:
Net investment income (loss) . . . . . . . . . . . . $ 11,926,701 $ 15,391,098Net realized gain (loss) . . . . . . . . . . . . . . . . . 70,105,503 6,986,895Net change in unrealized appreciation
(depreciation) . . . . . . . . . . . . . . . . . . . . . . (26,539,275) 24,464,868
Net increase (decrease) in net assetsresulting from operations . . . . . . . . . 55,492,929 46,842,861
Dividends and Distributions to Shareholders from:Net investment income . . . . . . . . . . . . . . . . . (28,406,351) (24,135,354)Return of capital . . . . . . . . . . . . . . . . . . . . . . . — (4,189,369)
Total dividends and distributions toshareholders . . . . . . . . . . . . . . . . . . . (28,406,351) (28,324,723)
Total increase (decrease) in netassets . . . . . . . . . . . . . . . . . . . . . . . . 27,086,578 18,518,138
Net Assets:Beginning of year . . . . . . . . . . . . . . . . . . . . . . 354,293,226 335,775,088
End of yeara . . . . . . . . . . . . . . . . . . . . . . . . . . $381,379,804 $354,293,226
a Includes dividends in excess of net investment income of $682,869 and $300,091, respectively.
See accompanying notes to financial statements.
13

COHEN & STEERS CLOSED-END OPPORTUNITY FUND, INC.
FINANCIAL HIGHLIGHTS
The following table includes selected data for a share outstanding throughout each year and otherperformance information derived from the financial statements. It should be read in conjunction with thefinancial statements and notes thereto.
For the Year Ended December 31,
Per Share Operating Performance: 2017 2016 2015 2014 2013
Net asset value, beginning of year . . . . . . . . . . . . . . . . . . . . . . . . . . $13.02 $12.34 $14.42 $14.06 $13.67
Income (loss) from investment operations:Net investment income (loss)a,b . . . . . . . . . . . . . . . . . . . . . . . . 0.44 0.57 0.60 0.69 0.64Net realized and unrealized gain (loss) . . . . . . . . . . . . . . . . . . 1.60 1.15 (1.64) 0.71 0.78
Total from investment operations . . . . . . . . . . . . . . . . . . . 2.04 1.72 (1.04) 1.40 1.42
Less dividends and distributions to shareholders from:Net investment income . . . . . . . . . . . . . . . . . . . . . . . . . . . . . . . (1.04) (0.89) (0.81) (1.04) (0.88)Return of capital . . . . . . . . . . . . . . . . . . . . . . . . . . . . . . . . . . . . . — (0.15) (0.23) — (0.16)
Total dividends and distributions to shareholders . . . . . . (1.04) (1.04) (1.04) (1.04) (1.04)
Anti-dilutive effect from the repurchase of shares . . . . . . . . . . . . . . — — — — 0.01
Net increase (decrease) in net asset value . . . . . . . . . . . . . . . . . . . 1.00 0.68 (2.08) 0.36 0.39
Net asset value, end of year . . . . . . . . . . . . . . . . . . . . . . . . . . . . . . . $14.02 $13.02 $12.34 $14.42 $14.06
Market value, end of year . . . . . . . . . . . . . . . . . . . . . . . . . . . . . . . . . $13.31 $11.70 $10.96 $13.16 $12.57
Total net asset value returnc . . . . . . . . . . . . . . . . . . . . . . . . . . . . . . . 16.67% 15.31% –6.57% 10.92% 11.42%
Total market value returnc . . . . . . . . . . . . . . . . . . . . . . . . . . . . . . . . . 23.26% 16.67% –9.04% 13.19% 9.64%
See accompanying notes to financial statements.
14

COHEN & STEERS CLOSED-END OPPORTUNITY FUND, INC.
FINANCIAL HIGHLIGHTS—(Continued)
For the Year Ended December 31,
Ratios/Supplemental Data: 2017 2016 2015 2014 2013
Net assets, end of year (in millions) . . . . . . . . . . . . . . . . . . . . . . . . . $381.4 $354.3 $335.8 $392.4 $382.7
Ratio of expenses to average daily net assets (before expensereduction)d . . . . . . . . . . . . . . . . . . . . . . . . . . . . . . . . . . . . . . . . . . . 0.96% 0.96% 0.96% 0.96% 0.96%
Ratio of expenses to average daily net assets (net of expensereduction)d . . . . . . . . . . . . . . . . . . . . . . . . . . . . . . . . . . . . . . . . . . . 0.95% 0.95% 0.95% 0.95% 0.95%
Ratio of net investment income (loss) to average daily net assets(before expense reduction)b,d . . . . . . . . . . . . . . . . . . . . . . . . . . . . 3.19% 4.45% 4.36% 4.71% 4.53%
Ratio of net investment income (loss) to average daily net assets(net of expense reduction)b,d . . . . . . . . . . . . . . . . . . . . . . . . . . . . 3.20% 4.46% 4.37% 4.72% 4.54%
Portfolio turnover rate . . . . . . . . . . . . . . . . . . . . . . . . . . . . . . . . . . . . 80% 36% 19% 33% 41%
a Calculation based on average shares outstanding.b Net investment income (loss) is affected by the timing of distributions of the closed-end funds in which the Fund
invests.c Total net asset value return measures the change in net asset value per share over the period indicated. Total
market value return is computed based upon the Fund’s market price per share and excludes the effects ofbrokerage commissions. Dividends and distributions are assumed, for purposes of these calculations, to bereinvested at prices obtained under the Fund’s dividend reinvestment plan.
d Does not include expenses incurred by the closed-end funds in which the Fund invests.
See accompanying notes to financial statements.
15

COHEN & STEERS CLOSED-END OPPORTUNITY FUND, INC.
NOTES TO FINANCIAL STATEMENTS
Note 1. Organization and Significant Accounting Policies
Cohen & Steers Closed-End Opportunity Fund, Inc. (the Fund) was incorporated under the laws ofthe State of Maryland on September 14, 2006 and is registered under the Investment Company Act of1940 (the 1940 Act) as a diversified, closed-end management investment company. The Fund’sinvestment objective is to achieve total return.
The following is a summary of significant accounting policies consistently followed by the Fund inthe preparation of its financial statements. The Fund is an investment company and, accordingly, followsthe investment company accounting and reporting guidance of the Financial Accounting StandardsBoard Accounting Standards Codification (ASC) Topic 946—Investment Companies. The accountingpolicies are in conformity with accounting principles generally accepted in the United States of America(GAAP). The preparation of the financial statements in accordance with GAAP requires management tomake estimates and assumptions that affect the reported amounts of assets and liabilities at the date ofthe financial statements and the reported amounts of income and expenses during the reporting period.Actual results could differ from those estimates.
Portfolio Valuation: Investments in securities that are listed on the New York Stock Exchange(NYSE) are valued, except as indicated below, at the last sale price reflected at the close of the NYSEon the business day as of which such value is being determined. If there has been no sale on such day,the securities are valued at the mean of the closing bid and ask prices on such day or, if no ask price isavailable, at the bid price.
Securities not listed on the NYSE but listed on other domestic or foreign securities exchanges(including NASDAQ) are valued in a similar manner. Securities traded on more than one securitiesexchange are valued at the last sale price reflected at the close of the exchange representing theprincipal market for such securities on the business day as of which such value is being determined. Ifafter the close of a foreign market, but prior to the close of business on the day the securities are beingvalued, market conditions change significantly, certain non-U.S. equity holdings may be fair valuedpursuant to procedures established by the Board of Directors.
Readily marketable securities traded in the over-the-counter (OTC) market, including listedsecurities whose primary market is believed by Cohen & Steers Capital Management, Inc. (theinvestment manager) to be OTC, are valued on the basis of prices provided by a third-party pricingservice or third-party broker-dealers when such prices are believed by the investment manager,pursuant to delegation by the Board of Directors, to reflect the fair value of such securities.
Short-term debt securities with a maturity date of 60 days or less are valued at amortized cost,which approximates fair value. Investments in open-end mutual funds are valued at their closing netasset value (NAV).
The policies and procedures approved by the Fund’s Board of Directors delegate authority tomake fair value determinations to the investment manager, subject to the oversight of the Board ofDirectors. The investment manager has established a valuation committee (Valuation Committee) toadminister, implement and oversee the fair valuation process according to the policies and proceduresapproved annually by the Board of Directors. Among other things, these procedures allow the Fund toutilize independent pricing services, quotations from securities and financial instrument dealers andother market sources to determine fair value.
16

COHEN & STEERS CLOSED-END OPPORTUNITY FUND, INC.
NOTES TO FINANCIAL STATEMENTS—(Continued)
Securities for which market prices are unavailable, or securities for which the investment managerdetermines that the bid and/or ask price or a counterparty valuation does not reflect market value, willbe valued at fair value, as determined in good faith by the Valuation Committee, pursuant to proceduresapproved by the Fund’s Board of Directors. Circumstances in which market prices may be unavailableinclude, but are not limited to, when trading in a security is suspended, the exchange on which thesecurity is traded is subject to an unscheduled close or disruption or material events occur after theclose of the exchange on which the security is principally traded. In these circumstances, the Funddetermines fair value in a manner that fairly reflects the market value of the security on the valuation datebased on consideration of any information or factors it deems appropriate. These may include, but arenot limited to, recent transactions in comparable securities, information relating to the specific securityand developments in the markets.
Foreign equity fair value pricing procedures utilized by the Fund may cause certain non-U.S.equity holdings to be fair valued on the basis of fair value factors provided by a pricing service to reflectany significant market movements between the time the Fund values such securities and the earlierclosing of foreign markets.
The Fund’s use of fair value pricing may cause the NAV of Fund shares to differ from the NAV thatwould be calculated using market quotations. Fair value pricing involves subjective judgments and it ispossible that the fair value determined for a security may be materially different than the value that couldbe realized upon the sale of that security.
Fair value is defined as the price that the Fund would expect to receive upon the sale of aninvestment or expect to pay to transfer a liability in an orderly transaction with an independent buyer inthe principal market or, in the absence of a principal market, the most advantageous market for theinvestment or liability. The hierarchy of inputs that are used in determining the fair value of the Fund’sinvestments is summarized below.
• Level 1—quoted prices in active markets for identical investments• Level 2—other significant observable inputs (including quoted prices for similar investments,
interest rates, credit risk, etc.)• Level 3—significant unobservable inputs (including the Fund’s own assumptions in determining
the fair value of investments)
The inputs or methodology used for valuing investments may or may not be an indication of therisk associated with those investments.
For movements between the levels within the fair value hierarchy, the Fund has adopted a policy ofrecognizing the transfer at the end of the period in which the underlying event causing the movementoccurred. Changes in valuation techniques may result in transfers into or out of an assigned level withinthe disclosure hierarchy. There were no transfers between Level 1 and Level 2 investments as ofDecember 31, 2017.
17

COHEN & STEERS CLOSED-END OPPORTUNITY FUND, INC.
NOTES TO FINANCIAL STATEMENTS—(Continued)
The following is a summary of the inputs used as of December 31, 2017 in valuing the Fund’sinvestments carried at value:
Total
Quoted PricesIn Active
Markets forIdentical
Investments(Level 1)
OtherSignificantObservable
Inputs(Level 2)
SignificantUnobservable
Inputs(Level 3)
Closed-End Funds . . . . . . . . . . . $367,202,857 $367,202,857 $ — $ —Short-Term Investments . . . . . . . 13,479,802 — 13,479,802 —
Total Investmentsin Securitiesa . . . . . . . . . . . $380,682,659 $367,202,857 $13,479,802 $ —
a Portfolio holdings are disclosed individually on the Schedule of Investments.
Security Transactions and Investment Income: Security transactions are recorded on trade date.Realized gains and losses on investments sold are recorded on the basis of identified cost. Interestincome, which includes the amortization of premiums and accretion of discounts, is recorded on theaccrual basis. Dividend income is recorded on the ex-dividend date, except for certain dividends onforeign securities, which are recorded as soon as the Fund is informed after the ex-dividend date.Distributions from Closed-End Funds (CEFs) are recorded as ordinary income, net realized capital gainor return of capital based on information reported by the CEFs and management’s estimates of suchamounts based on historical information. These estimates are adjusted when the actual source ofdistributions is disclosed by the CEFs and may differ from the estimated amounts.
Foreign Currency Translation: The books and records of the Fund are maintained in U.S. dollars.Investment securities and other assets and liabilities denominated in foreign currencies are translatedinto U.S. dollars based upon prevailing exchange rates on the date of valuation. Purchases and sales ofinvestment securities and income and expense items denominated in foreign currencies are translatedinto U.S. dollars based upon prevailing exchange rates on the respective dates of such transactions.The Fund does not isolate that portion of the results of operations resulting from fluctuations in foreignexchange rates on investments from the fluctuations arising from changes in market prices of securitiesheld. Such fluctuations are included with the net realized and unrealized gain or loss on investments.
Net realized foreign exchange gains or losses arise from sales of foreign currencies, includinggains and losses on forward foreign currency exchange contracts, currency gains or losses realizedbetween the trade and settlement dates on securities transactions, and the difference between theamounts of dividends, interest, and foreign withholding taxes recorded on the Fund’s books and theU.S. dollar equivalent of the amounts actually received or paid. Net unrealized foreign exchange gainsand losses arise from changes in the values of assets and liabilities, other than investments in securities,on the date of valuation, resulting from changes in exchange rates. Pursuant to U.S. federal income taxregulations, certain foreign currency gains/losses included in realized and unrealized gains/losses areincluded in or are a reduction of ordinary income for federal income tax purposes.
18

COHEN & STEERS CLOSED-END OPPORTUNITY FUND, INC.
NOTES TO FINANCIAL STATEMENTS—(Continued)
Dividends and Distributions to Shareholders: The Fund makes regular distributions pursuant to thePolicy. Dividends from net investment income and capital gain distributions are determined inaccordance with U.S. federal income tax regulations, which may differ from GAAP. Dividends from netinvestment income, if any, are declared quarterly and paid monthly. Net realized capital gains, unlessoffset by any available capital loss carryforward, are typically distributed to shareholders at leastannually. Dividends and distributions to shareholders are recorded on the ex-dividend date and areautomatically reinvested in full and fractional shares of the Fund in accordance with the Fund’sReinvestment Plan, unless the shareholder has elected to have them paid in cash. Dividends from netinvestment income are subject to recharacterization for tax purposes.
Income Taxes: It is the policy of the Fund to continue to qualify as a regulated investmentcompany (RIC), if such qualification is in the best interest of the shareholders, by complying with therequirements of Subchapter M of the Internal Revenue Code applicable to RICs, and by distributingsubstantially all of its taxable earnings to its shareholders. Also, in order to avoid the payment of anyfederal excise taxes, the Fund will distribute substantially all of its net investment income and netrealized gains on a calendar year basis. Accordingly, no provision for federal income or excise tax isnecessary. Management has analyzed the Fund’s tax positions taken on federal and applicable stateincome tax returns as well as its tax positions in non-U.S. jurisdictions in which it trades for all open taxyears and has concluded that as of December 31, 2017, no additional provisions for income tax arerequired in the Fund’s financial statements. The Fund’s tax positions for the tax years for which theapplicable statutes of limitations have not expired are subject to examination by the Internal RevenueService, state departments of revenue and by foreign tax authorities.
Note 2. Investment Management Fees and Other Transactions with Affiliates
Investment Management Fees: Cohen & Steers Capital Management, Inc. serves as the Fund’sinvestment manager pursuant to an investment management agreement (the investment managementagreement). Under the terms of the investment management agreement, the investment managerprovides the Fund with day-to-day investment decisions and generally manages the Fund’s investmentsin accordance with the stated policies of the Fund, subject to the supervision of the Board of Directors.
For the services provided to the Fund, the investment manager receives a fee, accrued daily andpaid monthly, at the annual rate of 0.95% of the average daily net assets of the Fund.
The investment manager is also responsible, under the investment management agreement, forthe performance of certain administrative functions for the Fund. Additionally, the investment managerpays certain expenses of the Fund, including, but not limited to, administrative and custody fees,transfer agent fees, professional fees, and reports to shareholders.
The investment manager has contractually agreed to reimburse the Fund so that its total annualoperating expenses, exclusive of brokerage fees and commissions, taxes and, upon approval of theBoard of Directors, extraordinary expenses, do not exceed 0.95% of the Fund’s average daily netassets. This commitment will remain in place for the life of the Fund. For the year ended December 31,2017, fees waived and/or expenses reimbursed totaled $29,822.
19

COHEN & STEERS CLOSED-END OPPORTUNITY FUND, INC.
NOTES TO FINANCIAL STATEMENTS—(Continued)
Directors’ and Officers’ Fees: Certain directors and officers of the Fund are also directors, officers,and/or employees of the investment manager. The Fund does not pay compensation to directors andofficers affiliated with the investment manager.
Note 3. Purchases and Sales of Securities
Purchases and sales of securities, excluding short-term investments, for the year endedDecember 31, 2017, totaled $290,179,170 and $300,866,448, respectively.
Note 4. Income Tax Information
The tax character of dividends and distributions paid was as follows:
For the Year EndedDecember 31,
2017 2016
Ordinary income . . . . . . . . . . . . . . . . . . . . . . . . . . $27,113,248 $23,182,129Tax-exempt income . . . . . . . . . . . . . . . . . . . . . . . . 1,293,103 953,225Return of capital . . . . . . . . . . . . . . . . . . . . . . . . . . . — 4,189,369
Total dividends and distributions . . . . . . . . . $28,406,351 $28,324,723
As of December 31, 2017, the tax-basis components of accumulated earnings, the federal tax costand net unrealized appreciation (depreciation) in value of investments held were as follows:
Cost of investments in securities for federal income taxpurposes . . . . . . . . . . . . . . . . . . . . . . . . . . . . . . . . . . . . . . . . . . . . $373,393,584
Gross unrealized appreciation on investments . . . . . . . . . . . . . . . . $ 13,151,560Gross unrealized depreciation on investments . . . . . . . . . . . . . . . . (5,862,485)
Net unrealized appreciation (depreciation) on investments . . . . . . $ 7,289,075
As of December 31, 2017, the Fund had a net capital loss carryforward of $15,336,472, which maybe used to offset future capital gains. These losses are comprised of a short-term capital loss carryoverwhich will expire on December 31, 2018.
During the year ended December 31, 2017, the Fund utilized net capital loss carryforwards of$62,014,144. During the year ended December 31, 2017, the Fund had net capital loss carryforwards of$23,812,088 which expired unused.
As of December 31, 2017, the Fund had temporary book/tax differences primarily attributable towash sales on portfolio securities and unrealized gains on passive foreign investment companies andpermanent book/tax differences primarily attributable to fund distributions, prior year underlying fundadjustments, sales of passive foreign investment companies and the expiration of capital losscarryforwards. To reflect reclassifications arising from the permanent differences, paid-in capital wascharged $37,890,932, accumulated net realized loss was credited $21,794,060 and dividends in excessof net investment income was credited $16,096,872. Net assets were not affected by this reclassification.
20

COHEN & STEERS CLOSED-END OPPORTUNITY FUND, INC.
NOTES TO FINANCIAL STATEMENTS—(Continued)
Note 5. Capital Stock
The Fund is authorized to issue 100 million shares of common stock at a par value of $0.001 pershare.
During the years ended December 31, 2017 and December 31, 2016, the Fund did not issueshares of common stock for the reinvestment of dividends.
On December 5, 2017, the Board of Directors approved the continuation of the delegation of itsauthority to management to effect repurchases, pursuant to management’s discretion and subject tomarket conditions and investment considerations, of up to 10% of the Fund’s common sharesoutstanding from January 1, 2018, through the fiscal year ended December 31, 2018.
During the years ended December 31, 2017 and December 31, 2016, the Fund did not effect anyrepurchases.
Note 6. Other Risks
Common Stock Risk: While common stocks have historically generated higher average returnsthan fixed income securities over the long-term, common stock has also experienced significantly morevolatility in those returns, although under certain market conditions, fixed-income investments may havecomparable or greater price volatility. An adverse event, such as an unfavorable earnings report, maydepress the value of common stock held by the Fund. Also, the price of common stock is sensitive togeneral movements in the stock market. A drop in the stock market may depress the price of commonstock held by the Fund.
Risks of Investing in Other Closed-End Investment Companies: Since the Fund concentrates itsassets in closed-end management investment companies, risks of investing in the Fund include therisks associated with the purchased closed-end investment companies’ portfolio securities, and ashareholder in the Fund will bear not only his or her proportionate share of the Fund’s expenses, butalso indirectly the expenses of the purchased closed-end investment companies (“Portfolio Funds”).Shareholders will therefore be subject to duplicative expenses to the extent the Fund invests in otherinvestment companies. Risks associated with investments in closed-end end funds generally includemarket risk, leverage risk, risk of market price discount from NAV, risk of anti-takeover provisions andnon-diversification.
Sector Concentration Risk: Some Portfolio Funds invest substantially, or even exclusively, in onesector or industry group and therefore carry risk of the particular sector or industry group. To the extenta Portfolio Fund focuses its investments in a specific sector, such as real estate, energy or utilities, thePortfolio Fund will be susceptible to adverse conditions and economic or regulatory occurrencesaffecting the sector or industry group, which tends to increase volatility and result in higher risk.
Covered Call Writing Risk: The Fund may invest in Portfolio Funds that engage in a strategy knownas “covered call option writing,” which is designed to produce income from option premiums and offseta portion of a market decline in the underlying security. The writer (seller) of a covered call optionforgoes, during the option’s life, the opportunity to profit from increases in the market value of thesecurity covering the call option above the sum of the premium and the strike price of the call, but has
21

COHEN & STEERS CLOSED-END OPPORTUNITY FUND, INC.
NOTES TO FINANCIAL STATEMENTS—(Continued)
retained the risk of loss should the price of the underlying security decline. The writer of an option hasno control over the time when it may be required to fulfill its obligation as a writer of the option. Once anoption writer has received an exercise notice, it cannot effect a closing purchase transaction in order toterminate its obligation under the option and must deliver the underlying security at the exercise price.
Municipal Bond Risk: The Fund may invest in Portfolio Funds that invest in municipal bonds.Municipal bonds are debt obligations issued by states or by political subdivisions or authorities ofstates. Municipal bonds are typically designated as general obligation bonds, which are generalobligations of a governmental entity that are backed by the taxing power of such entity, or revenuebonds, which are payable from the income of a specific project or authority and are not supported bythe issuer’s power to levy taxes. Municipal bonds are long-term fixed rate debt obligations that generallydecline in value with increases in interest rates, when an issuer’s financial condition worsens or when therating on a bond is decreased. Many municipal bonds may be called or redeemed prior to their statedmaturity. Lower quality revenue bonds and other credit-sensitive municipal securities carry higher risksof default than general obligation bonds.
Master Limited Partnership Risk: The Fund may invest in Portfolio Funds that invest in masterlimited partnerships (MLPs). An investment in MLP units involves some risks that differ from aninvestment in the common stock of a corporation. Holders of MLP units have limited control on mattersaffecting the partnership. Investing in MLPs involves certain risks related to investing in the underlyingassets of the MLPs and risks associated with pooled investment vehicles. MLPs holding credit-relatedinvestments are subject to interest rate risk and the risk of default on payment obligations by debtissuers. MLPs that concentrate in a particular industry or a particular geographic region are subject torisks associated with such industry or region. The benefit derived from the Fund’s investment in MLPs islargely dependent on the MLPs being treated as partnerships for federal income tax purposes.Weakening energy market fundamentals may increase counterparty risk and impact MLP profitability.Specifically, energy companies suffering financial distress may be able to abrogate contracts withMLPs, decreasing or eliminating sources of revenue.
Senior Loans Risk: The Fund may invest in Portfolio Funds that invest in senior loans. The risksassociated with senior loans are similar to the risks of junk bonds, although senior loans are typicallysenior and secured, whereas junk bonds are often subordinated and unsecured. Investments in seniorloans are typically below investment grade and are considered speculative because of the credit risk oftheir issuers. Such companies are more likely to default on their payments of interest and principalowed, and such defaults could reduce a Portfolio Fund’s NAV and income distributions. An economicdownturn generally leads to a higher non-payment rate, and a senior loan may lose significant valuebefore a default occurs. There is no assurance that the liquidation of the collateral would satisfy theclaims of the borrower’s obligations in the event of the nonpayment of scheduled interest or principal, orthat the collateral could be readily liquidated. Economic and other events (whether real or perceived)can reduce the demand for certain senior loans or senior loans generally, which may reduce marketprices. Senior loans and other debt securities are also subject to the risk of price declines and toincreases in prevailing interest rates, although floating-rate debt instruments such as senior loans inwhich certain Portfolio Funds may be expected to invest are substantially less exposed to this risk thanfixed-rate debt instruments.
22

COHEN & STEERS CLOSED-END OPPORTUNITY FUND, INC.
NOTES TO FINANCIAL STATEMENTS—(Continued)
Preferred Securities Risk: The Fund may invest in Portfolio Funds that invest in preferred securities.Preferred securities are subject to credit risk, which is the risk that a security will decline in price, or theissuer of the security will fail to make dividend, interest or principal payments when due, because theissuer experiences a decline in its financial status. Preferred securities are also subject to interest raterisk and may decline in value because of changes in market interest rates. Portfolio Funds may besubject to a greater risk of rising interest rates than would normally be the case in an environment of lowinterest rates and the effect of potential government fiscal policy initiatives and resulting market reactionto those initiatives. In addition, an issuer may be permitted to defer or omit distributions. Preferredsecurities are also generally subordinated to bonds and other debt instruments in a company’s capitalstructure. During periods of declining interest rates, an issuer may be able to exercise an option toredeem (call) its issue at par earlier than scheduled, and the Portfolio Fund may be forced to reinvest inlower yielding securities. Certain preferred securities may be substantially less liquid than many othersecurities, such as common stocks. Generally, preferred security holders have no voting rights withrespect to the issuing company unless certain events occur. Certain preferred securities may give theissuers special redemption rights allowing the securities to be redeemed prior to a specified date ifcertain events occur, such as changes to tax or securities laws.
Leverage Risk: Portfolio Funds may employ the use of leverage. The use of leverage is aspeculative technique and there are special risks and costs associated with leverage. The NAV of thePortfolio Fund’s shares may be reduced by the issuance and ongoing costs of leverage. So long as thePortfolio Fund is able to invest in securities that produce an investment yield that is greater than the totalcost of leverage, the leverage strategy will produce higher current net investment income for theshareholders, including the Fund. On the other hand, to the extent that the total cost of leverageexceeds the incremental income gained from employing such leverage, shareholders, including theFund, would realize lower net investment income. In addition to the impact on net income, the use ofleverage will have an effect of magnifying capital appreciation or depreciation for shareholders.Specifically, in an up market, leverage will typically generate greater capital appreciation than if thePortfolio Fund were not employing leverage. Conversely, in down markets, the use of leverage willgenerally result in greater capital depreciation than if the Portfolio Fund had been unlevered. To theextent that the Portfolio Fund is required or elects to reduce its leverage, the Portfolio Fund may need toliquidate investments, including under adverse economic conditions which may result in capital lossespotentially reducing returns to shareholders. The use of leverage also results in the investmentmanagement fees payable to the investment manager being higher than if the Fund did not useleverage and can increase operating costs, which may reduce total return. There can be no assurancethat a leveraging strategy will be successful during any period in which it is employed.
Regulatory Risk: The U.S. government has proposed and adopted multiple regulations that couldhave a long-lasting impact on the Fund and on the mutual fund industry in general. The Department ofLabor’s (DOL) final rule on conflicts of interest on fiduciary investment advice, as well as the U.S.Securities and Exchange Commission’s (SEC) final rules and amendments to modernize reporting anddisclosure could, among other things, restrict and/or increase the cost of the Fund’s ability to engage intransactions and/or increase overall expenses of the Fund. In addition, Congress, various exchangesand regulatory and self-regulatory authorities, both domestic and foreign, have undertaken reviews ofoptions and futures trading in light of market volatility. Among the actions that have been taken or
23

COHEN & STEERS CLOSED-END OPPORTUNITY FUND, INC.
NOTES TO FINANCIAL STATEMENTS—(Continued)
proposed to be taken are new limits and reporting requirements for speculative positions, new or morestringent daily price fluctuation limits for futures and options transactions, and increased marginrequirements for various types of futures transactions. While the full extent of all of these regulations isstill unclear, these regulations and actions may adversely affect the instruments in which the Fundinvests and its ability to execute its investment strategy.
Note 7. Other
In the normal course of business, the Fund enters into contracts that provide generalindemnifications. The Fund’s maximum exposure under these arrangements is dependent on claimsthat may be made against the Fund in the future and, therefore, cannot be estimated; however, basedon experience, the risk of material loss from such claims is considered remote.
Note 8. New Accounting Guidance
In October 2016, the SEC adopted new rules and amended existing rules (together, the “finalrules”) intended to modernize the reporting and disclosure of information by registered investmentcompanies. In part, the final rules amend Regulation S-X and require standardized, enhanceddisclosure about derivatives in investment company financial statements, as well as other amendments.The compliance date for the amendments to Regulation S-X was for periods ending after August 1,2017. The adoption of these amendments, effective with these financial statements for the year endedDecember 31, 2017, required amended and additional disclosures reflected herein, but had no effecton the Fund’s net assets or results of operations.
Note 9. Subsequent Events
Management has evaluated events and transactions occurring after December 31, 2017 throughthe date that the financial statements were issued, and has determined that no additional disclosure inthe financial statements is required.
24

COHEN & STEERS CLOSED-END OPPORTUNITY FUND, INC.
REPORT OF INDEPENDENT REGISTERED PUBLIC ACCOUNTING FIRM
To the Board of Directors and Shareholders ofCohen & Steers Closed-End Opportunity Fund, Inc.
Opinion on the Financial Statements
We have audited the accompanying statement of assets and liabilities, including the schedule ofinvestments, of Cohen & Steers Closed-End Opportunity Fund, Inc. (the “Fund”) as of December 31, 2017,the related statement of operations for the year ended December 31, 2017, the statement of changes in netassets for each of the two years in the period ended December 31, 2017, including the related notes, andthe financial highlights for each of the five years in the period ended December 31, 2017 (collectivelyreferred to as the “financial statements”). In our opinion, the financial statements present fairly, in all materialrespects, the financial position of the Fund as of December 31, 2017, the results of its operations for theyear then ended, the changes in its net assets for each of the two years in the period ended December 31,2017 and the financial highlights for each of the five years in the period ended December 31, 2017 inconformity with accounting principles generally accepted in the United States of America.
Basis for Opinion
These financial statements are the responsibility of the Fund’s management. Our responsibility is toexpress an opinion on the Fund’s financial statements based on our audits. We are a public accountingfirm registered with the Public Company Accounting Oversight Board (United States) (“PCAOB”) and arerequired to be independent with respect to the Fund in accordance with the U.S. federal securities lawsand the applicable rules and regulations of the Securities and Exchange Commission and the PCAOB.
We conducted our audits of these financial statements in accordance with the standards of the PCAOB.Those standards require that we plan and perform the audit to obtain reasonable assurance aboutwhether the financial statements are free of material misstatement, whether due to error or fraud.
Our audits included performing procedures to assess the risks of material misstatement of the financialstatements, whether due to error or fraud, and performing procedures that respond to those risks. Suchprocedures included examining, on a test basis, evidence regarding the amounts and disclosures in thefinancial statements. Our audits also included evaluating the accounting principles used and significantestimates made by management, as well as evaluating the overall presentation of the financialstatements. Our procedures included confirmation of securities owned as of December 31, 2017 bycorrespondence with the custodian and transfer agent. We believe that our audits provide a reasonablebasis for our opinion.
PricewaterhouseCoopers LLPNew York, New YorkFebruary 27, 2018
We have served as the auditor of one or more investment companies in the Cohen & Steers family ofmutual funds since 1991.
25

COHEN & STEERS CLOSED-END OPPORTUNITY FUND, INC.
AVERAGE ANNUAL TOTAL RETURNS(Periods ended December 31, 2017) (Unaudited)
Based on Net Asset Value Based on Market Value
One Year Five Years Ten YearsSince Inception
(11/24/06) One Year Five Years Ten YearsSince Inception
(11/24/06)16.67% 9.21% 6.93% 5.88% 23.26% 10.18% 6.97% 5.08%
The performance data quoted represent past performance. Past performance is no guarantee offuture results. The investment return will vary and the principal value of an investment will fluctuate andshares, if sold, may be worth more or less than their original cost. Current performance may be lower orhigher than the performance data quoted. Current total returns of the Fund can be obtained by visitingour website at cohenandsteers.com. Fund performance figures reflect fee waivers and/or expensereimbursements, without which the performance would have been lower. The Fund’s returns assume thereinvestment of all dividends and distributions at prices obtained under the Fund’s dividendreinvestment plan.
TAX INFORMATION—2017 (Unaudited)
Pursuant to the Jobs and Growth Relief Reconciliation Act of 2003, the Fund designates qualifieddividend income of $5,975,484. The Fund designates tax-exempt income distributions of $1,293,103.Additionally, 15.57% of the ordinary dividends qualified for the dividends received deduction availableto corporations.
REINVESTMENT PLAN
The Fund has a dividend reinvestment plan commonly referred to as an “opt-out” plan (the Plan).Each common shareholder who participates in the Plan will have all distributions of dividends andcapital gains (Dividends) automatically reinvested in additional common shares by Computershare asagent (the Plan Agent). Shareholders who elect not to participate in the Plan will receive all Dividends incash paid by check mailed directly to the shareholder of record (or if the shares are held in street orother nominee name, then to the nominee) by the Plan Agent, as dividend disbursing agent.Shareholders whose common shares are held in the name of a broker or nominee should contact thebroker or nominee to determine whether and how they may participate in the Plan.
The Plan Agent serves as agent for the shareholders in administering the Plan. After the Funddeclares a Dividend, the Plan Agent will, as agent for the shareholders, either: (i) receive the cashpayment and use it to buy common shares in the open market, on the NYSE or elsewhere, for theparticipants’ accounts or (ii) distribute newly issued common shares of the Fund on behalf of theparticipants.
The Plan Agent will receive cash from the Fund with which to buy common shares in the openmarket if, on the Dividend payment date, the NAV per share exceeds the market price per share plusestimated brokerage commissions on that date. The Plan Agent will receive the Dividend in newlyissued common shares of the Fund if, on the Dividend payment date, the market price per share plusestimated brokerage commissions equals or exceeds the NAV per share of the Fund on that date. Thenumber of shares to be issued will be computed at a per share rate equal to the greater of (i) the NAV or(ii) 95% of the closing market price per share on the payment date.
26

COHEN & STEERS CLOSED-END OPPORTUNITY FUND, INC.
If the market price per share is less than the NAV on a Dividend payment date, the Plan Agent willhave until the last business day before the next ex-dividend date for the common stock, but in no eventmore than 30 days after the Dividend payment date (as the case may be, the Purchase Period), toinvest the Dividend amount in shares acquired in open market purchases. If at the close of business onany day during the Purchase Period on which NAV is calculated the NAV equals or is less than themarket price per share plus estimated brokerage commissions, the Plan Agent will cease making openmarket purchases and the uninvested portion of such Dividends shall be filled through the issuance ofnew shares of common stock from the Fund at the price set forth in the immediately precedingparagraph.
Participants in the Plan may withdraw from the Plan upon notice to the Plan Agent. Suchwithdrawal will be effective immediately if received not less than ten days prior to a Dividend recorddate; otherwise, it will be effective for all subsequent Dividends. If any participant elects to have the PlanAgent sell all or part of his or her shares and remit the proceeds, the Plan Agent is authorized to deducta $15.00 fee plus $0.10 per share brokerage commissions.
The Plan Agent’s fees for the handling of reinvestment of Dividends will be paid by the Fund.However, each participant will pay a pro rata share of brokerage commissions incurred with respect tothe Plan Agent’s open market purchases in connection with the reinvestment of Dividends. Theautomatic reinvestment of Dividends will not relieve participants of any income tax that may be payableor required to be withheld on such Dividends.
The Fund reserves the right to amend or terminate the Plan. All correspondence concerning thePlan should be directed to the Plan Agent at 800-432-8224.
OTHER INFORMATION
A description of the policies and procedures that the Fund uses to determine how to vote proxiesrelating to portfolio securities is available (i) without charge, upon request, by calling 800-330-7348,(ii) on our website at cohenandsteers.com or (iii) on the SEC’s website at http://www.sec.gov. Inaddition, the Fund’s proxy voting record for the most recent 12-month period ended June 30 is availableby August 31 of each year (i) without charge, upon request, by calling 800-330-7348 or (ii) on the SEC’swebsite at http://www.sec.gov.
The Fund files its complete schedule of portfolio holdings with the SEC for the first and thirdquarters of each fiscal year on Form N-Q. The Fund’s Forms N-Q are available (i) without charge, uponrequest, by calling 800-330-7348 or (ii) on the SEC’s website at http://www.sec.gov. In addition, theForms N-Q may be reviewed and copied at the SEC’s Public Reference Room in Washington, DC.Information on the operation of the Public Reference Room may be obtained by calling 800-SEC-0330.
Please note that distributions paid by the Fund to shareholders are subject to recharacterization fortax purposes and are taxable up to the amount of the Fund’s investment company taxable income andnet realized gains. Distributions in excess of the Fund’s net investment company taxable income andrealized gains are a return of capital distributed from the Fund’s assets. To the extent this occurs, theFund’s shareholders of record will be notified of the estimated amount of capital returned toshareholders for each such distribution and this information will also be available atcohenandsteers.com. The final tax treatment of all distributions is reported to shareholders on their1099-DIV forms, which are mailed after the close of each calendar year. Distributions of capital
27

COHEN & STEERS CLOSED-END OPPORTUNITY FUND, INC.
decrease the Fund’s total assets and, therefore, could have the effect of increasing the Fund’s expenseratio. In addition, in order to make these distributions, the Fund may have to sell portfolio securities at aless than opportune time.
Notice is hereby given in accordance with Rule 23c-1 under the 1940 Act that the Fund maypurchase, from time to time, shares of its common stock in the open market.
Election of Additional Director
Effective September 12, 2017, the Board of Directors voted to increase the number of directors onthe Fund’s Board of Directors from twelve to thirteen and elected Daphne L. Richards as a Director ofthe Fund.
In addition to her tenure as a Director of various Cohen & Steers Funds, Ms. Richards has servedas an Independent Director of Cartica Management, LLC since 2015. She has also been a Member ofthe Investment Committee of the Berkshire Taconic Community Foundation since 2015, a Member of theAdvisory Board of Northeast Dutchess Fund since 2016, a Member of the “100 Women in Finance”Global Association Board and Chair of its Advisory Council since 2012, and has been the President andCIO of Ledge Harbor Management since 2016. Previously, Ms. Richards worked at Bessemer TrustCompany from 1999 to 2014. Prior thereto, Ms. Richards held investment positions at Frank RussellCompany from 1996 to 1999, Union Bank of Switzerland from 1993 to 1996, Credit Suisse from 1990 to1993, and Hambros International Venture Capital Fund from 1988 to 1989.
Changes to the Board of Directors
On December 5, 2017, the Board of Directors voted to decrease the number of directors on theFund’s Board of Directors from thirteen to ten, effective January 1, 2018. Directors Bonnie Cohen andRichard E. Kroon retired from the Board of Directors on December 31, 2017 pursuant to the Fund’smandatory retirement policy. Director Richard J. Norman resigned from the Board of Directors effectiveDecember 31, 2017.
28

COHEN & STEERS CLOSED-END OPPORTUNITY FUND, INC.
MANAGEMENT OF THE FUND
The business and affairs of the Fund are managed under the direction of the Board of Directors.The Board of Directors approves all significant agreements between the Fund and persons orcompanies furnishing services to it, including the Fund’s agreements with its investment manager,administrator, co-administrator, custodian and transfer agent. The management of the Fund’s day-to-day operations is delegated to its officers, the investment advisor, administrator and co-administrator,subject always to the investment objective and policies of the Fund and to the general supervision of theBoard of Directors.
The Board of Directors and officers of the Fund and their principal occupations during at least thepast five years are set forth below. The statement of additional information (SAI) includes additionalinformation about fund directors and is available, without charge, upon request by calling 800-330-7348.
Name, Address andYear of Birth1
Position(s) HeldWith Fund
Term ofOffice2
Principal OccupationDuring At LeastThe Past 5 Years(Including Other
Directorships Held)
Number ofFunds Within
FundComplex
Overseen byDirector(Includingthe Fund)
Lengthof TimeServed3
Interested Directors4
Robert H. Steers . . . . .Year of Birth: 1953
Director,Chairman
Until NextElection ofDirectors
Chief Executive Officer ofCohen & Steers CapitalManagement, Inc. (CSCMor the Advisor) and itsparent, Cohen & Steers,Inc. (CNS) since 2014. Priorto that, Co-Chairman andCo-Chief Executive Officerof the Advisor since 2003and CNS since 2004. Priorto that, Chairman of theAdvisor; Vice President ofCohen & SteersSecurities, LLC.
22 Since 1991
Joseph M. Harvey . . . .Year of Birth: 1963
Director Until NextElection ofDirectors
President and ChiefInvestment Officer of theAdvisor (since 2003) andPresident of CNS (since2004). Prior to that, SeniorVice President and Directorof Investment Research ofCSCM.
22 Since 2014
(table continued on next page)
29

COHEN & STEERS CLOSED-END OPPORTUNITY FUND, INC.
(table continued from previous page)
Name, Address andYear of Birth1
Position(s) HeldWith Fund
Term ofOffice2
Principal OccupationDuring At LeastThe Past 5 Years(Including Other
Directorships Held)
Number ofFunds Within
FundComplex
Overseen byDirector(Includingthe Fund)
Lengthof TimeServed3
Disinterested DirectorsMichael G. Clark . . . . .Year of Birth: 1965
Director Until NextElection ofDirectors
From 2006 to 2011, Presidentand Chief Executive Officer ofDWS Funds and ManagingDirector of Deutsche AssetManagement.
22 Since2011
Bonnie Cohen . . . . . . .Year of Birth: 1942
Director —5 Consultant. Board Member,DC Public Library Foundationsince 2012, President since2014; Board member, TellurideMountain Film Festival since2010; Trustee, H. RubensteinFoundation since 1996;Trustee, District of ColumbiaPublic Libraries from 2004 to2014.
22 Since2001
George Grossman . . .Year of Birth: 1953
Director Until NextElection ofDirectors
Attorney-at-law. 22 Since1993
(table continued on next page)
30

COHEN & STEERS CLOSED-END OPPORTUNITY FUND, INC.
(table continued from previous page)
Name, Address andYear of Birth1
Position(s) HeldWith Fund
Term ofOffice2
Principal OccupationDuring At LeastThe Past 5 Years(Including Other
Directorships Held)
Number ofFunds Within
FundComplex
Overseen byDirector(Includingthe Fund)
Lengthof TimeServed3
Dean Junkans . . . . . . .Year of Birth: 1959
Director Until NextElection ofDirectors
C.F.A.; Adjunct Professor andExecutive -In -Residence, BethelUniversity since 2015; ChiefInvestment Officer at Wells FargoPrivate Bank from 2004 to 2014and Chief Investment Officer ofthe Wealth, Brokerage andRetirement group at WellsFargo & Company from 2011 to2014; Former member andChair, Claritas AdvisoryCommittee at the CFA Institutefrom 2013 to 2015; BoardMember and InvestmentCommittee member, BethelUniversity Foundation since2010; formerly CorporateExecutive Board Member of theNational Chief InvestmentOfficers Circle, 2010 to 2015;formerly, Member of the Boardof Governors of the University ofWisconsin Foundation, RiverFalls, 1996 to 2004; U.S. ArmyVeteran, Gulf War.
22 Since2015
Richard E. Kroon . . . . .Year of Birth: 1942
Director —5 Former member of InvestmentCommittee, MonmouthUniversity from 2004 to 2016;Former Director, RetiredChairman and ManagingPartner of Sprout Group venturecapital funds, then an affiliate ofDonaldson, Lufkin and JenretteSecurities Corporation from1981 to 2001. Former Director ofthe National Venture CapitalAssociation from 1997 to 2000,and Chairman for the year 2000.
22 Since2004
(table continued on next page)
31

COHEN & STEERS CLOSED-END OPPORTUNITY FUND, INC.
(table continued from previous page)
Name, Address andYear of Birth1
Position(s) HeldWith Fund
Term ofOffice2
Principal OccupationDuring At LeastThe Past 5 Years(Including Other
Directorships Held)
Number ofFunds Within
FundComplex
Overseen byDirector(Includingthe Fund)
Lengthof TimeServed3
Gerald J. Maginnis . . .Year of Birth: 1955
Director Until NextElection ofDirectors
Philadelphia Office ManagingPartner, KPMG LLP from 2006to 2015; Partner in Charge,KPMG Pennsylvania AuditPractice from 2002 to 2008;President, PennsylvaniaInstitute of Certified PublicAccountants (PICPA) from2014 to 2015; member, PICPABoard of Directors from 2012 to2016; member, Council of theAmerican Institute of CertifiedPublic Accountants (AICPA)from 2014 to 2017; member,Board of Trustees of AICPAFoundation since 2015.
22 Since2015
Jane F. Magpiong . . . .Year of Birth: 1960
Director Until NextElection ofDirectors
President, Untap Potentialsince 2013; Board Member,Crespi High School, from 2014to 2017; Senior ManagingDirector, TIAA-CREF, from2011 to 2013; National Head ofWealth Management, TIAA-CREF, from 2008 to 2011; andprior to that, President, Bank ofAmerica Private Bank from2005 to 2008.
22 Since2015
(table continued on next page)
32

COHEN & STEERS CLOSED-END OPPORTUNITY FUND, INC.
(table continued from previous page)
Name, Address andYear of Birth1
Position(s) HeldWith Fund
Term ofOffice2
Principal OccupationDuring At LeastThe Past 5 Years(Including Other
Directorships Held)
Number ofFunds Within
FundComplex
Overseen byDirector(Includingthe Fund)
Lengthof TimeServed3
Richard J. Norman . . .Year of Birth: 1943
Director —5 Private Investor. Member,Montgomery County, MarylandDepartment of CorrectionsVolunteer Corps. since 2010;Liaison for BusinessLeadership, Salvation ArmyWorld Service Organization(SAWSO) since 2010; AdvisoryBoard Member, The SalvationArmy since 1985; Prior thereto,Investment Representative ofMorgan Stanley Dean Witterfrom 1966 to 2000.
22 Since2001
(table continued on next page)
33

COHEN & STEERS CLOSED-END OPPORTUNITY FUND, INC.
(table continued from previous page)
Name, Address andYear of Birth1
Position(s) HeldWith Fund
Term ofOffice2
Principal OccupationDuring At LeastThe Past 5 Years(Including Other
Directorships Held)
Number ofFunds Within
FundComplex
Overseen byDirector(Includingthe Fund)
Lengthof TimeServed3
Daphne L. Richards . .Year of Birth: 1966
Director Until NextElection ofDirectors
Independent Director ofCartica Management, LLCsince 2015; Member of theInvestment Committee of theBerkshire TaconicCommunity Foundationsince 2015; Member of theAdvisory Board of NortheastDutchess Fund since 2016;Member of the 100 Womenin Finance GlobalAssociation Board and Chairof its Advisory Council since2012; President and CIO ofLedge Harbor Managementsince 2016; Previously,worked at Bessemer TrustCompany from 1999 to2014; Prior thereto, Ms.Richards held investmentpositions at Frank RussellCompany from 1996 to1999,Union Bank of Switzerlandfrom 1993 to 1996; CreditSuisse from 1990 to 1993;and Hambros InternationalVenture Capital Fund from1988 to 1989.
22 SinceSeptember
2017
(table continued on next page)
34

COHEN & STEERS CLOSED-END OPPORTUNITY FUND, INC.
(table continued from previous page)
Name, Address andYear of Birth1
Position(s) HeldWith Fund
Term ofOffice2
Principal OccupationDuring At LeastThe Past 5 Years(Including Other
Directorships Held)
Number ofFunds Within
FundComplex
Overseen byDirector(Includingthe Fund)
Lengthof TimeServed3
Frank K. Ross . . . . . . . .Year of Birth: 1943
Director Until NextElection ofDirectors
Visiting Professor of Accountingand Director of the Center forAccounting Education atHoward University School ofBusiness since 2004; Boardmember and member of AuditCommittee (Chairman from2007 to 2012) and HumanResources and CompensationCommittee Member, PepcoHoldings, Inc. (electric utility)from 2004 to 2014; Formerly,Mid-Atlantic Area ManagingPartner for Assurance Servicesat KPMG LLP and ManagingPartner of its Washington, DCoffices from 1995 to 2003.
22 Since2004
C. Edward Ward, Jr. . .Year of Birth: 1946
Director Until NextElection ofDirectors
Member of The Board ofTrustees of Manhattan College,Riverdale, New York from 2004to 2014. Formerly, Director ofclosed-end fund managementfor the NYSE where he workedfrom 1979 to 2004.
22 Since2004
1 The address for each director is 280 Park Avenue, New York, NY 10017.2 On March 12, 2008, the Board of Directors adopted a mandatory retirement policy stating a Director
must retire from the Board on December 31st of the year in which he or she turns 75 years of age.3 The length of time served represents the year in which the Director was first elected or appointed to
any fund in the Cohen & Steers fund complex.4 “Interested person” as defined in the 1940 Act, of the Fund because of affiliation with CSCM
(Interested Directors).5 Bonnie Cohen and Richard E. Kroon retired from the Board of Directors on December 31, 2017
pursuant to the Fund’s mandatory retirement policy. Richard J. Norman resigned from the Board ofDirectors effective December 31, 2017.
35

COHEN & STEERS CLOSED-END OPPORTUNITY FUND, INC.
The officers of the Fund (other than Messrs. Steers and Harvey, whose biographies are providedabove), their address, their year of birth and their principal occupations for at least the past five yearsare set forth below.
Name, Address andYear of Birth1
Position(s) HeldWith Fund Principal Occupation During At Least the Past 5 Years
Lengthof TimeServed2
Adam M. Derechin . . . . .1964
President andChief Executive
Officer
Chief Operating Officer of CSCM since 2003 and CNSsince 2004.
Since 2005
Douglas R. Bond . . . . . . .1959
Vice President Executive Vice President of CSCM since 2004. Since 2007
Yigal D. Jhirad . . . . . . . . .1965
Vice President Senior Vice President of CSCM since 2007. Since 2007
Francis C. Poli . . . . . . . . .1962
Secretary andChief Legal
Officer
Executive Vice President, Secretary and GeneralCounsel of CSCM and CNS since March 2007.
Since 2007
James Giallanza . . . . . . .1966
Chief FinancialOfficer
Executive Vice President of CSCM since 2014. Prior tothat, Senior Vice President of CSCM since 2006.
Since 2006
Albert Laskaj . . . . . . . . . .1977
Treasurer Vice President of CSCM since 2015. Prior to that,Director of Legg Mason & Co. since 2013. VicePresident of Legg Mason from 2008 to 2013 andTreasurer of certain mutual funds since 2010.
Since 2015
Lisa D. Phelan . . . . . . . . .1968
ChiefCompliance
Officer
Executive Vice President of CSCM since 2015. Prior tothat, Senior Vice President of CSCM since 2008. ChiefCompliance Officer of CSCM, the Cohen & Steersfunds, Cohen & Steers Asia Limited and CSSL since2007, 2006, 2005 and 2004, respectively.
Since 2006
1 The address of each officer is 280 Park Avenue, New York, NY 10017.2 Officers serve one-year terms. The length of time served represents the year in which the officer was
first elected as an officer of any fund in the Cohen & Steers fund complex. All of the officers listedabove are officers of one or more of the other funds in the complex.
36

COHEN & STEERS CLOSED-END OPPORTUNITY FUND, INC.
Cohen & Steers Privacy Policy
Facts What Does Cohen & Steers Do With Your Personal Information?
Why?
Financial companies choose how they share your personal information.Federal law gives consumers the right to limit some but not all sharing.Federal law also requires us to tell you how we collect, share, and protect yourpersonal information. Please read this notice carefully to understand what wedo.
What?
The types of personal information we collect and share depend on the productor service you have with us. This information can include:• Social Security number and account balances• Transaction history and account transactions• Purchase history and wire transfer instructions
How?All financial companies need to share customers’ personal information to runtheir everyday business. In the section below, we list the reasons financialcompanies can share their customers’ personal information; the reasonsCohen & Steers chooses to share; and whether you can limit this sharing.
Reasons we can share your personal informationDoes Cohen & Steers
share?Can you limit this
sharing?
For our everyday business purposes—such as to process your transactions, maintain youraccount(s), respond to court orders and legalinvestigations, or reports to credit bureaus
Yes No
For our marketing purposes—to offer our products and services to you
Yes No
For joint marketing with other financial companies— No We don’t share
For our affiliates’ everyday business purposes—information about your transactions andexperiences
No We don’t share
For our affiliates’ everyday business purposes—information about your creditworthiness
No We don’t share
For our affiliates to market to you— No We don’t share
For non-affiliates to market to you— No We don’t share
Questions? Call 800.330.7348
37

COHEN & STEERS CLOSED-END OPPORTUNITY FUND, INC.
Cohen & Steers Privacy Policy—(Continued)
Who we are
Who is providing this notice?Cohen & Steers Capital Management, Inc., Cohen & Steers Asia Limited,Cohen & Steers Japan, LLC, Cohen & Steers UK Limited, Cohen & SteersSecurities, LLC, Cohen & Steers Private Funds and Cohen & Steers Open andClosed-End Funds (collectively, Cohen & Steers).
What we do
How does Cohen & Steersprotect my personalinformation?
To protect your personal information from unauthorized access and use, weuse security measures that comply with federal law. These measures includecomputer safeguards and secured files and buildings. We restrict access toyour information to those employees who need it to perform their jobs, andalso require companies that provide services on our behalf to protect yourinformation.
How does Cohen & Steerscollect my personalinformation?
We collect your personal information, for example, when you:• Open an account or buy securities from us• Provide account information or give us your contact information• Make deposits or withdrawals from your accountWe also collect your personal information from other companies.
Why can’t I limit all sharing?
Federal law gives you the right to limit only:• sharing for affiliates’ everyday business purposes—information about your
creditworthiness• affiliates from using your information to market to you• sharing for non-affiliates to market to youState law and individual companies may give you additional rights to limitsharing.
Definitions
AffiliatesCompanies related by common ownership or control. They can be financialand nonfinancial companies.• Cohen & Steers does not share with affiliates.
Non-affiliatesCompanies not related by common ownership or control. They can befinancial and nonfinancial companies.• Cohen & Steers does not share with non-affiliates.
Joint marketingA formal agreement between non-affiliated financial companies that togethermarket financial products or services to you.• Cohen & Steers does not jointly market.
38

COHEN & STEERS CLOSED-END OPPORTUNITY FUND, INC.
Cohen & Steers Investment Solutions
COHEN & STEERS REAL ASSETS FUND
• Designed for investors seeking total return andthe maximization of real returns during inflationaryenvironments by investing primarily in real assets
• Symbols: RAPAX, RAPCX, RAPIX, RAPRX, RAPZXCOHEN & STEERS
INSTITUTIONAL GLOBAL REALTY SHARES
• Designed for institutional investors seeking totalreturn, investing primarily in global real estatesecurities
• Symbol: GRSIXCOHEN & STEERS GLOBAL REALTY SHARES
• Designed for investors seeking total return, investingprimarily in global real estate equity securities
• Symbols: CSFAX, CSFCX, CSSPX, GRSRX, CSFZXCOHEN & STEERS REALTY SHARES
• Designed for investors seeking total return,investing primarily in U.S. real estate securities
• Symbol: CSRSX
COHEN & STEERS REAL ESTATE SECURITIES FUND
• Designed for investors seeking total return,investing primarily in U.S. real estate securities
• Symbols: CSEIX, CSCIX, CREFX, CSDIX, CIRRX,CSZIXCOHEN & STEERS INSTITUTIONAL REALTY SHARES
• Designed for institutional investors seeking totalreturn, investing primarily in U.S. real estatesecurities
• Symbol: CSRIXCOHEN & STEERS INTERNATIONAL REALTY FUND
• Designed for investors seeking total return,investing primarily in international (non-U.S.) realestate securities
• Symbols: IRFAX, IRFCX, IRFIX, IRFRX, IRFZX
COHEN & STEERSACTIVE COMMODITIES STRATEGY FUND
• Designed for investors seeking total return,investing primarily in a diversified portfolio ofexchange-traded commodity future contracts andother commodity-related derivative instruments
• Symbols: CDFAX, CDFCX, CDFIX, CDFRX, CDFZXCOHEN & STEERS GLOBAL INFRASTRUCTURE FUND
• Designed for investors seeking total return,investing primarily in global infrastructure securities
• Symbols: CSUAX, CSUCX, CSUIX, CSURX, CSUZXCOHEN & STEERS
MLP & ENERGY OPPORTUNITY FUND
• Designed for investors seeking total return,investing primarily in midstream energy masterlimited partnership (MLP) units and related stocks
• Symbols: MLOAX, MLOCX, MLOIX, MLORX, MLOZXCOHEN & STEERS
LOW DURATION PREFERRED AND INCOME FUND
• Designed for investors seeking high currentincome and capital preservation by investing inlow-duration preferred and other income securitiesissued by U.S. and non-U.S. companies
• Symbols: LPXAX, LPXCX, LPXIX, LPXRX, LPXZXCOHEN & STEERS
PREFERRED SECURITIES AND INCOME FUND
• Designed for investors seeking total return (highcurrent income and capital appreciation), investingprimarily in preferred and debt securities issued byU.S. and non-U.S. companies
• Symbols: CPXAX, CPXCX, CPXFX, CPXIX,CPRRX, CPXZX
COHEN & STEERS DIVIDEND VALUE FUND
• Designed for investors seeking long-term growthof income and capital appreciation, investingprimarily in dividend paying common stocks andpreferred stocks
• Symbols: DVFAX, DVFCX, DVFIX, DVFRX, DVFZXDistributed by Cohen & Steers Securities, LLC.
COHEN & STEERS GLOBAL REALTY MAJORS ETF• Designed for investors who seek a relatively
low-cost passive approach for investing in aportfolio of global real estate equity securities ofcompanies in a specified index
• Symbol: GRI
Distributed by ALPS Distributors, Inc.
ISHARES COHEN & STEERS REALTY MAJORS INDEX FUND
• Designed for investors who seek a relativelylow-cost passive approach for investing in aportfolio of U.S. real estate equity securities ofcompanies in a specified index
• Symbol: ICF
Distributed by SEI Investments Distribution Co.
Please consider the investment objectives, risks, charges and expenses of any Cohen & Steers U.S. registeredopen-end fund carefully before investing. A summary prospectus and prospectus containing this and otherinformation can be obtained by calling 800-330-7348 or by visiting cohenandsteers.com. Please read thesummary prospectus and prospectus carefully before investing.
39

COHEN & STEERS CLOSED-END OPPORTUNITY FUND, INC.
OFFICERS AND DIRECTORS
Robert H. SteersDirector and ChairmanJoseph M. HarveyDirector and Vice PresidentMichael G. ClarkDirectorBonnie CohenDirectorGeorge GrossmanDirectorDean JunkansDirectorRichard E. KroonDirectorGerald J. MaginnisDirectorJane F. MagpiongDirectorRichard J. NormanDirectorDaphne L. RichardsDirectorFrank K. RossDirectorC. Edward Ward, Jr.DirectorAdam M. DerechinPresident and Chief Executive OfficerDouglas R. BondVice PresidentYigal D. JhiradVice PresidentFrancis C. PoliSecretary and Chief Legal OfficerJames GiallanzaChief Financial OfficerAlbert LaskajTreasurerLisa D. PhelanChief Compliance Officer
KEY INFORMATION
Investment ManagerCohen & Steers Capital Management, Inc.280 Park AvenueNew York, NY 10017(212) 832-3232
Co-administrator and CustodianState Street Bank and Trust CompanyOne Lincoln StreetBoston, MA 02111
Transfer AgentComputershare480 Washington BoulevardJersey City, NJ 07310(866) 227-0757
Legal CounselRopes & Gray LLP1211 Avenue of the AmericasNew York, NY 10036
New York Stock Exchange Symbol: FOFWebsite: cohenandsteers.com
This report is for shareholder information. This isnot a prospectus intended for use in thepurchase or sale of Fund shares. Performancedata quoted represent past performance. Pastperformance is no guarantee of future resultsand your investment may be worth more or lessat the time you sell your shares.
40