long term effect of nutrient management on soil quality … term...tinuous intensive cropping system...
TRANSCRIPT
Agropedology 2012,22 (2), J03-JJ4
Long term effect of nutrient management on soil quality and sustainable productivity under sorghum-wheat crop sequence in
Vertisol of Akola, Maharashtra
R. N. KATKAR\ V. K. KHARCHE\ B. A. SONUNE\ R. H. WANJARI2 AND MUNESHWAR SINGU2
I Department of Soil Science and Agricultural Chemistry, Dr PDKV, Akola- 444 J 04, India clndian Institute of Soil Science, Bhopal-462 038, India
Introduction
Abstract: A long term experiment was conducted with the objective of assessing the
impact of continuous application of chemical fertilizers and manures on properties of
soil, key indicators of soil quality and yield sustain ability under sorghum (Sorghum
vulgare) - wheat (Triticum aestivum) cropping sequence, The experiment was con
ducted in randomized block design since 1988 on Vertisols at the same site and with the
same randomization at AkoJa in Central India as one of the centres of AICRP on Long
Term Fertilizer Experiment. The treatments comprised of differential fertilizer levels of
NPK, sulphur free and 37.5 kg sulphur ha- I with RDF, 2.5 kg zinc ha- l with RDF, only
recommended nitrogen and nitrogen and phosphorus, farmyard manure @ lOt ha- I to
sorghum crop only singly and in combination with 100% NPK to sorghum and only
100% NPK to wheat crop. The long term yield data from 1988 to 2007 of both the crops
was used to study sustainability yield index which were found to be relatively higher in
super optimal fertilizer dose (0.436) followed by 100% RDF + FYM (0.432) and
100% RDF + sulphur (0.421). Howev.er, the highest soil quality index was observed
under integrated nutrient management comprising of 100% NPK + FYM (2.45), fol
lowed by only FYM (2.16) and 150% NPK ofRDF (2.15) while the lowest was in the
control (1.14) followed by 50% NPK of RDF (1.45) indicating considerable enhance
ment in soil quality due to integrated nutrient management. Among the various treat
ments' 100% RDF + FYM not only had the highest soil quality index but it was found as
the most promising approach from the view point of yield sustainability, maintaining
higher average yields under sorghum - wheat cropping sequence.
Additional key words: Soil quality, sustainability yield index. FYM, chemicalfertilizers, cropping system
Soil is a key natural resource and soil quality is the integrated effect of management on most soil proper
ties that determine crop productivity and sustainability. Growing of crops one after another without giving due consideration to nutrient requirement has resulted in decline in soil fertility (Ghosh et. ai. 2003). Soil quality
assessment has been suggested as an effective tool for
evaluating sustainability of soil and crop management practices (Hussain et. ai. 1999). Soil quality assessment is purpose'oriented and site-specific (Karlen et. al. 1994). For assessing the soil quality, indicators (soil properties) are usually linked to soil function (Doran and Parkin
1994). Improved soil quality often is indicated by increased infiltration, aeration, aggregate size and stabil
ity, soil organic matter, microbial biomass and by de-
104
creased bulk density. A valid soil quality index is helpful
to interpret the data from different soil measurements and
shows whether management and land use are having the
desired results for producti vity and environmental pro
tection. Maintaining the soil quality at desirable level is
very complex issue due to involvement of climatic, soil,
plant and human factors and their interactions.
There is an urgent need to adopt appropriate
soil and plant management practices so as to reduce soil
degradation and maintain soil quality at desired level. As
temperature increases and precipitation decreases, theoxi
dation of organic matter becomes faster which leads to
unsustainable farming. Soil quality research has focused
on the linkages among management practices and ob
servable soil characteristics, soil processes and perfor·
mance of soil functions. The recommended dose of NPK
fertilizers alone does not sustain productivity under con
tinuous intensive cropping system (Yaduwanshi 2003)
whereas inclusion of organic manures improves physical
properties (Mandai et. al. 2003), the biological soil sta
tus (Ghai et.aL 1988), soil fertility and crop yields
(Swarup 1987; Mandai et. aL 2003). Several chemical,
physical and biological indicators have been evaluated
in present study using the data collected from a long term
fertilizer management experiment on sorghum-wheat
cropping system and soil quality was evaluated.
Materials and Methods
Field site, experimental layout and treatments A permanenl field experiment was laid out in 1988
at Research Farm, Department of Soil Science and Agricul
tural Chemistry (20042' N, 77"04' E, 308 m above MSL), Dr. Panjabrao Deshmukh Krishi Vidyapeeth, Akola, Maharashtra.
The climate of the region is semi-arid tropical. The mean an·
nual rainfall is 805 mm. The soil of the experimental site be
longs to Wardha series (Fine, smectitic, hyperthermic Typic
Haplusterts). The soil properties at the start of experiment had
210 mm m" AWC and547 mm hr' hydraulic conductivity. The soil has alkaline pH (8.1 ) . high CEC (48 c mol (p+) kg'), high
base saturation (98%), moderate organic carbon (4.6 g kg"), low P (8.4 kg ha"), high K (358 kg ha") and marginal available
S (11.8 mg kg") and available Zn (0.62 mg kg· ').
The experiment was laid out in randomized
block design with fourreplieations and twelve treatments
[T, : 50% recommended dose of N:P20
S:KP, T2: 100%
recommended dose of N:P,0 5:K20, T3: 150% recom-
R N. Katkar et al.
mended dose of N:Pps:KP, T4
: 100% recommended
dose of N:PzOs:K20 (S free), Ts: 100% recommended
dose of N:P20S:~O + 2.5 kg Zn ha·1, To: 100% recom
mended dose of N:P20 s,T7
: 100% recommended dose
ofN, Tg : 100 % recommended dose of N:PzOs:K20 + 10
t FYM ha·1 (kharij), T9 : 100 % recommended dose of
N:P20S:K
20 + 37.5 kg S ha· I
, TIO: FYM only @ 10 t ha"
(kharij), Til: 75% recommended dose of N:Pps:KP,
Til: Control (no fertilizer and manure)). The Farmyard
manure was applied one month before sowing of sor
ghum crop as per treatments. The recommended NPK
dose for sQrghum (Sorghum vulgare) was 100:50:40 and
for wheat (Triticum aestivum) as 120:60:60 N, P and K
kg ha-1• The half dose of N and full P and K was applied
at the time of sowing and remaining half N was applied
as urea after one month to sorghum and after 21 days to
wheat after sowing as per the treatments. Phosphorus was ap
plied through diammonium phosphate to T, and T9 treatments
only. Nitrogen, P and K were applied through urea, single su
per phosphate and muriate of potash respectively as per treat
ments. Sulphur was applied as gypsum to each crop as per treat
men!. Zinc application was done through zinc sulphate once in
every two years to sorghum crop only. Sorghum (cv CSH 9)
was grown as f'ainfed crop. The wheat (cv AKW 1071) crop
was sown in the month of November keeping a distance of
22.5 cm row spacing. Irrigations were applied to wheat crop at
critical growth stages considering the moisture availability.
Soil sampling and analysis
Soil samples were collected from 0 to 20 cm
soil depth after harvest of wheat in 2007 at the end of
nineteenth cropping cycle and were analysed for various
physical, chemical and biological parameters. The physi
cal parameters included aggregate size distribution (Yoder
1936) and values were expressed as mean weight diam
eter (MWD) after oven drying. Bulk density was deter
mined by the core method (Blake and Hartze 1986).
Hydraulic conductivity was determined by constant head
method (Klute and Dirksen \986). Soil water retention
at permanent wilting point (PWP) and field capacity (FC)
were measured in pressure plate apparatus at 33 kPa and
1500 kPa. The difference between PWP and FC was cal
culated as available water. A part of representative soil
sample of each soil sample were air dried. powdered and
passed through 0.2 mm sieve for determination of or-
Long term effect of nutrient management
ganic carbon by Walkley and Black's method (Jackson
] 967). Total nitrogen was determined by using micro
processor based KEL PLUS digestion system and distilled using KEL PLUS automatic distillation system
based on Principal of modified Kjeldahl method (Jack
son 1967). Available P was determined by sodium bicar
bonate extraction and subsequent colorimetric analysis
(Olsen et al. 1954). Available K was determined by neu
tral ammonium acetate extraction and followed by emis
sion spectrophotometry (Knudsen and Peterson 1982).
Available sulphur was determined after extracting with
CaCl2
and followed by spectrophotometry (Chesnin and
Yien 1951). Electrical conductivity and pH were deter
mined using conductivity and pH meter. Microbial bio
mass carbon (MBC) and nitrogen (MBN) determinations
were made by using chloroform fumigation and extrac
tion technique (Jenkinson and Powlson 1976; Jenkinson
and Ladd 1981). The dehydrogenage activity (DHA) was
estimated by using tri-phenyl tetrazolium chloride
(Lenhard 1956), which was reduced to tripheny1
formazan.
For assessment of soil quality physical parameters
viz., bulk density, mean weight diameter, hydraulic con
ductivity and available water capacity, chemical param
eters viz .• soil pH. electrical conductivity, organic car
bon, total N, available N, P, K, N03
- N and NH4- N and
biological parameters viz., microbial biomass carbon,
microbial biomass nitrogen and dehydrogenage activity
were used and the Principal Component Analysis (PCA)
was carried out. Minimum data set was retained based
on the factor loadings (Doran and Parkin 1994). These
parameters were called soil indicators. Key indicator approach was employed for assessing soil quality index. For calculating the suslainability yield index (SYI) (Singh et al. 1990; Sharma et at. 2004) the following equation was used.
6
SYI=
Ymax
Where, i = Average yield of the treatment.
6 = Treatment standard deviation.
Y max = Maximum yield in the
experiment over the years.
The soil parameters (physical, chemical and bio
logical) which are most sensitive to management prac-
105
tices were determined. After determining the MDS of
indicators: every observation of MDS indicators was
transformed using linear scoring method (Andrews et al.
2002). Indicators were arranged in order depending on
whether a higher value was considered "good" or "bad"
in terms of soil function. For more is better indicators
each observation was divided by the highest value such
that the highest observed value received a score of 1.
For less is better indicators, the lowest observed value
was divided by each observation such that the lowest
observed value received the score of 1. Soil quality in
dex (SQI) was determined by using the following equa
tion (Sharma et al. 2004).
n
SQI = L (WjS)
i=1
Where, W = Factor loading derived from the PCA.
S = Score for subscripted variable.
Results and Discussion
Crop productivity
The yield data indicates that the different fertil
izer treatments recorded significant increase in the grain
yield of sorghum over control (Table 1). The treatment
of 150% NPK (T,) recorded higher grain yield up to the
year 1997. However, 100% NPK + FYM (Tg) was supe
rior in the subsequent years. The superiority of this treat
ment involving integrated nutrient management compo
nents may be due to adequate supply of secondary and
micronutrients through FYM. Moreover, inclusion of
sulphur (T9
) and zinc (T5)also increased the grain yield
to the extent of 14.11 and 8.48 per cent over sulphur free
(T4) and 100% RDF (T2
) respectively. Continuous crop
ping without supplementing even with inorganic fertiliz
ers (T (2) reduced the crop productivity considerably over
a period of20 cropping cycles. Application of only FYM
@ 10 t ha·1 before sowing of sorghum crop reduced the
yield to the tune of 60.4 per cent over 100% NPK and
could not sustain the crop productivity.
The grain yield of wheat (Table 1) showed that
the continuous cropping of sorghum-wheat sequence
without fertilizer application drastically decreased the
106
wheat productivity in the control plots indicating that
application of inorganic fertilizers to both the crops in
the sorghum-wheat cropping sequence is essential. High
est grain yield of wheat was recorded with the applica
tion of 150% NPK during initial nine years, but subse
quently the treatment of 100% NPK + FYM shown its
superiority over 150% NPK. Application of N, K and P
dose through S- free fertilizer (DAP) caused significant
decline in the wheat yield as compared to nutrients sup
plied through S containing fertilizers (SSP), This strongly
indicated the need of sulphur fertilization to the crops
R. N, Katkar et at,
grown in shrink-swell soils of central India. Application
of Zn @ 2,5 kg ha- I once in two years to sorghum crop
did not show much beneficial influence on the wheat pro
ductivity as compared to 100% RDF. Use of FYM @ 10
t ha- ' alone could not sustain the high productivity and
yielded approximately one fourth of the produce obtained
with the application of 100% NPK treatment. Imbalanced
application of 100% N or 100% NP alone could not sus
tain the wheat productivity, This resulted in gradual de
crease in the yield over a period of cropping.
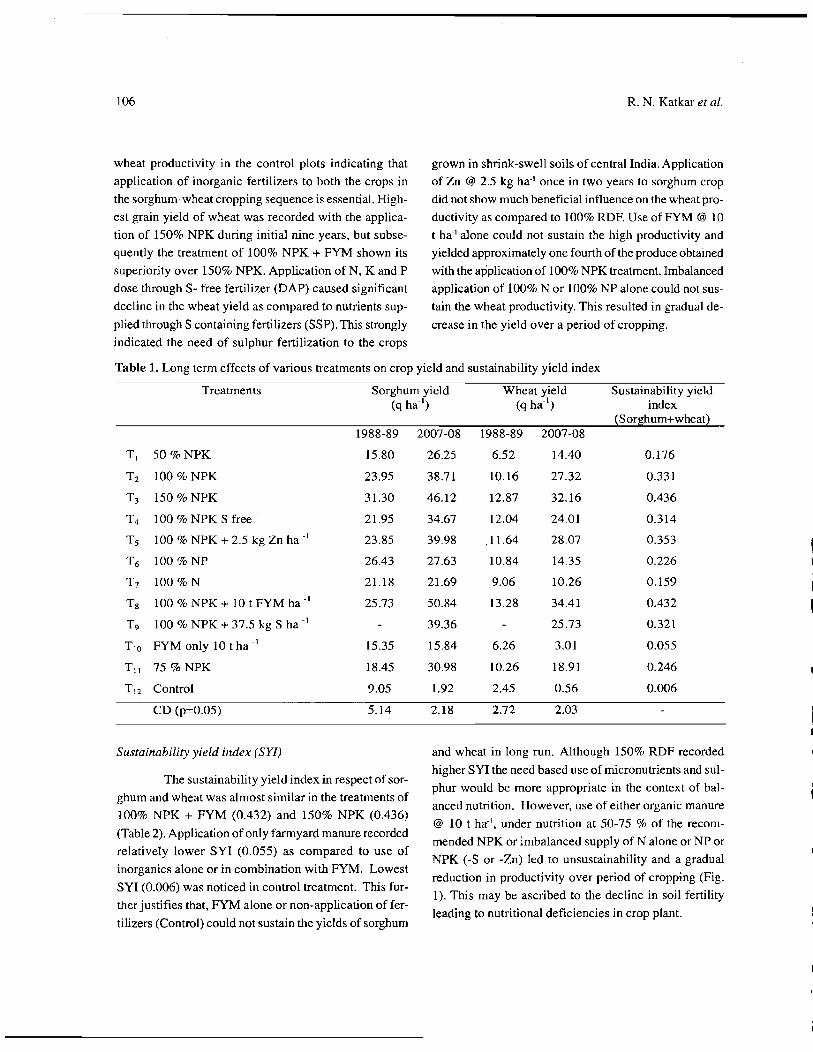
Table 1. Long term effects of various treatments on crop yield and sustainability yield index
Treatments Sorghum yield Wheat yield Sustainability yield (q ha-1) (q ha- 1) index
1988-89
TI 50 %NPK 15.80
T2 100 % NPK 23,95
T3 150 % NPK 31.30
T4 100 % NPK S free 21.95
Ts 100 % NPK + 2.5 kg Zn ha- I 23.85
T6 100 % NP 26.43
T7 100%N 21.18
Ts 100 % NPK + lOt FYM ha -I 25.73
T9 100 % NPK + 37.5 kg S ha -1
TID FYM only 10 t ha -I 15.35
Til 75 % NPK 18.45
TI2 Control 9.05
CD (p",0.05) 5.14
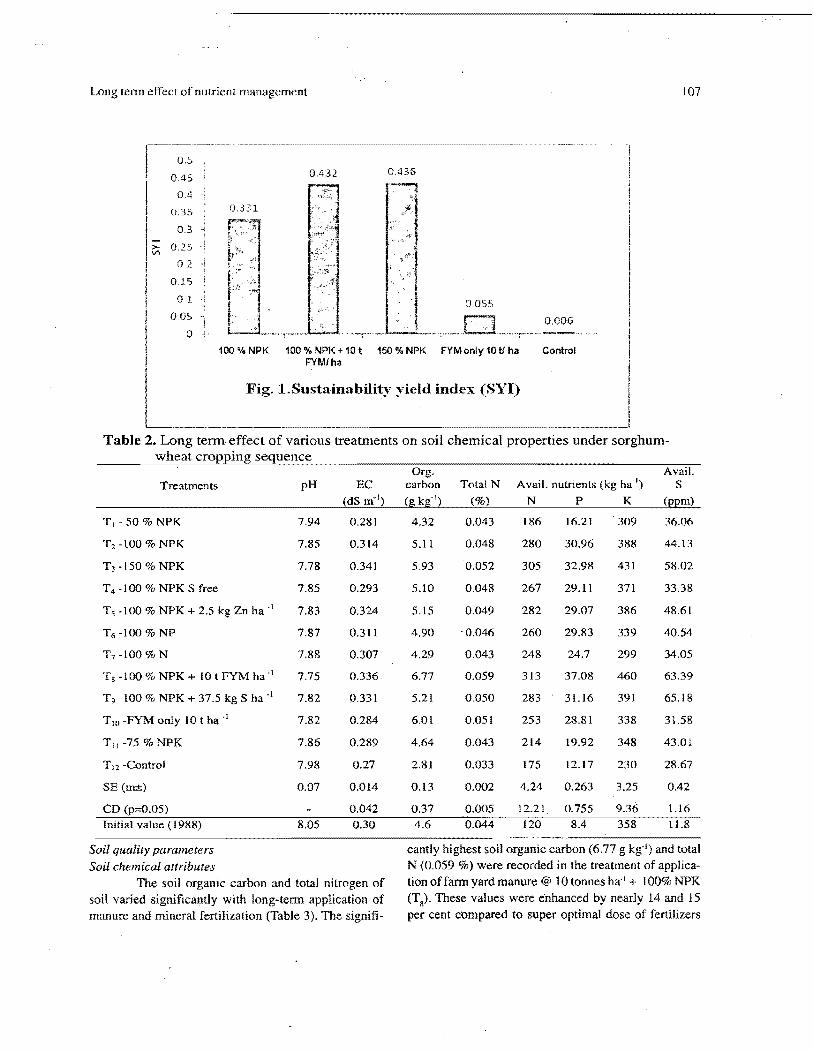
Sustainability yield index (SYl)
The sustainability yield index in respect of sor
ghum and wheat was almost similar in the treatments of
100% NPK + FYM (0.432) and 150% NPK (0.436)
(Table 2). Application of only farmyard manure recorded
relatively lower SYI (0,055) as compared to use of
inorganics alone or in combination with FYM, Lowest
SYI (0.006) was noticed in control treatment. This fur
ther justifies that, FYM alone or non-application of fer
tilizers (Control) could not sustain the yields of sorghum
(Sorghum+wheat) 2007-08 1988-89 2007-08
26.25 6.52 14.40 0,176
38,71 10.16 27.32 0.331
46,12 12.87 32,16 0.436
34.67 12.04 24.01 0.314
39.98 11.64 28.07 0.353
27.63 10.84 14.35 0.226
21.69 9.06 10.26 0.159
50,84 13.28 34.41 0.432
39.36 25,73 0.321
15.84 6.26 3.01 0.055
30.98 10.26 18.91 0.246
1.92 2.45 0,56 0.006
2,18 2,72 2.03
and wheat in long run. Although 150% RDF recorded
higher SYI the need based use of rnicronutrients and sul
phur would be more appropriate in the context of bal
anced nutrition. However, use of either organic manure
@ 10 t ha", under nutrition at 50-75 % of the recom
mended NPK or imbalanced supply of N alone or NP or
NPK (-S or -Zn) led to unsustainability and a gradual
reduction in productivity over period of cropping (Fig.
I). This may be ascribed to the decline in soil fertility
leading to nutritional deficiencies in crop plant.
Long term effect of nutrient management 107
0.5
0,45
0.4 -l
0.35 ~
0.3
>-V\
0,25
0,2
0,15
0,1
005 ..
0
100 % NPK 100 % NPK + 10 t 150 % NPK FYMonly 10 tJ ha Control FYM/ha
Fig. l.SustaiJmbility yield index (SYI)
Table 2. Long tenn effect of various treatments on soil chemical properties under sorghum-
Treatments pH EC carbon Total N Avail. nutrients (kg ha") S
T I -50 %NPK 7.94 0.281 4.32 0.043 186 16.21 309 36.06
T2 -100 % NPK 7.85 0.314 5.11 0.048 280 30.96 388 44.13
T) -150 % NPK 7.78 0.341 5.93 0.052 305 32.98 431 58.02
T4 -100 % NPK S free 7.85 0.293 5.10 0.048 267 29.11 371 33.38
Ts -100 % NPK + 2.5 kg Zn ha·1 7.83 0.324 5.15 0.049 282 29.07 386 48.61
T 6 -100 % NP 7.87 0.311 4.90 '0.046 260 29.83 339 40.54
T 7 -1OO%N 7.88 0.307 4.29 0.043 248 24.7 299 34.05
Tg -100 % NPK + 10 t FYM ha" 7.75 0.336 6.77 0.059 313 37.08 460 63.39
T9 -100 % NPK + 37.5 kg S ha·1 7.82 0.331 5.21 0.050 283 31.16 391 65.18
TlO -FYM only 10 t ha ·1 7.82 0.284 6.01 0.051 253 28.81 338 31.58
Til -75 % NPK 7.86 0.289 4.64 0.043 214 19.92 348 43.01
T 12 -Control 7.98 0.27 2.81 0.033 175 12.17 230 28.67
SE (rn±) 0.07 0.014 0.13 0.002 4.24 0.263 3.25 0.42
CD (p=O.05) 0.042 0.37 0.005 12.21 0.755 9.36 1.16
Initial value (1988) 8.05 0.30 4.6 0.044 120 8.4 358 11.8
Soil quality parameters candy highest soil organic carbon (6.77 g kg· l) and total
Soil chemical attributes N (0.059 %) were recorded in the treatment of applica-
The soil organic carbon and total nitrogen of lion offann yard manure @ 10 tonnes ha" + 100% NPK
soil varied significantly with long-tenn application of (Tg). These values were enhanced by nearly 14 and 15
manure and mineral fertilization (Table 3). The signifi- per cent compared to super optimal dose of fertilizers
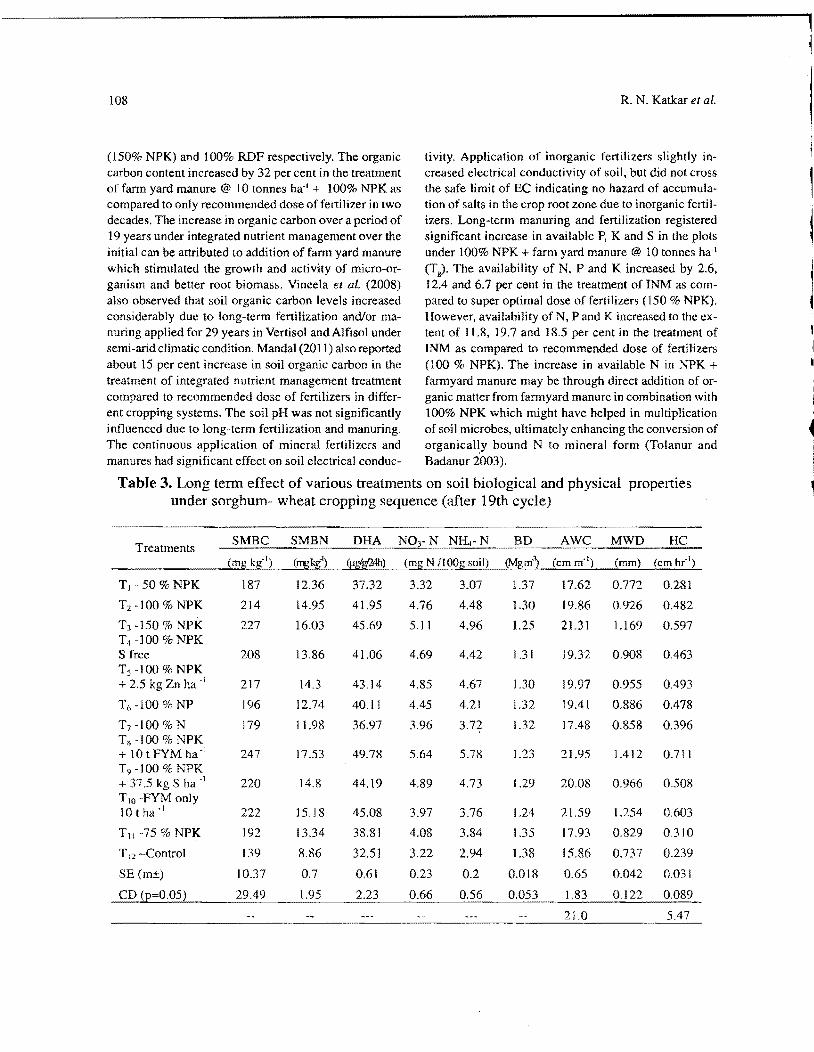
108 R. N. Katkar et at.
(150% NPK) and 100% RDF respectively. The organic tivity. Application of inorganic fertilizers slightly in-carbon content increased by 32 per cent in the treatment creased electrical conductivity of soil, but did not cross of farm yard manure @ 10 tonnes ha-t + 100% NPK as the safe limit of EC indicating no hazard of accumula-compared to only recommended dose of fertilizer in two tion of salts in the crop root zone due to inorganic fertil-decades. The increase in organic carbon over a period of izers. Long-term manuring and fertilization registered 19 years under integrated nutrient management over the significant increase in available P, K and S in the plots initial can be attributed to addition of farm yard manure under 100% NPK + farm yard manure @ 10 tonnes ha-I
which stimulated the growth and activity of micro-or- (Tg). The availability of N. P and K increased by 2.6, ganism and better root biomass. Vineela et al. (2008) 12.4 and 6.7 per cent in the treatment of INM as com-also observed that soil organic carbon levels increased pared to super optimal dose of fertilizers (150 % NPK). considerably due to long-term fertilization and/or ma- However, availability of N, P and K increased to the ex-nuring applied for 29 years in Vertisol and Alfisol under tent of 11.8, 19.7 and 18.5 per cent in the treatment of semi-arid climatic condition. Mandai (2011) also reported INM as compared to recommended dose of fertilizers about 15 per cent increase in soil organic carbon in the (100 % NPK). The increase in available N in ~PK + treatment of integrated nutrient management treatment farmyard manure may be through direct addition of or-compared to recommended dose of fertilizers in differ- ganic matter from farmyard manure in combination with ent cropping systems. The soil pH was not significantly 100% NPK which might have helped in multiplication influenced due to long-term fertilization and manuring. of soil microbes, ultimately enhancing the conversion of The continuous application of mineral fertilizers and organical~y bound N to mineral form (Tolanur and manures had significant effect on soil electrical conduc- Badanur 2003).
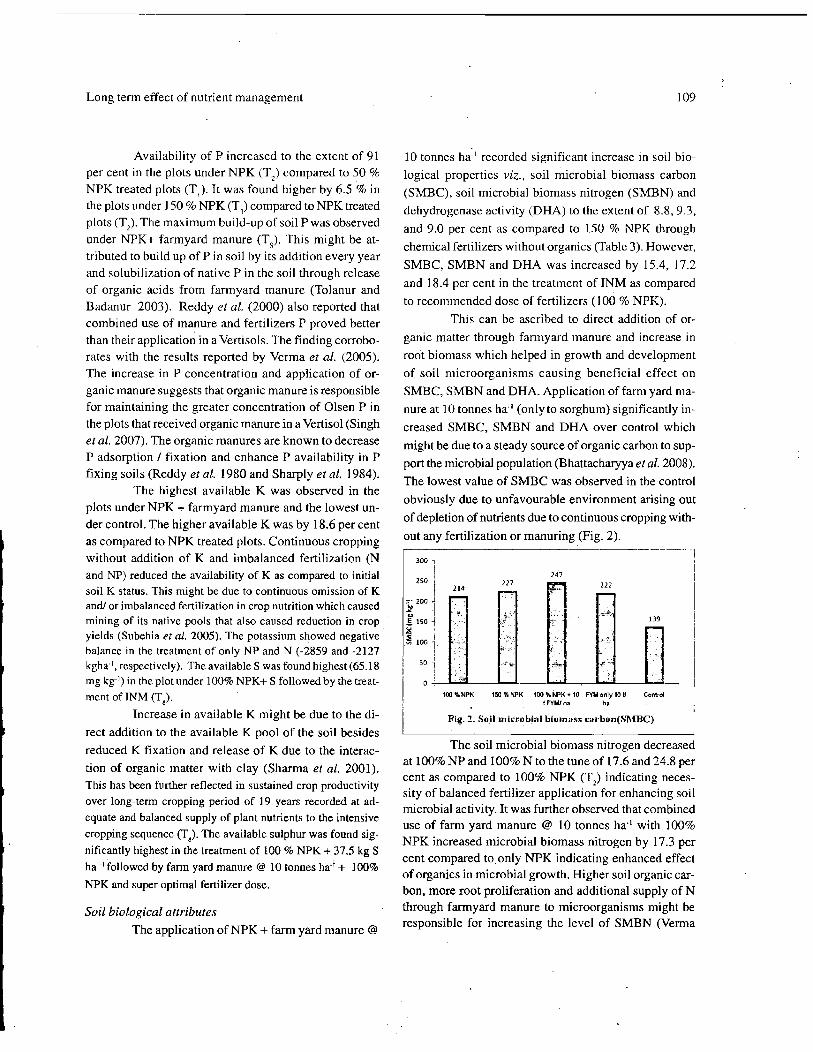
Table 3. Long tenn effect of various treatments on soil biological and physical properties under sorghum- wheat cropping sequence (after 19th cycle)
Treatments 5MBC 5MBN DHA NOrN NlL-N BD AWC MWD HC
(mg kg-I) (rq.;KgI) y-!glgbfh) (mg N lloog soil) (Mgrri1 ~emm·t) ~mm) (em hr- l)
T1 50 % NPK 187 12.36 37.32 3.32 3.07 1.37 17.62 0.772 0.281
TrlOO % NPK 214 14.95 41.95 4.76 4.48 1.30 19.86 0.926 0.482
T3 -150 % NPK 227 16.03 45.69 5.11 4.96 1.25 21.31 1.169 0.597 T4 -100 % NPK S free 208 13.86 41.06 4.69 4.42 1.31 19.32 0.908 0.463 Ts -100 % NPK + 2.5 kg Zn ha- I 217 14.3 43.14 4.85 4.67 1.30 19.97 0.955 0.493
T6 -100%NP 196 12_74 40.11 4.45 4.21 1.32 19.41 0.886 0.478
T7 -IOO%N 179 11.98 36.97 3.96 3.72 1.32 17.48 0_858 0.396 Tg -100 % NPK + lOtFYMha-1 247 17.53 49.78 5.64 5.78 1.23 21.95 1.412 0.711 T9 100 % NPK + 37.5 kg S ha -I 220 14.8 44.19 4.89 4.73 1.29 20.08 0.966 0.508 T 10 -FYM only 10 t ha· I 222 J5.18 45.08 3.97 3.76 1.24 21.59 1.254 0,603
Tn -75 % NPK 192 13.34 38.81 4.08 3.84 1.35 17.93 0.829 0.310
TI2 -Control 139 8.86 32.51 3.22 2.94 1.38 15.86 0.737 0.239
SE (m±) 10.37 0.7 0.61 0.23 0.2 0.018 0.65 0.042 0.031
CD (£=0.05) 29.49 1.95 2.23 0.66 0.56 0.053 1.83 0.122 0.089
2[ 5.47
~ I
I ~
Long term effect of nutrient management
Availability of P increased to the extent of 91 per cent in the plots under NPK (T
2) compared to 50 %
NPK treated plots (T,). It was found higher by 6.5 % in the plots under J 50 % NPK (T J) compared to NPK treated plots (T). The maximum build-up of soil P was observed under NPK+ farmyard manure (Tg ). This might be attributed to build up of P in soil by its addition every year and solubilization of native P in the soil through release of organic acids from farmyard manure (Tolanur and Badanur 2003). Reddy et al. (2000) also reported that combined use of manure and fertilizers P proved better than their application in a Vertisols. The finding corroborates with the results reported by Verma et at. (2005). The increase in P concentration and application of organic manure suggests that organic manure is responsible for maintaining the greater concentration of Olsen P in the plots that received organic manure in a Vertisol (Singh et al. 2007). The organic manures are known to decrease P adsorption / fixation and enhance P availability in P fixing soils (Reddy et al. 1980 and Sharply et at. 1984).
The highest available K was observed in the plots under NPK + farmyard manure and the lowest under control. The higher available K was by 18.6 per cent as compared to NPK treated plots. Continuous cropping without addition of K and imbalanced fertilization (N and NP) reduced the availability of K as compared to initial soil K status. This might be due to continuous omission of K and! or imbalanced fertilization in crop nutrition which caused mining of its native pools that also caused reduction in crop yields (Subehia et al. 2005). The potassium showed negative balance in the treatment of only NP and N (-2859 and -2127 kgha", respectively). The available S was found highest (65.18 mg kg") in the plot under 100% NPK+ S followed by the treatment of INM (Ta)'
Increase in available K might be due to the di
rect addition to the available K pool of the soil besides
reduced K fixation and release of K due to the interac
tion of organic matter with clay (Sharma et al. 2001). This has been further reflected in sustained crop productivity over long-term cropping period of 19 years recorded at adequate and balanced supply of plant nutrients to the intensive cropping sequence (Ta)' The available sulphur was found significantly highest in the treatment of 100 % NPK + 37.5 kg S ha ·1 followed by farm yard manure @ 10 tonnes ha" + 100%
NPK and super optimal fertilizer dose.
Soil biological attributes
The application of NPK + farm yard manure @
109
10 tonnes ha· 1 recorded significant increase in soil bio
logical properties viz., soil microbial biomass carbon
(SMBC), soil microbial biomass nitrogen (SMBN) and
dehydrogenase activity (OHA) to the extent of 8.8,9.3,
and 9.0 per cent as compared to J 50 % NPK through
chemical fertilizers without organics (Table 3). However,
5MBC, 5MBN and OHA was increased by 15.4, 17.2
and 18.4 per cent in the treatment of INM as compared
to recommended dose of fertilizers (100 % NPK).
This can be ascribed to direct addition of or
ganic matter through farmyard manure and increase in
root biomass which helped in growth and development
of soil microorganisms causing beneficial effect on
5MBC, 5MBN and OHA. Application of farm yard ma
nure at 10 tonnes ha" (only to sorghum) significantly in
creased 5MBC, 5MBN and DHA over control which
might be due to a steady source of organic carbon to sup
port the microbial population (Bhattacharyya et al. 2008).
The lowest value of 5MBC was observed in the control
obviously due to unfavourable environment arising out
of depletion of nutrients due to continuous cropping with
out any fertilization or manuring (Fig. 2). ,------------------~---~-~--.
300
250
::;- 200 ~ .. !. 150
~ I '" 100 l
i 501
247
214 227 222
139
100 IINPK 150 II NPK 100 IINPK + 10 FYM only 10 ~ Co""ol tFYWha ha
Fig. 2. Soil microbilli biom'lss c,lI'bon(Sl\IBC)
The soil microbial biomass nitrogen decreased at 100% NP and 100% N to the tune ofl7.6 and 24.8 per cent as compared to 100% NPK (T
2) indicating neces
sity of balanced fertilizer application for enhancing soil microbial activity. It was further observed that combined use of farm yard manure @ 10 tonnes ha" with 100% NPK increased microbial biomass nitrogen by 17.3 per cent compared to only NPK indicating enhanced effect of organics in microbial growth. Higher soil organic carbon, more root proliferation and additional supply ofN through farmyard manure to microorganisms might be responsible for increasing the level of 5MBN (Verma
110
and Mathur 2009). Applications of farm yard manure @ 10 tonnes
ha· 1 + 100 % NPK recorded significantly higher dehydrogenase activity (49.78 )lg/g/24 hr) compared to all other treatments (Fig. 3). The increase in DHA due to INM was 18.6 and 8.9 per cent over 100% :-JPK and 150% NPK respectively through mineral fertilizers. The results are in line with the findings reported by Bhattacharyya et £If. (2008). The addition of farm yard manure coupled with mineral fertilization exerted a stimulating influence on the preponderance of bacteria (Selvi et al. 2004). It was significantly higher in the plots under 100% :-.IPK (41.95 )lg/g/24 hr) and 100% NP (40.11 Ilg1 g/24 hr) compared with 100% N (36.97 )lg/g/24 hr), suggesting balanced application of nutrients is essential. Jain et al. (2003) also reported significant increase in DHA due to balanced nutrient supply.
60
49.18 so 4$.6, 45.08
41% i. 4(} .c: ~ 31.51
~ 30 .. 2-«
ZO ::c 0
10
l00"!,NPK 1SO%NPK 100'4NPK+l0 FVMonly10tl CanIrol tFVMlhlt h.
Fig. 3 Dehydrogennse assay (DH.-\')
Soil physical attributes
Application of NPK + farm yard manure @ 10
tonnes I ha recorded significant decrease in bulk density
as compareq to 100% NPK and 150 % NPK through
chemical fertilizers without organics (Table 3). This can
be ascribed to direct addition of organic matter through
farmyard manure and increase in root biomass which
helped in growth and development of soil microorgan
isms causing beneficial effect on improvement in mean
weight diameter, available water capacity and hydraulic
conductivity.
Soil quality assessment
The soil quality was assessed by proper selection of indicators and seventeen soil parameters were used for Principal Component Analysis. The PC 1 and PC 2 which explained about 5% of the variability within the
R. N. Katkar el al.
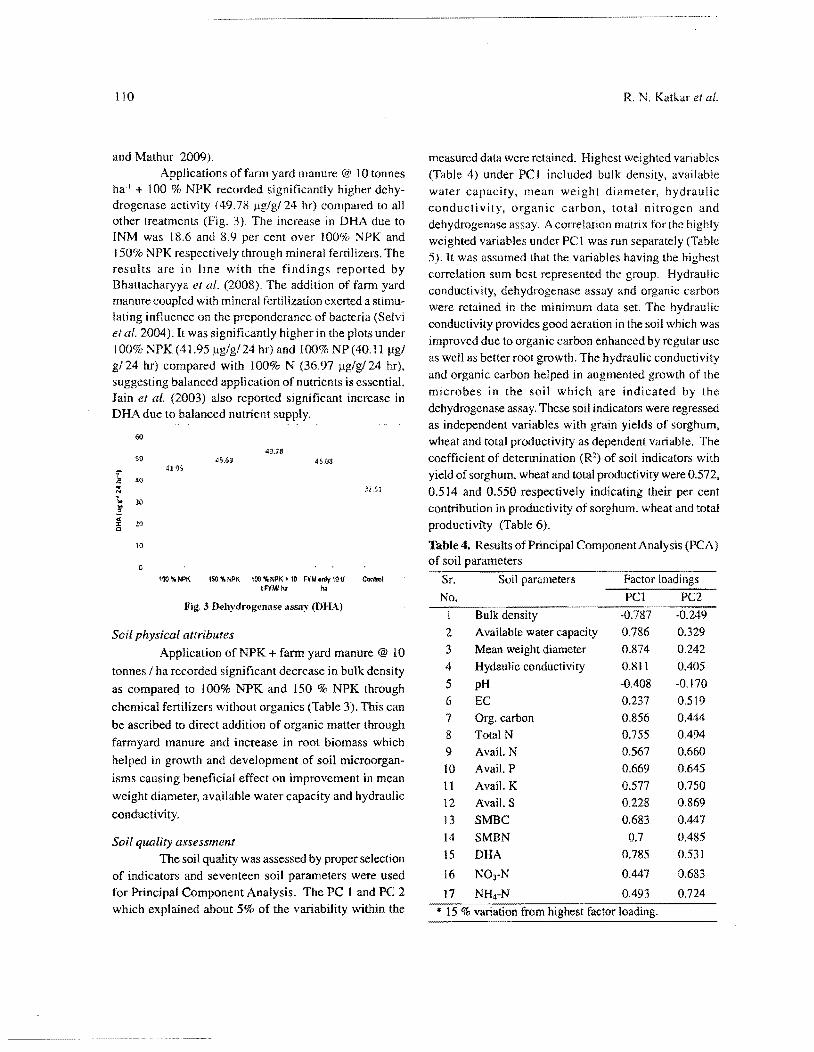
measured data were retained. Highest weighted variables (Table 4) under PC) included bulk density, available water capacity, mean weight diameter, hydraulic conductivity, organic carbon, total nitrogen and dehydrogenase assay. A correlation matrix for the highly weighted variables under PCI was run separately (Table 5). It was assumed that the variables having the highest correlation sum best represented the group. Hydraulic conductivity, dehydrogenase assay and organic carbon were retained in the minimum data set. The hydraulic conductivity provides good aeration in the soil which was improved due to organic carbon enhanced by regular use as well as better root growth. The hydraulic conductivity and organic carbon helped in augmented growth of the microbes in the soil which are indicated by the dehydrogenase assay. These soil indicators were regressed as independent variables with grain yields of sorghum, wheat and total productivity as dependent variable. The coefficient of determination (R2) of soil indicators with yield of sorghum, wheat and total productivity were 0.572, 0.514 and 0.550 respectively indicating their per cent contribution in productivity of sorghum. wheat and total productivIty (Table 6).
Table 4. Results of Principal Component Analysis (PCA) of soil parameters
Sr. Soil parameters Factor loadings
No. PCI PC2
1
2 Available water capacity 0.786 0.329
3 Mean weight diameter 0.874 0.242
4 Hydaulic conductivity 0.811 0.405
5 pH -0.408 -0.!70
6 EC 0.237 0.519 7 Org. carbon 0.856 0.444
8 ToraiN 0.755 0.494
9 Avail. N 0.567 0.660
10 AvaiL P 0.669 0.645
11 Avail. K 0.577 0.750
12 iXvail. S 0.228 0.869
13 5MBC 0.683 0.447
14 5MBN 0.7 0.485
15 DHA 0.785 0.531
16 NOrN 0.447 0.683
17 NH4-N 0.493 0.724
* 15 % variation from highest factor loading.
Long rerm effect of nutrient management
Table 5. Correlation matrix (Pearson's coefficients) under PC's with high factor loadings
PC 1 Variables BD AWC MWD HC OC Total N
BD -0 .. 886 -0.901 -0.927 -0.87 -0.863
AWC -0.886 0.863 0.921 0.898 0.913
MWD -0:901 0.863 1 0.926 0.896 0.871
HC -0.927 0.921 0.926 0.92 0.929
OC -0.870 0.898 0.896 0.92 0.951
Total N -0.863 0.913 0.871 0.929 0.951
DHA -0.867 0.904 0.882 0.933 0.958 0.964
14 6.335
Avail.K Avail.S
Avail. S 0.821
sum 1.821
Table 6. Results of multiple regressions of total soil parameters and soil indicators
GoallFunction
Sorghum yield
Wheat yield
Total productivity
Total soil parameters
0.988**
0.98-3**
0.986**
** -Denotes significance at I % level of significance
Soil indicators 0.572**
0.514**
0.550**
III
DHA
-0.867
0.904
0.882
0.933
0.958
0.964
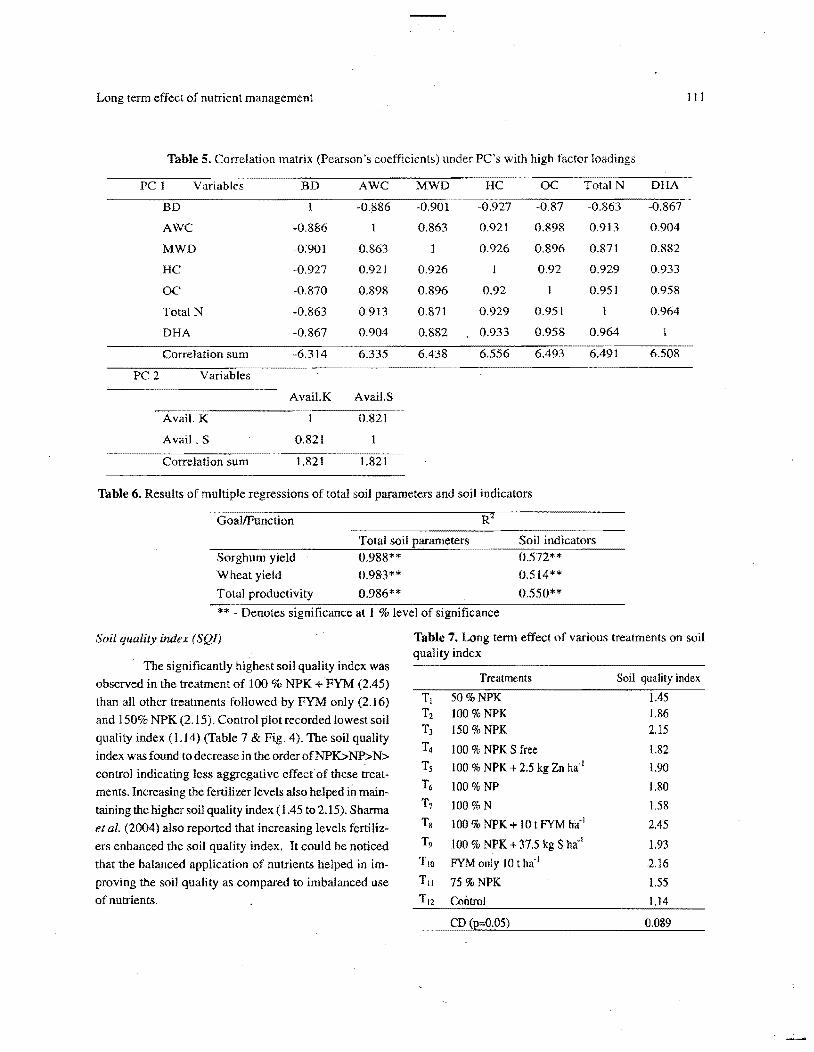
Soil quality index (SQI) Table 7. Long term effect of various treatments on soil
The significantly highest soil quality index was
observed in the treatment of 100 % NPK + FYM (2.45)
than all other treatments followed by FYM only (2.16)
and 150% NPK (2.15). Control plot recorded lowest soil
quality index (1.14) (Table 7 & Fig. 4). The soil quality
index was found to decrease in the order ofNPK>NI?N>
control indicating less aggregative effect of these treat
ments. Increasing the fertilizer levels also helped in main
taining the higher soil quality index (1.45 to 2.15). Sharma
et al. (2004) also reported that increasing levels fertiliz
ers enhanced the soil quality index. It could be noticed
that the balanced application of nutrients helped in im
proving the soil quality as compared to imbalanced use
of nutrients.
quality index
Treatments
TI 50%NPK T2 100 % NPK T3 150% NPK
T4 100 % NPK S free T~ 100 % NPK + 2.5 kg Zn ha-1
T6 100 % NP T, 100% N
Ts 100 % NPK + to t FYM ha'!
T9 100 % NPK + 37.5 kg S ha,1
TIO FYM only \0 t ha'!
Til 75 %NPK
T!2 Control
CD (2:;:;(}.O5)
Soil quality index
1.45 1.86 2.15
1.82
1.90
1.80
1.58
2.45
1.93
2.16
1.55
0.089
112
l.> US
2.45
2.16
j 2 186
I I ~lS " I 15 . 1.14 a
, 1 I
I '" 0.>
0 l00lloNPK l~'!.NPK l00%NPK+l0 FYMonIyl0U ConIroI
tFYMlh. h.
Fig. 4. Soil quality index
Conclusions
The results suggest the contribution of impor
tant soil quality attributes like hydraulic conductivity,
organic carbon and dehydrogenase is governing the soil
quality in VertisoL The soil parameters have beeJ:! identi
fied as the most sensitive which respond to management
and can be regarded as the important soil quality indica
tors in Vertisols.
Integrated use of inorganic fertilizers and or
ganic manure found better under the long term which
sustained crop productivity and enhanced soil quality in
sorghum- wheat cropping sequence grown on Vertiso!.
Organic manures (FYM) along with recommended dose
of fertilizers found to be viable options in increasing soil
organic carbon, nutrient turn over, enhancing microbial
biomass, thereby improvement in availability of nutri
ents in soil, maintenance of soil quality and achieving
the sustainable productivity of sorghum and wheat for
long run in rainfed as well as irrigated moisture regimes.
Acknowledgements
The authors are thankful for financial help from
AICRP on Long Term Fertilizer Experiments, Indian In
stitute of Soil Science (ICAR), Bhopal.
References
Andrews, S.S., Karlen, D.L and Mitchell, J.P. (2002).
A comparison of soil quality indexing meth
ods for vegetable production systems in North
ern California. Agriculture Ecosystem and
EnvironmelU 90, 25-45.
R. N. Katkar et at.
Bhattacha.ryya, R., Kundu, S, Ved Prakash and Gupta,
H.S. (2008). Sustainability under combined
application of mineral and organic fertilizers
in a rain fed soybean-wheat system of the In
dian Himalayas. European Journal of
Agro/Wmy 28, 33-46.
Blake, GR. and Hartze, K. H. (1986). In: Methods of
Soil Analysis. Part 1. Physical and Mineral
ogical Methods ( 2nd ed.) ; by Klute, A. (Ed). ;
American Society of Agronomy: Madison,
Wisconsin; Agronomy Monograph. VoI.9. 363-
375.
Chesnin, Land Vein, C. H. (1951). Turbidimetric deter
mination of available sulphates. Soil Science
Society of America Proceedings IS, 149-157.
Doran, lW. and Parkin, T.B., (1994). Defining and as
sessing soil quality. In 'Defining Soil Quality
for a Sustainable Environment' (Eds. J.W.
Doran, D.C. Coleman, D.F. Bezdicek, andB.A.
Stewarts) pp. 3-21. (Soil Science Society of
America: Wisconsin).
Ghai, S.K, Rao, D.L.N. and Batra, L. (1988).Nitrogen
contribution to wetland rice by green manur
ing with Sesbania spp.in an alkaline soil. Biol
ogy & Fertility of Soils 6, 22-25.
Ghosh, P.K., Dayal, D., Mandai, K.n, Wanjari, R.H. and
Hati, K.M. (2003). Optimization of fertilizer
schedules in fallow and groundnut based crop
ping system and an assessment of system
sustainability. Field Crop Research 80, 83-98.
Hussain, I., Olsen, KR., Wander, M. M., and Karlen,
D.L. (1999). Adaptation of soil quality indices
and application to three tillage systems in southern
rIlinois. Soil and Tillage Research 50, 237-249.
Jackson M. L (1967). Soil Chemical Analysis. Prentice
Hall Publication Pvt. Ltd., New Delhi, India.
Jain, D., Rawat, A. K., Khare • A. K. and Bhatnagar, R.
K. (2003). Long-tenn effect of nutrient sources
on Azotobacter, nitrifier population and nitri
fication in Vertisols. Journal of the Indian
Society of Soil Science 51(1): 35-37.
Long tenn effect of nutrient management
Jenkinson, D. S .and Ladd, J. N. (1981). Microbial bio
mass in soil measurement and turnover In: Soil
Biochemistry (Ed. E.A. Paul and IN. Ladd)
pp. 415-71. 5 Marcel Dekker, New York, USA.
Jenkinson. D. S. and Powlson, D. S. (1976). The effects
of biocidal treatments on metabolism in soil
L Fumigation with chloroform. Soil Biology
and Bioch~mistry 8(3), 167-77.
Karlen, D. L., Wollenhaupt, N,C., Erback, D.C., Berry,
E.C., Swan, J.B., Eash, N.S., and Jordakl, J.L.,
(1994). Crop residue effects on soil quality fol
lowing 10- years of no till corn. Soil and Till
age Research 31,149-167.
Klute. A. and Dirksen, C. (1986), In: Methods of Soil
Analysis. Part 1. Physical and Mineralogical
Methods (2nd ed.); by Klute, A. (Ed). ; Journal
of American Society of Agronomy. Madison,
Wisconsin; Agronomy Monograph 9. 687 -732.
Knudsen, D. and Peterson, G. A. (1982). In: Methods of Soil
Analysis. Part I. Physical and Mineralogical Meth
ods (2nd Ed.); by Klute, A. (Ed.); American Society
of Agronomy: Madison, Wisconsin; Agronomy
Monograph Vo1.9. 281-231.
Lenhard, 0. (1956) Die Dehydrogenase aktivitat des
Bodens als Mass fiir Mikroorganismen
tiitigkeit in Boden. Z. Pflernahr. Dung.
Bodenk. 73, I-II.
Mandai. B. (2011). Soil organic carbon research in India
- A way forward. The 29th Prof. J.N MukhaIjee
ISSS Foundation Lecture. Delivered on 16th
Nov. 2011 at the 76'h Annual Convention of
Indian Society of Soil Science held at Univer
sity of' Agricultural Sciences, Dharwad,
Karnataka.
Mandai, u.K., Singh, 0., Victor, U.S. and Sharma, K.L.
(2003). Green manuring: its effect on soil prop
erties and crop growth under rice-wheat crop
ping system. Eu.ropean Jou.rnal of Agronomy
19, 225-237.
Olsen, S. R., Cole, C. v., Watanabe, F. S. and Dean, L. A.
(1954). Estimation of available phosphorus in
113
soils by extraction with sodium bicarbonate. U.S. Dept. of Agric. Circ. 939.
Reddy, D., Subbrao, A and Rupa T. R. (2000). Effect of
continuous use of cattle manure and fertilizer
phosphorus on crop yields and soil organic
phosphorus in a Vertisol. Bio-Resource Tech
nology 75,113-118.
Reddy, K. R. , Overcash, M. R., Khaleel, R. and
Westennan, P. W. (1980). Phosphorus adsorp
tion-desorption characteristics of two soils
utiliozed for disposal of animal wastes. Jour
nal of Environmental Quality 9, 86-92.
Seivi, D., Santhy, P., Dhakshinamoorthy, M. and
Maheshwari, M. (2004). Microbial population
and biomass in rhizosphere as influenced by
continuous intensive cultivation and fertiliza
tion in inceptisoL Journal of the Indian Soci
ety of Soil Science 52, 254-57.
Sharma, M. P., Bali, S. V. and Gupta, D. K. (2001). Soil
~ertility and productivity of rice (Oryza sativa)
wheat (Triticum aestivum) cropping system in
an inceptisol as influenced by integrated nutri
ent management. Indian Journal of Agricul
tural Sciences 71, 82-86.
Sharma, KL., Srinivas, K, MandaI, U.K, Vittal, K.P.R.,
Kusuma Grace, J., and Maruthi Sankar. G.
(2004). Integrated Nutrient Management Strat
egies for Sorghum and Green gram in Semi arid
Tropical Alfisols. Indian Journal of Dryland
Agricultural Research and Development 19,
13-23.
Sharma. KL., Mandai. U.K., Srinivas, K., Vittal, K.P.R., MandaI, R, Grace, lK and Ramesh, V. (2005).
Long term soil management effect on crop
¥ields and soil quality in a dry land Alfisol. Soil
and Tillage Research 83, 246-259.
Sharpley, A. N., Smith, S. 1., Stewart, 1. W. B. and
Mathers, A. C. (\ 984). Phosphorus fonns in
soil receiving feedlot wastes. Journal of Envi
ronmental Quality 13:2] 1-215.
114
Singh Muneshwar, Sammi Reddy, K., Singh, V. P. and
Rupa, T. R (2007). Phosphorus avaiBbility to
rice (Oryza sativa L.)- wheat (Triticum
aestivum L.) in a Vertisol after eight years of
inorganic and organic fertilizers additions. Bio
Resource Technology 98:1474-1481.
Singh, R P., Das, S. K., Bhaskara Rao, U.M. and
Narayana Reddy, M. (1990). Towards Sustain
able Dryland Agricultural Practices. Central
Research Institute for Dryland Agriculture,
Hyderabad, India, Technical Bulletin. pp. \-
106.
Subehia, S. K., Verma, S. and Sharma, S. P. (2005). Ef
fect of long-term use of chemical fertilizers with
and without organics on forms of soil acidity,
phosphorus adsorption and crop yields in an
acid soil. Journal of the Indian Society of Soil
Science 53(3),308-14.
Swarup, A. (1987). Effect of pre-submergence and green
manuring (Sesbania aculata) on nutrition and
yield of rice (Oryza sativa) on a sodic soil. Bi
ology and Fertility of Soils 5,203-208.
Tabatabai, M.A. (1982). Soil Enzymes. In 'Methods of
Soil Analysis'. Palt 2. Chemical and Micro
biological Properties 2nd ed.(Eds. A.L. Page,
R.H. Miller and D.R Keeney). American So
ciety of Agronomy: Madison, Wisconsin;
Agronomy Monograph Vo1.9. 937-940.
Tolanur, S. r. and Badanur, V. P. (2003). Changes in or
ganic carbon, available N, P and K under inte
grated use of organic manure, green manure
and feltilizers on sustaining productivity of
R N. Katkar et al.
pearl millet pigeon pea system and fertility of
an Inceptisol. Journal of the Indian Society of
Soil Science 51(1),254-57.
Verma, A., Nepali a, V. and KanthaIiya, P. C. (2005).
Effect of continuous cropping and fertilization
on crop yields and nutrient status of a Typic
Haplustept. Journal of the Indian Society of Soil Science 53(3), 365-68.
Verma Gayatri and Mathur, A . K. (2009). Effect of inte
grated nutrient management on active pools of
soil organic matter under maize-wheat system
of a Typic Haplustept. Journal of the Indian Society of Soil Science 57(3),317-22.
Vineela, c., Wani, S. P., Ch. SIinivasrao, Padmaja B. and
Vittal, K. P. R. (2008). Microbial properties of
soils as affected by cropping and nutrient man
agement practices in several long-term mano
rial experimcnts in the semi-arid tropics ofIn
dia. Applied Soil Ecology 40, 165-73.
Walkley, A. and Black, C. A. (1934). An examination of
the Degtjareff method for detennining soil or
ganic matter and a proposed modification of
chromic acid titration method. Soil Science 37(1), 29-38.
Yaduwanshi, N.P.S. (2003). Substitution ofinorganic fer
tilizers by organic manures and the effect on
soil fertility in a rice wheat rotation on re
claimed soil in India. Journal of Agricultural
Sciences 140, 161- 168.
Yoder, RE. (1936). A direct method of aggregation analy
sis and study of the physical nature of erosion
losses. Joumai of American Society of
Agronomy 28, 337 -351.
Received: January 2012 Accepted' October 2012