london borough of haringey london borough of haringey · of 41 days were reported by kings college,...
TRANSCRIPT
London Borough of Haringey
April 2015 Updating and Screening Assessment i
London Borough Of Haringey
Air Quality Updating and Screening Assessment for 2014
In fulfilment of Part IV of the Environment Act 1995
Local Air Quality Management
May 2015

London Borough of Haringey
ii Updating and Screening Assessment April 2015
Local Authority Officer
Alison Bell
Department Commercial Environmental Health
Address 6th Floor
Alexandra House 10 Station Road, Wood Green London N22 7TR
Telephone 0208 489 5246
e-mail [email protected]

London Borough of Haringey
April 2015 Updating and Screening Assessment iii
Executive Summary
This Updating and Screening Assessment is a requirement under the Environment
Act 1995, Part IV, for local authorities to periodically review and assess current and
future air quality. This report also serves to:
Retain the profile of LAQM within the local authority
Provide a means of communicating air quality information to members
and the public
Maximise the usefulness and interpretation of the monitoring carried out by the
local authority
Make the next stage of review and assessment easier, as the report
provides a readily available up-to-date source of information
Help local authorities respond to enquires for information on air quality
Provide information to help other policy areas, such as transport and land use
planning
Provide a source of information for developers carrying out air quality
assessments of new schemes
Nitrogen Dioxide and Particulate Matter (PM10 and PM2.5) continue to be monitored
using automatic and non-automatic methods.
Monitoring results indicate a slight decrease in nitrogen dioxide levels compared with
2013 levels. Despite this the annual average remains exceeded at the Archway road
location and at the High Road location in Tottenham. All automatic sites continue to
be affiliated to the AURN; all reported data from these sites is validated and ratified to
AURN standards.
PM10 monitoring was stopped at the High Road, Tottenham location. The
instrumentation was removed by Defra to another location outside of the borough.
PM10 results remained below the annual objective. PM2.5 monitoring is continues at
the High road location.

London Borough of Haringey
iv Updating and Screening Assessment April 2015
Monitoring of previously identified NO2 hotspot locations continues with the
completion of 2 monitoring sites and the start of 2 new locations; primary schools
within 150m of busy roads >10, 000 vpd. All hotspot locations are representative of
relevant exposure, at which there may be a risk of exceedence to the hourly
objective.
Whilst there have been no exceedences of the hourly objectives for either nitrogen
dioxide and PM10 during 2014, 13 air pollution episodes in London, spanning a total
of 41 days were reported by Kings College, London during 2014
(http://www.londonair.org.uk/london/asp/publicepisodes.asp). Airtext issued 23 alert
days to Haringey subscribers in 2014 for poor air quality during 2014. These
episodes and alert days were for primarily PM10, but some are for NO2, O3 and
PM2.5.
Based on the monitoring results, the number of episodes recorded by Kings College,
London and Airtext alert days, it is not considered appropriate to revoke or amend
the Air Quality Management Area. A detailed assessment is not required for any
pollutants.
The London borough of Haringey will continue with its monitoring programme. Air
quality improvement work continues to be delivered in accordance with the measures
detailed in the council’s Air Quality Action plan. Stakeholder engagement continues
with partners including the North London Air Quality Cluster group, Department for
the Environment Food and Rural Affairs, Greater London Authority and internal and
external local partners.

London Borough of Haringey
April 2015 Updating and Screening Assessment
Table of contents
1 Introduction 1.1 Description of Local Authority Area 1.2 Purpose of Report 1.3 Air Quality Objectives 1.4 Summary of Previous Review & Assessments
2 New Monitoring data
2.1 Summary of Monitoring Undertaken 2.2 Comparison of Monitoring Results with AQ Objectives
3 Road Traffic Sources
3.1 Narrow congested streets with residential properties close to the kerb 3.2 Busy streets where people may spend 1-hour or more close to traffic 3.3 Roads with high flow of buses and/or HGVs. 3.4 Junctions 3.5 New roads constructed or proposed since the last round of R & A 3.6 Roads with significantly changed traffic flows. 3.7 Bus and Coach stations.
4 Other Transport Sources 4.1 Airports 4.2 Railways (diesel & Steam Trains) 4.3 Ports (Shipping)
5 Industrial Sources 5.1 New or Proposed Industrial Installations 5.2 Major Fuel (petrol) storage depots 5.3 Petrol Stations 5.4 Poultry farms
6 Commercial and Domestic Sources
6.1 Biomass combustion – Individual Installations 6.2 Biomass combustion – Combined Impacts 6.3 Domestic Solid-Fuel Burning
7 Fugitive or Uncontrolled Sources 8 Conclusions and Proposed Actions
8.1 Conclusions from New Monitoring Data 8.2 Conclusions from Assessment of Sources 8.3 Proposed Actions
9 References & Appendices

London Borough of Haringey
Updating and Screening Assessment April 2015
1 Introduction
1.1 Description of Haringey Area
The London Borough of Haringey is one of the 33 London boroughs and made up of the
town centres of Wood Green, Tottenham, Muswell Hill and Highgate. Geographically
located to the North of London, Haringey is classified as an outer London Borough is
more than 11 square miles in area. It consists of the former boroughs of Hornsey, Wood
Green and Tottenham, which were amalgamated in 1965. It shares borders with six
other London boroughs. Clockwise from the north, they are: Enfield, Waltham Forest,
Hackney, Islington, Camden and Barnet. Along the Eastern side is the Lea Valley,
historically the home to heavy industry.
Today the borough of Haringey is predominantly residential with some light industry,
mostly located along the eastern edge of the borough. According to the Office for
National Statistics (ONS) estimates, Haringey’s population in 2006 was 225,700. The
GLA projections estimate Haringey’s population to grow by 10.6% that is 23,800
residents over the next 25 years. Haringey has a tradition of diversity and within the
borough there are more than 100 languages spoken.
A combination of the shopping areas, housing and the main road, rail and tube transport
networks have all contributed to the development of different identities of Haringey. The
transport networks connect the borough to the rest of London but also serve as borders
within the borough, especially the north / south road, the A105 (Green Lanes) which
divides the East and the West in the middle of the borough. The eastern part of the
borough is urban residential with the western side of the A105 being more affluent and
having more green open spaces. Major roads that traverse the borough include the A1,
A10, A105, A406, A503, A1010 & A1055. Tottenham is also home to Tottenham
Hotspurs Football Club; other well known landmarks include Alexandra Palace and
Alexandra Park, Bruce Castle and Finsbury Park. The river Lee (Lea) follows the
eastern boundary from North to South. The river is navigable but is little used.
25% of Haringey’s total area consists of parks, recreation grounds and open spaces.
There are also 5 distinct ancient woodlands which are Highgate Wood, Queens Wood,

London Borough of Haringey
April 2015 Updating and Screening Assessment
Coldfall Wood, Bluebell Wood and North Wood. Highgate Woods is one of the eight
Green Heritage sites in London.
Much of Haringey, including some of its deprived neighbourhoods, has relatively
good public transport. This means that employment opportunities in the City
and West End are fairly easily accessible, as are the opportunities of the
London-Cambridge corridor and Stansted Airport. In common with many
London boroughs, Haringey suffers the effects of large amounts of through road
traffic. The East Coast main line (London to Edinburgh) traverses the borough North to
South. This line carries electric, diesel and occasionally coal fired engines on “special
trips”. The East London line from Shoeburyness to London crosses the borough East-
West. This line carries mainly electric trains with occasional diesel freight.
Whilst there are no Part A and A2 processes in the borough there are a limited number
of Part B processes. There are some key regeneration projects within the borough
including Tottenham and Haringey Heartlands, Tottenham High Road regeneration
corridor, the Upper Lea Valley and Wood Green.
1.2 Purpose of Report
This report fulfils the requirements of the Local Air Quality Management process as set
out in Part IV of the Environment Act (1995), the Air Quality Strategy for England,
Scotland, Wales and Northern Ireland 2007 and the relevant Policy and Technical
Guidance documents. The LAQM process places an obligation on all local authorities to
regularly review and assess air quality in their areas, and to determine whether or not
the air quality objectives are likely to be achieved. Where exceedences are considered
likely, the local authority must then declare an Air Quality Management Area (AQMA)
and prepare an Air Quality Action Plan (AQAP) setting out the measures it intends to put
in place in pursuit of the objectives.
The objective of this Updating and Screening Assessment is to identify any matters that
have changed which may lead to risk of an air quality objective being exceeded. A
checklist approach and screening tools are used to identify significant new sources or
changes and whether there is a need for a Detailed Assessment. The USA report should

London Borough of Haringey
Updating and Screening Assessment April 2015
provide an update of any outstanding information requested previously in Review and
Assessment reports.
1.3 Air Quality Objectives
The air quality objectives applicable to LAQM in England are set out in the Air Quality
(England) Regulations 2000 (SI 928), The Air Quality (England) (Amendment)
Regulations 2002 (SI 3043), and are shown in Table 1.1. This table shows the objectives
in units of microgrammes per cubic metre g/m3 (milligrammes per cubic metre, mg/m3
for carbon monoxide) with the number of exceedences in each year that are permitted
(where applicable).
London Borough of Haringey
April 2015 Updating and Screening Assessment
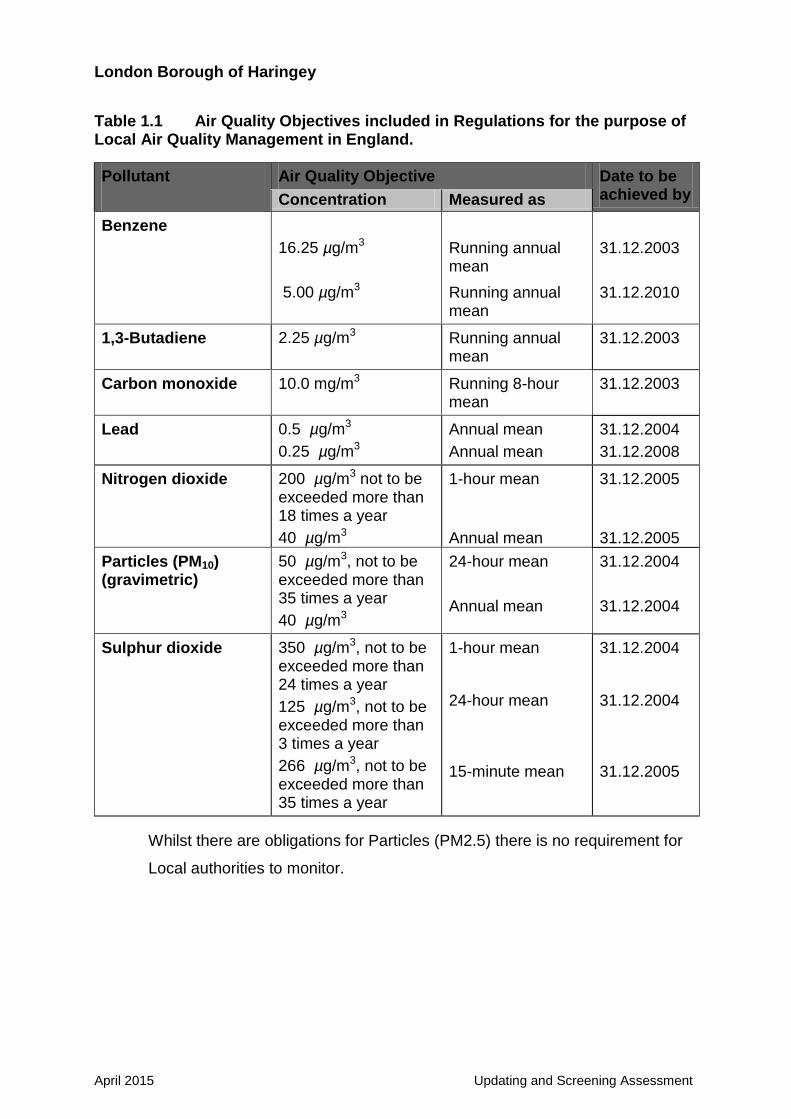
Table 1.1 Air Quality Objectives included in Regulations for the purpose of Local Air Quality Management in England.
Pollutant
Air Quality Objective Date to be achieved by Concentration Measured as
Benzene
16.25 µg/m3
Running annual mean
31.12.2003
5.00 µg/m3 Running annual mean
31.12.2010
1,3-Butadiene 2.25 µg/m3 Running annual mean
31.12.2003
Carbon monoxide 10.0 mg/m3 Running 8-hour mean
31.12.2003
Lead 0.5 µg/m3
0.25 µg/m3
Annual mean
Annual mean
31.12.2004
31.12.2008
Nitrogen dioxide 200 µg/m3 not to be exceeded more than 18 times a year
40 µg/m3
1-hour mean
Annual mean
31.12.2005
31.12.2005
Particles (PM10) (gravimetric)
50 µg/m3, not to be exceeded more than 35 times a year
40 µg/m3
24-hour mean
Annual mean
31.12.2004
31.12.2004
Sulphur dioxide 350 µg/m3, not to be exceeded more than 24 times a year
125 µg/m3, not to be exceeded more than 3 times a year
266 µg/m3, not to be exceeded more than 35 times a year
1-hour mean
24-hour mean
15-minute mean
31.12.2004
31.12.2004
31.12.2005
Whilst there are obligations for Particles (PM2.5) there is no requirement for
Local authorities to monitor.
London Borough of Haringey
Updating and Screening Assessment April 2015
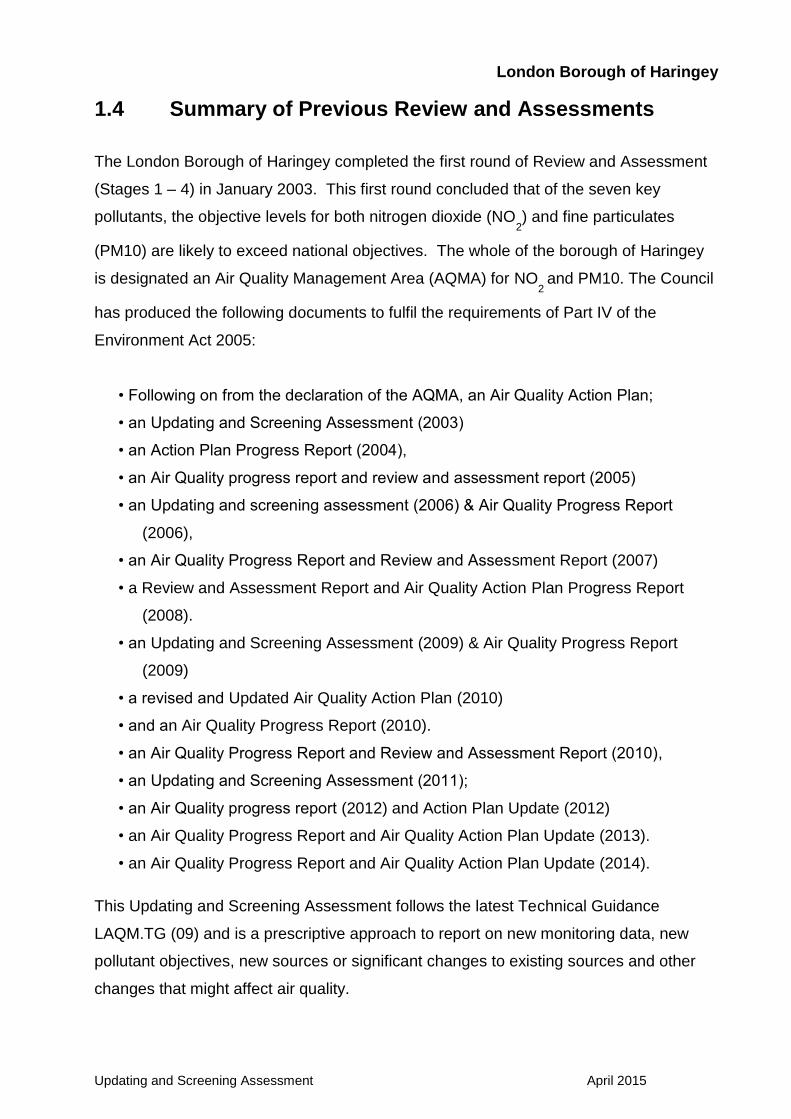
1.4 Summary of Previous Review and Assessments
The London Borough of Haringey completed the first round of Review and Assessment
(Stages 1 – 4) in January 2003. This first round concluded that of the seven key
pollutants, the objective levels for both nitrogen dioxide (NO2) and fine particulates
(PM10) are likely to exceed national objectives. The whole of the borough of Haringey
is designated an Air Quality Management Area (AQMA) for NO2
and PM10. The Council
has produced the following documents to fulfil the requirements of Part IV of the
Environment Act 2005:
• Following on from the declaration of the AQMA, an Air Quality Action Plan;
• an Updating and Screening Assessment (2003)
• an Action Plan Progress Report (2004),
• an Air Quality progress report and review and assessment report (2005)
• an Updating and screening assessment (2006) & Air Quality Progress Report
(2006),
• an Air Quality Progress Report and Review and Assessment Report (2007)
• a Review and Assessment Report and Air Quality Action Plan Progress Report
(2008).
• an Updating and Screening Assessment (2009) & Air Quality Progress Report
(2009)
• a revised and Updated Air Quality Action Plan (2010)
• and an Air Quality Progress Report (2010).
• an Air Quality Progress Report and Review and Assessment Report (2010),
• an Updating and Screening Assessment (2011);
• an Air Quality progress report (2012) and Action Plan Update (2012)
• an Air Quality Progress Report and Air Quality Action Plan Update (2013).
• an Air Quality Progress Report and Air Quality Action Plan Update (2014).
This Updating and Screening Assessment follows the latest Technical Guidance
LAQM.TG (09) and is a prescriptive approach to report on new monitoring data, new
pollutant objectives, new sources or significant changes to existing sources and other
changes that might affect air quality.

London Borough of Haringey
April 2015 Updating and Screening Assessment
The previous 2006, 2009 and 2012 Updating and Screening Assessments concluded
that there was no requirement for a Detailed Assessment for any of the specified
pollutants, and that it was pertinent to maintain the Air Quality Management Area for the
whole of the Haringey, for both NO2 and PM10.
Although much work has been undertaken towards improving air quality, levels of
nitrogen dioxide and fine particulates continue to be a problem and so the AQMA
remains appropriate for the whole of the borough of Haringey.
Many of the documents mentioned above are available at:
www.haringey.gov.uk/airquality
London Borough of Haringey
Updating and Screening Assessment April 2015
2 New Monitoring Data
2.1 Summary of Monitoring Undertaken
2.1.1 Automatic Monitoring Sites
Haringey Council has been automatically monitoring air pollution since 1994. To date
there are two automatic monitoring sites in operation within the borough; one roadside
and one urban background.
Whilst there have been no new sites or sites that have closed down since the previous
report; at the Haringey Roadside site the PM10 monitor was removed by defra to be
deployed at a location outside of the borough. Appendix 1 shows a map of the locations
of all monitoring sites, automatic and non-automatic, in the borough as at December
2014. Table 2.1 gives details of the automatic monitoring sites within the borough.
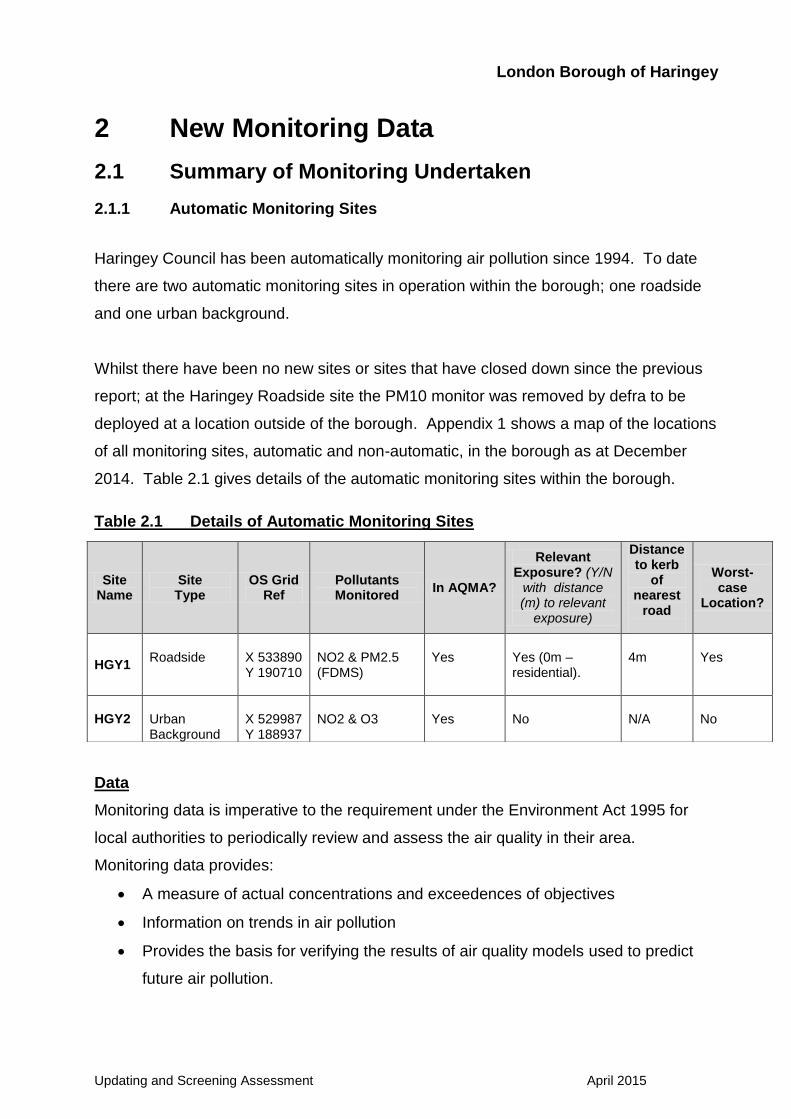
Table 2.1 Details of Automatic Monitoring Sites
Data
Monitoring data is imperative to the requirement under the Environment Act 1995 for
local authorities to periodically review and assess the air quality in their area.
Monitoring data provides:
A measure of actual concentrations and exceedences of objectives
Information on trends in air pollution
Provides the basis for verifying the results of air quality models used to predict
future air pollution.
Site Name
Site Type
OS Grid Ref
Pollutants Monitored
In AQMA?
Relevant Exposure? (Y/N
with distance (m) to relevant
exposure)
Distance to kerb
of nearest
road
Worst-case
Location?
HGY1
Roadside
X 533890 Y 190710
NO2 & PM2.5 (FDMS)
Yes
Yes (0m – residential).
4m
Yes
HGY2 Urban Background
X 529987 Y 188937
NO2 & O3
Yes
No
N/A
No

London Borough of Haringey
April 2015 Updating and Screening Assessment
Both of these monitoring stations are part affiliated to the Automatic Urban & Rural
Network (AURN). AURN sites have defra funding as the data is more rigorously
scrutinised with traceability to EU standards. Part affiliated sites are part funded by
defra and part funded by the local authority.
Defra’s London AURN data manager is the Environmental Research Group (ERG),
Kings College London. ERG collates the data on a daily basis, validates it before send
it onto the national data managers; who ratify it to EU standards.
Routine calibrations are undertaken fortnightly (roadside site) and monthly (background
site). Each site is audited bi-annually following a full service. The calibrations support
the quality assurance and quality control (QA/QC) checks that are carried out on the raw
data to the AURN standard. This is to ensure that:
Data is representative of ambient concentrations in the area
Measurements are accurate and precise in order to meet monitoring
requirements
Data can be consistently compared with data from national and
international standard sites
Measurements are consistent over time
PM2.5 levels are measured by Filter Dynamics Measurement System (FDMS). In May
2014 the Defra PM10 FDMS was removed from HGY1 and deployed at another location
outside of Haringey. The PM10 data trends at the Haringey roadside site are stable
over time, well below the annual objective of 40µg/m3.
Further information on data validation and ratification is available on the defra website:
www.uk-air.defra.gov.uk
2.1.2 Non-Automatic Monitoring
For monitoring locations of diffusion tubes throughout the borough see Appendix 1.
The non-automatic sites are diffusion tube sites and all monitor for nitrogen dioxide.
Diffusion tubes provide an indicative measure of the pollutant being monitored. The
advantage of using diffusion tubes is that they are inexpensive and provide useful

London Borough of Haringey
Updating and Screening Assessment April 2015
information on pollutant variations across the borough, to identify pollution hotspots and
long-term trends.
The diffusion tubes are prepared and analysed by Lambeth Scientific Services who are
a UKAS accredited laboratory. This laboratory participates in the WASP scheme
(Workplace Analysis Scheme for Proficiency) to meet European standards and is
involved in the network field inter-comparison exercise operated by NETCEN, which
assesses the sampling and analytical performance of the tubes. Nitrogen dioxide
diffusion tubes are prepared using the 50% triethanolamine (TEA) in acetone method.
The Council has been monitoring for nitrogen dioxide by diffusion tube at ten locations
throughout the borough since 2004. Towards the end of 2010, six of these monitoring
location sites were closed and nine new locations were opened. These nine new
locations were chosen as result of the latest air quality modelling that was carried out in
2009 by Bureau Veritas on behalf of the North London Cluster Group. The modelling
identified hotspot locations where the hourly NO2 objective may be at risk of being
exceeded and where there is relevant exposure. There is currently thirteen diffusion
tube monitoring locations. Table 2.2 details the individual site details with the new site
highlighted in bold. The locations are a mixture of roadside and background sites.
Diffusion tube ref: HR14 continues to be co-located with HGY1 automatic monitoring
site; the data from which is fed into the National Diffusion Tube Co-location study.
In October 2014 two site locations were closed, HR7 and HR22. The diffusion tubes
were relocated to new hotspot areas HR29 - Stamford Hill Primary School, N15 and
HR30 – Earlsmead Primary School, Broad Lane, N15. Both sites are sensitive
receptors and are within 150m of a main road carrying >10,000 vehicles per day.
London Borough of Haringey
April 2015 Updating and Screening Assessment
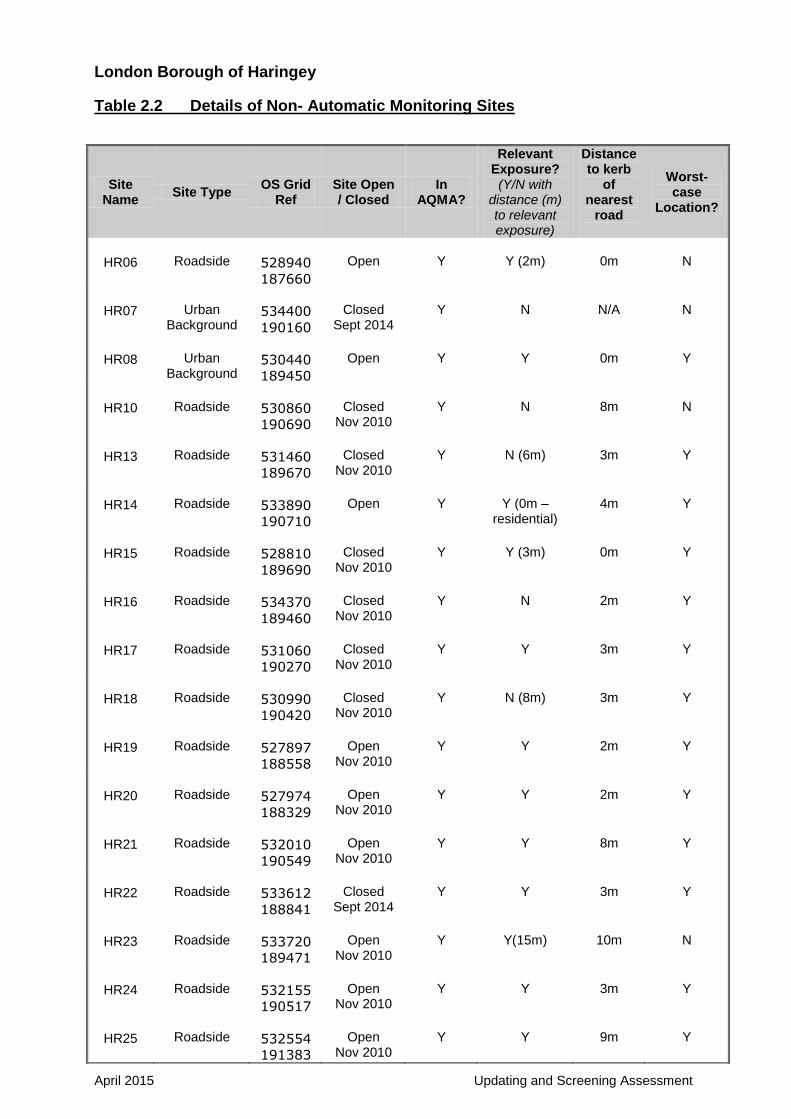
Table 2.2 Details of Non- Automatic Monitoring Sites
Site Name
Site Type OS Grid
Ref Site Open / Closed
In AQMA?
Relevant Exposure? (Y/N with
distance (m) to relevant exposure)
Distance to kerb
of nearest
road
Worst-case
Location?
HR06
Roadside
528940
187660
Open
Y
Y (2m)
0m
N
HR07
Urban
Background
534400
190160
Closed
Sept 2014
Y
N
N/A
N
HR08
Urban
Background
530440
189450
Open
Y
Y
0m
Y
HR10
Roadside
530860
190690
Closed
Nov 2010
Y
N
8m
N
HR13
Roadside
531460
189670
Closed
Nov 2010
Y
N (6m)
3m
Y
HR14
Roadside
533890
190710
Open
Y
Y (0m –
residential)
4m
Y
HR15
Roadside
528810
189690
Closed
Nov 2010
Y
Y (3m)
0m
Y
HR16
Roadside
534370
189460
Closed
Nov 2010
Y
N
2m
Y
HR17
Roadside
531060
190270
Closed
Nov 2010
Y
Y
3m
Y
HR18
Roadside
530990
190420
Closed
Nov 2010
Y
N (8m)
3m
Y
HR19
Roadside
527897
188558
Open
Nov 2010
Y
Y
2m
Y
HR20
Roadside
527974
188329
Open
Nov 2010
Y
Y
2m
Y
HR21
Roadside
532010
190549
Open
Nov 2010
Y
Y
8m
Y
HR22
Roadside
533612
188841
Closed
Sept 2014
Y
Y
3m
Y
HR23
Roadside
533720
189471
Open
Nov 2010
Y
Y(15m)
10m
N
HR24
Roadside
532155
190517
Open
Nov 2010
Y
Y
3m
Y
HR25
Roadside
532554
191383
Open
Nov 2010
Y
Y
9m
Y

London Borough of Haringey
Updating and Screening Assessment April 2015
Table 2.2 Details of Non- Automatic Monitoring Sites – cont’d
All sites are indicative of relevant exposure. The diffusion tubes are located at building
facades of schools and residential properties where possible. Only HR 23 is located as
close as possible to the main road and is set back from the main building line.
Two sites have been closed, HR7 and HR22 and replaced with two new monitoring
locations, HR 29 and HR30 which are both schools. Location HR7was a longstanding
monitoring location and so has a good data set. Results from this background location
show that the NO2 annual objective is achieved at this locale. Location HR22 was a
monitoring site for 3½ years. Results from this roadside location show that the NO2
annual objective is exceeded at this locale. The monitoring site closed as the building at
this location is to be changed from offices to residential. However this locale has been
identified as both an NO2 hotspot area and a TfL NO2 focus area. The results of the
monitoring provide confirmation of this.
Site Name
Site Type OS Grid
Ref Site Open / Closed
In AQMA?
Relevant Exposure? (Y/N with
distance (m) to relevant exposure)
Distance to kerb
of nearest
road
Worst-case
Location?
HR26
Roadside
527800
191800
Closed
Feb 2013
Y
Y
1m
Y
HR27
Roadside
531758
188872
Open
July 2011
Y
Y
5m
Y
HR28
Roadside
530063
191324
Open
Oct 2013
Y
Y
1m
Y
HR29
Roadside
532881
188049
Open
Oct 2014
Y
Y
10m
Y
HR30
Roadside
535919
188987
Open
Oct 2014
Y
Y
2m
Y

London Borough of Haringey
April 2015 Updating and Screening Assessment
2.2 Comparison of Monitoring Results with AQ Objectives
2.2.1 Nitrogen Dioxide
The borough of Haringey has been designated a whole borough Air Quality
Management Area (AQMA) for NO2, as have neighbouring boroughs. The principal
source of nitrogen dioxide (NO2) in Haringey is from road transport; increases in which
are attributed to the increase of diesel fuelled vehicles. Other releases are from
combustion processes such as boiler plant and industrial emissions. It is nitrogen
dioxide that is associated with adverse effects on human health and is one of the
pollutants of concern within the London area. Road traffic emissions are currently the
dominant source of NOx in Haringey.
Automatic Monitoring Data
Tables 2.3a and b illustrate the annual mean and 1-hour mean monitored data from the
two automatic monitoring sites operating within the borough. Exceedences of the
objectives are in red.
Both automatic monitoring locations are representative of public exposure. As can be
seen from the table, the roadside site, HGY 1 again measured exceedences of the
annual objective for NO2. For this site the nearest relevant exposure are residential
properties <4m from the kerb; the sample inlet is in line with the building façades. This
demonstrates relevant exposure and that the Council was correct in its decision to
declare an AQMA for the whole borough for NO2.
HGY2 is located in a local park and is classified as an urban background site. At this
location the annual objective of 40µg/m3 has been achieved. The overall NO2 trend
remains steady. This site is not representative of relevant exposure with the London
area, it is located in an open park.
The hourly NO2 objective was achieved at both monitoring locations, except in 2007 at
the HGY 1 site. However this uncharacteristic exceedence could have been as a result
of local building or road works taking place.
The data capture rate was low due to the poor level of service of the LSO.


London Borough of Haringey
April 2015 Updating and Screening Assessment
Table 2.3a Results of Automatic Monitoring for Nitrogen Dioxide: Comparison with Annual Mean Objective
Site ID Location
Annual mean concentrations (g/m3)
2000
2001
2002
2003
2004
2005 2006 2007
2008
2009
2010
2011
2012 2013 2014
HGY1
High Road, N17
51
48 46
52
46
42
43
42
37
42
45 (97%)
38 (74%)
42(81%)
43(100%)
48(65%)
HGY2
Priory Park N8
37
38
35
37
34
34
33
32
32
34
34 (99%)
29 (85%)
NA** Closed
Closed
HGY 4
Priory Park, N8
NA** 26(100%)
24(74%)
(%) valid data capture rate for NO2 for that year. ** Lack of data due to site relocation
Table 2.3b Results of Automatic Monitoring for Nitrogen Dioxide: Comparison with 1-hour Mean Objective
Site ID Location
Number of exceedences of hourly mean (200 g/m3)
2000
2001
2002
2003
2004
2005 2006 2007
2008
2009
2010
2011
2012
2013 2014
HGY1
High Road, N17
0
0 0
0
0
1
0
21
0
0
0 (97%)
0(74%)
0(81%)
1
0(65%)
HGY2
Priory Park N8
0 0
0
0
0
0
0
3
0
4
0 (99%)
0 (85%)
NA**
Closed
Closed
HGY4
Priory Park, N8
NA**
0 (100%)
0(74%)
(%) valid data capture rate for NO2 for that year. ** Lack of data due to site relocation Data affected by Tottenham riots. All data is ratified to AURN standards.


London Borough of Haringey
April 2015 Updating and Screening Assessment
Diffusion Tube Monitoring Data
All the diffusion tube results have been appropriately bias adjusted, using the analytical
laboratory adjustment factors. These are highlighted in bold, with bias adjusted
exceedences in red. Data is for a 12 month period and tubes are exposed in
accordance with the UK Defra guidance LAQM.TG(09).
Diffusion tubes are considered to have limitations and have poor accuracy. In 2000 the
government recommended that tubes should be co-located with an automatic analyser
to determine a bias adjustment factor, which is then applied to the raw annual average
concentrations for the same year to obtain bias adjusted results. Haringey co-locates a
diffusion tube at HGY1 (High Road, Tottenham) and submits the data annually. It is the
laboratory average adjustment factor (Lambeth Scientific Services) that is applied to the
raw annual average concentrations for the correct year to obtain the bias adjusted
results. The bias adjustment factors are on the website;
http://laqm.defra.gov.uk/bias-adjustment-factors/national-bias.html The bias adjustment factor used for 2014 is 0.80 The raw data from the co-located diffusion tube is submitted annually to the NO2
diffusion tube network data managers for verification of the diffusion tubes and
calculation of the laboratory bias adjustment factor.
Tables 2.4a and b illustrates the annual mean measured data from diffusion tube sites
within the borough.
Table 2.4a Results of Nitrogen Dioxide Diffusion Tubes
Location
2011(g/m3)
2012(g/m3)
2013(g/m3)
2014(g/m3)
Bias Adjustment Factor
1.06 0.91 0.83 0.80
HR06
58.5 (62) 76.1 (69) 67.8 (56) 53 (42)
HR07
30.8 (33) 35 (32) 35.3 (29) 30.9 (25)
HR08
34.8 (37) 34.9 (32) 36.3 (30) 31 (25)
HR14**
41.7 (44) 50.7 (46) 46.7 (39) 45.9 (37)
HR19
38.5 (41) 50.4 (46) 48.9 (41) 42.6 (34)

London Borough of Haringey
Updating and Screening Assessment April 2015
Location
2011(g/m3)
2012(g/m3)
2013(g/m3)
2014(g/m3)
Bias Adjustment Factor
1.06 0.91 0.83 0.80
HR20
36.80 (39) 40.4 (37) 37.9 (32) 36.4 (29)
HR21
38.1 (40) 36.2 (33) 41.9 (35) 36.9 (30)
HR22
46.3 (49) 53.2 (48) 50.3 (42) 46.7 (38)
HR23
39.3 (42) 41.1 (37) 48.8 (41) 37.7 (30)
HR24
42 (45) 45.7 (42) 49.9 (41) 41.4 (33)
HR25
34.2 (36) 40.3 (37) 40.8 (34) 40.8 (34)
HR26
47.2 (50) 53.8 (49) _ _
HR 27
39.7 (42) 48.6 (44) 48.7 (40) 40.5 (33)
HR28
_ _ 48.3 (40) 37 (30)
HR29
_ _ _ Only 2 months data
HR 30
_ _ _ Only 2 months data
** Co-located diffusion tube with NO2 analyser – HGY1 Bias adjusted results are highlighted in bold using the analysing laboratory adjustment
factors. Those highlighted in red indicate an exceedence of the annual objective. Sites
HR07 and HR22 were closed in October and replaced with sites HR29 and HR30 –
which are schools in identified NO2 hotspot areas.
All of the sites are roadside sites, except the new site HR29, which is in a school
playground. All of the sites represent relevant exposure indicating the NO2
concentrations at residential façades and schools. HR06, which is located on a building
façade on the A1 (Archway Road), is the only site to show an exceedence of the hourly
objective. It is indicative of relevant exposure with residential dwellings fronting this
major road through London.
With the exception of 3 sites, all of the diffusion tubes above are located in or adjacent
to hotspot locations, as identified by the Bureau Veritas AQ modelling.

London Borough of Haringey
April 2015 Updating and Screening Assessment
Table 2.4b Historical Results of Nitrogen Dioxide Diffusion Tubes Monitoring
Annual Mean Concentrations (g/m3) – adjusted for bias.
2004 2005 2006 2007 2008 2009 2010
Bias adjustment Factor 1.19 1.24 1.28 1.07 0.98 1.03 1.08
HR06 74 70 69 67 72 72 72
HR07 37 35 34 36 32 33 38
HR08 36 36 38 27 34 35 36
HR10 56 34 30 27 39 33 39
HR13 77 77 85 75 74 75 71
HR14 39 47 55 36 46 48 47
HR15 60 52 62 50 44 55 57
HR16 57 60 62 49 60 69 24
HR17 70 85 96 69 73 86 69
HR18 70 57 65 59 69 66 69

London Borough of Haringey
Updating and Screening Assessment April 2015
2.2.2 PM10
The London Borough of Haringey is designated an AQMA for PM10, as have
neighbouring boroughs. The principal source of PM10 in Haringey is attributed to diesel
fuelled vehicles, in particular HGVs, LGVs and buses. This was illustrated at the Stage
IV Review and Assessment. These small particles (<10µm diameter) can be breathed
into the deepest parts of the lung, carrying with them a range of both natural and man
made substances and are associated with both respiratory and cardio-vascular health
problems.
The principal sources of fine particulates (PM10) can be divided into three main
categories; Primary Sources - from combustion sources including road traffic, power
generation and industrial combustion, Secondary sources - formed from chemical
reactions in the atmosphere and Coarse Sources – all other sources including
resuspended dusts, construction work dust, mineral extraction works, wind-blown dusts
and soils, including sea salt and biological particles.
See section 2.1.1 for an explanation of data management and validation. Tables 2.5a
and b illustrate the annual mean and 24hour means monitored data from the automatic
monitoring sites operating within the borough. All results from TEOM PM10 analysers
from 2004 onward have been converted to reference equivalence using the volatile
correction method.
In June 2009 an FDMS (Filter Dynamics Measurement System) was installed at the
HGY1 site to measure concentrations of PM2.5. The results are not reported here as
local authorities do not have responsibility for PM2.5; the Government’s approach is to
set a national exposure reduction target defined as a percentage reduction in annual
average concentrations of PM2.5.
The tables show there has been no exceedences of either the annual mean PM10 or
the 24 hour mean objective. For HGY1 the nearest relevant exposure is residential
properties which are within 4m from the kerbside. Defra removed the PM10 monitor for
use at another location outside of Haringey. HGY2 is located in a park and is classified
as an urban background site. This site is not representative of relevant exposure with
the London area. Haringey no longer monitors for PM10.

London Borough of Haringey
April 2015 Updating and Screening Assessment
Table 2.5a Results of PM10 Automatic Monitoring: Comparison with Annual Mean Objective
Site ID
Location Within
AQMA?
Annual mean concentrations (g/m3)
2000 2001 2002 2003 2004 2005 2006 2007 2008 2009 2010 2011
2012 2013 2014 **
HGY1
High Road, N17
Y
26
27
27
29
23
24
24
26 (72%)
21 (66%)
21
23
NA
23
25
No data
HGY2
Priory Park N8
Y
22
25
26
29
30
23
26
26 (68%)
20
18
17
19*
N/A
_
_
(%) Data capture rate – where below 75% Data for year is not fully ratified. Data affected by Tottenham riots.
Table 2.5b Results of PM10 Automatic Monitoring: Comparison with 24-hour Mean Objective
Site ID
Location Within
AQMA?
Number of Exceedences of daily
mean objective (50 g/m3)
If data capture < 90%, include the 90th
%ile of daily means in brackets.
2000 2001 2002 2003 2004 2005 2006 2007 2008 2009 2010 2011
2012 2013 2014 **
HGY1
High Road, N17
Y
12
14
15
34
7
16
11
22 (72%)
6 (66%)
5
9
NA
11
13
No data
HGY2
Priory Park N8
Y
11
12
11
34
17
13
10
13 (68%)
8
1
1
8*
_
_
_
(%) Data capture rate – where below 75% ** PM10 analyser removed from site. *Data for year is not fully ratified. Data affected by Tottenham riots.


London Borough of Haringey
April 2015 Updating and Screening Assessment
2.2.3 Sulphur Dioxide
The principal source of sulphur dioxide (SO2) is from power stations and industrial
combustion sources. Other sources include domestic and commercial heating.
Concentrations of sulphur dioxide have declined as a result of industries switching from
oil or coal-fired heating to gas-fired heating and reductions in the sulphur content of
vehicle fuel.
As Sulphur Dioxide is no longer a pollutant of concern in Haringey, the London Borough
of Haringey no longer monitors sulphur dioxide. Monitoring for this pollutant stopped in
March 2011.
2.2.4 Benzene
Monitoring Data The first round of review and assessment identified no exceedences of the benzene
objective in the borough of Haringey. This pollutant is not monitored
2.2.5 Other pollutants monitored
Ozone is monitored for at the HGY 2 site. Ozone is not a pollutant of concern for Local
Authorities and so is not reported on in this assessment.
2.2.6 Summary of Compliance with AQS Objectives
The London Borough of Haringey has examined the results from monitoring in the
borough. Overall Nitrogen dioxide measured concentrations have decreased and are
below the AQS objectives with the exception of two locations where the annual objective
is exceeded. The whole borough is declared an Air Quality Management Area for
nitrogen dioxide; there is no requirement to proceed to a detailed assessment.

London Borough of Haringey
Updating and Screening Assessment April 2015
3 Road Traffic Sources
3.1 Narrow Congested Streets with Residential Properties Close to the Kerb
The London Borough of Haringey confirms that there are no new/newly identified congested streets with a flow above 5,000 vehicles per day and residential properties close to the kerb, that have not been adequately considered in previous rounds of Review and Assessment.
3.2 Busy Streets Where People May Spend 1-hour or More Close to Traffic
The London Borough of Haringey confirms that there are no new/newly identified busy streets where people may spend 1 hour or more close to traffic.
3.3 Roads with a High Flow of Buses and/or HGVs.
The London Borough of Haringey confirms that there are no new/newly identified roads with high flows of buses/HGVs.
3.4 Junctions
The London Borough of Haringey confirms that there are no new/newly identified busy junctions/busy roads.

London Borough of Haringey
April 2015 Updating and Screening Assessment
3.5 New Roads Constructed or Proposed Since the Last Round of Review and Assessment
The London Borough of Haringey confirms that there are no new/proposed roads.
3.6 Roads with Significantly Changed Traffic Flows
The London Borough of Haringey confirms that there are no new/newly identified roads with significantly changed traffic flows.
3.7 Bus and Coach Stations
The London Borough of Haringey confirms that there are no relevant bus stations in the Local Authority area.
London Borough of Haringey
Updating and Screening Assessment April 2015
4 Other Transport Sources
4.1 Airports
The London Borough of Haringey confirms that there are no airports in the Local Authority area.
4.2 Railways (Diesel and Steam Trains)
The London Borough of Haringey confirms that there are no locations where diesel or steam trains are regularly stationary for periods of 15 minutes or more, with potential for relevant exposure within 15m.
4.2.1 Stationary Trains
The London Borough of Haringey confirms that there are no locations where diesel or steam trains are regularly stationary for periods of 15 minutes or more, with potential for relevant exposure within 15m.
4.2.2 Moving Trains
The London Borough of Haringey confirms that there are no locations with a large number of movements of diesel locomotives, and potential long-term relevant exposure within 30m.
4.3 Ports (Shipping)
The London Borough of Haringey confirms that there are no ports or shipping that meets the specified criteria within the Local Authority area.
London Borough of Haringey
April 2015 Updating and Screening Assessment
5 Industrial Sources
5.1 Industrial Installations
5.1.1 New or Proposed Installations for which an Air Quality Assessment has been carried out
The London Borough of Haringey confirms that there are no new or proposed industrial installations for which planning approval has been granted within its area or nearby in a neighbouring authority.
5.1.2 Existing Installations where Emissions have increased substantially or New Relevant Exposure has been introduced
The London Borough of Haringey confirms that there are no industrial installations with substantially increased emissions or new relevant exposure in their vicinity within its area or nearby in a neighbouring authority.
5.1.3 New or Significantly Changed Installations with No Previous Air Quality Assessment
The London Borough of Haringey confirms that there are no new or proposed industrial installations for which planning approval has been granted within its area or nearby in a neighbouring authority.
5.2 Major Fuel (Petrol) Storage Depots
There are no major fuel (petrol) storage depots within the Local Authority area.
5.3 Petrol Stations
The London Borough of Haringey confirms that there are no petrol stations meeting the specified criteria.

London Borough of Haringey
Updating and Screening Assessment April 2015
5.4 Poultry Farms
The London Borough of Haringey confirms that there are no poultry farms meeting the specified criteria.

London Borough of Haringey
April 2015 Updating and Screening Assessment
6 Commercial and Domestic Sources
6.1 Biomass Combustion – Individual Installations
The table below identifies known biomass boilers in operation within the London Borough of Haringey area. As can be seen from the table, information regarding these is vague
Location
Biomass Plant Assessment Information
Tottenham Hale Village
2 x Lin-Ka 1.6 MW (aggregated to > 3MW).
An air quality assessment was carried out as part of the planning application and the biomass was assessed as not having a significant impact on the nearest residential receptors.
Woodside High School
Borag-Gilles 240Kw. Installed during summer 2010. An air quality assessment has not been submitted with the planning application.
Hornsey Depot, N8 – Network Rail
300kW – Max combustion rate – 106Kg/h.
Installed in 2012. An air quality assessment was submitted with the planning application – the biomass was assessed as not having a significant impact.
308 West Green Road, N15 3QR
No information.
6.2 Biomass Combustion – Combined Impacts
The London Borough of Haringey confirms that there are biomass combustion plants in the Local Authority area – see above. All have been assessed for impact on local air quality at the planning stage.
6.3 Domestic Solid-Fuel Burning
The London Borough of Haringey confirms that there are no areas of significant domestic fuel use in the Local Authority area.

London Borough of Haringey
Updating and Screening Assessment April 2015
7 Fugitive or Uncontrolled Sources
The London Borough of Haringey confirms that there are no potential sources of fugitive particulate matter emissions in the Local Authority area.

London Borough of Haringey
April 2015 Updating and Screening Assessment
8 Conclusions and Proposed Actions
8.1 Conclusions from New Monitoring Data
The pollutants of concern in Haringey, as most of London are NO2 and PM10. New
monitoring data for 2014 shows no exceedences of the PM10 annual mean and 24 hour
objective; although monitoring for this pollutant is no longer carried out. Although
monitoring for PM2.5 is carried out in Haringey, it is not reported on here as it is not a
pollutant of local authority requirement. NO2 levels have been exceeded or are close to
the annual objective at monitoring locations adjacent busy roads. Monitoring data
indicates no exceedences of the hourly NO2 objective; which generally occurs where the
annual mean is above 60µg/m3. All monitoring undertaken is within the Air Quality
Management Area (AQMA).
These results continue to demonstrate that it is not appropriate to revoke the ‘Air Quality
Management Area’ status for the London Borough of Haringey. The elevated levels of
NO2 are due to diesel fuelled vehicles; such as buses, HGV’s, vans and also as a direct
result of the diesel particulate filters fitted to London buses and HGV’s. These filters
deliberately produce NO2 to help oxidise particles.
8.2 Conclusions from Assessment of Sources
There are no new local sources that might affect local air quality, such as.
New industrial processes
New retail or mixed use developments that could significantly
change traffic flows
New landfills sites, quarries etc with nearby public exposure
New road schemes or significant changes to existing road schemes
There are no landfills, quarries or Part A/A1 industrial processes in Haringey. With
respect to ‘Part B’ permitted installations, in December 2014 there were a total of 4
industrial premises, 16 service stations and 44 dry cleaner premises permitted.

London Borough of Haringey
Updating and Screening Assessment April 2015
The majority of new or planned developments over the last year have been residential
or mixed-use developments. Very few are large enough to have a significant impact on
local traffic flows. Major developments approved during the year for which air quality
was a consideration include:
St Ann’s redevelopment - mixed use development to include residential and
hospital services. The air quality assessment considered that there would be
exceedences of the NO2 objective adjacent the main road.
332 – 334 High Road, N15 - the air quality assessment determined
exceedences of and mitigation measures were conditioned.
Hornsey re-Use and Recycling Centre, High Street, Hornsey, N8 – the air quality
assessment determined no exceedences of any AQ objectives.
Major planning applications for which air quality was not considered are:
Image House, Station Road, N17 – 96 Bedroom Hotel
Vacant land between 17 & 34 Pretoria Road, London, N17 – four storey building
providing 52 residential units.
Haringey endeavours to use the planning process to minimise the impact on local traffic
to prevent increases in congestion and worsening air quality. Not all planning
applications require a detailed air quality assessment to be carried out, but an effort is
made to consider each major application with a regard to air quality, particularly in
hotspot areas.
There have been no new road schemes or significant changes to existing road schemes
which will impact on air quality.
Notwithstanding the above, biomass boilers can have an impact on local air quality,
particularly for NO2 emissions.
The increase in construction and demolition will have a local influence on air quality.
Such fugitive sources have been factored into the AQMA for PM10; so no changes are
required.
London Borough of Haringey
April 2015 Updating and Screening Assessment
8.3 Proposed Actions
The updating and screening assessment has not identified the need for any detailed
assessment for any pollutant and has not identified the need for any additional
monitoring or changes to the existing programme.
Haringey’s automatic monitoring stations are affiliated to the national automatic network,
the AURN. Monitoring of hotspot locations will continue to be carried out by diffusion
tubes for the foreseeable future.
Planning applications will continue to be considered for demolition and construction dust
impacts and conditioned accordingly; with respect to the guidance detailed in the
Greater London Authority’s Supplementary Planning Guidance document for The
Control of dust and Emissions during Construction and Demolition.

London Borough of Haringey
Updating and Screening Assessment April 2015
9 References
The Increasing Importance of Primary NO2 emissions David Carslaw, University of Leeds, 2007.
Local Air Quality Management Technical Guidance LAQM.TG(09)
www.LondonAir.Org
www.uk-air.defra.gov.uk
LB Haringey Borough Profile 2008
Haringey’s Sustainable Community Strategy 2007 - 2016
Diffusion tube inter-comparison exercise http://laqm.defra.gov.uk/bias-adjustment-factors/national-bias.html
The Control of Dust and Emissions during Construction and Demolition (GLA) https://www.london.gov.uk/sites/default/files/Dust%20and%20Emissions%20SPG%208%20July%202014_0.pdf
London Borough of Haringey
April 2015 Updating and Screening Assessment
Appendices
Appendix 1: Monitoring Station locations.


London Borough of Haringey
April 2015 Updating and Screening Assessment
Haringey Monitoring Sites - December 2014 Licence number 100019199 (2015).
HR 28
HR08
HGY2
HR06
HR07
HR14 HGY1
HR19
HR20
HR21
HR22
HR23
HR24
HR25
HR26
HR27
HR 29
HR 30


London Borough of Haringey
April 2015 Updating and Screening Assessment
Appendix A: QA:QC Data
Diffusion Tube Bias Adjustment Factors
The diffusion tubes are prepared and analysed by Lambeth Scientific Services who
are a UKAS accredited laboratory. This laboratory participates in the WASP scheme
(Workplace Analysis Scheme for Proficiency) to meet European standards and is
involved in the network field inter-comparison exercise operated by NETCEN, which
assesses the sampling and analytical performance of the tubes.
Nitrogen dioxide diffusion tubes are prepared using a 50% triethanolamine (TEA) in
acetone.
Factor from Local Co-location Studies (if available) One diffusion tube is co-located with an automatic analyser for NO
2. This is at the
High Road monitoring site (HGY1). All diffusion tube results have been appropriately
bias adjusted, using the analytical laboratory adjustment factors; as only one
diffusion tube is co-located.
For all diffusion tube results, both raw and bias adjusted measured data, see Tables
2.4a and 2.4b
PM Monitoring Adjustment All TEOM data reported in this report has been ratified and validated by
(Environmental Research Group) ERG, Kings College, London and included in the
London Air Quality Monitoring Network.
Short-term to Long-term Data adjustment Not applicable as none carried out.
QA/QC of automatic monitoring
As mentioned previously, all automatic monitoring data is validated and ratified by the
Environmental Research Group (ERG). Fortnightly calibrations are carried out by the
LSO.

London Borough of Haringey
Updating and Screening Assessment April 2015
QA/QC of diffusion tube monitoring Co-ordination of a quality assurance/quality control (QA/QC) framework, aimed at the
analytical laboratories that supply and analyse the diffusion tubes currently
comprises
• Promotion of the independent Workplace Analysis Scheme for Proficiency
(WASP), operated by the Health and Safety Laboratory, with yearly
assessment against agreed performance criteria.
• Operation of a field intercomparison exercise, in which diffusion tubes are co-
located with an automatic analyser: from January 2006 this is at a roadside
site.
• Operation of a QC solution testing scheme. Participation is recommended for
any laboratory that prepares or analyses NO2 diffusion tubes used by Local
Authorities for LAQM purposes.
Quarterly summaries of participating laboratories' performance in the WASP scheme
over the preceding 12 months, prepared by AEA, are available by clicking on the
links below:
http://laqm.defra.gov.uk/bias-adjustment-factors/national-bias.html

London Borough of Haringey
April 2015 Updating and Screening Assessment
Appendix B: DMRB Calculations No DMRB calculations conducted.


London Borough of Haringey
April 2015 Updating and Screening Assessment
London Borough of Haringey
Air Quality Action Plan Measures
2014 Update

London Borough of Haringey
Updating and Screening Assessment April 2015
Action Plan Progress
Measure 1 To Lead by Example and Reduce Emissions from the Council Fleet
Progress The council owned vehicle fleet has diminished due to outsourcing, with only a handful of council owned vehicles remaining. Vehicles remaining in council ownership are compliant with the requirements of the Low Emission Zone.
In 2014 two Mitsubishi I-Miev (100% electric) vehicles were acquired in Haringey’s Council fleet for general staff use.
Measure 2 Electric Vehicle Charging Points
Progress BluePointLondon (BPL) took over ownership of the Source London charging network from TfL on 1st September 2014 including
Haringey’s 17 charging point locations (providing 21 charging parking spaces), which remain part of the Source London network.
Haringey Council are in the process of signing a variation agreement allowing BPL to take over maintenance responsibilities and associated costs, such as repairs, insurance and electricity use for Haringey’s Source London Charging network. The Council will also receive a fixed amount per year per dedicated EV bay (based on Haringey’s charging points being in Zone 3 of London Underground zone). An additional 20% of cumulated net profit will be proportionally shared with partners once BPL is profitable and pro-rata of the number of points in boroughs. BPL will also invest in expanding the network of points (including costs), as part of plans to install 6000 new charging points across the Source London network and will raise awareness to encourage electric vehicle uptake.
Measure 3 Car Clubs
Progress
Haringey’s Zipcar fleet remains at 72 vehicles at the end of 2014. During 2014 member levels and vehicle utilisations began rising again following a slow down in 2013; a consequence of the effects of increased fleet operational costs and the economic recession. The sector is confident of further growth during 2015 and beyond. Looking forward, Haringey Council will be introducing multi operator contracts for on street car club provision in Haringey, when the current single operator contract with Zipcar expires in the summer of 2015. The benefits of introducing a multi operator car club market in Haringey will include:
Providing existing car club members with a greater choice of car club vehicles to access.
Increasing car club vehicle accessibility will encourage new membership and facilitate further car club expansion. Increasing operator choice also benefits developers looking to install car club vehicles in new developments.
The multi operator approach will build on the network built on the momentum and success of the borough’s existing car club network and growing membership base established by Zipcar over the last 6 years.

London Borough of Haringey
April 2015 Updating and Screening Assessment
Measure 4 Travel Plans
Progress LBH encourages and supports all schools across the borough to develop and implement school travel plans. These travel plans demonstrate how schools are implementing initiatives to make travel safer and more sustainable for students, parents and staff. They are an important tool to encourage modal shift. Engaged schools have access to additional resources, as well as enabling the STH team to promote initiatives and messages more effectively. 17 schools had travel plans in the academic year 2011-12. 2012-13 saw a more than twofold increase in the number of schools with travel plans to 46. In 2013-14, the figure increased again, to 52 schools. With a total of 69 schools in the borough, this means over three quarters now have travel plans. Mode shares (%) for LBH schools with travel plans Source: TfL (2014) www.tfl.gov.uk/stars
A Workplace Travel Plan Officer is shared with the Boroughs of Enfield, Haringey and Waltham Forest. With Green issues at the top of the political agenda an effective travel plan can help an organisation to reduce air pollution and provide sustainable travel options. To ensure that this is as effective as possible, STH actively works with the business community to encourage the adoption of travel plans and other sustainable transport initiatives, on a voluntary basis. In 2014, 15 of the larger local organisations successfully implemented workplace travel plan measures, such as cycle training and free oyster cards. STH will continue to provide ongoing support and monitoring in 2015.

London Borough of Haringey
Updating and Screening Assessment April 2015
Measure 5 20 mph zones / DIY streets
Progress Haringey Council consulted residents on proposals to introduce 20mph zone on all Council maintained roads following Cabinet approval on 18
th June 2013. Subsequently the Council’s Cabinet approved the introduction of a 20mph limit for all residential roads
and roads in the borough’s town centres, with the exception of main roads which at this stage are retained as 30mph. The attached map shows the excluded roads from the 20mph limit. A statutory notification is planned for 2015 for the possible introduction of the 20mph limit in the borough.
DIY streets were renamed to Community Streets projects in 2013, when 2 such projects were implemented; in Warwick Gardens area and Hornsey. Further Community Streets schemes commenced in the Tottenham Hale, Tottenham Green and Hornsey Park neighbourhoods areas in 2014/15. Community engagement is undertaken to identify issues and priorities for further development, along with the delivery of a series of quick win projects including tree planting, bike hangars, street lighting improvements and decluttering.

London Borough of Haringey
April 2015 Updating and Screening Assessment
Measure 6 No Idling Zones
Progress No progress has been made. There have been no amendments / changes to the legislation; the Fixed Penalty fine for idling vehicles remains at £20.
Measure 7 Green Travel Promotion
Progress There are a number of national and local campaigns to encourage take-up of sustainable modes of transport promoted by Haringey’s Smarter Travel Team, more information can be found at http://www.haringey.gov.uk/index/environment_and_transport/travel/smartertravel.htm. Marketing and promotional activity during 2013-14 was both intensive and extensive. A variety of marketing materials were produced using different media, and a total of 26 events were run. During 2013-14, STH events interacted with over 1,300 people. The STH and Road Safety Education web pages saw an increase in views between 2012-13 and 2013-14, 19% overall and 116% relating to cycling web pages. A survey conducted at STH road shows found that 35% of respondents had heard of STH prior to visiting a road show, an increase compared with the previous year's results. Results from a survey undertaken at Walk and Cycle to the Shops events, showed that a similar proportion of respondents, 32%, had heard of STH prior to attending an event. A range of active travel projects were carried out in 2013-14, including five funded via community grants. All of these projects reached a large number of local people, with encouraging outcomes, e.g.:
24 participants on the Bikeworks Recycle the Way you Travel bike maintenance and training course, who provided excellent feedback
32% increase in number of school pupils receiving cycle training and 59% increase in number of other individuals receiving cycle training from 2012-13 to 2013-14
149 activities delivered through Bike It+, with all six participating schools increasing the number of pupils regularly cycling to school
over 1,000 participants in the Pedal Power Cycling Club
a 52% increase in the number of Dr Bike sessions delivered and a 183% increase in the number of bikes repaired/serviced between 2012-13 and 2013-14.

London Borough of Haringey
Updating and Screening Assessment April 2015
Measure 8 Cycle Routes and Cycle Parking
Progress Haringey has a network of cycle routes across the borough including cycle lanes on main roads, separated cycle lanes and special fully signed, quiet routes. The borough is also part of the London Cycle network with cycle routes linking into those in neighbouring boroughs.
The council has produced ‘Smarter Travel Cycling Guide’ detailing information such as bicycle types, safety tips, local bike shops, cycle clubs operating in Haringey, tips on bike security and suggested routes. It is one of the most popular of the Smarter Travel marketing materials. In a Personal Travel Planning Project undertaken in 2014 over 1200 guides were requested by local residents. The council works closely with TfL to develop new cycle routes, including the redevelopment of the Tottenham one way system into two way and CS1. Consultation is still ongoing regarding a proposed electric bike scheme in the west of the Borough.
A total of 30 cycle stands and a “Bikehangar” with spaces for six bikes were installed during the 2013-14 financial year. A total of 39 additional cycle stands are planned for 2015, which will bring the total number of cycle stands across Haringey to 736. The council, through the Smarter Travel Programme, continues to offer cycle training to schools and individuals.
The following table shows the numbers of school pupils and other individuals trained. There has been an upwards trend in the numbers trained over 2008-14. The number of school pupils trained between 2013-14 shows a 32% increase and the number of other individuals trained shows a 50% increase over the previous year’s figures.
Cycle train
The council continues to work with the Haringey Cycling Campaign www.haringeycyclists.org
April to April
April to March
April to March
April to August
2007-8 2008-9 2009-10 2010-11 2011-12 2012-13 2013 -14 2014
School pupils 432 626 728 551 684 761 1,004 378
Individuals 1:1 143 142 211 179 229 239 359 267
Totals 575 768 939 730 913 1,000 1,363 645

London Borough of Haringey
April 2015 Updating and Screening Assessment
Measure 9 North London Transport Forum
Progress Whilst Haringey council continues to work with TfL on improvements to transport modes, of air quality concern are the TfL improvement works to the Tottenham Hale Gyratory system; including returning the one way system to a 2-way system is predicted to increase traffic flow by some 25% along sections of the road and coupled, with possible decrease in speed limit may impact negatively on air quality.
In 2014/15, the NLTF:
Supported a sub-regional cycling officer group and completed mapping of proposed new routes and potentially cyclable trips.
With London Cambridge Stansted Consortium partners successfully delivered a campaign to raise the profile of the West Anglia Route which directly contributed to the Secretary of State for Transport creating a West Anglia Rail Taskforce.
Made the case for further investment in the development of the Crossrail 2 Regional Option as well as supporting an extension to New Southgate and further work to look at a future eastern extension.
Closely engaged with Network Rail as they developed the Draft Anglia Route Study and, working with the GLA and other key partners, made a case for additional investment to be considered for the West Anglia Route.
Made a strong case to the DfT for devolution of inner suburban rail services to TfL and, following the announcement of the devolution of some West Anglia services, engaged with TfL and LOROL to work through the practicalities.
Developed and agreed north London priorities for the specification for next West Anglia rail franchise.
Made the case for the Central Line to be an early priority for major upgrades as part of the New Tube for London programme.
Provided a forum for updates and discussions on the work of the Roads Rask Force as well as providing input into areas of work including identifying priorities schemes and locations.
The North London Transport Forum officer group continues to meet bi-monthly with good attendance across the invited boroughs. As well as regular updates on ongoing areas of work there were also presentations on innovative approaches (for example the Future Cities Catapult) and best practice (such as West London’s approach to monitoring travel planning arising from developments).
Identifying Priorities
For 2014/15 the partnership has identified a number of priorities:
Supporting Londoners to cycle.
Securing additional further investment for the rail network, particularly for larger, longer term schemes.
Identifying whether there are sub-regional areas of work arising from the Mayor’s Accessibility Implementation Plan.
Making the bus network in north London more effective.
Engaging with the work of the Roads Task Force including identifying opportunities for effective interventions in north London.
Addressing the barriers / gaps that prevent some local stations from being effective orbital / radial interchanges.
Getting a better understanding the issues and opportunities relating to freight in north London.
Opportunities for linking travel planning with development control.
Ensuring that transport contributes to public health including by encouraging more people to walk.

London Borough of Haringey
Updating and Screening Assessment April 2015
Measure 10 Determining the Impact of developments on Local Air Quality
Progress All major developments in Haringey, or developments which are likely to expose new residents to poor air quality or have an air quality impact, require air quality to be considered planning application stage. In 2014 air quality was a consideration at the planning application stage for 3 major proposed developments.
Air quality continues to be a requirement for consideration on all major planning applications and is included on the council’s planning application validation checklist.
Major applications are defined as those which involve the creation of 10 or more residential units; residential development of on a site of 0.5 hectares or more; non‐residential development on a site of at least 1 hectare; and the creation of change of use of 1000 square metres or more of gross floor space (not including housing).
Measure 11 Car Free Developments
Progress Number of applications accompanied/requested Transport Assessments
- 2011/12 = 6 - 2012/13 = 5 - 2013/14 = 6 -2014/15 = 10
Number of applications proposing/requesting development car-free
-2011/12 = 18 (5 of these were withdrawn/refused) -2012/13 = 21 (2 of these were withdrawn/refused) - 2013/14 = 24 (11 of these were withdrawn/refused) -2014/15 = 32 (10 of these were withdrawn/refused)
Number of applications accompanied/requested Travel Plan
-2011/12 = 18 (3 of these were withdrawn/refused) -2012/13 = 17 (3 of these were withdrawn/refused) -2013/14 = 26 (4 of these were withdrawn/refused) -2014/15 = 25 (9 of these were withdrawn/refused)
Measure 12 Control of Dust during demolition and construction phases
Progress All approved major and medium sized developments are required via a planning condition to submit a construction management plan and also to state dust control measures from demolition and construction sites. Larger sites are required to register with the Considerate Constructors Scheme.

London Borough of Haringey
April 2015 Updating and Screening Assessment
Measure 13 Biomass Boilers
Progress Control of emissions from biomass boilers through the planning system has not progressed. However for large developments with Energy plans/ statements; there has been a notable abandonment of biomass due to the air pollution impact of emissions. No biomass boilers were proposed in 2014.
Measure 14 Tree Planting
Progress A total of 856 new trees were planted during the 2010/11 and 2011/12 planting seasons of which 641 were street trees.
During the 2012/13 planting season, 366 trees were planted, of which 262 were street trees. 1,212 new trees were planted between 2010 and 2013. 250 trees were planted during the 2013/14 planting season.
A total of 658 new trees were planted during the 2014/15 planting seasons of which 485 were street trees.
The Council has revised and updated its Tree Strategy 2014 - 2018, which was consulted on in 2013. The target is to plant at least 250 trees each year, ensuring that 50 more trees are planted than removed each year. In Haringey there are approximately 1700 TPO’s in place.
Measure 15 Controlling emissions through climate change actions
Progress The council continues to promote sustainable living measures for issues such as water, energy, food and travel. In addition to the Haringey 40:20; an ambitious target to reduce CO2 emissions in the borough by 40% by 2020, the council has set a target to reduce CO2 emissions from its buildings of 40% by 2015, 5 years ahead of the borough wide target. Each year Haringey council produces an annual carbon report which will provide a transparent year on year account of progress made to reduce carbon emissions from the Council's operations and the borough as a whole. The report can be downloaded at: http://harinet.haringey.gov.uk/index/environment_and_transport/going-green/reducing-co2-emissions.htm
Measure 16 Industrial Process Emissions
Progress Haringey council continues to ensure that emissions to atmosphere from small industrial businesses are controlled and regulated in accordance with the Environmental Permitting (England and Wales) Regulations 2010.
As at December 2014 there were 44 dry cleaners premises, 5 Part B premises and 16 petrol stations permitted to operate in the borough.
Measure 17 Smoke and Emissions from Bonfires
Progress The council continues enforce smoke emissions from bonfires. In 2011 there were 111 bonfire complaints received and in 2012, 78 bonfire complaints and in 2013 there were 100 bonfire complaints. In 2014, a total of 71 bonfire complaints were received.
London Borough of Haringey
Updating and Screening Assessment April 2015
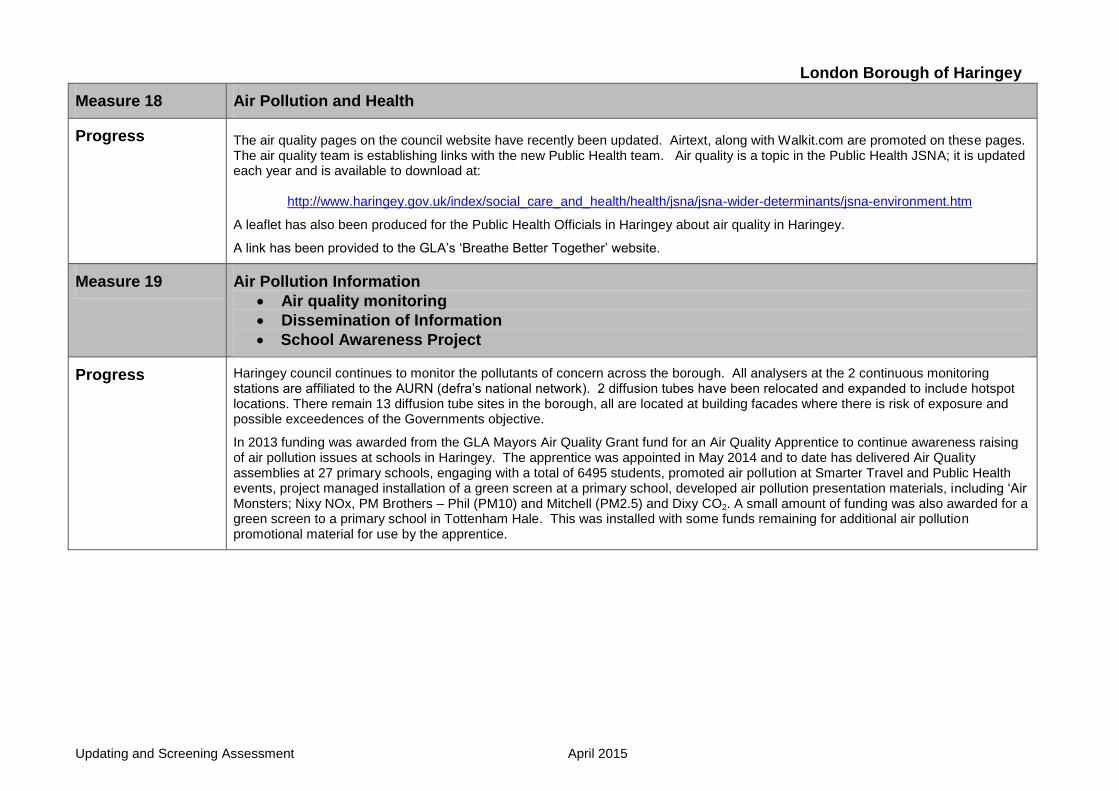
Measure 18 Air Pollution and Health
Progress
The air quality pages on the council website have recently been updated. Airtext, along with Walkit.com are promoted on these pages. The air quality team is establishing links with the new Public Health team. Air quality is a topic in the Public Health JSNA; it is updated each year and is available to download at:
http://www.haringey.gov.uk/index/social_care_and_health/health/jsna/jsna-wider-determinants/jsna-environment.htm
A leaflet has also been produced for the Public Health Officials in Haringey about air quality in Haringey.
A link has been provided to the GLA’s ‘Breathe Better Together’ website.
Measure 19 Air Pollution Information
Air quality monitoring
Dissemination of Information
School Awareness Project
Progress Haringey council continues to monitor the pollutants of concern across the borough. All analysers at the 2 continuous monitoring stations are affiliated to the AURN (defra’s national network). 2 diffusion tubes have been relocated and expanded to include hotspot locations. There remain 13 diffusion tube sites in the borough, all are located at building facades where there is risk of exposure and possible exceedences of the Governments objective.
In 2013 funding was awarded from the GLA Mayors Air Quality Grant fund for an Air Quality Apprentice to continue awareness raising of air pollution issues at schools in Haringey. The apprentice was appointed in May 2014 and to date has delivered Air Quality assemblies at 27 primary schools, engaging with a total of 6495 students, promoted air pollution at Smarter Travel and Public Health events, project managed installation of a green screen at a primary school, developed air pollution presentation materials, including ‘Air Monsters; Nixy NOx, PM Brothers – Phil (PM10) and Mitchell (PM2.5) and Dixy CO2. A small amount of funding was also awarded for a green screen to a primary school in Tottenham Hale. This was installed with some funds remaining for additional air pollution promotional material for use by the apprentice.

London Borough of Haringey
April 2015 Updating and Screening Assessment
Nixy NOx PM Brothers – Phil & Mitchell Dixy CO2