logistic rice model for dry matter and nutrient uptake
TRANSCRIPT
Logistic rice model for dry matter and nutrient uptake 481
Scientia Agricola, v.60, n.3, p.481-488, Jul./Sept. 2003
LOGISTIC RICE MODEL FOR DRY MATTERAND NUTRIENT UPTAKE
Axel García y García; Durval Dourado-Neto*; Maria del Valle Basanta; Ramiro Fernando LópezOvejero; José Laércio Favarin
USP/ESALQ - Depto. de Produção Vegetal, C.P. 9 - 13418-900 - Piracicaba, SP - Brasil*Corresponding author <[email protected]>
ABSTRACT: The temporal variation of cumulative dry matter can be represented by a sigmoidal curve and thetemporal variation of nutrient uptake follows this characteristic shape. Therefore, modeling the temporal variationof cumulative dry matter allows estimating nutrient uptake along the crop cycle. The objective of this study wasto propose a sine model to estimate dry matter and macronutrient uptake, and to estimate the moments ofmaximum N and K uptake rates for the rice crop. The field experiment was carried out on a wetland area ofPiracicaba, SP, Brazil, consisting of an Humic Haplaquept. The chosen rice variety was IAC 103, a middleseason cycle and high yield. Observed variables were dry matter of different plant parts (root, leaf and stem, andpanicle) and macronutrient contents per unit dry matter. A sine model was proposed for the cumulative variationof these variables, based on biological events that occurred during the crop cycle. The temporal variation ofnutrient uptake was estimated and a lower accuracy was observed for K uptake. The maximum absorption ratefor N and K was found at 56% of the relative development of the crop, corresponding to 60 days after emergencein this experiment. The proposed model presented a satisfactory behavior to define the order of magnitude ofestimated dry matter and macronutrient uptake by the rice crop and maximum N and K uptake rates.Key words: modeling, sine function, macronutrients
MODELO LOGÍSTICO PARA FITOMASSA E EXTRAÇÃODE NUTRIENTES PARA A CULTURA DE ARROZ
RESUMO: A variação temporal do acúmulo de fitomassa seca pode ser representada por curva de tipo sigmoidale a variação temporal do acúmulo de nutrientes acompanha essa forma característica. Conseqüentemente, amodelagem da variação temporal do acúmulo de fitomassa seca permite estimar a extração de nutrientes aolongo do ciclo da cultura. O objetivo do trabalho foi propor um modelo senoidal para estimar a fitomassa secae extração de macronutrientes pela cultura de arroz, bem como determinar a época de máxima taxa de extraçãode N e K. O experimento foi conduzido em Piracicaba, SP num Gleissolo Eutrófico, horizonte A chernozênico,textura média a argilosa. Foi utilizada a variedade IAC 103, caracterizada por ser de ciclo médio e de altorendimento. As variáveis observadas foram a fitomassa seca em diferentes compartimentos da planta (raiz,folha e colmo e panícula) e os teores de macronutrientes por unidade de fitomassa seca. Propõe-se um modelosenoidal, cuja base matemática é fundamentada em eventos biológicos que acontecem ao longo do ciclo dacultura. Estimou-se a variação temporal da extração de nutrientes pela cultura, observando-se menor aderênciana estimativa da extração de K. A máxima taxa de absorção de N e K foi observada a 56% do desenvolvimentorelativo, equivalente a 60 DAE no estudo. O modelo proposto apresentou adequado desempenho para definirordem de grandeza dos valores de fitomassa seca e extração de macronutrientes pela cultura de arroz, bemcomo para estimar a máxima taxa de absorção de N e K.Palavras-chave: modelagem, modelo senoidal, macronutrientes
INTRODUCTION
An understanding of the processes involving cropgrowth and development, in addition to the adoption ofadequate decision-making tools, is essential for better re-sults to be obtained in the production process, and mod-eling is one tool utilized for the integration of the pro-cesses that take place along the crop cycle. Simulationmodels are utilized to verify theories and test hypotheses,improve the knowledge on a given process, feeding da-tabases with the acquired information and allowing grain
yield estimates to be obtained (Munakata, 1995; Booteet al., 1996).
Modeling procedures try to represent the interac-tion between environmental and plant factors, allowingfor a more detailed study and prediction of the processesof interest. The ideal situation is to formulate a model thatis sufficiently complex to describe the phenomenon, byutilizing original data, without making its practical usedifficult (Pereira & Machado, 1987). On the other hand,every model is a simplification of the system to be stud-ied and cannot contemplate all existing variables, which
García y García et al.482
Scientia Agricola, v.60, n.3, p.481-488, Jul./Sept. 2003
results in a less than exact prediction of reality (Penningde Vries, 1987).
During growth and development of rice plants,dry mass increases along the growth cycle, and nutrientuptake is subject to great variations (Murayama, 1995).The amount of dry phytomass varies as a function of va-riety, environmental factors and nutrient availability, butthe accumulation pattern is similar in nearly all rice ma-terials. In high yield varieties, almost half of the total dryphytomass comes from the grain, resulting in a harvestindex of 0.5 (Fernández et al., 1985).
Along the development of the crop, nutrient up-take varies as a function of the plant stage, and a sig-moidal-type curve best describes the absorptionprogress. During the early stages nutrient uptake is low,followed by a period in which the absorbed amount in-creases, and this behavior is described by a curve thatis similar in shape to a straight line. As the cycle drawsto an end, when the plant is mature, nutrient absorptionbecomes very low or null once again (Malavolta, 1980).
Crop cycles can be characterized by the thermalunit approach, which presumes the plant needs to accu-mulative a given amount of calories sum to develop. Inthis context, three temperature thresholds can be identi-fied as relevant: a lower threshold (baseline) temperature(TBI), an optimal temperature (TO), and an upper thresh-old temperature (TBS) (Kropff et al., 1995), which, in thecase of rice, correspond to 8oC, 30oC and 42oC, respec-tively (Gao et al., 1992).
The relative development of the crop (Dr) at agiven time is the ratio between the actual caloric sum(GDp,
oC.day) and the caloric sum that corresponds to thephysiological maturity stage (GDpmf,
oC.day). On a dailyscale it can be estimated the equation:
( )
pmf
p
pmf
n
pBIp
p GD
GD
GD
TTDr =
−=
∑=1 (1)
where Tp is the mean air temperature (oC) on the p-th dayafter emergence. The caloric sum at the physiologicalmaturity stage is defined by the equation:
( ) pmfBI
pmft
0tpmf tTdttTGD .. −= ∫
=
= (2)
where T(t) refers to the temporal variation of temperatureon a daily scale, between emergence (t=0) and the physi-ological maturity stage (t=tpmf), and tpmf corresponds to thetime necessary, in days after emergence, to attain thephysiological maturity stage. The previous expression canbe approximated by the Gilmore & Rogers method(1958), according to equation (3):
( )∑=
−=n
pBIpp TTGD
1 for [ ]≤≤ BSpBI TTT (3)
If Tminp<TBI, then Tp=TBI and if Tmaxp>TBS, thenTmaxp=TBS.
During vegetative growth, nutrients N, P, K andS are intensely absorbed. In terms of characterization, thenutrient uptake curve varies obeying the developmentconditions of the plant and presents a certain shape foreach type of nutrient. Macronutrients in the rice plant canbe classified into three groups: (1): N, P and S; (2): Kand Ca; and (3): Mg. Nutrients in group 1 are rapidly ab-sorbed by plants along the cycle, with the bulk of accu-mulation occurring until the onset of booting, and aredrained from the stem to the panicle at the ripening stage.Nutrients in group 2 are absorbed along the crop cycle,with the bulk of accumulation occurring until the ripen-ing stage. Draining to the panicles is minimal. Accumu-lation of Mg occurs especially during the period betweenpanicle initiation and booting (Murayama, 1995). Theamount of nutrients extracted from the soil by the cropis quite variable (Perdomo et al., 1985 and Bastos, 1999).In soils that present high organic matter contents, theplant utilizes nutrients quantitatively in the sequenceN>K>P, while in average fertility soils the sequence isK>N>P.
The objective of this study was to propose a sinemodel to estimate dry phytomass accumulation and ma-cronutrient uptake, and to determine the moments whenthe uptake rate of nitrogen and potassium by the rice cropare maximum.
MATERIAL AND METHODS
The experiment was carried out in Piracicaba-SP Brazil, 22º 12’S, 47º 38’W, 550 m altitude, in anHumic Haplaquept, with a chernozemic A horizon, in-termediate to clayey texture and textural class definedas silty clay loam.The chosen rice variety was IAC 103,characterized by middle cycle, high yield, with long,thin grain, and moderate susceptibility to rice blastdisease. Sowing was performed mechanically on Sep-tember 28, 1999, with a row spacing of 0.34 m and 10seeds per meter. Fertilization at sowing was performedbased on soil analysis. The crop was irrigated by flood-ing and water management consisted of maitaining amean water depth of 0.10 m until physiological matu-rity. The experiment was conducted as a randomizedblock design with ten treatments (sampling seasons)(n=3).
Ten samplings were performed along the cropcycle by removing two plants per plot, from a total ofthree plots, to determine dry phytomass and macronutri-ent content per plant compartment (root, leaf and stem,panicle). The dry phytomass of the aerial part in the i-thsampling season (DPPAi) corresponds to the sum of dryphytomass of leaf and stem (DPFCi) and panicle (DPPi),while the total dry phytomass in the i-th sampling sea-
Logistic rice model for dry matter and nutrient uptake 483
Scientia Agricola, v.60, n.3, p.481-488, Jul./Sept. 2003
son (TDPi) corresponds to the sum of dry phytomass inthe aerial part plus root (DPRi).
The extraction (Eij; kg ha-1) of the j-th macronu-trient, up to the i-th sampling season was calculated ac-cording to equation (4).
1000
MFSTE jii
ji
.= (4)
where Mji refers to the content of the j-th nutrient (g kg-1)at the i-th sampling season. The relative total dryphytomass at the i-th sampling season (TDPri) is the ra-tio between TDPi and the maximum total dry phytomass(TDPmax) observed along the crop cycle (5).
maxFSTFST
FSTr ii = (5)
The mean Mji content corresponds to the productof the mean nutrient content in the nc compartments,weighted by the corresponding dry phytomass (6).
∑
∑
=
== nc
kki
nc
kkijki
ji
FS
FSMM
1
1
.
(6)
A linear model was then adjusted to pairs of dataMji and Dri, to estimate the mean content of the j-th nu-trient jiM̂ , g kg-1), in the i-th sampling season, as shownin equation (7).
ijjji DrbaM .ˆ += (7)
where aj and bj refer to the empirical parameters of the j-th macronutrient.
The proposed sine model was adjusted to pairsof data TDPri (5) and Dri (1), and the estimated relativetotal dry phytomass in the i-th sampling season ( )was obtained, as described by equation (8).
(8)
By rearranging equations (7) and (8) it is possibleto estimate the extraction of the j-th nutrient in the i-thsampling season, according to equation (9).
(9)
The relative total dry phytomass accumulationrate was estimated by deriving the original function as a
function of relative development and obtaining equation(10).
(10)
By obtaining the second derivative, equation (11),and making it equal to zero, it was possible to determinethe point of maximum total dry phytomass accumulationrate.
(11)
The crop cycle was characterized in terms of rela-tive development (Dr), equation (1), and caloric sum(°C.d), equation (3).
The empirical parameter b was determined bynon-linear regression analysis, using the least squaresmethod (minimization of the sum of squares of deviationsbetween observed and estimated values) and Newton-Raphson’s iterative procedure.
Proposed modelTo develop the proposed model, the first step was
to devise a structure based on theoretical considerationsinherent to the growth, development and nutrient uptakerate in the rice crop. At the moment of plant emergence(Dr=0), the phytomass is negligible and, consequently, theaccumulation rate is null. (Table 1, case 1).
In the other extreme, the maximum value attainedby the total dry phytomass occurs at the physiologicalmaturity stage (Table 1, case 2), the total dry phytomassaccumulation beling maximum (Table 1, case 3) and, con-sequently, the accumulation rate null (Table 1, case 4).
Along the crop cycle occurs a single point ofmaximum, total dry phytomass accumulation rate (Table1, case 5), as well as a period of positive and increas-ing (Table 1, case 6) and positive and decreasing rates(Table 1, case 7). The temporal variation of dryphytomass and the accumulation of macronutrients havea sigmoidal shape, which is a fact demonstrated in sev-eral studies (Malavolta, 1980; Fageria, 1984; Penningde Vries, 1987; Kropff et al., 1995; Yin, 1996; DouradoNeto, 1999).
Since the crop cycle can be characterized in termsof GD or Dr, the temporal variations of dry phytomass(DP) and nutrient (M) accumulations in the plant can beexpressed according to equations (12) and (13), respec-tively.
T = T(t) => GD = GD(T) ou Dr = Dr(T)∴FS = FS(Dr) (12)
T = T(t) => GD = GD(T) ou Dr = Dr(T)∴M = M(Dr) (13)
García y García et al.484
Scientia Agricola, v.60, n.3, p.481-488, Jul./Sept. 2003
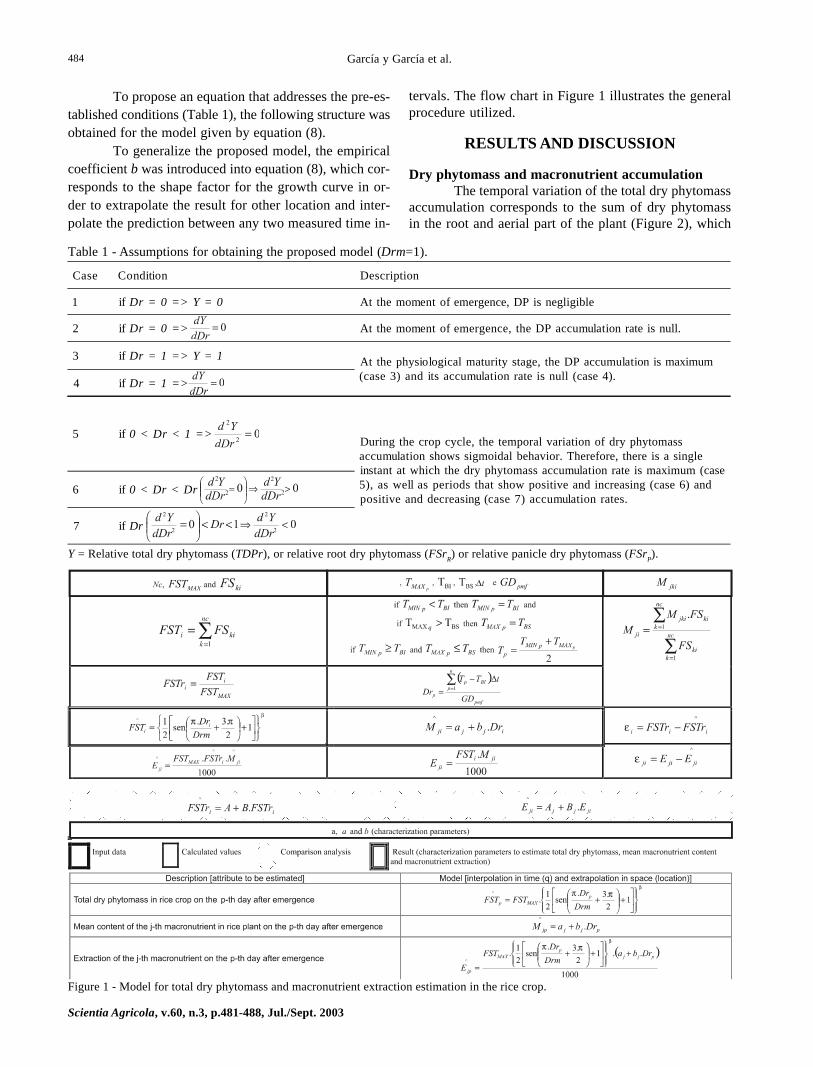
To propose an equation that addresses the pre-es-tablished conditions (Table 1), the following structure wasobtained for the model given by equation (8).
To generalize the proposed model, the empiricalcoefficient b was introduced into equation (8), which cor-responds to the shape factor for the growth curve in or-der to extrapolate the result for other location and inter-polate the prediction between any two measured time in-
tervals. The flow chart in Figure 1 illustrates the generalprocedure utilized.
RESULTS AND DISCUSSION
Dry phytomass and macronutrient accumulationThe temporal variation of the total dry phytomass
accumulation corresponds to the sum of dry phytomassin the root and aerial part of the plant (Figure 2), which
Case Condition Description
1 if Dr = 0 => Y = 0 At the moment of emergence, DP is negligible
2 if Dr = 0 => At the moment of emergence, the DP accumulation rate is null.
3 if Dr = 1 => Y = 1 At the physiological maturity stage, the DP accumulation is maximum(case 3) and its accumulation rate is null (case 4).4 if Dr = 1 =>
5 if 0 < Dr < 1 =>During the crop cycle, the temporal variation of dry phytomassaccumulation shows sigmoidal behavior. Therefore, there is a singleinstant at which the dry phytomass accumulation rate is maximum (case5), as well as periods that show positive and increasing (case 6) andpositive and decreasing (case 7) accumulation rates.
6 if 0 < Dr < Dr
7 if Dr
Table 1 - Assumptions for obtaining the proposed model (Drm=1).
Y = Relative total dry phytomass (TDPr), or relative root dry phytomass (FSrR) or relative panicle dry phytomass (FSrP).
Figure 1 - Model for total dry phytomass and macronutrient extraction estimation in the rice crop.

Logistic rice model for dry matter and nutrient uptake 485
Scientia Agricola, v.60, n.3, p.481-488, Jul./Sept. 2003
in turn corresponds to the sum of leaf and stem, andpanicle dry phytomass (Figure 3).
Differences were detected between phytomasssampling seasons and means were compared (all againstall) between sampling seasons (Table 2) to determineequal dry phytomass accumulation moments (α=0.05).The beginning stages of the crop (Seedling, Four-leafstage and Onset of tillering) were equal in terms of dryphytomass accumulation, and differentiation started tooccur at full tillering.
Growth was slow until 40 to 50 days after emer-gence onset of tillering (Table 2). At internode elongation(55 DAE), dry phytomass accumulation was intensified,and the beginning of the sigmoidal trend can be observedat the stage that corresponds to panicle exsertion. Theseresults are similar to those obtained by Fageria (1984).
Sampling season TDP i/jPr > |T| Ho: Mean(i)=Mean(j)
1 2 3 4 5 6 7 8 9
Seedling 0.19 1
Four-leaf stage 0.47 2 0.6993
Onset of tillering 0.74 3 0.4781 0.7157
Full tillering 5.98 4 0.0120 0.0133 0.0146Internodeelongatio 10.39 5 0.0039 0.0042 0.0044 0.0205
Panicle initiation 15.89 6 0.0017 0.0017 0.0018 0.0042 0.0133
Onset of booting 23.02 7 0.0008 0.0008 0.0008 0.0014 0.0026 0.0080
Panicle exsertion 30.45 8 0.0004 0.0005 0.0005 0.0007 0.0010 0.0019 0.0074
Dough grain 37.26 9 0.0003 0.0003 0.0003 0.0004 0.0006 0.0009 0.0020 0.0088Physiologicalmaturity stage 41.19 10 0.0002 0.0002 0.0003 0.0003 0.0004 0.0006 0.0012 0.0036 0.0257
Table 2 - Mean total dry phytomass values (TDP; g plant-1) and means comparison test per sampling season.
The observed temporal variation in total dryphytomass accumulation occurred as expected: slow ini-tial growth, with a period of rapid growth until a maxi-mum was reached at the physiological maturitystage, with an observed tendency to become stabilized.Until the fourth sampling season the dry phytomassaccumulation is low, becoming more intense frommaximum tillering onward (Table 3). This fact canbe identified at the α = 0.05 significance level in the com-parison of means (Table 2). Similar results were reportedby Fageria (1984), in experiments conducted under irriga-tion and different levels of applied phosphorus.
The macronutrient most extracted by the crop wasnitrogen, followed by potassium and sulfur. The order of ab-sorption of primary macronutrients was N>K>P, while for sec-ondary macronutrients the order was S>Mg>Ca (Table 3).
Figure 2 - Temporal variation (DAE = days after emergence) of dry phytomass accumulation in the plant and its components.
0
2600
5200
7800
10400
13000
0 30 60 90 120
DAE
kg h
a-1
Plant
0
3000
6000
9000
12000
0 30 60 90 120
DAE
kg h
a-1
Shoot
0
500
1000
1500
2000
0 30 60 90 120
DAE
kg h
a-1
Root
Figure 3 - Temporal variation (DAE = days after emergence) of dry phytomass accumulation in the aerial part of the plant and its components.
0
3000
6000
9000
12000
0 30 60 90 120
DAE
kg h
a-1
Shoot
0
2000
4000
6000
8000
0 30 60 90 120
DAE
kg h
a-1
Leaf and stern
0
1250
2500
3750
5000
0 30 60 90 120
DAE
kg h
a-1
Panicle
+ =
+ =

García y García et al.486
Scientia Agricola, v.60, n.3, p.481-488, Jul./Sept. 2003
y = 1.0315xR2 = 0.9895
0.0
0.2
0.4
0.6
0.8
1.0
0.0 0.2 0.4 0.6 0.8 1.0
FSTr calculated
FST
r es
tim
ated
0.0
0.2
0.4
0.6
0.8
1.0
0.0 0.2 0.4 0.6 0.8 1.0
Dr
FST
r
Calculated Estimated
Figure 4 - Temporal variation (a) and comparison (b) between calculated and estimated values for relative total dry phytomass (TDFr).
The general order of absorption was:N>K>S>P>Mg>Ca. Fageria (1999) reported that in irri-gated rice the macronutrient accumulation order isK>N>P>Mg>Ca, while the order observed in the presentwork is cited by the same author as a trait of dryland riceunder conditions observed in cerrado soils.
Modeling and estimation of temporal variation in dryphytomass accumulation and macronutrient uptake
Models were obtained for: (i) estimate of totaldry phytomass in the crop on the p-th day after emer-gence; (ii) estimate of the mean content of the j-th ma-cronutrient on the p-th day after emergence; and (iii) ex-traction of the j-th macronutrient on the p-th day afteremergence. Figure 1 shows a summary of the procedureutilized to obtain these models.
After adjusting the sine model to the observeddata, a value was obtained for the empirical coefficientβ = 1.877, which can be interpreted as the numericalvalue that incorporates the inter-relations not controledand not considered in the process. In other words, stud-ies under diverse scenarios and climatic conditions areneeded to produce a generalized value for β. The pro-posed model was satisfactorily adjusted to the calculateddata (Figure 4a), demonstrating that the model estimatefits the experimental data (Figure 4b).
The result for the estimate of extraction of the j-th macronutrient on the p-th day after emergence can beobserved in Figure 5. With the exception of K (Figure6), the model adequately estimated the temporal variationof nutrient uptake.
Table 3 - Calculated values of total dry phytomass andmacronutrient uptake.
TDPMacronutrient extraction
N P K Ca Mg S
--------------------- kg ha-1---------------------
56 1 0 1 0 0 0
140 3 0 4 0 1 1
219 6 1 5 1 1 1
1429 32 3 38 5 3 7
3058 55 4 41 9 5 10
4674 59 9 79 9 9 23
6771 144 11 69 10 9 57
9150 136 20 147 19 17 59
10961 114 23 128 18 20 41
12116 1 25 22 95 18 22 48
a) b)
Figure 5 - Temporal variation of macronutrient uptake by the rice crop.
N P K
050
100150200
0 30 60 90 120
DAE
kg h
a-1
Calculated Estimated
0
10
20
30
0 30 60 90 120
DAE
kg h
a-1
Calculated Estimated
050
100150200
0 30 60 90 120
DAE
kg h
a-1
Calculated Estimated
Ca Mg S
05
101520
0 30 60 90 120
DAE
kg h
a-1
Calculated Estimated
0
10
20
30
0 30 60 90 120
DAE
kg h
a-1
Calculated Estimated
020406080
0 30 60 90 120
DAE
kg h
a-1
Calculated Estimated

Logistic rice model for dry matter and nutrient uptake 487
Scientia Agricola, v.60, n.3, p.481-488, Jul./Sept. 2003
As described in equation (11), a macronutrientabsorption rate was obtained in kg ha-1 d-1. The plants at-tained the maximum absorption rate for all macronutri-ents in the period that corresponds to the reproductivestage. N and K were more extracted by the end of theinternode elongation stage, Ca and Mg at panicle initia-tion, and P and S at the booting stage. Nutrients P, Ca,Mg and S were slowly absorbed initially, on the contraryto what was observed for N and K (Figure 7).
When the observed results are compared to thosepresented by Murayama (1995), the stages of maximumabsorption are different in terms of groups of macronu-trients, with the exception of Mg. According to that au-thor, N, P and S belong to the group of maximum extrac-tion at the booting stage, K and Ca to the beginning ofthe ripening stage and Mg to panicle initiation. In spiteof that, Murayama (1995) reports that the observed pat-terns do not necessarily characterize the macronutrientabsorption rate by the rice plant.
To establish the best season for N and K appli-cation as sidedressing, a maximum uptake rate for thesenutrients was obtained when the uptake acceleration wasnull. To that effect, the second derivative of the originalfunction [equation (11)] of the proposed model wasequaled to zero (d2Te/dDAE2=0) (Figure 8).
With respect to sidedressing, in both cases the fer-tilizer should be applied until 60 DAE, when panicle ini-tiation occurs.
CONCLUSIONS
The model proposed to estimate total dryphytomass and macronutrient uptake (N, P, K, Ca, Mg andS) for the rice crop had adequate performance and canbe utilized to define the order of magnitude of the vari-ables under consideration; The estimate for maximum
Figure 6 - Comparison analysis between calculated and estimated values of macronutrient uptake (kg ha-1) by the rice crop.
y = 1.0092xR2 = 0.9287
0
30
60
90
120
150
0 30 60 90 120 150
Calculated E (kg ha-1)
Est
imat
ed E
(kg
ha-1
)y = 0.9827xR2 = 0.9748
0
5
10
15
20
25
0 5 10 15 20 25
Calculated E (kg ha-1)
Est
imat
ed E
(kg
ha-1
)
y = 0.9818xR2 = 0.8872
0
50
100
150
0 50 100 150
Calculated E (kg ha-1)
Est
imad
ed E
(kg
ha-1
)
N P K
Figure 8 - Temporal variation of uptake rate (Ur, kg ha-1 d-1) anduptake acceleration (Ua, kg ha-1 d-2) of nitrogen andpotassium in the rice crop.
N
K
0.0
0.5
1.0
1.5
2.0
2.5
3.0
0 10 20 30 40 50 60 70 80 90 100 110 120
DAE
N,K
,S(k
g ha
-1 d
-1)
0.00
0.05
0.10
0.15
0.20
0.25
0.30
0.35
0.40
0.45
P,C
a,M
g(k
g ha
-1 d
-1)
N K S P Ca Mg
Figure 7 - Comparison of macronutrient uptake rates (Ur, kg ha-1 d-1).
y = 0.9998xR2 = 0.8913
0
5
10
15
20
0 5 10 15 20
Calculated E (kg ha-1)
Est
imat
ed E
(kg
ha-1
)
y = 0.9222xR2 = 0.8925
0
5
10
15
20
25
0 5 10 15 20 25
Calculated E (kg ha-1)
Est
imat
ed E
(kg
ha-1
)
Ca Mg S
y = 0.9804xR2 = 0.8554
010203040506070
0 10 20 30 40 50 60 70
Calculated E (kg ha-1)
Est
imat
ed E
(kg
ha-1
)

García y García et al.488
Scientia Agricola, v.60, n.3, p.481-488, Jul./Sept. 2003
Received March 5, 2002Accepted April 30, 2003
absorption rate of nitrogen and potassium established thatthe application of these macronutrients should be carriedout until 56% of the relative development (equivalent to60 DAE in this study) of the crop, at panicle initiation.
REFERENCES
BASTOS, A.R.R. Nutrição mineral e produção de cultivares de arroz (Oryzasativa L.) em solos de várzea inundados. Lavras: ESAL, 1999. 89p.(Dissertação - Mestrado)
BOOTE, K.J.; JONES, J.W.; PICKERING, N.B. Potential uses andlimitations of crop models. Agronomy Journal, v.88, p.704-716, 1996.
DOURADO-NETO, D. Modelos fitotécnicos referentes à cultura de milho.Piracicaba: USP/ESALQ, 1999. 227p. (Tese - Livre Docência)
FAGERIA, N.K. Adubação e nutrição mineral da cultura do arroz. Riode Janeiro: Campus; Goiânia: EMBRAPA, CNPAF, 1984. 341p.
FAGERIA, N.K. Nutrição mineral. In: VIEIRA, N.R.A.; SANTOS, A.B.dos; SANT’ANA, E.P. (Ed.) A cultura do arroz no Brasil. SantoAntônio de Goiás: Embrapa Arroz e Feijão, 1999. cap.7, p.173-195.
FERNÁNDEZ, F.; VERGARA, B.S.; YAPIT, N.; GARCIA, O. Crecimientoy etapas de desarrollo de la planta de arroz. In: TASCÓN, J.E.; GARCIA,D.E. (Ed). Arroz: investigación y producción. Cali: CIAT, 1985. p.83-101.
GAO, L.Z.; JIN, Z.Q.; HUANG, Y.; ZHANG, L.Z. Rice clock model - acomputer model to simulate rice development. Agricultural and ForestMeteorology, v.60, p.1-16, 1992.
GILMORE , E.; ROGERS, J. S. Heat units as a method of measuring maturityin corn. Agronomy Journal, n.50, p.611-615. 1958.
KROPFF, M.J.; MATTEWS, R.B.; van LAAR, H.H.; ten BERGE, H.F.M.The rice model Oryza1 and its testing. In: MATTHEWS, R.B.; KRPFF,M.J.; BACHELET, D.; van LAAR, H.H. (Ed.) Modeling the impact ofclimate change on rice production in Asia. Manila: International RiceResearch Institute, 1995. p.27-50.
MALAVOLTA, E. Elementos da nutrição mineral de plantas. São Paulo:Ceres, 1980. 251p.
MUNAKATA, K. Simulation of population photosynthesis and dry matterproduction. In: MATSUO, T.; KUMAZAWA, K.; ISHII, R.; ISHIHARA,K.; HIRATA, H. (Ed.) Science of the rice plant. Tokyo: Physiology,Food and Agricultural Policy Research Center, 1995. v.2, p.671-684.
MURAYAMA, N. Development and senescence. In: MATSUO, T.;KUMAZAWA, K.; ISHII, R.; ISHIHARA, K.; HIRATA, H. (Ed.) Scienceof the rice plant. Tokyo: Physiology, Food and Agricultural PolicyResearch Center, 1995. v.2, p.119-132.
PENNING de VRIES, F.W.T. Some opportunities for using crop models inrice. In: INTERNATIONAL WORKSHOP ON THE IMPACT OFWEATHER PARAMETERS ON GROWTH AND YIELD OF RICE,Los Banõs, Philippines, 1987. Proceedings. Los Baños: InternationalRice Research Institute, 1987. p.291-300.
PERDOMO, M.A.; GONZALEZ, J.; GALVIS, C. de; GARCIA, E.;ARREGOCÉS, O. Los macronutrientes en la nutrición de la planta dearroz. In: TASCON, J.E.; GARCIA, D.E. (Ed.) Arroz: investigación yproducción. Cali: CIAT, 1985. p.103-132.
PEREIRA, A.R.; MACHADO, E.C. Análise quantitativa do crescimentode comunidade vegetal. Campinas: Instituto Agronômico, 1987. 33p.(Boletim Técnico, 114).
YIN, X. Quantifying the effects of temperature and photoperiod onphenological development to flowering in rice. Wageningen: WageningenAgricultural University 1996. 173p. (Thesis - Ph.D.)