location of failure plane and design … et al.: location of failure plane and design considerations...
TRANSCRIPT
Yang et al.: Location of Failure Plane and Design Considerations for Narrow GRS Wall Systems 27
Manuscript received January 20, 2011; revised March 9, 2011; ac-cepted March 18, 2010.
1 Assistant Professor (corresponding author), Department of Con-struction Engineering, National Taiwan University of Science andTechnology, Taipei, Taiwan (e-mail: [email protected]).
2 Associate Professor, Department of Civil, Architectural and Envi-ronmental Engineering, University of Texas at Austin, TX, U.S.A.(e-mail: [email protected]).
3 Associate Technologist, National Center for Research on Earth-quake Engineering, Taipei, Taiwan (e-mail: [email protected]).
4 International Director, TenCate Geosyntehtics Asia Sdn Bhd, ShahAlam, Malaysia (e-mail: [email protected]).
LOCATION OF FAILURE PLANE AND DESIGN CONSIDERATIONS
FOR NARROW GEOSYNTHETIC REINFORCED SOIL WALL
SYSTEMS
Kuo-Hsin Yang 1, Jorge G. Zornberg 2, Wen-Yi Hung 3, and Chris R. Lawson 4
ABSTRACT
The design of a Geosynthetic Reinforced Soil (GRS) wall for internal stability against pullout failure requires computing the reinforcement embedment length. Therefore, the location of failure plane is an important input for this design. The current FHWA MSE wall design guidelines assume the location of failure plane based on Rankine theory. While this assumption holds true for conventional walls it is unconservative for GRS walls under constrained spaces, also known as “narrow GRS walls”. This paper presents a limit equilibrium study to accurately locate failure planes within narrow GRS walls. The critical failure planes within narrow GRS walls are searched using Spencer’s method with a function of noncircular failure plane. The predicted results from limit equilibrium analyses are verified by the experimental data from centrifuge tests conducted on narrow GRS walls. The results indicate that the critical failure plane is bilinear: The failure surface being formed partially through the reinforced soil and par-tially along the interface between the GRS and the stable wall face. The results show the inclination angles of the failure planes for narrow GRS walls being 10~ 20 less than those calculated by Rankine theory. The effect of wall aspect ratio on the in-clination angle of the critical failure plane is investigated for the cases studied in this paper. Design considerations against pullout failure for narrow GRS walls are also discussed at end of this paper.
Key words: Geosynthetics, narrow GRS wall, earth pressure, location of failure plane.
1. INTRODUCTION The increase of traffic demands in urban areas has led to the
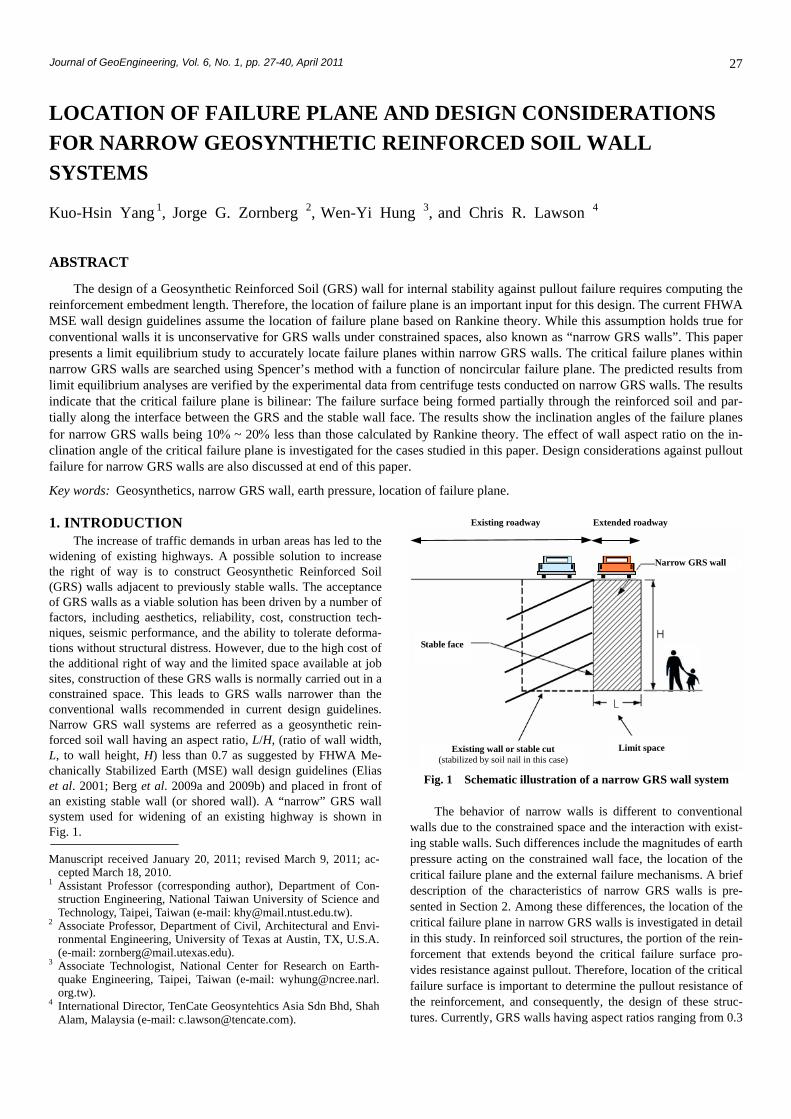
widening of existing highways. A possible solution to increase the right of way is to construct Geosynthetic Reinforced Soil (GRS) walls adjacent to previously stable walls. The acceptance of GRS walls as a viable solution has been driven by a number of factors, including aesthetics, reliability, cost, construction tech-niques, seismic performance, and the ability to tolerate deforma-tions without structural distress. However, due to the high cost of the additional right of way and the limited space available at job sites, construction of these GRS walls is normally carried out in a constrained space. This leads to GRS walls narrower than the conventional walls recommended in current design guidelines. Narrow GRS wall systems are referred as a geosynthetic rein-forced soil wall having an aspect ratio, L/H, (ratio of wall width, L, to wall height, H) less than 0.7 as suggested by FHWA Me-chanically Stabilized Earth (MSE) wall design guidelines (Elias et al. 2001; Berg et al. 2009a and 2009b) and placed in front of an existing stable wall (or shored wall). A “narrow” GRS wall system used for widening of an existing highway is shown in Fig. 1.
Fig. 1 Schematic illustration of a narrow GRS wall system
The behavior of narrow walls is different to conventional walls due to the constrained space and the interaction with exist-ing stable walls. Such differences include the magnitudes of earth pressure acting on the constrained wall face, the location of the critical failure plane and the external failure mechanisms. A brief description of the characteristics of narrow GRS walls is pre-sented in Section 2. Among these differences, the location of the critical failure plane in narrow GRS walls is investigated in detail in this study. In reinforced soil structures, the portion of the rein-forcement that extends beyond the critical failure surface pro-vides resistance against pullout. Therefore, location of the critical failure surface is important to determine the pullout resistance of the reinforcement, and consequently, the design of these struc-tures. Currently, GRS walls having aspect ratios ranging from 0.3
Journal of GeoEngineering, Vol. 6, No. 1, pp. 27-40, April 2011
Narrow GRS wall
Limit space Existing wall or stable cut (stabilized by soil nail in this case)
Stable face
Existing roadway Extended roadway
28 Journal of GeoEngineering, Vol. 6, No. 1, April 2011
to 0.7 are designed based on the FHWA design guideline for Shored Mechanically Stabilized Earth (SMSE) wall systems (Morrison et al. 2006). This guideline deals with the uncertainties of narrow wall design by increasing the factor of safety, FS, rather than considering the actual characteristics of narrow walls. The FHWA SMSE wall design guideline recommends the use of the theoretical Rankine linear failure plane (i.e., 45 /2, where is the friction angle of the reinforced fill) for narrow walls but increases the FS against pullout from 1.5 to 2.0 for L/H 0.4 to account for the uncertainty of estimating the location of the criti-cal failure plane.
The purpose of this paper is to provide a better understand-ing of the location of the critical failure plane in narrow GRS walls using limit equilibrium (LE) analysis. The primary reason for selecting the limit equilibrium method was due to its ability to accurately predict failure mechanisms, specifically for identify-ing the location of the critical failure surface, for many geotech-nical problems. The limit equilibrium method has been used to analyze slope stability problems and search for the location of the critical failure surface by assuming the soil at failure obeys the perfectly plastic Mohr-Coulomb criterion. Analytical methods have been proposed using various methods of vertical slices, e.g. Bishop (1955), Janbu (1954), Morgenstern and Price (1965) and Spencer (1967). An excellent review of popular limit equilibrium techniques for predicting slope stability can be found in Duncan and Wright (2005). Limit equilibrium analyses for the design of reinforced soil structures have also been reported, e.g. Zornberg et al. (1998a and 1998b). In contrast to the LE methods, contin-uum mechanics methods (e.g. finite element method) generally cannot provide good predictions for structures at failure or at large deformations. Furthermore, the continuum mechanics methods commonly show a plastic-points zone to represent areas of potential failure (a pre-failure condition) rather than a clearly defined failure surface.
A series of limit equilibrium analyses were carried out on narrow GRS walls to search for the location of the critical failure plane given different aspect ratios. The emphasis on limit equi-librium analyses is concentrated on the methods for modeling reinforcement forces and searching for nonlinear failure planes. The results of limit equilibrium analyses are then compared with the experimental data from centrifuge tests by Woodruff (2003). The variation in inclination angle of the critical failure plane with wall aspect ratio is investigated for the cases studied in this paper. Design considerations governing pullout failure for narrow GRS walls are discussed at end of this paper.
2. CHARACTERISTICS OF NARROW GRS WALL SYSTEMS
The behavior of narrow reinforced soil walls is different to those of conventional reinforced soil walls due to the constrained space and interaction with adjacent stable walls. Differences in-clude the magnitudes of earth pressure acting on the face of the GRS wall, the location of critical failure planes and the external failure mechanisms. The dominant failure modes and corre-sponding design methods according to various aspect ratios are summarized in Table 1. A brief discussion of these features is given below.
For the earth pressures acting in narrow walls, several re-searchers (Frydman and Keissar 1987; Take and Valsangkar
Table 1 Summary of wall failure modes and corresponding design guidelines
Wall aspectratio
L/H 0.25
0.25 L/H 0.3
0.3 L/H 0.6
0.6 L/H0.7
L/H 0.7
Failure mode External Compound1 Internal
Design method
Cement stabilized wall2
FHWA SMSE WallDesign Guidelines
(Morrison et al. 2006)
FHWA MSE Wall
Design Guidelines (Elias et al.
2001)
1. The compound failure has a failure surface formed partially through the reinforced soil and partially along the interface between the MSE and stabilized wall faces.
2. Cement stabilized wall is suggested by the reinforced earth company. 2001; Leshchinsky et al. 2004; Lawson and Yee 2005; Kniss et al. 2007; Yang and Liu 2007) concluded that the earth pressure for narrow walls is less than that calculated using the conven-tional (Rankine) earth pressure condition. The reduction in earth pressure observed in previous studies is due mainly to the com-bination of two mechanisms: Arching effect and boundary con-straint (e.g., Handy 1985; Filz and Duncan 1997a and 1997b). Readers are referred to Yang and Liu (2007) for a detailed dis-cussion.
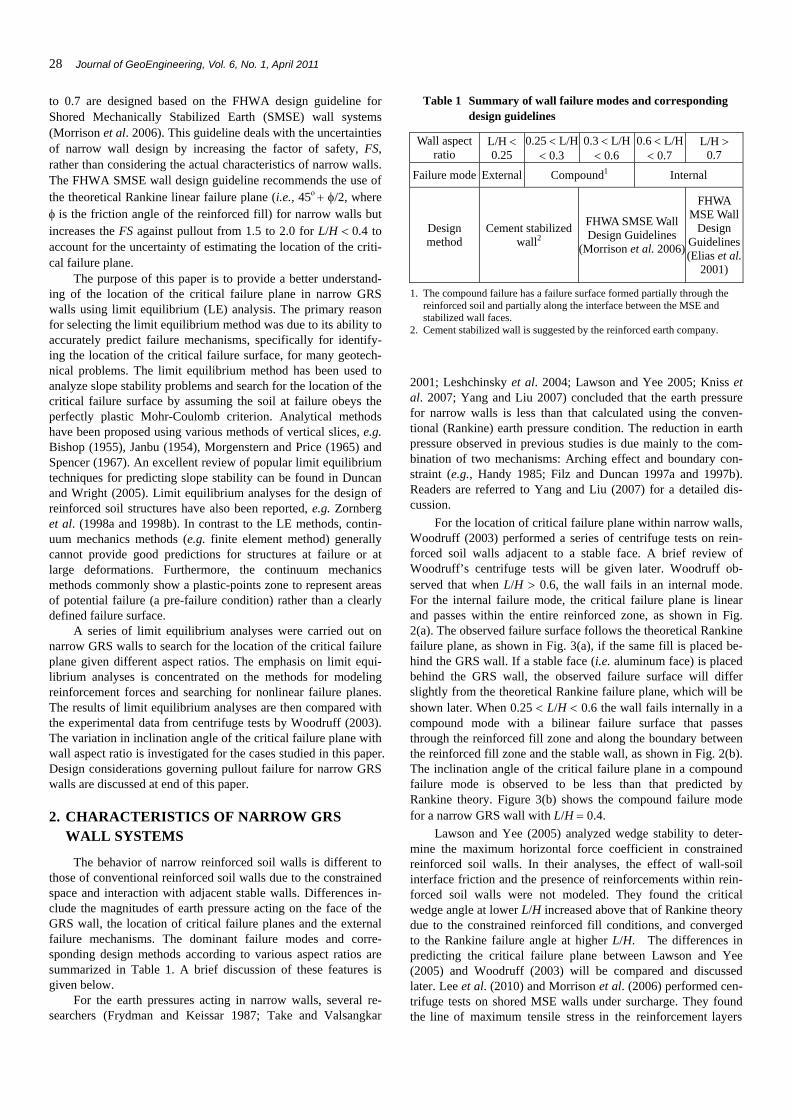
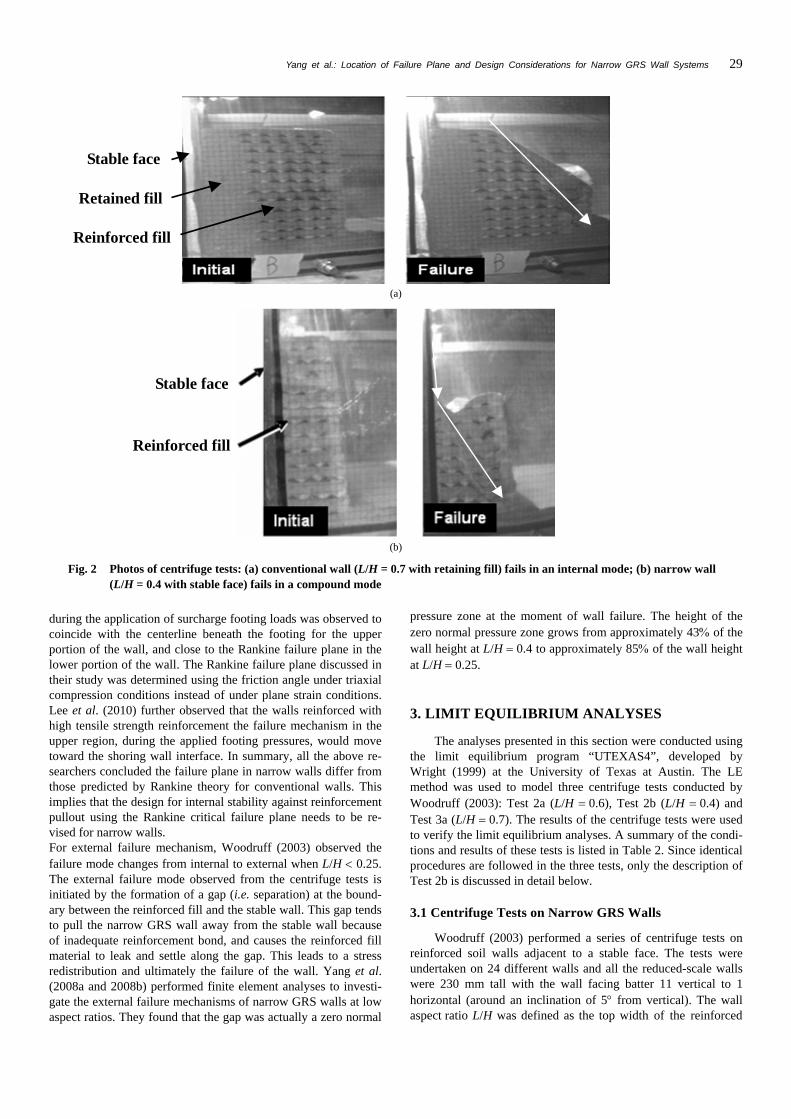
For the location of critical failure plane within narrow walls, Woodruff (2003) performed a series of centrifuge tests on rein-forced soil walls adjacent to a stable face. A brief review of Woodruff’s centrifuge tests will be given later. Woodruff ob-served that when L/H 0.6, the wall fails in an internal mode. For the internal failure mode, the critical failure plane is linear and passes within the entire reinforced zone, as shown in Fig. 2(a). The observed failure surface follows the theoretical Rankine failure plane, as shown in Fig. 3(a), if the same fill is placed be-hind the GRS wall. If a stable face (i.e. aluminum face) is placed behind the GRS wall, the observed failure surface will differ slightly from the theoretical Rankine failure plane, which will be shown later. When 0.25 L/H 0.6 the wall fails internally in a compound mode with a bilinear failure surface that passes through the reinforced fill zone and along the boundary between the reinforced fill zone and the stable wall, as shown in Fig. 2(b). The inclination angle of the critical failure plane in a compound failure mode is observed to be less than that predicted by Rankine theory. Figure 3(b) shows the compound failure mode for a narrow GRS wall with L/H 0.4.
Lawson and Yee (2005) analyzed wedge stability to deter-mine the maximum horizontal force coefficient in constrained reinforced soil walls. In their analyses, the effect of wall-soil interface friction and the presence of reinforcements within rein-forced soil walls were not modeled. They found the critical wedge angle at lower L/H increased above that of Rankine theory due to the constrained reinforced fill conditions, and converged to the Rankine failure angle at higher L/H. The differences in predicting the critical failure plane between Lawson and Yee (2005) and Woodruff (2003) will be compared and discussed later. Lee et al. (2010) and Morrison et al. (2006) performed cen-trifuge tests on shored MSE walls under surcharge. They found the line of maximum tensile stress in the reinforcement layers
Yang et al.: Location of Failure Plane and Design Considerations for Narrow GRS Wall Systems 29
(a)
(b)
Fig. 2 Photos of centrifuge tests: (a) conventional wall (L/H = 0.7 with retaining fill) fails in an internal mode; (b) narrow wall (L/H = 0.4 with stable face) fails in a compound mode
during the application of surcharge footing loads was observed to coincide with the centerline beneath the footing for the upper portion of the wall, and close to the Rankine failure plane in the lower portion of the wall. The Rankine failure plane discussed in their study was determined using the friction angle under triaxial compression conditions instead of under plane strain conditions. Lee et al. (2010) further observed that the walls reinforced with high tensile strength reinforcement the failure mechanism in the upper region, during the applied footing pressures, would move toward the shoring wall interface. In summary, all the above re-searchers concluded the failure plane in narrow walls differ from those predicted by Rankine theory for conventional walls. This implies that the design for internal stability against reinforcement pullout using the Rankine critical failure plane needs to be re-vised for narrow walls. For external failure mechanism, Woodruff (2003) observed the failure mode changes from internal to external when L/H 0.25. The external failure mode observed from the centrifuge tests is initiated by the formation of a gap (i.e. separation) at the bound-ary between the reinforced fill and the stable wall. This gap tends to pull the narrow GRS wall away from the stable wall because of inadequate reinforcement bond, and causes the reinforced fill material to leak and settle along the gap. This leads to a stress redistribution and ultimately the failure of the wall. Yang et al. (2008a and 2008b) performed finite element analyses to investi-gate the external failure mechanisms of narrow GRS walls at low aspect ratios. They found that the gap was actually a zero normal
pressure zone at the moment of wall failure. The height of the zero normal pressure zone grows from approximately 43 of the wall height at L/H 0.4 to approximately 85 of the wall height at L/H 0.25.
3. LIMIT EQUILIBRIUM ANALYSES
The analyses presented in this section were conducted using the limit equilibrium program “UTEXAS4”, developed by Wright (1999) at the University of Texas at Austin. The LE method was used to model three centrifuge tests conducted by Woodruff (2003): Test 2a (L/H 0.6), Test 2b (L/H 0.4) and Test 3a (L/H 0.7). The results of the centrifuge tests were used to verify the limit equilibrium analyses. A summary of the condi-tions and results of these tests is listed in Table 2. Since identical procedures are followed in the three tests, only the description of Test 2b is discussed in detail below.
3.1 Centrifuge Tests on Narrow GRS Walls
Woodruff (2003) performed a series of centrifuge tests on reinforced soil walls adjacent to a stable face. The tests were undertaken on 24 different walls and all the reduced-scale walls were 230 mm tall with the wall facing batter 11 vertical to 1 horizontal (around an inclination of 5 from vertical). The wall aspect ratio L/H was defined as the top width of the reinforced
Reinforced fill
Retained fill
Stable face
Stable face
Reinforced fill
30 Journal of GeoEngineering, Vol. 6, No. 1, April 2011
(a)
(b)
Fig. 3 Location of failure surface: (a) conventional wall (L/H = 0.7 with retaining fill); (b) narrow wall (L/H = 0.4 with stable face) (Woodruff 2003)
Table 2 Summary of centrifuge test conditions for limit equilib-rium modeling
Test L/H Stable face
Reinforcement strength
Reinforcement spacing (mm)
Failure mode
Failure g-level
2a 0.6 Aluminum R2 20 Compound 39
2b 0.4 Aluminum R2 20 Compound 41
3a 0.7 Aluminum R2 20 Internal 38
zone Lt divided by the wall height H, and L/H ranged from 0.17 to 0.9 in the tests. The reinforcement was folded backward to form a wrap-around facing and a secondary layer (overlap) of 50 mm long in the centrifuge model. The model walls were placed in front of an aluminum box that simulates the stable rear face.
Monterey No. 30 sand was used as the reinforced fill mate-rial. The unit weight is 16 kN/m3 and the friction angle is 37interpolated from a series of triaxial compression tests (Li 2002; Zornberg 2002) at the targeted reinforced fill relative den-sity of 70. The estimated plane strain friction angle was re-ported as 42 using the correlations between triaxial friction an-gle and plane strain friction angle reported by Zornberg et al. (1998b). The model reinforcements used in the centrifuge study are nonwoven geotextiles named Pellon True-grid, which is composed of 60 polyester and 40 rayon fibers. The resulting fabric, tested according to wide width strip tensile tests (ASTM D4595), has a tensile strength of 0.09 kN/m in the machine direc-tion and 1.0 kN/m in the transverse direction (referred as R2 and R4, respectively).
In the centrifuge tests, all models were subjected to a gradu-ally increasing centrifugal acceleration until failure occurred and the g-level Ng was recorded. Failure was determined by a sudden increase in settlement, as measured by an LVDT at the top of the wall. The location of the critical failure surface was determined based on the observed tears (rupture) in each layer of the rein-forcement.
3.2 Limit Equilibrium Modeling
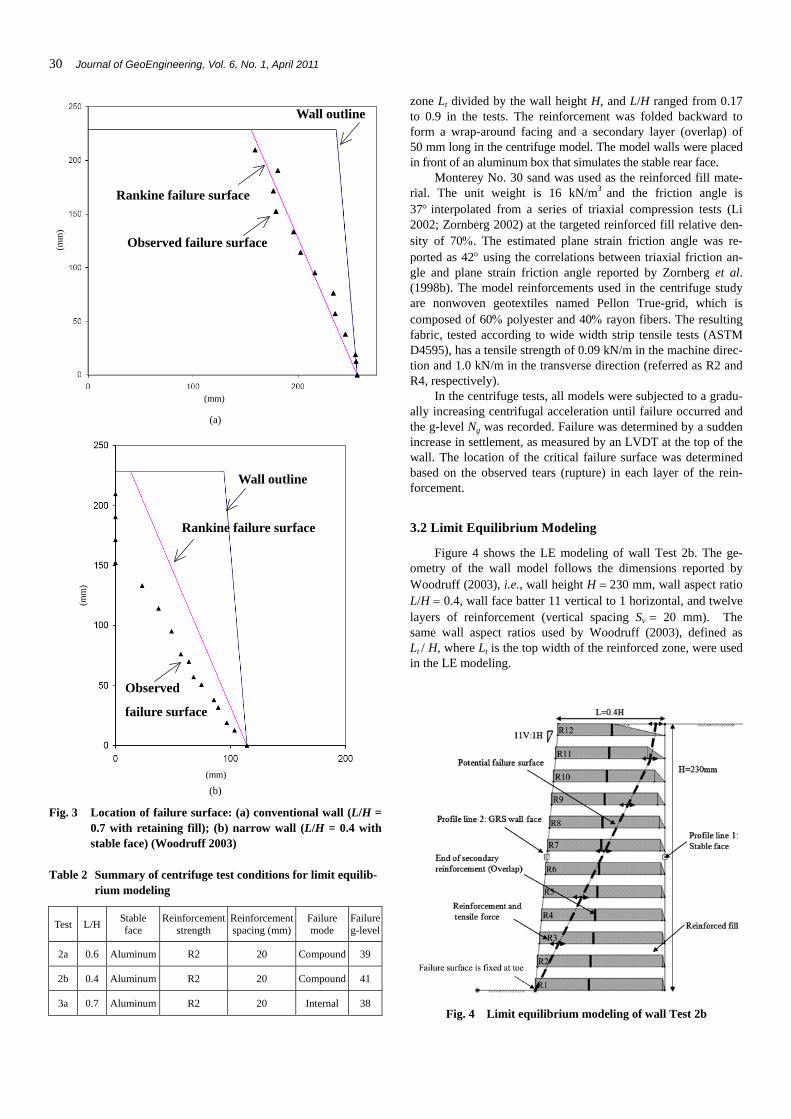
Figure 4 shows the LE modeling of wall Test 2b. The ge-ometry of the wall model follows the dimensions reported by Woodruff (2003), i.e., wall height H 230 mm, wall aspect ratio L/H 0.4, wall face batter 11 vertical to 1 horizontal, and twelve layers of reinforcement (vertical spacing Sv 20 mm). The same wall aspect ratios used by Woodruff (2003), defined as Lt / H, where Lt is the top width of the reinforced zone, were used in the LE modeling.
Fig. 4 Limit equilibrium modeling of wall Test 2b
Wall outline
Rankine failure surface
Observed failure surface
Wall outline
Rankine failure surface
Observed
failure surface
(mm)
(mm)
(mm
)
(mm
)

Yang et al.: Location of Failure Plane and Design Considerations for Narrow GRS Wall Systems 31
Theoretically infinite strength, a default option in UTEXAS4, was assigned for the stable rear wall face. Because the existing wall is assumed “stable”, the infinite strength of the rear wall prevents failure surfaces passing through it and the search for the critical failure surface is constrained within the reinforced fill zone. The reinforced fill in the GRS wall was modeled using a conventional Mohr-Coulomb model with a unit weight 16 kN/m3, plane strain friction angle 42 and zero cohesion.
The interface between the sand reinforced fill and the alu-minum box was not modeled in the analyses. Kniss et al. (2007) conducted a parametric study to evaluate the effect of different interface properties for narrow GRS walls. A thin layer of soil which had lower shear strength () was used to model the interface in the limit equilibrium analysis. They found the influence of the weaker interface on the FS was less than 2 and did not significantly affect the location of the failure plane. They concluded that the interface probably did not need to be included in the limit equilibrium analyses.
The effect of centrifugal force was simulated by increasing the body force on the wall model. This is achieved by multiply-ing the unit weight of the reinforced fill by Ng times correspond-ing to the target g-level; for example, the unit weight for the LE modeling of centrifugal force at 10g was computed as 160 kN/m3 ( 16 10).
3.3 Modeling of Reinforcement
In limit equilibrium analyses, the stabilizing forces contrib-uted by the reinforcement tensions are incorporated into the equi-librium equation (balance of forces or moments) at the “limit” state (immediately between stable and unstable states). However, the difficulty with GRS structures when applying limit equilib-rium analyses is the equilibrium condition is statically indeter-minate. In particular, the determination of the maximum rein-forcement tension Tmax developed at each layer of reinforcement requires specific assumptions regarding the tension distribution throughout the wall height.
Conventionally, a triangular distribution of Tmax (propor-tional to the overburden pressure) has been assumed for the de-sign of reinforced soil wall structures (Fig. 5(a)). This triangular tension distribution has also been assumed to occur for GRS slopes that have been analyzed using limit equilibrium methods (Schmertmann et al. 1987; Leschinsky and Boedeker 1989; Jewell 1991). The FHWA design guidelines for reinforced soil slopes also recommend a triangular reinforcement force distribu-tion for the case of structures higher than 6 m (Elias et al. 2001; Berg et al. 2009a and 2009b). Contrary to this, measured field data has shown nearly uniform mobilization of reinforcement tension with depth for GRS walls under working stress condi-tions (Allen et al. 2003; Bathurst et al. 2008) as shown in Fig. 5(b). Yang et al. (2010) explained that the reason for the differ-ence is because the mobilization of reinforcement tension is not proportional to the mobilization of soil stress. At the point of failure (FS close to unity), Tmax at each layer of reinforcement likely approaches the ultimate tensile strength Tult prior to the rupture of the reinforcements. This hypothesis is supported by Jaber and Mitchell (1990) using results from an internally in-strumented reinforced soil wall. They observed that stress redis-tribution occurred across the height of the wall before structure failure. The substantial stress redistribution was expected to oc-cur after the first reinforcement reached its ultimate tensile
strength, so that the distribution of reinforcement tensions be-comes more uniform at the moment of failure and, therefore, takes advantage of the full capacity of the tensile strength of all reinforcement layers at failure. As a result, the probable distribu-tion of the reinforcement forces within GRS walls at failure, or at large deformation, approach the situation shown in Fig. 5(c).
For the development of tension along the length of the rein-forcement, many researchers (e.g., Duncan and Wright 2005; Lawson and Yee 2005, etc.) have proposed that the forces in the reinforcement are limited by its ability to resist face-connection, rupture and pullout failure. The modeling of reinforcement ten-sion along the length of the reinforcement is shown in Fig. 6 and discussed in the following sections. For simplicity of design it is normally assumed that reinforcement tension remains constant between the wall face and the point of maximum reinforcement tension.
Tensile Forces
For modeling purposes, it has been assumed that the resis-tance of the reinforcement against tensile rupture is uniform for all layers of reinforcement, as discussed previously. Although the wide-width tensile test is widely adopted for determining the tensile strength properties of geotextiles, the results provided by unconfined tensile testing are not the same as the reinforcement strengths used in centrifuge tests. This is because when geotex-tiles are placed in soil confinement the geotextiles, specifically nonwoven geotextiles, may behave differently to unconfined testing conditions (Montalvo and Sickler 1993). It has been re-ported that for a given strain, higher tensile loads are generated for the in-soil confined conditions (e.g., Ling et al. 1992; Leschinsky and Field 1987). For modeling accuracy the ultimate confined reinforcement tensile strength was back-calculated by force balance in the horizontal direction at the limit state using the failure plane corresponding to that measured from centrifuge tests. The average confined tensile strength reported based on the back-calculation analysis was 2.5 times greater than the uncon-fined tensile strength of the reinforcements. Consequently, a con-fined tensile load of 0.23 kN/m (0.09 2.5) was used as the tensile strength in each layer of reinforcements.
In addition, unlike limit equilibrium analyses carried out in conventional reinforced soil design, no reduction factors due to installation damage, creep and degradation were considered (all reduction factors were 1.0). This is because the construction of the centrifuge model was carefully handled to warrant no instal-lation damage and the test duration was relatively short without any long-term behavior like creep and degradation occurring.
Pullout Resistance
The tension generated in the reinforcement dissipates be-yond the point of maximum reinforcement tension due to inter-face shear stresses in the passive zone of the reinforced fill. For the case of reinforcement in constrained reinforced fills, there will be likely some residual tension and hence positive pullout out stresses at the rear of the reinforcement. However, the mag-nitude of this residual tension is difficult to model accurately. For simplicity and ease of design, the pullout resistance of the rein-forcement in this study is assumed to increase linearly from zero at the free end of the reinforcement to a value equal to the con-fined tensile strength of the reinforcement, as shown in Fig. 6. The assumed linear rate of dissipation in load with horizontal distance, indicated as S in Fig. 6 can be approximated by Eq. (1), which was derived based on the FHWA MSE wall design guide-lines (Elias et al. 2001; Berg et al. 2009a and 2009b).

32 Journal of GeoEngineering, Vol. 6, No. 1, April 2011
Fig. 5 Distribution of peak reinforcement tensions with height: (a) use in design of GRS walls and slopes; (b) observed distribution for
GRS walls under working stress conditions; (c) probable distribution for GRS walls under failure conditions
Fig. 6 Schematic illustration of assumed distribution of tension along the length of the reinforcement
*c v vS F C R (1)
where F* is the interface friction factor; C is the reinforcement perimeter; Rc is the coverage ratio; v is a scale correction factor which accounts for nonlinear stress reduction;v is the vertical overburden stress acting on the reinforcement. The FHWA guidelines recommend F* for geosynthetic reinforcement equal to F* (2/3) tan. The value of F* can also be evaluated physically from interface direct shear tests, using F* f tantanwhere f is the dimensionless soil-geosynthetic interaction coefficient (also called efficiency factor) and is the interface friction angle. The value of f for the soil/geotextile interface used in this study is approximately equal to 0.9, which was obtained from a series of interface direct shear tests conducted by Zornberg (1994). The reinforcement perimeter, C, was assigned a value of 2 to account for the planar nature of the reinforcements. The coverage ratio, Rc 1, again because of the planar nature of the reinforcements. The correction factor v depends primarily upon the strain sof-tening of the compacted granular reinforced fill and the extensi-bility of the reinforcement. The FHWA design guidelines suggest the value of v could be substantially smaller than 1 for geosyn-thetic reinforcements and recommends v 0.6 for geotextiles. v is the model vertical overburden stress, defined as:
v f vN z (2)
where Nf is the failure g-level of centrifuge test; is the unit weight of the reinforced fill; z is the depth of the layer of rein-forcement below the top of the reinforced fill; v is the vertical stress reduction factor due to the arching effect and constrained space.
For the vertical stress reduction, Filz and Duncan (1997a and 1997b) proposed a theoretical equation to determine the ver-tical shear loads acting between the wall and the backfill. These vertical shear loads reduce the vertical overburden stress near the wall face from 0 to 20 depending on wall height, interface friction angle and backfill density. However, the effect of con-strained space on earth pressure reduction is not considered in their study. Kniss et al. (2007) conducted a series of finite ele-ment simulations to quantify the reduction of vertical overburden pressure within narrow GRS walls. The results show the reduc-tion is 20 to 50 depending on wall aspect ratio and depth and distance from the stable wall face. Values of v varying with wall aspect ratios have been adopted from Kniss et al. (2007). For the case of wall aspect ratio of 0.4 in Test 2b, a value of v 0.65 was selected as the average of the variation of v with depth.
Overlapping and Orientation of Reinforcement
The reinforcements were wrapped around the wall face in the centrifuge models. The experimental results showed that this wrap-around (or overlapping) configuration increased the stabil-ity of the system. Consequently, the contribution of the geotextile
Assumed Tmax tension distribution Tult Tult
Tmax = K z SvHeight
(a) (b) (c)
Controlled by rupture resistance Controlled by pullout resistance

Yang et al.: Location of Failure Plane and Design Considerations for Narrow GRS Wall Systems 33
secondary layers to the stability of the models was incorporated in the limit equilibrium models. The tensile load in the overlap layer was modeled using a confined tensile load constantly through the entire secondary layer. The length of reinforcement was entered as 50 mm, which corresponds to the length of the secondary layers in the centrifuge test.
The inclination of the tensile loads is assumed in current practice to vary between horizontal and tangential to the critical failure surface. Zornberg et al. (1998b) performed a parametric evaluation on the effect of reinforcement orientation on the cal-culated factors of safety. The results show a less than 10 dif-ference in the calculation of FS. In this study, the reinforcement loads were assumed to act in directions horizontal to the critical failure surface. This assumption is justified by the in-flight ob-servation of the reinforced wall models at increasing g-levels.
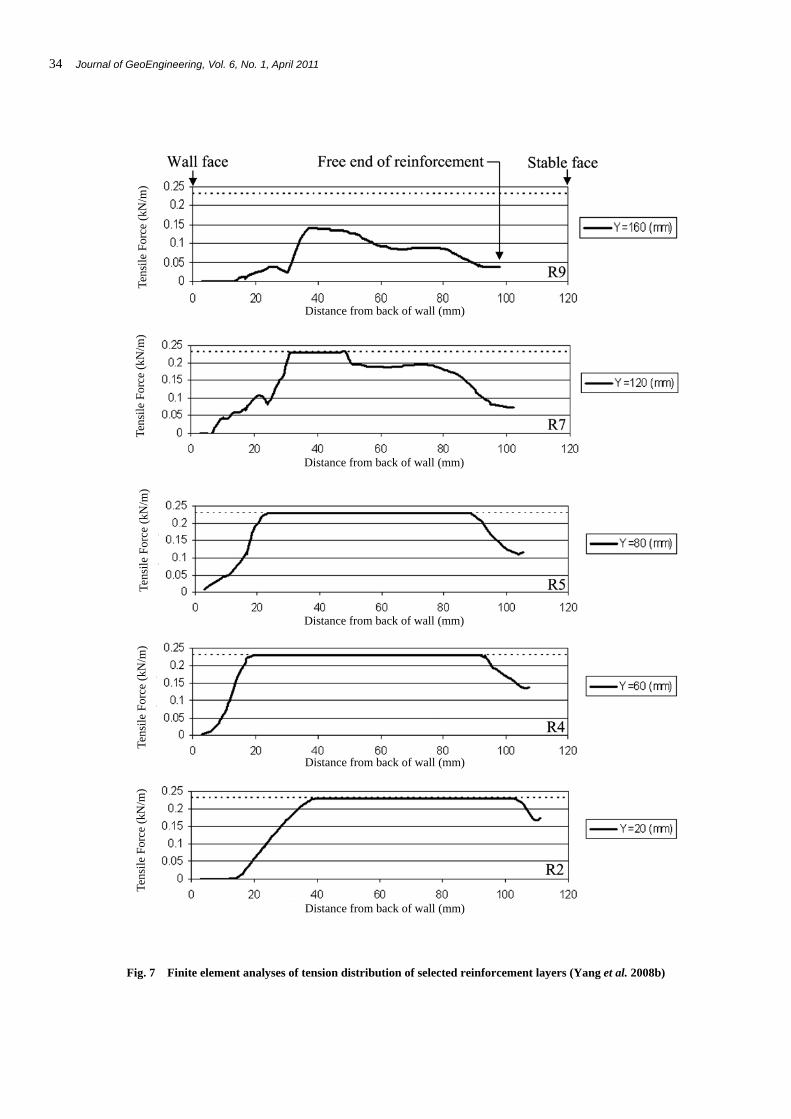
The final distribution of the reinforcement tension within narrow GRS walls is shown in Fig. 4. Yang et al. (2008b) con-ducted a finite element simulation for centrifuge model Test 2b. The predicted tension distribution of selected reinforcement lay-ers at the point of structure failure is shown in Fig. 7. The tension distribution predicted by finite element analysis approximates the distribution assumed in the LE modeling.
3.4 Search for Critical Failure Surface
Limit equilibrium analyses were performed using Spencer’s method (Spencer 1967). This method satisfies all equilibrium conditions, i.e., vertical force, horizontal force and moment equi-librium. The interslice forces were assumed to be parallel to each other. This assumption is required to balance the number of un-known parameters and the number of equilibrium equations. The vertical stress reduction due to the arching effect is neglected for calculating the stress on the base of each hypothetical slice in Spencer’s method because the arching effect has been taken into account in the modeling of the reinforcement.
Because the observed critical failure surface from centrifuge wall models showed a bilinear rather than a circular shape, limit equilibrium analyses in this study were performed using a search for noncircular failure surfaces. In addition, a parametric evalua-tion showed that noncircular failure surfaces are more critical than circular failure surfaces in the limit equilibrium analyses. The search for the noncircular failure surfaces were initiated by specifying the initial location of selected points within narrow GRS walls. A parametric sensitivity analysis was then performed to find the optimum number of points to define the initial failure surface. The results showed that an initial failure surface could be defined using five to nine points. Seven points, evenly distributed through the height of the wall, were adopted to define the initial failure surface. In all analyses, the first point on the initial failure surface was fixed at the toe of the wall. The last point was placed at the crest of the GRS wall. Fixing the first point at the toe forced the failure surface to pass through this point, but other points on the initial failure surface were only allowed to move horizontally.
4. RESULTS
The results obtained from the LE analyses of the three cen-trifuge tests are presented below. The two important failure mechanisms, factor of safety at failure and the location of the failure surface, obtained from the LE analysis are examined. For
model verification, these results are compared with the experi-mental results obtained from centrifuge testing.
4.1 Factor of Safety versus g-Level
The calculated factors of safety as a function of the g-level are shown in Fig. 8. Figure 8 shows the factor of safety decreas-ing with increasing g-level, which indicates the stability of the wall system decreases when g-level increases. Figure 8(a) shows that the wall is predicted to fail (FS 1.0) at 41.5g. Centrifuge testing indicates the wall failed at approximately 41g. The g- levels at failure resulting from centrifuge testing and limit equi-librium simulation are in excellent agreement. Limit equilibrium simulation of Tests 2a (L/H 0.6) and 3a (L/H 0.7) also show excellent agreement, shown in Figs. 8(b) and 8(c). The walls were predicted to fail at 40g for both tests. Centrifuge testing indicated the walls failed at 39g for Test 2a and at 38g for Test 3a.
4.2 Location of Failure Surface
Figure 9(a) shows a comparison between the location of the failure surface obtained by centrifuge testing from Test 2b, and the one obtained using LE analysis. Both the centrifuge and the LE results show the critical failure surface going partially through the reinforced fill and partially along the interface be-tween the reinforced fill and the stable face. Comparing these results with those based on Rankine theory for both triaxial com-pression and plane strain results show the Rankine theory to pre-dict a higher critical failure angle. Figures 9(b) and 9(c) show the results for Test 2a and Test 3a. Good agreements are observed for the LE and centrifuge results. Only a little discrepancy occurs at the top of the failure surface in Fig. 9(b). It also should be noted that for centrifuge Test 3a (L/H 0.7), the geometry being con-sistent with conventional reinforced soil walls, the observed critical failure surface is lower than that described by Rankine theory. This may indicate that the stable face may act as a boundary that changes the stress distribution in the reinforced fill zone. For the other centrifuge tests (L/H 0.7) the failure surface predicted from LE analyses and centrifuge testing show a lower critical failure surface angle than that predicted by Rankine the-ory, the reason for the difference will be discussed in the next section.
Last, based on the results of finite element simulation by Yang et al. (2008), there is a zero normal pressure zone along the soil-stable rear face interface. The normal stress acting on the soil-stable face interface was also examined using the limit equi-librium results. It is found the normal stresses are relatively small at the upper portion of failure surface (along interface between the soil and stable face) compared to the normal stresses at lower portion of the failure surface. This observation shows agreement with the observation from finite element simulation.
5. DISCUSSION
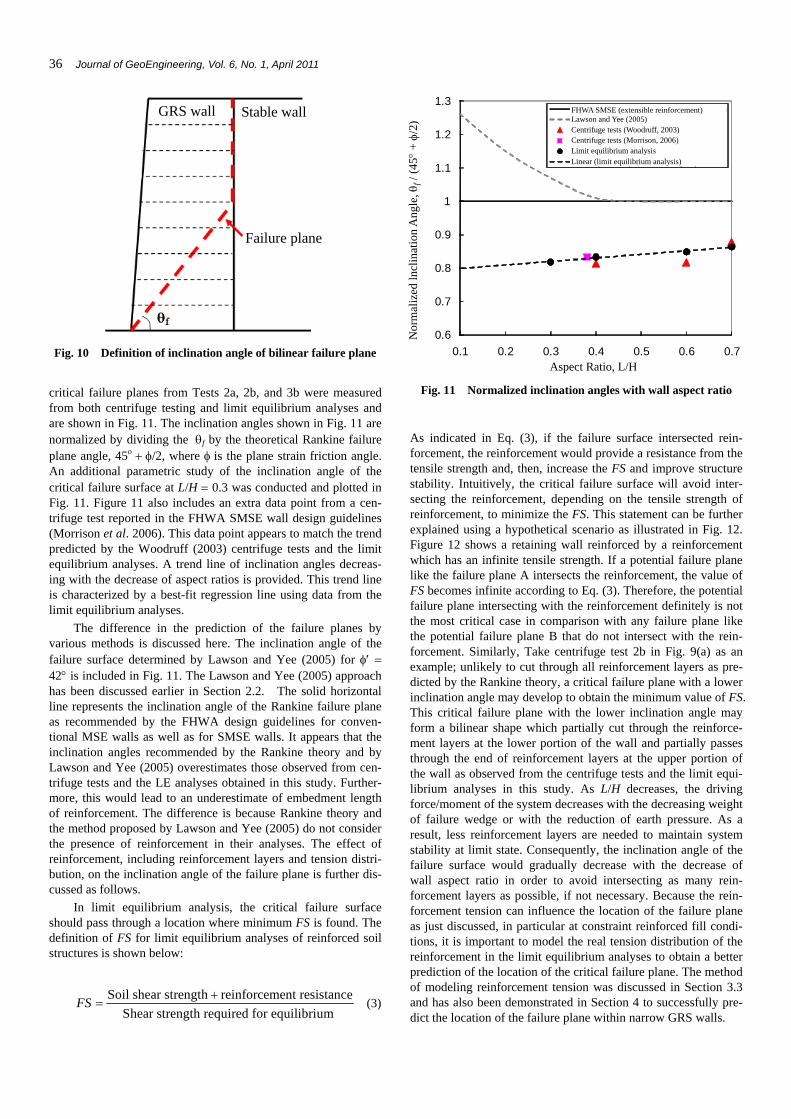
The inclination angle of the critical failure plane is an im-portant parameter for calculating the embedment length of the reinforcement and consequently the FS against pullout. In this study, the inclination angle of the critical failure plane is denoted asf and illustrated in Fig. 10. The inclination angles of the
34 Journal of GeoEngineering, Vol. 6, No. 1, April 2011
Fig. 7 Finite element analyses of tension distribution of selected reinforcement layers (Yang et al. 2008b)
Tens
ile
Forc
e (k
N/m
) Te
nsil
e Fo
rce
(kN
/m)
Tens
ile
Forc
e (k
N/m
) Te
nsil
e Fo
rce
(kN
/m)
Tens
ile
Forc
e (k
N/m
)
Distance from back of wall (mm)
Distance from back of wall (mm)
Distance from back of wall (mm)
Distance from back of wall (mm)
Distance from back of wall (mm)

Yang et al.: Location of Failure Plane and Design Considerations for Narrow GRS Wall Systems 35
(a)
(b)
(c)
Fig. 8 Factor of safety versus g-level: (a) Test 2b (L/H = 0.4); (b) Test 2a (L/H = 0.6); (c) Test 3a (L/H = 0.7)
(a)
(b)
(c)
Fig. 9 Location of failure surface: (a) Test 2b (L/H = 0.4); (b) Test 2a (L/H = 0.6); (c) Test 3a (L/H = 0.7)
g-Level
g-Level
g-Level
Fac
tor
of s
afet
y F
acto
r of
saf
ety
Fac
tor
of s
afet
y
Y (
mm
) Y
(m
m)
Y (
mm
)
X (mm)
X (mm)
X (mm)
36 Journal of GeoEngineering, Vol. 6, No. 1, April 2011
Fig. 10 Definition of inclination angle of bilinear failure plane
critical failure planes from Tests 2a, 2b, and 3b were measured from both centrifuge testing and limit equilibrium analyses and are shown in Fig. 11. The inclination angles shown in Fig. 11 are normalized by dividing the f by the theoretical Rankine failure plane angle, 45/2, where is the plane strain friction angle. An additional parametric study of the inclination angle of the critical failure surface at L/H 0.3 was conducted and plotted in Fig. 11. Figure 11 also includes an extra data point from a cen-trifuge test reported in the FHWA SMSE wall design guidelines (Morrison et al. 2006). This data point appears to match the trend predicted by the Woodruff (2003) centrifuge tests and the limit equilibrium analyses. A trend line of inclination angles decreas-ing with the decrease of aspect ratios is provided. This trend line is characterized by a best-fit regression line using data from the limit equilibrium analyses.
The difference in the prediction of the failure planes by various methods is discussed here. The inclination angle of the failure surface determined by Lawson and Yee (2005) for 42 is included in Fig. 11. The Lawson and Yee (2005) approach has been discussed earlier in Section 2.2. The solid horizontal line represents the inclination angle of the Rankine failure plane as recommended by the FHWA design guidelines for conven-tional MSE walls as well as for SMSE walls. It appears that the inclination angles recommended by the Rankine theory and by Lawson and Yee (2005) overestimates those observed from cen-trifuge tests and the LE analyses obtained in this study. Further-more, this would lead to an underestimate of embedment length of reinforcement. The difference is because Rankine theory and the method proposed by Lawson and Yee (2005) do not consider the presence of reinforcement in their analyses. The effect of reinforcement, including reinforcement layers and tension distri-bution, on the inclination angle of the failure plane is further dis-cussed as follows.
In limit equilibrium analysis, the critical failure surface should pass through a location where minimum FS is found. The definition of FS for limit equilibrium analyses of reinforced soil structures is shown below:
Soil shear strength reinforcement resistance
Shear strength required for equilibrium FS
(3)
0.6
0.7
0.8
0.9
1
1.1
1.2
1.3
0.1 0.2 0.3 0.4 0.5 0.6 0.7
Nor
mal
ized
Incl
inat
ion
Ang
le, f
/ (4
5+/
2)
Aspect Ratio, L/H
FHWA SMSE (Extensible Reinforcement)Lawson and Yee (2005)Centrifuge Tests (Woodruff, 2003)Centrifuge Test (Morrison, 2006)Limit Equilibrium AnalysisLinear (Limit Equilibrium Analysis)
Fig. 11 Normalized inclination angles with wall aspect ratio
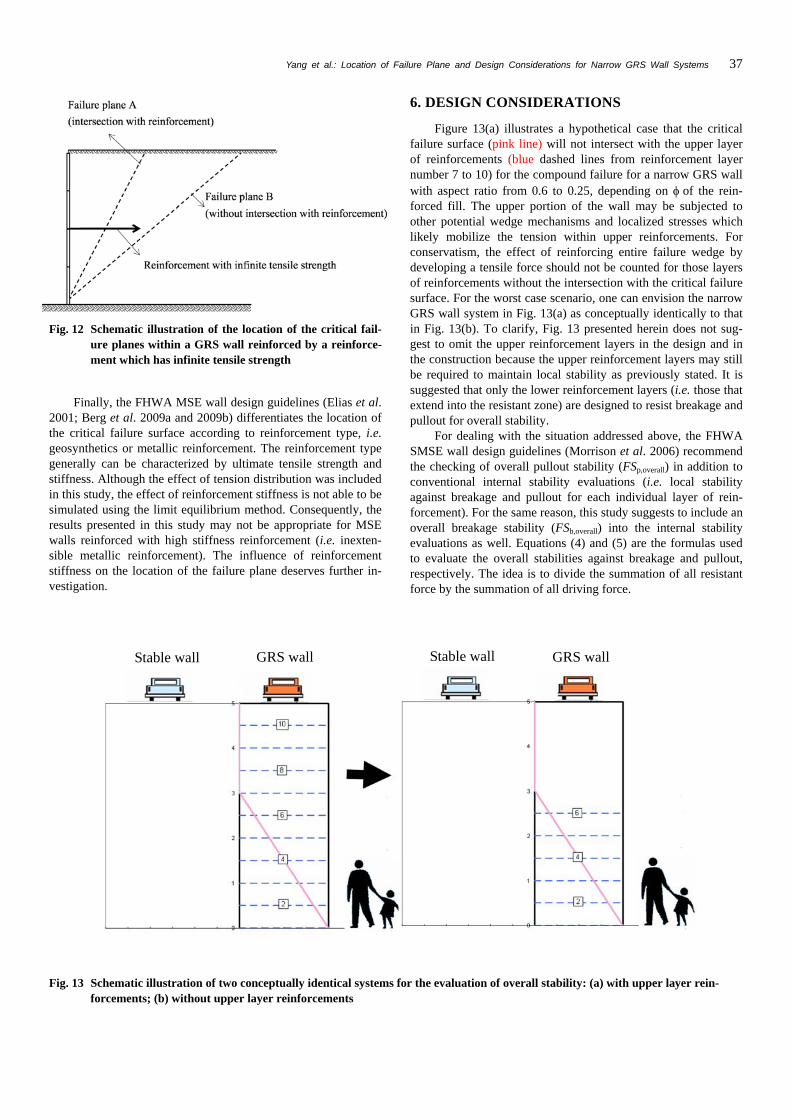
As indicated in Eq. (3), if the failure surface intersected rein-forcement, the reinforcement would provide a resistance from the tensile strength and, then, increase the FS and improve structure stability. Intuitively, the critical failure surface will avoid inter-secting the reinforcement, depending on the tensile strength of reinforcement, to minimize the FS. This statement can be further explained using a hypothetical scenario as illustrated in Fig. 12. Figure 12 shows a retaining wall reinforced by a reinforcement which has an infinite tensile strength. If a potential failure plane like the failure plane A intersects the reinforcement, the value of FS becomes infinite according to Eq. (3). Therefore, the potential failure plane intersecting with the reinforcement definitely is not the most critical case in comparison with any failure plane like the potential failure plane B that do not intersect with the rein-forcement. Similarly, Take centrifuge test 2b in Fig. 9(a) as an example; unlikely to cut through all reinforcement layers as pre-dicted by the Rankine theory, a critical failure plane with a lower inclination angle may develop to obtain the minimum value of FS. This critical failure plane with the lower inclination angle may form a bilinear shape which partially cut through the reinforce-ment layers at the lower portion of the wall and partially passes through the end of reinforcement layers at the upper portion of the wall as observed from the centrifuge tests and the limit equi-librium analyses in this study. As L/H decreases, the driving force/moment of the system decreases with the decreasing weight of failure wedge or with the reduction of earth pressure. As a result, less reinforcement layers are needed to maintain system stability at limit state. Consequently, the inclination angle of the failure surface would gradually decrease with the decrease of wall aspect ratio in order to avoid intersecting as many rein-forcement layers as possible, if not necessary. Because the rein-forcement tension can influence the location of the failure plane as just discussed, in particular at constraint reinforced fill condi-tions, it is important to model the real tension distribution of the reinforcement in the limit equilibrium analyses to obtain a better prediction of the location of the critical failure plane. The method of modeling reinforcement tension was discussed in Section 3.3 and has also been demonstrated in Section 4 to successfully pre-dict the location of the failure plane within narrow GRS walls.
Failure plane
Stable wall GRS wall FHWA SMSE (extensible reinforcement) Lawson and Yee (2005) Centrifuge tests (Woodruff, 2003) Centrifuge tests (Morrison, 2006) Limit equilibrium analysis Linear (limit equilibrium analysis)
Aspect Ratio, L/H
Nor
mal
ized
lncl
inat
ion
Ang
le,
f / (
45
+
/2)
Yang et al.: Location of Failure Plane and Design Considerations for Narrow GRS Wall Systems 37
Fig. 12 Schematic illustration of the location of the critical fail-ure planes within a GRS wall reinforced by a reinforce-ment which has infinite tensile strength
Finally, the FHWA MSE wall design guidelines (Elias et al. 2001; Berg et al. 2009a and 2009b) differentiates the location of the critical failure surface according to reinforcement type, i.e. geosynthetics or metallic reinforcement. The reinforcement type generally can be characterized by ultimate tensile strength and stiffness. Although the effect of tension distribution was included in this study, the effect of reinforcement stiffness is not able to be simulated using the limit equilibrium method. Consequently, the results presented in this study may not be appropriate for MSE walls reinforced with high stiffness reinforcement (i.e. inexten-sible metallic reinforcement). The influence of reinforcement stiffness on the location of the failure plane deserves further in-vestigation.
6. DESIGN CONSIDERATIONS
Figure 13(a) illustrates a hypothetical case that the critical failure surface (pink line) will not intersect with the upper layer of reinforcements (blue dashed lines from reinforcement layer number 7 to 10) for the compound failure for a narrow GRS wall with aspect ratio from 0.6 to 0.25, depending on of the rein-forced fill. The upper portion of the wall may be subjected to other potential wedge mechanisms and localized stresses which likely mobilize the tension within upper reinforcements. For conservatism, the effect of reinforcing entire failure wedge by developing a tensile force should not be counted for those layers of reinforcements without the intersection with the critical failure surface. For the worst case scenario, one can envision the narrow GRS wall system in Fig. 13(a) as conceptually identically to that in Fig. 13(b). To clarify, Fig. 13 presented herein does not sug-gest to omit the upper reinforcement layers in the design and in the construction because the upper reinforcement layers may still be required to maintain local stability as previously stated. It is suggested that only the lower reinforcement layers (i.e. those that extend into the resistant zone) are designed to resist breakage and pullout for overall stability.
For dealing with the situation addressed above, the FHWA SMSE wall design guidelines (Morrison et al. 2006) recommend the checking of overall pullout stability (FSp,overall) in addition to conventional internal stability evaluations (i.e. local stability against breakage and pullout for each individual layer of rein-forcement). For the same reason, this study suggests to include an overall breakage stability (FSb,overall) into the internal stability evaluations as well. Equations (4) and (5) are the formulas used to evaluate the overall stabilities against breakage and pullout, respectively. The idea is to divide the summation of all resistant force by the summation of all driving force.
Fig. 13 Schematic illustration of two conceptually identical systems for the evaluation of overall stability: (a) with upper layer rein-forcements; (b) without upper layer reinforcements
Stable wall Stable wall GRS wall GRS wall

38 Journal of GeoEngineering, Vol. 6, No. 1, April 2011
al,1b,overall
max,1
i jii
i jii
TFS
T
(4)
and
1p,overall
max,1
i jrii
i jii
PFS
T
(5)
where Tal is the allowable reinforcement tensile strength; Tmax is the maximum tension developed in reinforcement; Pr is the pull-out capacity; i is i
th layer of reinforcement, i [1, 2, 3, …j]; j is the number of reinforcement layer that satisfies pullout criteria (FSp,i 1.5) at each reinforcement layer. Tmax can be calculated as earth pressure times vertical spacing of reinforcements in con-ventional walls. As for Tmax in narrow GRS walls, the earth pres-sure will be reduced due to arching effect and boundary con-straint as address previously. Tmax can be estimated as Eq. (6)
max d a vT R K z S (6)
where is the unit weight of the reinforced backfill; z is the depth of the layer of reinforcement below the top of the reinforced fill; Ka is the active earth pressure coefficient; Sv is vertical spacing of reinforcements; Rd is the lateral earth pressure reduction factor to account for arching effect and boundary constraint. Readers are referred to Yang and Liu (2007) for detailed discussion of earth pressure reduction under at-rest and active conditions. Pr can be estimated by multiplying S (in Eq. (1)) and reinforcement em-bedment length Le together. Note Pr should be less than Tal. Re-inforcement embedment length Le can be evaluated as Eq. (7).
tane
f
H zL L
(7)
where L is wall width; f is the inclination angle of the critical failure plane which can be evaluated using the limit equilibrium method discussed in this paper.
Many measures have been recommended to improve the potential local wedge stability and the local stresses likely occur-ring in the upper half of narrow walls. The FHWA SMSE wall design guidelines (Morrison et al. 2006) suggest installation of frictional or mechanical connections at the interface between the narrow GRS wall and stable wall face. Lawson and Yee (2005) recommend attaching the reinforcements to anchors or nails in-serted into the existing stable wall or stable rock to ensure exter-nal stability and to dissipate the residual tensions at the rear of the reinforcements. Lawson and Yee (2005) also reported a suc-cessful case study of improving the stability of a constrained reinforced segmental block wall by connecting the reinforce-ments to rock anchors. Another option proposed by Yang and Liu (2007) is to extend the upper reinforcements over the top of an existing stable wall. If the wall space is too narrow, cast in place concrete is suggested as indicated in Table 1.
7. CONCLUSIONS
This paper presents a limit equilibrium study to locate the critical failure plane within narrow GRS wall systems. The nar-row GRS wall systems walls referred in this study are GRS walls
with aspect ratios, L/H, less than 0.7 and placed in front of an existing stable wall (or shored wall). The detailed procedure of limit equilibrium analyses, in particular the modeling of the ten-sion distribution along the geosynthetic reinforcement, is dis-cussed. The proposed limit equilibrium model was verified by centrifuge tests on narrow GRS walls. The LE results were in close agreement with the centrifuge experimental results. The proposed limit equilibrium model can further serve as the basis for the design of narrow GRS walls. The specific conclusions that can be drawn from this study are as follows:
1. The results in this study indicated that critical failure plane was bilinear for low aspect ratios. For higher aspect ratios the critical failure plane was linear. At low aspect ratios, the critical failure surface formed partially through the reinforced fill and partially along the interface between the GRS and the stable wall faces.
2. The relationship between wall aspect ratio and the inclination angle of the critical failure surface was investigated. This study found the inclination angle of the critical failure plane decreased slightly with a decrease in wall aspect ratio. Over-all, the inclination angle of the critical failure plane within narrow GRS walls is 10 ~ 20 less than the inclination an-gle given by the Rankine failure plane (i.e. 45/2) when the plane strain friction angle of the reinforced fill is used. The possible reason for the difference in the failure surface angle can be attributed to the presence of the reinforcement. The critical failure surface will avoid intersecting as many reinforcements as possible, depending on the tensile strength of the reinforcement, to minimize the FS.
3. Design considerations related to the overall internal stability against breakage and pullout in addition to the conventional internal stability evaluations are proposed. Many measures to improve the potential local wedge stability and the local stresses occurring in the upper half of the narrow GRS walls were discussed.
4. The reinforcement type (Elias et al. 2001; Berg et al. 2009a and 2009b) and surcharge conditions (Lee et al. 2010; Morri-son et al. 2006) can alter the location of the critical failure surface. These effects are not considered in this paper. Therefore, the results presented in this paper should be carefully applied only for MSE walls reinforced with extensible geosynthetic reinforcement without permanent surcharge loads.
ACKNOWLEDGEMENTS
Funding for this study has been provided by the Texas State Department of Transportation under project number FHWA/TX 0-5506. The work of limit equilibrium analysis was greatly con-sulted and helped by Dr. Stephen Wright, the author of UTEXAS4 program. The First author is indebted to his Col-league, Ken Kniss, for his preliminary simulations. Comments from reviewers and editors to improve the clarity and quality of paper are appreciated.
NOTATIONS
Basic SI units are given in parentheses. C reinforcement perimeter (dimensionless)

Yang et al.: Location of Failure Plane and Design Considerations for Narrow GRS Wall Systems 39
F* interface friction factor (dimensionless) FS factor of safety (dimensionless) FSb,overall factor of safety for the overall breakage stability
(dimensionless) FSp, overall factor of safety for the overall pullout stability
(dimensionless) H wall height (m) Ka active earth pressure coefficient (dimensionless) L wall width (m) Le reinforcement embedment length (m) Lt top width of the reinforced zone (m) L/H wall aspect ratio (dimensionless) Ng g-level of centrifuge model (dimensionless) Nf failure g-level of centrifuge model (dimensionless) Pr pullout capacity (N/m) Rc coverage ratio (dimensionless) Rd lateral earth pressure reduction factor (dimensionless) Sv reinforcement vertical spacing (m) Tal allowable reinforcement tensile strength (N/m) Tmax maximum reinforcement tension (N/m) Tult ultimate reinforcement tensile strength (N/m) z depth of reinforcement below the top of wall (m)
v scale correction factor for nonlinear stress reduction (dimensionless)
v vertical stress reduction factor (dimensionless) interface friction angle (degree) frictional angle of reinforced fill (degree) unit weight of reinforced fill (N/m3)
f inclination angle of the critical failure plane (degree)
v vertical overburden stress (Pa)
REFERENCES
Allen, T. M., Bathurst, R. J., Holtz, R. D., Walters, D., and Lee, W. F. (2003). “A new working stress method for prediction of rein-forcement loads in geosynthetic walls.” Canadian Geotechnical Journal, 40(5), 976994.
ASTM D4595, Standard Test Method for Tensile Properties of Geo-textiles by the Wide-Width Strip Method. The American Society for Testing and Materials, West Conshohoken, PA.
Bathurst, R. J., Miyata, Y., Nernheim, A., and Allen, T. M. (2008). “Refinement of k-stiffness method for geosynthetic reinforced soil walls.” Geosynthetics International, 15(4), 269-295.
Berg, R., Christopher, B. R., and Samtani, N. (2009a). Design of Mechanically Stabilized Earth Walls and Reinforced Soil Slopes-Vol I. Report No. FHWA-NHI-10-024, Federal Highway Administration.
Berg, R., Christopher, B. R., and Samtani, N. (2009b). Design of Mechanically Stabilized Earth Walls and Reinforced Soil Slopes-Vol II. Report No. FHWA-NHI-10-025, Federal High-way Administration.
Bishop, A. W. (1955). “The use of the slice circle in the stability of slopes.” Geotechnique, London, U.K., 5, 7-17.
Coulomb, C. A. (1776). “An attempt to apply the rules of maxima and minima to several problems of stability related to architec-ture.” Mem. Acad. Roy. des Sciences, Paris, France, 7, 343-382.
Duncan, M. and Wright S. G. (2005). Soil Strength and Slope Stabil-ity. John Wiley & Sons, Inc., 297 pgs.
Elias, V., Christopher, B. R., and Berg, R. R. (2001). Mechanically
Stabilized Earth Walls and Reinforced Soil Slopes Design and Construction Guidelines. Report No. FHWA-NHI-00-043, Fed-eral Highway Administration.
Filz, G. M. and Duncan, J. M. (1997a). “Vertical shear loads on nonmoving walls, I: Theory.” Journal of Geotechnical and Geoenvironmental Engineering, ASCE, 123(9), 856-862.
Filz, G. M. and Duncan, J. M. (1997b). “Vertical shear loads on nonmoving walls, II: Application.” Journal of Geotechnical and Geoenvironmental Engineering, ASCE, 123(9), 863-873.
Frydman, S. and Keissar, I., (1987). “Earth pressure on retaining walls near rock faces.” Journal of Geotechnical Engineering, ASCE, 113(6), June, 586-599.
Handy, R. L. (1985). “The arc in soil arching.” Journal of Geotech-nical Engineering, ASCE, 111(3), 302-318.
Kniss, K., Wright, S., Zornberg, J. G., and Yang, K.-H. (2007). De-sign Considerations for MSE Retaining Walls Constructed in Confined Spaces. Center for Transportation Research (CTR), Report No. 0-5506-1, Austin, Texas.
Lawson, C. R. and Yee, T. W. (2005). “Reinforced soil retaining walls with constrained reinforced fill zones.” Proc., GeoFron-tiers, ASCE Geo-Institute Conference, 2721-2734.
Lee, Y.-B., Ko, H.-Y., and McCartney, J. S. (2010). “Deformation response of shored MSE walls under surcharge loading in the centrifuge.” Geosynthetics Internaitonal, 17(6), 389-402.
Leshchinsky, D., Hu, Y., and Han, J. (2004). “Limited reinforced space in segmental retaining wall.” Geotextiles and Geomem-branes, 22(6), 543-553.
Li, C. (2005). Mechanical Response of Fiber-Reinforced Soil. Ph.D. Dissertation, University of Texas at Austin.
Ling, H. I., Wu, J. T. H., and Tatsuoka, F. (1992). “Short-term strength and deformation characteristics of geotextiles under typical operational conditions.” Geotextiles and Geomembranes, 11, 185-219.
Janbu, N. (1954). “Stability analysis of slopes with dimensionless parameters.” Harvard Soil Mechanics Series, No. 46.
Jewell, R. A. (1991). “Application of revised design charts for steep reinforced slopes.” Geotextiles and Geomembranes, 10(3), 203-233.
Montalvo, J. R. and Sickler, W. (1993). “Comparison of geotex-tiles – the correlation between test methods and practical per-formance.” Proc., Geosynthetics 93 Conference, Vancouver, Canada, 547-559.
Morgenstern, N. R. and Price, V. E. (1965). “The analysis of the stability of generalized slip surfaces.” Geotechnique, London, U.K., 15, 79-93.
Morrison, K. F., Harrison, F. E., Collin, J. G., Dodds, A., and Arndt, B. (2006). Shored Mechanically Stabilized Earth (SMSE) Wall Systems Design Guidelines. Report No.FHWA-CFL/TD-06-001, Federal Highway Administration.
ReSSA (2002). Reinforced Slope Stability Analysis. Computer Pro-gram, Version 2, ADAMA Engineering, U.S.A.
Schmertmann, G. R., Chouery-Curtis, V. E., Johnson, R. D., and Bonapart R. (1987). “Design charts for geogrid-reinforced soil slopes.” Proc., Geosynthetics 87 Conference New Orleans, La., 108-120.
Spencer, E. (1967). “A method of analysis of the stability of em-bankments assuming parallel inter-slice forces.” Geotechnique, 24(4), 661-665.
Take, W. A. and Valsangkar (2001). “Earth pressures on unyielding retaining walls of narrow backfill width.” Canadian Geotechni-cal Journal, 38, 1220-1230.
Woodruff, R. (2003). Centrifuge Modeling of MSE-Shoring Com-
40 Journal of GeoEngineering, Vol. 6, No. 1, April 2011
posite Walls. Thesis, Univ. of Colorado, Boulder.
Wright, S. G. (1999). UTEXAS4 A Computer Program for Slope Stability Calculations. Shinoak Software, 221 pgs.
Yang, K-H, Zornberg, J. G., and Bathurst, R. J. (2010). “Mobiliza-tion of reinforcement tensions within geosynthetic-reinforced soil structures.” Proc., Earth Retention Conference 3, ER2010, Bellevue, Washington.
Yang, K-H, Kniss, K. K., Zornberg, J. G., and Wright, S. G. (2008a). “Finite element analyses for centrifuge modeling of narrow MSE walls.” Proc., First Pan American Geosynthetics Confer-ence, GEOAMERICAS 2008, Cancun, Mexico.
Yang, K-H., Zornberg, J. G., and Wright, S. G. (2008b). Numerical Modeling of Narrow MSE Walls with Extensible Reinforcements. Center for Transportation Research (CTR), Report No. 0-5506-2, Austin, Texas.
Yang, K-H. and Liu, C-N. (2007). “Finite element analysis of earth pressures for narrow retaining wall.” Journal of GeoEngineer-ing., Taiwan Geotechnical Society, 2(2), 43-52.
Zornberg, J. G. (1994). Performance of Geotextile Reinforced Soil Structures. Ph.D. Dissertation, Dept. of Civil Engineering, Uni-versity of California, Berkeley, California, U.S.A.
Zornberg, J. G., Sitar, N., and Mitchell, J. K. (1998a). “Performance of geosynthetic-reinforced slopes at failure.” Journal of Geo-technical Engineering, 124(8), 670-683.
Zornberg, J. G., Sitar, N., and Mitchell, J. K. (1998b). “Limit equi-librium as basis for design of geosynthetic-reinforced slopes.” Journal of Geotechnical Engineering, 124(8), 684-698.
Zornberg, J. G. (2002). “Peak versus residual shear strength in geosynthetic-reinforced soil design.” Geosynthetic International, 9(4), 387-389.