local monitoring system during the implementation of … · 2018-05-02 · 1 local monitoring...
TRANSCRIPT

1
Local Monitoring System During the Implementation of Indonesia’s Social Safety Net Programs with Special
Reference to the BKKBN System*
Sudarno Sumarto Daniel Suryadarma Wenefrida Widyanti
Asep Suryahadi#
Abstract The experience of the recent Indonesian social safety net programs reveals that targeting of those programs was one of the most difficult problems. This was among others due to the lack of timely, complete, accurate and acceptable data required to deliver large scale, widespread, transfer programs to the eligible beneficiaries. While targeting has large potential benefits, it also entails costs. The costs include the administrative costs of identifying, reaching, and monitoring potential beneficiaries. One approach commonly used to identify potential beneficiaries is through community-based identification. This approach allows communities to categorize households within their own community as poor or vulnerable. The targeting for safety net programs during the Indonesian crisis was mainly based on a household classification created by the National Family Planning Coordinating Agency (BKKBN) because this is the only data available for individual targeting. Little is known, however, on ways the BKKBN data is being generated and how reliable is the BKKBN data in terms of its accuracy as proxies of welfare status of the household. This is crucial as there has been some concern over the reliability of the BKKBN data, both in terms of ways the data is being collected and its inability to capture shocks. This paper discusses the mechanics and reliability of the BKKBN monitoring system.
* Paper presented at Poverty and Economic (PEP) Research Network Meeting, Senegal, June 16-20, 2004. # Researchers at the SMERU Research Institute, Jakarta.

The SMERU Research Institute
2
I. Background The outbreak of the Indonesian crisis in late 1997 has forced Indonesian households to adjust to the first serious economic contraction in years.1 The response of the government to the impending social impact of the crisis was to launch the so-called social safety net programs in early 1998. These are a set of new as well as expanded initiatives widely known as the “JPS” programs, an acronym of the Indonesian term for social safety net, Jaring Pengaman Sosial. It is important to note, however, that before the crisis Indonesians had never relied on government safety net programs. The country has neither the economic apparatus nor the political mechanism required to deliver large scale, widespread, transfer programs. Therefore, the government, among others, was constrained by a lack of timely, complete, accurate, and acceptable data. Despite the fact that there were no well-designed and publicly accessible information systems that would facilitate efforts to address the needs of the traditionally poor and newly poor resulting from the crisis, the government played a key role in the efforts to mitigate the social impact of the crisis, complemented by non-governmental organizations (NGOs) and the donors. As the economic and political crisis in Indonesia has worsened over the years, there were increasing recognition of the need to identify and track emerging problems, with a view to designing appropriate responses. Efforts to monitor social impacts have concentrated on improving or accelerating existing tools, such as the national socio-economic survey (SUSENAS) and the village potential survey (PODES). Although these efforts are crucial for medium-term planning, the time necessary to design instruments, gather, and process data is too long for these instruments to be a useful guide for immediate action. By the time data are processed and analyzed, quickly changing crisis conditions will have rendered them obsolete. In addition, both SUSENAS and PODES data are only appropriate for geographic targeting, and thus they cannot be used to identify eligible individual beneficiaries. The only nationally representative data available during the crisis was the Family Planning Coordinating Board (BKKBN) data. Since before the crisis BKKBN have been collecting data on welfare indicators of all Indonesian households through their cadres all over the country. Therefore, the majority of SSN programs use the BKKBN data to target their beneficiaries. There have been some concerns, however, over the reliability of the BKKBN data, both in terms of the way the data is being collected and the static nature of the BKKBN indicators, so that may not be able to capture shocks suffered by households.
1 Throughout 1998 real economic growth was -13.7 percent. This was a sharp turn around from the high growth of the previous three decades, which averaged over 7 percent annually. The social impact of this large economic contraction was also substantial. The poverty rate increased by 164 percent from the immediate pre-crisis level in mid 1997 to the peak of the crisis by the end of 1998. In the labor market, even though the open unemployment rate slightly only increased from 4.7 percent in August 1997 to 5.5 percent in August 1998, real wages fell by around one third during the same period. One year later, real wage growth has returned to positive in most sectors, but the unemployment rate has continued to climb, reaching 6.4 percent by 1999.

The SMERU Research Institute
3
The purpose of this paper is to briefly discuss the use of different local monitoring systems in identifying eligible beneficiaries for the social safety nets program during the Indonesian crisis, with special reference to the BKKBN monitoring system. Specifically, we are interested in describing and evaluating how a community-based monitoring system such as the BKKBN data can be used for national programs. The remainder of the paper is structured as follows. Section two briefly discusses different activities to monitor the social impact of the Indonesian crisis. Section three discusses approaches and mechanics of targeting in the Indonesian social safety net programs. Section four discusses the BKKBN monitoring system. Finally, section five provides the concluding remarks.

The SMERU Research Institute
4
II. An Inventory of Research, Monitoring, and Social Safety Nets Program during the Indonesian Crisis
Since the outbreak of the Indonesian crisis various monitoring efforts have been established by the government, NGOs, universities, and donor agencies. These monitoring bodies have been working both to assess the extent of the crisis itself and the impact of the programs which have been put in place to address the crisis. These efforts were done to complement regular large sample data collection carried out by Statistics Indonesia (BPS) which are not a response survey type. This section summarizes different activities to monitor the social impact of the Indonesian crisis. This summary only covers major monitoring activities in Indonesia since the crisis started. 1. NGO mapping and consultation — Perhaps the most important partnership on this category was the efforts developed through the Community Recovery Program (CRP), which was facilitated by the World Bank and involving several donors and a broad spectrum of national and local NGOs. This is a civil society-led mechanism that channels resources to community-based organizations. The overall objective of the program is to strengthen the coping capacities of vulnerable groups of the population most severely affected by the crisis. The program has three priority areas: food security, access to basic social services, and job creation and income generation. CRP's pilot phase of operations started during the last quarter of 1998. During this initial phase, 136 projects were approved and committed for funding by its National Council. Parallel to the CRP was a national NGO mapping effort supported by the Ford Foundation, which involved consultations in all regions with a large range of NGO coalitions. The mapping process was carried out through focus group discussions (FGDs) at the community, district, and provincial levels. These consultations were facilitated by locally-based NGO activists/researchers, some of whom have active relationships with the communities where the FGDs were conducted. The FGDs were carried out first at the community level, followed by the district then the provincial levels. The higher level FGDs are meant for verification of findings from the community level and expanding understandings at a regional level. All 27 provinces in Indonesia were involved in this mapping process, which was carried out simultaneously in the months of October-November 1998. In each province, two districts were selected, one representing an urbanized district and another a relatively isolated and poor one. The districts and communities selected for mapping were identified based on consultations with other members of civil society and, sometimes, with input from local government officials. A gleaning of regional newspapers was conducted to document a broader range of crisis-related issues which emerged locally during the same time period of the FGDs. Data analysis and writing up took place in late April 1999. The mapping team also established a crisis website, which provided the means for a continual flow of field-based monitoring information from community organizations.

The SMERU Research Institute
5
2. SMERU’s Kecamatan (sub-district) Crisis Impact Survey — The Kecamatan Rapid Poverty Assessment was a subjective, expert respondent survey of three government officials in each of Indonesia’s 4025 kecamatans conducted in 1998. In each sub-district three respondents with kecamatan-wide responsibilities were chosen: the agriculture officer (mantri tani) in rural areas or the community development officer (kepala seksi PMD) in urban areas; the kecamatan school supervisor (penilik sekolah ); and the doctor at the primary health center (dokter puskesmas). Each respondent was asked a standard set of questions about changes taking place in the kecamatan as a whole, as well as a set of questions about their professional specialty.2 The questions asked about the degree of different kinds of impacts (migration, access to health and education, food availability, etc.), the frequency of different types of coping strategies, and the most severe impacts in each area. All questions were designed to measure proportional change in indicators relative to the same time in 1997, to eliminate seasonal changes. The questions asked to all the three respondents were qualitative and required the respondents to rate each indicator’s severity on a five-point scale: 1) somewhat improved; 2) about the same; 3) somewhat worse; 4) much worse; and 5) very much worse.3 The common questions also included a ranking of problems and three questions on existing crisis response programs. The respondent-specific questions were also primarily qualitative, but included a small number of quantitative questions (which duplicated the topics covered qualitatively). There are limitations to every approach and the use of subjective qualitative questions is no exception. With the decision to use this type of instrument, the loss of quantitative precision and relying on a very small number of respondents in each location were the price paid for a rapid and nationally comprehensive survey. For this survey, national coverage was necessary in order to identify crisis-hit areas for program targeting. A quantitative survey using representative sampling approach was ruled out as demanding kecamatan sample sizes that are simply too large. By asking for qualitative assessments we hoped to get universal coverage with complete response (the use of quantitative questions did dramatically raise the non-response rate in this survey). It was also necessary to limit the number of respondents in each kecamatan to minimize the time between survey distribution and return of questionnaires. 3. SMERU’s Community-based monitoring — In September 1998, SMERU established community based monitoring (CBM) in three areas: Cibangkong village in Bandung City in Jawa Barat, and Gangga and Sekotong villages in Lombok Barat district. The main purpose was to monitor the flow of funds of the crisis-mitigating programs. The study in Cibangkong involved 12 neighbourhood communities and a neighbourhood forum was established as a result. Similarly, a forum of village representatives was established in Gangga and Sekotong.
2 In addition to the three respondents in each kecamatan, BPS local officer (mantri statistik) completed a separate questionnaire, including some quantitative questions regarding changes since the start of the crisis. See Appendix 1 for more details on survey design and data collection. 3 A typical question is “Relative to the same period last year, how many families are switching from staple foods to lower quality substitutes? Please answer on the scale indicated”.

The SMERU Research Institute
6
The forums have become suitable effective venues for local conflict resolution. People have brought cases to the attention of the forum, many of which have been instantly resolved. For example, in Lombok Barat people complained that subsidized rice arrived late and the responsible agency for distribution blamed the late arrival of operational funds for the slow delivery. So the community agreed to advance transportation costs to remedy the delay. The forum also selected out many ineligible beneficiaries (those who could afford unsubsidized rice) that had been receiving the cheap rice. While the forums were originally created to discuss the social safety net programs, this space has already been broadened by the people to discuss wider community issues such as land disputes, local public services, and local sanitary conditions. The contributions these forums are making in Indonesia by allowing people to discuss their rights and entitlements has added immense value to local social infrastructure. 4. Coping mechanism and the social impact of the crisis on the informal sector — The Center for Population Research (PPK) at Gajah Mada University (UGM) has conducted three studies in relation to the crisis. The first study is the Social Security Survey which was conducted in Yogyakarta, Central Java, and East Java Provinces in the months of February to April 1998, covering 1411 households. The survey was aimed at investigating survival strategies of households with different types of occupation to cope with the economic crises. Focus group discussions (FGD) and indepth interviews were also conducted to collect qualitative data. The second study is the Crisis Impact Study which covered several districts in Yogyakarta and Central Java, i.e. Gunung Kidul, Klaten, Bantul, and Kulon Progo. A combination of rural rapid appraisal (RRA), FGD, and indepth interview is used to describe impacts of the crises on the community and how the crisis has affected their lives. The third study is the informal sector survey which covers 367 informal sector unit in the City of Yogyakarta. The survey was aimed at, among others, investigating how the crises affect the informal sectors and how they overcome the crises. 5. SUSENAS — The National Socio-Economic Survey is the main monitoring and targeting tool for many national programs. SUSENAS data is collected by BPS starting in 1976. It is a nationally representative household survey, covering all areas of the country. There are two types of SUSENAS: the Consumption Module and Core SUSENAS. The Consumption Module of SUSENAS is conducted every three years, specifically collecting information on very detailed consumption expenditures from around 65,000 households. The data from this survey is used for the official poverty statistics in Indonesia. Meanwhile, the core SUSENAS, which is conducted every year in the month of February, collects information on the characteristics of over 200,000 households and over 800,000 individuals. The sample of households in the Consumption Module of SUSENAS is a randomly selected subset of the 200,000 households in the Core SUSENAS sample of the same year. 6. 100 Village Survey — This survey was sponsored by UNICEF and carried out by BPS. As suggested by its name, the survey covered 100 villages, all of which are located in 10 districts spread across 8 provinces throughout the country. It collected data from 12,000 households in each round. Each village was divided into three enumeration areas. Forty households were chosen randomly from each enumeration area as a sample, so that the total sample number in each village is 120 households. The survey was originally meant to identify village level variables which were closely correlated with characteristics of the

The SMERU Research Institute
7
poor, so that it could be used as a tool to test whether the much larger SUSENAS was appropriate as a basis for calculating the poverty rate in Indonesia. The survey was first implemented in May 1994 and then repeated in May 1997. When the economic crisis struck Indonesia starting in mid 1997, during the first year of the crisis there was a lack of data on the social impact of the crisis. In order to overcome this, four rounds of the ‘100 Village Survey’ were implemented in a course of 14 months, respectively in August 1998, December 1999, May 1999, and October 1999. It was intended that the sample households would remain the same for all four rounds of the survey, however some replacements were made due to various reasons which were unavoidable. In the end, there were 10,640 households visited in all the four rounds of the survey and a complete panel data set was made. While the ‘100 Village Survey’ sample was relatively large, it was not designed as a statistically representation of the country overall. The survey areas were chosen before the 1994 crisis, based on a sampling approach which intended to include a range of villages that were ‘representative’ of various parts of the rural economy. Since the areas were chosen before the crisis, there is no reason to suspect that these samples were influenced by the crisis. Furthermore, the intention of this survey was to focus on rural and relatively poor areas, therefore it is not representative of all social stratas within the country. Therefore, the conclusions from this study can only be applied to this sample. 7. IFLS2+ (Indonesia Family Life Survey) — IFLS is a panel (longitudinal) survey of 7,500 households that is statistically representative of 13 provinces. The survey was done by RAND Corporation and the Lembaga Demografi at the University of Indonesia. The IFLS2+ revisited in August 1998, 2058 of those HH in 7 provinces. The IFLS2+ was the third time that IFLS was administered, which means we had a pre-crisis, representative baseline (re-interview rates in the last round were 92%) and the means to follow the panel throughout the crisis and recovery. The design covers both rural and urban areas. The survey collected data, among others, on coping strategies during the crisis; these include topics such as labor market, social capital, gender responses, geographical shifts, and poverty program accessibility. The household-level data collected in both IFLS2 and IFLS2+ include expenditures, assets, income and details of current work status of each household member; education enrollments, expenditures and school attendance; use of health care and family planning including prices and choice of provider; indicators of health status (both self-reported and measured by a trained health worker); migration; transfers among family members and transfers to and from community programs including such programs as the Padat Karya, school scholarship programs and the Kartu Sehat. Extensive data on prices, service availability and quality are collected at the community level, both from knowledgeable informants and through visits to schools and health facilities.

The SMERU Research Institute
8
III. Approaches and Targeting Practices during the Indonesian Social Safety Net
Programs4 3.1. A Brief Overview on Approaches to Targeting In general, as the accuracy of targeting increases, the benefits from targeting will also increase, but so will the associated costs.5 Hence, targeting should be carried out only as long as the benefits exceed the associated costs. This, however, is easier said than done. Often it is very difficult to quantify all the benefits and costs that are involved. In addition, there are many practical questions which need to be answered regarding the implementation of targeting. This section specifically deals with the question of what targeting mechanisms are available to reach the intended beneficiaries of a program. The intended beneficiaries of social safety net, social protection, or poverty reduction programs depend upon the objectives of the particular program. A food assistance program targets its benefits to those within the community who are having difficulties obtaining food out of their own resources. A health assistance program aims to provide free or subsidized medical benefits to those with health problems who are poor or who are unable to access medical services without outside assistance. Meanwhile, a public works program provides employment opportunities to either all of the currently unemployed or those among the unemployed who are poor. Normally, a public works program is not designed to encourage the poor who are already working to switch jobs. The strategy on how to reach these intended beneficiaries should be a central element of any program design. The targeting mechanism issue is also complicated by the fact that poverty is a very fluid condition, where people frequently move in and out of poverty as a result of various external factors. Many households, while not currently in poverty, recognize that they are vulnerable and that events — for example a bad harvest, a lost job, an unexpected expense, or an illness — could easily push them into poverty in the future. Therefore, targeting ‘transient’ or recent poverty may not provide a solution to the time-invariant ‘chronic’ poverty. In general there are two types of targeting mechanisms: administrative targeting and market-based targeting. In administrative targeting, the beneficiaries of a program are selected by the program implementers. Two approaches are commonly used in administrative targeting: geographic targeting and household or individual targeting. Geographic targeting simply means selecting particular regions or areas in which the benefits of a program will be distributed. The selection is usually based on a set of indicators, by which all regions are ranked from the most to the least eligible to be included in the program. Geographical targeting has its advantages and disadvantages. It is easy to implement and to monitor, typically involves less fraud and much lower administrative costs than other targeting mechanisms, and requires only limited information at the individual or household level. However, some benefits will inevitably
4 This chapter is derived heavily from Sumarto and Suryahadi (2001). 5 See Besley and Kanbur (1990).

The SMERU Research Institute
9
leak to the non-poor who reside in the targeted areas, while the poor who reside in non-target areas will not be covered.6 Household or individual targeting is basically an effort to identify households or individuals who are deemed eligible to receive the benefits of a program. The selection of households or individuals can be based on means testing or based on a set of indicators as in geographic targeting. Means testing is a method of selecting individuals or households based on whether they pass a certain predetermined threshold. The most commonly used threshold is a certain level of income. The problem with such ‘direct targeting’ is that screening to identify the poor is difficult and expensive. It requires extensive information gathering and verification on the part of government administration. These problems have led to a variety of schemes using indicator targeting or intervention on the basis of the particular characteristics of the poor (‘characteristic targeting’). This can be considered as a form of statistical discrimination where lack of detailed information leads program providers to use average characteristics to target intended beneficiaries. Examples of indicators or characteristics that are useful good predictors of income include, ownership of durable goods, number of children, gender, age, education level, land ownership, housing characteristics, or a combination of several of these indicators. Data on these characteristics are relatively easier to obtain than data on income. Therefore, the administrative costs of characteristic targeting are much lower than the cost of direct targeting. In addition, they are also difficult to manipulate in the short run, and hence have much lower level of leakage than direct targeting. Market-based targeting is also often referred to as ‘self-selection targeting’. With this targeting mechanism, a program is designed in such a way so that only those who really need assistance will choose to participate in the program. For example, a food security program can provide in-kind benefits of very low quality food, available to anybody who applies for it. The very low quality food is considered an inferior good, where demand decreases with rising income. Although theoretically every one can apply for the benefits, it is expected that only the poor will apply since such low quality food will not be acceptable or desirable to the non-poor. Similarly, in a public works program which provides a wage rate level below the prevailing market wage, it is expected that only those who are really in need will apply to join the program. Such a low level of wages discourages those who are already working from applying for the program and maintains the incentive to take up regular employment when it become available.7 This self-selection mechanism has certain advantages over administrative criteria: it allows individuals to choose to participate or not and is more flexible to unobserved household shocks than administrative criteria.8 6 Bigman and Fofack (2000). 7 See Ferreira et al. (1999). 8 See Sumarto et al. (2000).

The SMERU Research Institute
10
In practice, a program can use or apply a single targeting mechanism or a combination of two or more targeting mechanisms. For example, a combination of geographic and household targeting can be used to reach the poor.9 Initially, the government project staff may select those areas where the poor are most likely to be found. Obviously, poverty incidence is an important indicator that can be used as a guide in this selection of areas. Subsequently the government may choose those households which are deemed eligible to receive the program benefits using means testing or particular indicators or characteristics. Using means testing, a household is either included or not included in the program based on the information and the criteria selected to determine participation. In order to do this, a range of methods are available including measured poverty status, community-based identification, and household self-reporting status. Community-based identification allows communities to categorize households within their own community as poor or vulnerable. This method is simple and inexpensive and accuracy can be gained by the fact that poor households are a part of the local community and can be readily identified. However there are certain disadvantages with community-based identification: communities have a tendency to overstate the number of poor households, community rankings are relative to community measures so that such rankings might not be consistent at the aggregate level, and there is a need for some relatively skilled staffs to oversee this process. 3.2. Targeting Practices during the Indonesian Crisis To demonstrate the way targeting is conducted in practice, this section discusses the targeting that was used recently in the Indonesian Social Safety Net Program. Table 1 lists the various social safety net programs established by the Government of Indonesia to mitigate the social impact of the recent crisis. These programs were launched in early 1998, but many of them did not start until the second half of the year. These programs were intended to help protect the pre-crisis poor as well as the newly poor as a result of the crisis through a fourfold strategy: (i) ensuring the availability of food at affordable prices, (ii) supplementing purchasing power among poor households through employment creation, (iii) preserving the access of the poor to critical social services, particularly health and education, and (iv) sustaining local economic activity through regional block grant programs and the extension of small-scale credits.
9 Similarly, geographic targeting at the first stage can also be combined with self-selection or even with broad targeting at the second stage.

The SMERU Research Institute
11
Table 1. Areas and Major Programs of the Indonesian Social Safety Net Program
Area Program Description and Benefits Targeting FY 1998/99 FY 1999/00
Geographic
None None Food Security OPK program: sale of subsidized rice to targeted households. Eligible households can purchase 10-20 kg of rice at Rp. 1,000/kg (market price is Rp. 2,500 – 3,000/kg) Household BKKBN list BKKBN list with
flexibility Geographic Pre-crisis data Updated with regional
data Community Empowerment
PDM-DKE: a ‘community fund’ program that provides block grants directly to villages for either public works or revolving credit funds. Household
Local decision making Local decision making
Geographic None, various ministries
Urban areas, based on employment
Employment Creation
“Padat karya”: a loose, uncoordinated collection of several ‘labor intensive’ programs in various government departments. Household
Weak self selection Self selection
Geographic Old data on enrollment
Poverty data updated to 1998
Education Scholarships and block grants: providing § Scholarships of Rp. 10,000/month for elementary (SD)
students, Rp. 20,000/month for lower secondary (SLTP) students, and Rp. 30,000/month for upper secondary (SMU) students
§ Block grants to selected schools
Household School committees applying criteria
School committees applying criteria
Geographic BKKBN pre-prosperous rates
Pre-prosperous rates updated to 1999
Health
JPS-BK: a program providing subsidies for § Medical services § Operational support for health centers § Medicine and imported medical equipment § Family planning services § Nutrition (supplementary food) § Midwife services
Household BKKBN list BKKBN list with flexibility
The SMERU Research Institute
12
In general, the targeting for these programs was based on a combination of geographic and household targeting mechanisms, except for the subsidized rice program which used only household targeting. The targeting for some programs was based on a household classification created by the National Family Planning Coordinating Agency (BKKBN). The subsidized rice and the health programs explicitly used this BKKBN household classification for targeting. The selection of recipients in the scholarship program was also intended to take into account their BKKBN household status. Originally, eligible recipients for some JPS programs were only KPS – the lowest household welfare classification – card holders, but for certain programs, for example the OPK program, eligibility was extended to include KS I – the second lowest classification – households as well. The padat karya programs consisted of quite diverse programs and although specific programs were targeted to particular areas (such as drought areas), the lack of coordination meant that in effect there was little or no systematic geographic targeting of this set of programs. Within these labor ‘intensive’ programs, there were a variety of disagreements about the desired characteristics of intended participants but typically the beneficiaries were not chosen according to any fixed administrative criteria. Hence, to the extent that there was targeting, it was primarily through self-selection. Only those who were willing to work should have been able to receive the benefits. In the scholarship program, scholarship funds were at first allocated to schools so that “poorer” schools received proportionally more scholarships. In each school, the scholarships were then distributed to individual students by a school committee, which in theory consisted of the principal, a teacher representative, a student representative, the head of the parent association as the representative of community, and the village head. The selection of scholarship recipients was based on a combination of various administrative criteria, which included a number of factors, such as household data from school records, family BKKBN status, family size, and the likelihood of students dropping out of school.10 School students in all but the lowest three grades of primary school were officially eligible. In principle, students selected to receive the scholarships were supposed to be from the poorest backgrounds. As a guidance, scholarships were to be allocated at first to children from households in the two lowest BKKBN classifications. If there were more eligible students then the number of scholarships available, then additional indicators were to be used to identify the neediest students. These additional indicators included the distance from home to school, physical handicaps, and those children coming from large or single parent families. Also, a minimum of 50 percent of the scholarships, if at all possible, were to be allocated to girls.
In the health programs, meanwhile, the free medical and family planning services program was implemented by giving ‘health cards’ to eligible households. Eligibility was also based on BKKBN household status. A health card given to a household could be used by all members of the household to obtain free services from designated hospitals, clinics, and health care centers for all medical and family planning purposes, including pregnancy check-ups and child-birth services. 10 Extensive monitoring of the education program revealed, however, that the parent representative played only a minor role in validating the implementation of the criteria. Decisions were mainly taken by the school officials.
The SMERU Research Institute
13
IV. Local Monitoring in Indonesia: Experience from the BKKBN’s Monitoring
System The targeting for some social safety net (SSN) programs during the Indonesian crisis was based on a household classification created by the National Family Planning Coordinating Agency (BKKBN) because this was the only data available for individual targeting. Little is known publicly, however, how the BKKBN data is generated and how reliable it is in terms of its accuracy as a proxy of household welfare status. This is crucial as there have been some concerns over the reliability of the BKKBN data, both in terms of the way the data is being collected and its inability to capture shocks. Thus, this section discusses the mechanics and reliability of the BKKBN monitoring system. 4.1. Background and Data Gathering Mechanics of BKKBN11 Prior to 1970, family data in Indonesia had been scattered and had been recorded by different departments in the government depending on the departments’ needs. Furthermore, different recording procedures and standards had rendered efforts to combine the databases into a national database impossible. In late 1960s, as the government started to push for the National Family Planning Program (NFPP), it needed a database on Indonesian families that captures all the required information to implement and monitor the NFPP. So, it established BKKBN in 1970 as an agency that specifically deals with recording and monitoring of Indonesian families and, most importantly, puts the data into one database. Initially, BKKBN data consisted of monthly reports from public health centers that provide family planning services. These reports were sent to the BKKBN headquarter in Jakarta annually. Examples of such data are the number of users of contraceptive tools and their basic characteristics, the number of available health workers, and the amount of contraceptive tools supplies that each health centre has. In order to ensure data quality, BKKBN field supervisors were assigned at the kecamatan (subdistrict) level. By the third Five-Year Development Program (Pelita III, 1979-1984), all kecamatans already had a field supervisor. After an extended period of testing and modification to the recording and monitoring system, BKKBN officially began the first national family planning survey in 1985. Village elders conducted this survey at the neighborhood level, usually conducted in a three-month period. The survey had been conducted annually ever since. In 1994, BKKBN added to its survey two sections that consist of questions that measure family welfare and family demographic characteristics. The welfare section is used to target poor families and provide them with special assistance programs as the government began to recognize the extent of poor families in Indonesia and started to implement specific programs aimed at tackling poverty.
11 Information in this section is compiled from BKKBN publications listed in the references. Figures are also derived from these sources.

The SMERU Research Institute
14
At present, the BKKBN data consists of family planning data, family welfare data, demographic data, individual family member data, and data on family changes. The last two sections were added in 2001 and 2002 respectively. The family welfare section consists of a list of 23 indicators that would allow BKKBN to determine the welfare category a family. There are 5 welfare categories according to BKKBN, ranging from ‘Pre-Prosperous’ to ‘Prosperous 3 Plus’.12 Other institutions, both government and non-government, have used BKKBN data on family welfare as a targeting tool. Several examples include Family Savings Program (Takesra); Family Credit Program (Kukesra); National Foster Parents Movement (GN-OTA); medical assistance for the poor; and housing assistance for the poor. During the economic crisis in 1997, BKKBN data was used as a targeting tool for some specific crisis-mitigating programs that were part of the Social Safety Net (SSN) program. BKKBN data was chosen because, compared to the annual National Socioeconomic Survey (SUSENAS) conducted by the Indonesian Statistical Agency (BPS), it covers more households, its enumeration is conducted by locals, and it has more specific indicators to determine whether a household is considered poor or not. More importantly, BKKBN data actually collects data on all households in contrast to SUSENAS that uses sample households. 4.2. BKKBN Classification Indicators There are 23 indicators used by BKKBN to categorize welfare status of Indonesian families. These indicators are:
1. Family members are able to adhere to the religious principles of the religion of their choice.
2. All family members are able to eat at least twice a day. 3. All family members have different sets of clothing for home, work, schools,
and visits. 4. The largest portion of the household floor is not made of dirt. 5. The family is able to obtain modern medicines or family planning services
when a child is sick. 6. The family is able to follow religious laws and customs. 7. At least once a week, the family is able to consume meat, fish, or chicken. 8. Each family member obtains at least one new pair of clothing each year. 9. There is at least eight square meters of household space for each occupant in the
house. 10. All family members have been healthy within the last three months. 11. At least one family member older than 15 years of age has a fixed income. 12. All family members between 10 and 60 years of age can read and write. 13. All children between 7 and 15 years of age are enrolled in school. 14. If the family has two or more living children and is still in the reproductive age
group, the family uses contraceptives. 15. The family has the ability to improve its religious knowledge. 16. The family is able to save part of its earnings.
12 The indicators and the categories are listed in the next section.
The SMERU Research Institute
15
17. The family is able to eat with able members together at least once per day and that opportunity is used for communication among family members.
18. The family normally takes part in local community activities. 19. The family undertakes recreational activities outside the home at least once
every six months. 20. The family is able to obtain news from newspapers, radio, television, or
magazines. 21. Family members are able to use local transportation facilities. 22. The family makes regular contributions in the form of money or goods in social
activities. 23. At least one family member is active in managing a local institution.
A family is classified as:
• KPS (keluarga pra-sejahtera or ‘pre-prosperous family’) if it fails to meet all of the indicators 1 to 5.
• KS1 (keluarga sejahtera 1 or ‘just prosperous family’) if it meets all of the indicators 1 to 5.
• KS2 (keluarga sejahtera 2 or ‘prosperous 2 family’) if it meets all of the indicators 1 to 14.
• KS3 (keluarga sejahtera 3 or ‘prosperous 3 family’) if it meets all of the indicators between 1 and 21.
• KS3 Plus ((keluarga sejahtera 3 plus or ‘prosperous 3 plus family’) if it meets all of the indicators.
During the early inception of BKKBN family indicators, there was a criticism that some families were categorized as pre-prosperous or poor solely due to non-economic reason, such as failing to meet the indicator 1. This can have adverse implication if the category is used for program targeting as these families may actually need no benefits from the program. To address this criticism, the classification scheme was revised by adding two additional categories of families, focusing only on particular economic criteria. These two additional classifications are referred to as KPS ALEK (Keluarga Pra-sejahtera Alasan Ekonomi or ‘Pre-prosperous family based on economic reasons’) and KS1 ALEK respectively. A family will be classified as KPS ALEK if it fails to meet any of the indicators 2 to 5. Meanwhile, a family will be classified as KS1 ALEK if it fails to meet the indicator 7. Therefore, KPS ALEK families are a subset of KPS families and similarly KS1 ALEK families are a subset of KS1 families. 4.3. BKKBN Data Gathering Mechanism At the household level, the data collection is implemented by neighborhood family planning cadres. Figure 1 shows the process of BKKBN data collection. The preparation level includes village-level meetings and training for enumerators. The meetings are necessary to determine budget and timetable for the survey and to coordinate the data collection across neighborhoods. The BKKBN headquarter allocates funds to each kabupaten, and since the decentralization more and more provinces allocate additional funds in order to provide supporting facilities such as computers and to increase remuneration for the enumerators. This stage of preparation lasts between two weeks and

The SMERU Research Institute
16
one month. Training for enumerators usually lasts between two to three days and is conducted at the village level. The training comprises of training in filling out forms and the importance of acquiring real data.
Figure 1. BKKBN Data Collection Mechanism After the preparation stage is completed, data collection stage takes about three months to accomplish. At the neighborhood level, data is collected house to house by local cadres, such as teachers, youth groups, and Family Planning (FP) cadres, taking advantage of local knowledge and local monitoring. In addition, the enumerators are assisted by family planning field workers in each village and monitored by PPLKB (Kecamatan–level field supervisors). In 2000, close to a total of one million PPKBD, sub-PPKBD, and cadre groups conducted the survey, assisted by about 35 thousand PLKB and PKB.13 The result is individual-level data of each household and a very detailed neighborhood map, which is developed by PPKBD or sub-PPKBD along with community cadres. The map consists of the location every household in the neighborhood, the characteristics of each household — their welfare category, their family planning status, demographic characteristics — and available infrastructure in the neighborhood. Prior to 2001, data reporting was conducted manually by filling recapitulation forms. Data reporting from neighborhood level up to Jakarta is as follows. Data from the neighborhood level is sent to the village level, where it is combined into village level data and then collected at the kecamatan level. After that, each kecamatan sends the data to the kabupaten (district). At the kabupaten level, the data is further checked and combined before being sent to the provincial level. Also, each kabupaten keeps a record of the data 13 PPKBD (Pembantu Pembina KB Desa) is Village Family Planning Assistant Supervisor; PLKB (Petugas Lapangan KB) is Family Planning Field Worker; PKB (Penyuluh KB) is Family Planning Extension Officer; PPLKB (Penyelia PLKB) is PLKB Supervisor.
Preparation Data collection Mapping
Stakeholder meeting
Reporting
Analysis
Evaluation
Supporting programs

The SMERU Research Institute
17
and distributes it back to the kecamatans, villages, and NGO partners at the kabupaten. At the provincial level, BKKBN receives data from kabupaten and sends province-level data to the BKKBN headquarter in Jakarta within one week of receiving data. In addition, it also processes the data and conduct preliminary analysis and disseminates the data back to kabupatens and partners at the provincial level. Similar activity takes place at the BKKBN headquarter in Jakarta. It took about 5 months in order to send data from the enumerators in each neighborhood to the BKKBN headquarter in Jakarta. Starting in 2001, survey results are scanned into computers at the village level in order to expedite subsequent checking and reporting process. Also, since computerization takes place, surveys in subsequent years only records changes in the households instead of redoing the whole survey from zero. Figure 2 shows the data collection and reporting flow. From figure 2 one can see that since 2001 the role of cadres is increasingly more important as the data they gather is scanned directly at the village level and then is sent straight to the BKKBN headquarter in Jakarta.
After finished mapping the survey results, there is a stakeholder meeting at the village level attended by neighborhood leaders, village elders, village-level government officials, and NGOs. This meeting records the data on poor people and discusses the necessary actions needed in order to help the poor using specific poverty alleviation programs. Similar meetings are also held at each level of government up to the provincial level. At the central level, BKKBN, other governmental departments, and NGOs also analyze the data. The data is used as a targeting tool for programs undertaken by the central government and also as data source by NGOs and research institutions, both local and international, in conducting related research. After the process is completed, the final step is to conduct evaluation on the whole process.

The SMERU Research Institute
18
4.4. Strengths and Weaknesses of BKKBN data There are two most apparent strengths of BKKBN data: [1] it is the only available micro data that collects information down to each household in each neighborhood in Indonesia. As of 2002 (the 2003 survey is still being processed), the BKKBN Family Database has data on 197.5 million individuals, making it the most comprehensive database on individuals in Indonesia, albeit only collecting basic information; and [2] it is collected by locals. Local people know the condition of other people in their own neighborhood, which ensures the comprehensiveness of data.14 This is the advantage of local monitoring. However, there are several weaknesses of BKKBN data: [1] the sheer amount of data collected makes mistakes unavoidable, even with the computerization in 2001; [2] the high variation in the ability of the enumerators could affect the quality of data and consistency across regions; [3] since locals collect the data, subjectivity could play a significant role in the data; [4] the data does not capture transitory shocks to income as it is based on relatively fixed asset; [5] the highly subjective non-economic criteria are questionable, for example the capacity of families to meet religious obligations; [6] the composition of the list is susceptible to changes by local government officials;15 and [7] it suffers from lack of funding, as is typically the case with government programs.16 4.5. Comparison with Consumption-Based Measures of Poverty To assess how well the BKKBN classification matches the consumption-based measured of household welfare, we perform two levels of comparison: at the regional (district) level and at the household level. At the district level we calculate the district rank correlation of the BKKBN measures with SMERU poverty mapping results. Meanwhile, at the household level we cross tabulates the two classifications using the 20th consumption percentile as the poverty line. 4.5.1. Regional Comparison To evaluate how well the BKKBN classification matches the consumption based poor/non-poor areas at the district level, we calculate the district rank correlation of the BKKBN measures with the poverty mapping results based on SMERU poverty mapping results. This new method tried to combine the advantage of detailed information on household characteristics obtained from a household survey (SUSENAS) with the complete coverage of a population census to estimate welfare indicators for small administrative areas. First, we estimate a model of per capita consumption expenditure as a function of variables that are available in both the household survey (SUSENAS) and the population survey. Second, the resulting parameters from the first stage procedure are then used in a simulation to predict per capita consumption for each household in the census. Third, household level measures of poverty and inequality are then calculated and aggregated for small areas
14 This might be less so in urban areas. 15 See Sumarto et al. (2000). 16 Currently, remuneration for the cadres is Rp. 150,000 (around US$ 17.65) for one village, independent of the size of the village and the number of cadres participating in the survey.
The SMERU Research Institute
19
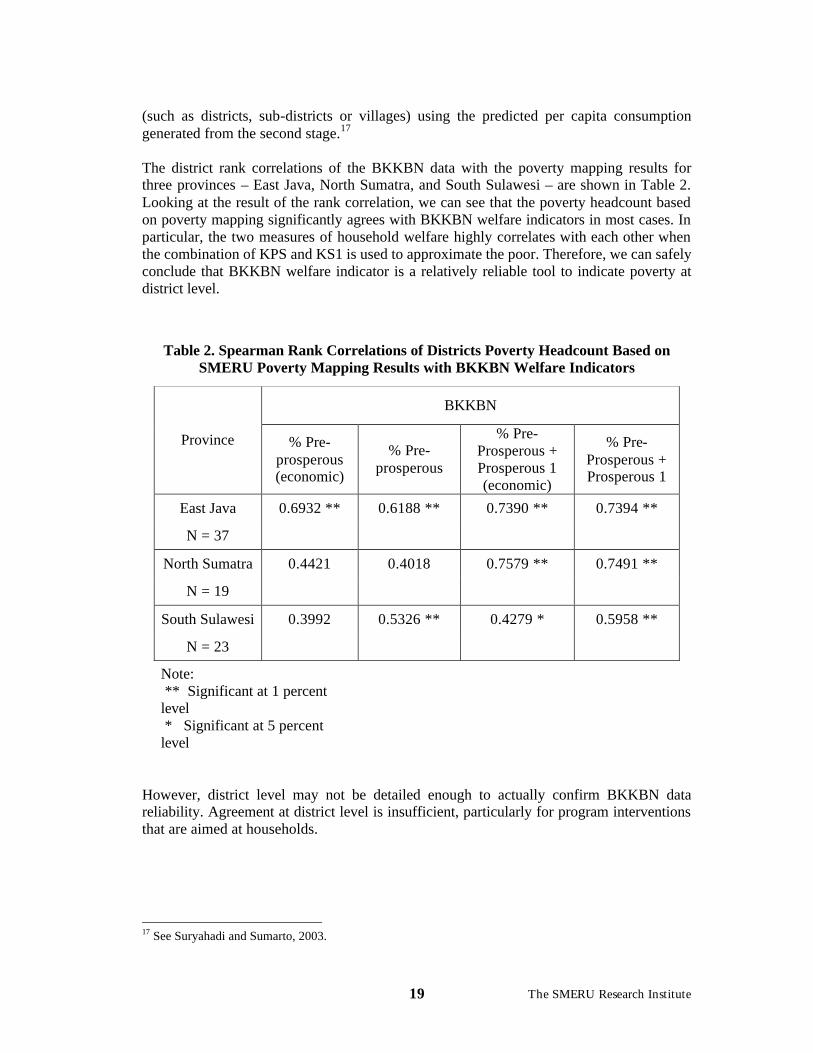
(such as districts, sub-districts or villages) using the predicted per capita consumption generated from the second stage.17 The district rank correlations of the BKKBN data with the poverty mapping results for three provinces – East Java, North Sumatra, and South Sulawesi – are shown in Table 2. Looking at the result of the rank correlation, we can see that the poverty headcount based on poverty mapping significantly agrees with BKKBN welfare indicators in most cases. In particular, the two measures of household welfare highly correlates with each other when the combination of KPS and KS1 is used to approximate the poor. Therefore, we can safely conclude that BKKBN welfare indicator is a relatively reliable tool to indicate poverty at district level.
Table 2. Spearman Rank Correlations of Districts Poverty Headcount Based on SMERU Poverty Mapping Results with BKKBN Welfare Indicators
BKKBN
Province % Pre-prosperous (economic)
% Pre-prosperous
% Pre-Prosperous + Prosperous 1 (economic)
% Pre-Prosperous + Prosperous 1
East Java 0.6932 ** 0.6188 ** 0.7390 ** 0.7394 **
N = 37
North Sumatra 0.4421 0.4018 0.7579 ** 0.7491 **
N = 19
South Sulawesi 0.3992 0.5326 ** 0.4279 * 0.5958 **
N = 23
Note: ** Significant at 1 percent level * Significant at 5 percent level
However, district level may not be detailed enough to actually confirm BKKBN data reliability. Agreement at district level is insufficient, particularly for program interventions that are aimed at households.
17 See Suryahadi and Sumarto, 2003.

The SMERU Research Institute
20
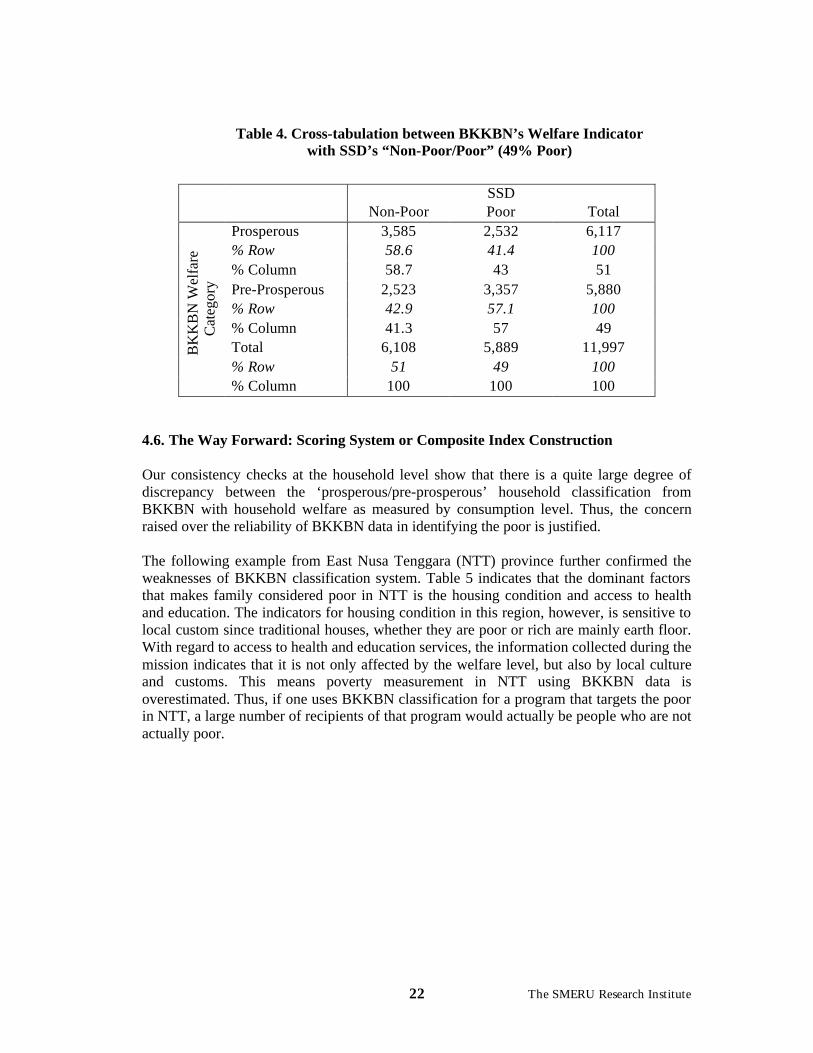
4.5.2. Household Level Comparison To examine how well the BKKBN household (prosperous/pre-prosperous) classification matches the consumption-based measures of poverty (non-poor/poor) classification, we perform a simple cross-tab using data from the 100 Village Survey (SSD). The SSD covered 100 villages located in 10 kabupaten spread across 8 provinces. The SSD surveyed 120 households in each of the 100 villages in each round of the survey, making a total sample size of 12,000 households. The December 1998 round of SSD has a question on respondent’s classification based on BKKBN welfare criteria. Therefore, the sample can be divided into poor and non-poor households by two criteria: consumption expenditures per capita or the BKKBN welfare status.18 In the first exercise, we use the 20th percentile of households ranked by nominal expenditures per capita in each district is used as the dividing line between the poor and the non-poor. This poverty line is admittedly drawn arbitrarily, but it has three advantages. First, we do not have sufficiently detailed consumption expenditure or particularly price data to re-estimate a poverty line for each district. But a reasonable estimate of the national incidence of poverty rate in this period is around 20 percent.19 Second, just using a quintile makes our results on program participation consistent with a large and growing literature on benefit incidence, which typically uses not poverty rates, but income or consumption expenditure quintiles. Third, we do not attempt to capture differences in poverty across districts in the sample. For this we would have to convert nominal expenditures into ‘real’ expenditures that take into account regional price variations. The required price data to do this exercise well and actually make reliable cross district comparisons of poverty do not presently exist. So in this case we focus only on the within district comparison, but we do not even attempt to treat the question of whether a district is a relatively poor district across districts. Table 3 cross-tabulates the two classifications using the 20th consumption percentile as the poverty line. The table shows that while only 15 percent of the ‘prosperous’ households are poor, 75 percent of the ‘pre-prosperous’ households are non-poor. On the other hand, 46 percent of the non-poor households are ‘pre-prosperous’ and 38 percent of the poor households are ‘prosperous’. This implies the two criteria, expenditures and BKKBN, do not match well at all. To reduce the possibility that this ‘mismatch’ is caused by the poverty line which is “too low”, the level of poverty line is raised to match the proportion of ‘pre-prosperous’ households in the sample, which is 49 percent. The results of cross tabulation between this new ‘non-poor/poor’ classification with the ‘prosperous/pre-prosperous’ classification are presented in Table 4. Now there are 41 percent of the ‘prosperous’ households which are poor, 43 percent of the ‘pre-prosperous’ households which are non-poor, 41 percent of the non-poor households which are ‘pre-prosperous’ and 43 percent of the poor households which are ‘prosperous’.
18 In this sample, there are 49 percent ‘pre-prosperous’ households. 19 See Suryahadi and Sumarto (1999).

The SMERU Research Institute
21
Both Tables 3 and 4 therefore consistently show that there is a quite large degree of mismatch between the ‘prosperous/pre-prosperous’ household classification from BKKBN with household welfare as measured by consumption level. Unfortunately, when the two classifications disagree, it is impossible to say which is a ‘mistake’ from a targeting point of view. On the one hand, many feel that by being based on relatively permanent characteristics (e.g. type of floor) and including non-economic criteria (e.g. whether families are able to fulfill their religious obligations), the BKKBN indicator is not a valid poverty indicator and especially will not capture current poverty status and hence households which are newly poor due to the crisis. On the other hand, consumption expenditures are difficult to measure accurately and it could be that ‘consumption poor’ households are the results of measurement error in expenditures.
Table 3. Cross-tabulation between BKKBN’s Welfare Indicator with SSD’s “Non-Poor/Poor” (20% Poor)
SSD
Non-Poor Poor Total Prosperous 5,197 920 6,117
% Row 85 15 100 % Column 54.2 38.3 51
Pre-Prosperous 4,400 1,480 5,880
% Row 74.8 25.2 100 % Column 45.9 61.7 49
Total 9,597 2,400 11,997 % Row 80 20 100
B
KK
BN
Wel
fare
C
ateg
ory
% Column 100 100 100
The SMERU Research Institute
22
Table 4. Cross-tabulation between BKKBN’s Welfare Indicator with SSD’s “Non-Poor/Poor” (49% Poor)
SSD Non-Poor Poor Total
Prosperous 3,585 2,532 6,117 % Row 58.6 41.4 100 % Column 58.7 43 51 Pre-Prosperous 2,523 3,357 5,880 % Row 42.9 57.1 100 % Column 41.3 57 49 Total 6,108 5,889 11,997 % Row 51 49 100
BK
KB
N W
elfa
re
Cat
egor
y
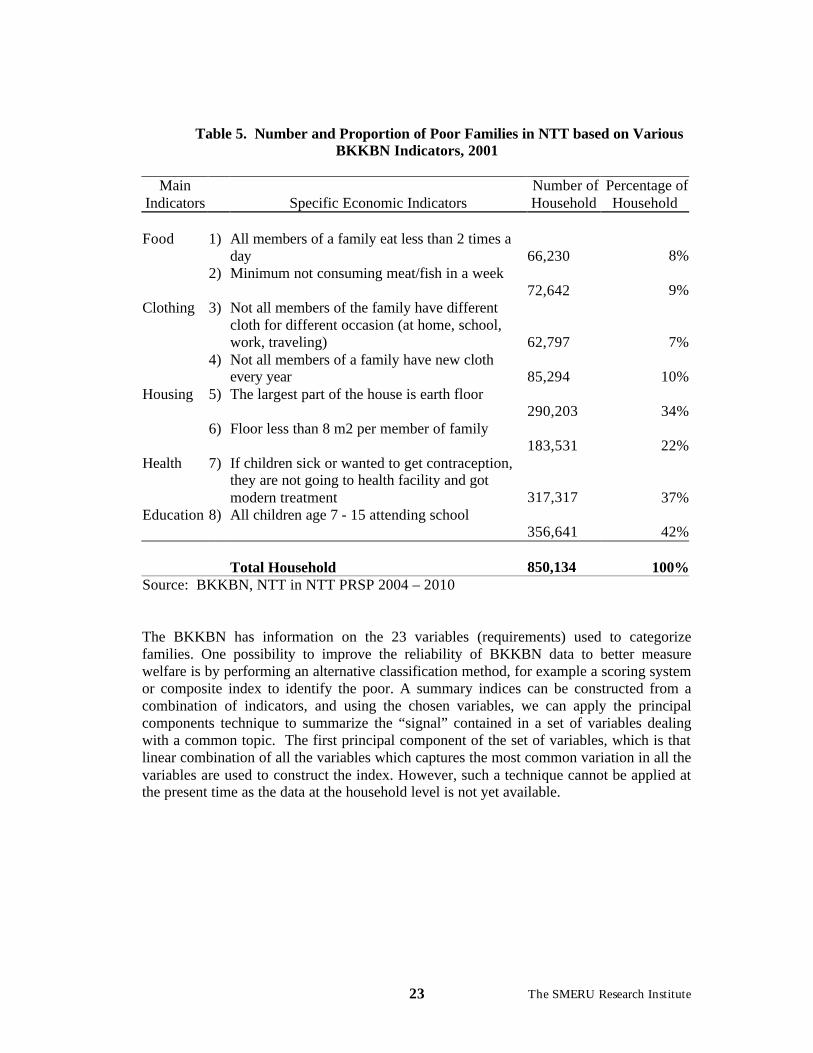
% Column 100 100 100 4.6. The Way Forward: Scoring System or Composite Index Construction Our consistency checks at the household level show that there is a quite large degree of discrepancy between the ‘prosperous/pre-prosperous’ household classification from BKKBN with household welfare as measured by consumption level. Thus, the concern raised over the reliability of BKKBN data in identifying the poor is justified. The following example from East Nusa Tenggara (NTT) province further confirmed the weaknesses of BKKBN classification system. Table 5 indicates that the dominant factors that makes family considered poor in NTT is the housing condition and access to health and education. The indicators for housing condition in this region, however, is sensitive to local custom since traditional houses, whether they are poor or rich are mainly earth floor. With regard to access to health and education services, the information collected during the mission indicates that it is not only affected by the welfare level, but also by local culture and customs. This means poverty measurement in NTT using BKKBN data is overestimated. Thus, if one uses BKKBN classification for a program that targets the poor in NTT, a large number of recipients of that program would actually be people who are not actually poor.
The SMERU Research Institute
23
Table 5. Number and Proportion of Poor Families in NTT based on Various
BKKBN Indicators, 2001
Main Indicators Specific Economic Indicators
Number of Household
Percentage of Household
Food 1) All members of a family eat less than 2 times a
day 66,230 8%
2) Minimum not consuming meat/fish in a week 72,642 9%
Clothing 3) Not all members of the family have different cloth for different occasion (at home, school, work, traveling)
62,797 7%
4) Not all members of a family have new cloth every year
85,294 10%
Housing 5) The largest part of the house is earth floor 290,203 34%
6) Floor less than 8 m2 per member of family 183,531 22%
Health 7) If children sick or wanted to get contraception, they are not going to health facility and got modern treatment
317,317 37%
Education 8) All children age 7 - 15 attending school 356,641 42%
Total Household 850,134 100%
Source: BKKBN, NTT in NTT PRSP 2004 – 2010 The BKKBN has information on the 23 variables (requirements) used to categorize families. One possibility to improve the reliability of BKKBN data to better measure welfare is by performing an alternative classification method, for example a scoring system or composite index to identify the poor. A summary indices can be constructed from a combination of indicators, and using the chosen variables, we can apply the principal components technique to summarize the “signal” contained in a set of variables dealing with a common topic. The first principal component of the set of variables, which is that linear combination of all the variables which captures the most common variation in all the variables are used to construct the index. However, such a technique cannot be applied at the present time as the data at the household level is not yet available.

The SMERU Research Institute
24
V. Concluding Remarks We have discussed briefly that targeting is very important but it is not nearly as easy as is often suggested. Besides administrative costs, targeting also entails additional costs, including disincentive costs, stigma costs, and political economy costs. Therefore, it is possible that targeted intervention is more costly than universal intervention. Targeting is only considered beneficial when the benefits outweigh the costs. We have also shown how targeting practice was applied to Indonesia. The Indonesian social safety net programs were intended to protect both the traditionally poor and the newly poor who were unable to cope with impact of the crisis without external assistance. In general, the targeting for these programs was based on a combination of geographic and household targeting mechanisms, except for the subsidized rice program which used only household targeting. We have also shown that there are several community-based monitoring systems in Indonesia during the crisis. Out of those systems, one of the most widely used ones is the BKKBN monitoring system. It was originally created in order to monitor the implementation of national family planning program. In 1994, a special section that monitors family welfare was added as the government intensified its effort to reduce poverty. BKKBN monitoring system was used as the targeting tools for programs that were aimed to mitigate the impact of the economic crisis that swept Indonesia in 1997. There are several reasons why BKKBN was used. First, contrary to the annual National Socioeconomic Survey (SUSENAS) conducted by the Indonesian Statistical Agency (BPS), the BKKBN data covers more households, its data collection is conducted by locals, and it has more specific indicators to determine whether a household is poor or not. Second, BKKBN data actually collect data on each household in contrast to SUSENAS that uses sample households. Unfortunately, there are several weaknesses of BKKBN that has been uncovered by studies over the years. Two of the most glaring weaknesses, especially since it was used as the targeting tool for crisis programs, are the fact that it does not capture transitory shocks to income as the indicator is based on relatively fixed asset and the highly subjective non-economic criteria. To analyze this, we conduct two comparisons between BKKBN and consumption-based measures of poverty. The first comparison is at district level, and the result shows that BKKBN data to a large extent agrees with district-based poverty headcount. The second comparison is at household level, and in contrast to the first comparison, the result here shows that there is quite a large discrepancy between BKKBN and consumption-based measure of poverty taken from SSD. In order to remedy this discrepancy, a new scoring system or composite index to evaluate the results of BKKBN survey need to be explored.

The SMERU Research Institute
25
References
Badan Koordinasi Keluarga Berencana Nasional. 2003. Menyusuri Liku-liku Pendataan Keluarga: Apa dan Bagaimana?. BKKBN: Jakarta.
Badan Koordinasi Keluarga Berencana Nasional. 2003. “Pendataan Keluarga dan Peranannya Dalam Era Desentralisasi.” BKKBN: Jakarta.
Besley, Timothy and Ravi Kanbur (1990), The Principals of Targeting, Policy Research and External Affairs Working Paper Series No. 385, The World Bank, Washington, DC.
Bigman, David and Hippolyte Fofack (2000), ‘Geographical Targeting for Poverty Alleviation: An Introduction to the Special Issues’, The World Bank Economic Review, 14(1), pp. 129-145.
Ferreira, Francisco, Giovanna Prennushi, and Martin Ravallion (1999), Protecting the Poor from Macroeconomic Shocks: An Agenda for Action in a Crisis and Beyond, World Bank, Washington, DC, mimeo.
Grosh, Margaret E. (1994), Adminstering Targeted Social Programs in Latin America, The World Bank, Washington, D.C.
Hoddinott, John (1999), Targeting: Principles and Practice, Technical Guide No. 9, International Food Policy Research Institute, Washington, D.C.
Noerdin, Mazwar, Wandri Muchtar, and Freddy Aritonang. 2003. Family Enumeration as Micro-Data Source in Indonesia and its Development. Technical Report Series Monograph no. 105. BKKBN: Jakarta.
Noerdin, Mazwar. 2004. “Apa dan Bagaimana Pendataan Keluarga”. Paper presented at the Pertemuan Sosialisasi Pendayagunaan Hasil Pendataan Keluarga, 20 April 2004. Jakarta.
Pritchett, Lant, and Sudarno Sumarto (2001), Safety Nets in Trouble Times: Lessons from Indonesia’s Crisis, Syndicated Publications, Harvard University.
Subbarao, K., Aniruddha Bonnerjee, Jeanine Braithwaite, Soniya Carvalho, Kene Ezemenari, Carol Graham, Alan Thompson (1997), Safety Net Programs and Poverty Reduction: Lessons from Cross-Country Experience, Directions in Development, The World Bank, Washington, D.C.
Sumarto, Sudarno, Asep Suryahadi, and Lant Pritchett (2000), Safety Nets and Safety Ropes: Who Benefited from Two Indonesian Crisis Programsthe “Poor” or the “Shocked?”, Policy Research Working Paper No. 2436, September, The World Bank, Washington, DC.
Sumarto, Sudarno, Asep Suryahadi, and Wenefrida Widyanti (2001), Designs and Implementation of the Indonesian Social Safety Net Programs: Evidence from the JPS Module in the1999 SUSENAS, SMERU Working Paper, March, The SMERU Research Institute, Jakarta.
Suryahadi, Asep, Yusuf Suharso, and Sudarno Sumarto (1999), Coverage and Targeting in the Indonesian Social Safety Net Programs: Evidence from 100 Village Survey, SMERU Working Paper, August, Social Monitoring & Early Response Unit, Jakarta.

The SMERU Research Institute
26
Tim Dampak Krisis SMERU (2000), Laporan Perkembangan Pelaksanaan Program Operasi Pasar Khusus (OPK): Januari 1999 – Maret 2000, Laporan Khusus SMERU, April, Social Monitoring & Early Response Unit, Jakarta.
van de Walle, Dominique (1998), ‘Targeting Revisited’, The World Bank Research Observer, 13(2), pp. 231-248.
Wahab, Abdul Aziz. 2004 “Pengembangan dan Pemanfaatan Database Keluarga dan SIDUGA untuk Pembangunan di Daerah.” Paper presented at the Pertemuan Sosialisasi Pendayagunaan Hasil Pendataan Keluarga, 20 April 2004. Jakarta.