local livestock market analysis - city of greater geelong · local livestock market analysis ......
TRANSCRIPT

| L O C A L L I V E S T O C K M A R K E T A N A L Y S I S
Local Livestock Market
Analysis
GEELONG SALEYARDS
CITY OF GREATER GEELONG MARCH 2017

Authors
Matt Dalgleish
Andrew Whitelaw
Robert Herrmann
Olivia Agar
© Copyright, Ag Concepts Advisory, March 2017
This work is copyright. Apart from any use as permitted under Copyright Act 1963, no part may be reproduced without written permission of Ag
Concepts Advisory.
Disclaimer
Neither Ag Concepts nor any member or employee of Ag Concepts Advisory. takes responsibility in any way whatsoever to any person or
organisation (other than that for which this report has been prepared) in respect of the information set out in this report, including any errors or
omissions therein. In the course of our preparation of this report, projections have been prepared on the basis of assumptions and methodology
which have been described in the report. It is possible that some of the assumptions underlying the projections may change. Nevertheless, the
professional judgement of the members and employees of Ag Concepts Advisory. have been applied in making these assumptions, such that they
constitute an understandable basis for estimates and projections. Beyond this, to the extent that the assumptions do not materialise, the estimates
and projections of achievable results may vary.

1 | L O C A L L I V E S T O C K M A R K E T A N A L Y S I S
Contents Executive Summary ................................................................................................................................. 3
Consultants Overview ............................................................................................................................. 5
Employees ........................................................................................................................................... 6
Project Overview ..................................................................................................................................... 7
Project Objectives ............................................................................................................................... 7
Project Scope ...................................................................................................................................... 7
Methodology ....................................................................................................................................... 8
Report Structure ................................................................................................................................. 9
Background ........................................................................................................................................... 10
Geelong Region ................................................................................................................................. 10
Historical Context .............................................................................................................................. 11
Economic Context ............................................................................................................................. 12
Regional Industry Changes ................................................................................................................ 14
Overview of Issues ............................................................................................................................ 16
The Geelong Saleyards .......................................................................................................................... 17
Site .................................................................................................................................................... 17
Infrastructure .................................................................................................................................... 19
Heritage & Social Value ..................................................................................................................... 19
Financial performance and outlook .................................................................................................. 20
Income .......................................................................................................................................... 21
Expenditure ................................................................................................................................... 22
Saleyard Operations .......................................................................................................................... 23
Livestock Buyers ............................................................................................................................ 23
Livestock Agents ............................................................................................................................ 23
Other Saleyards ............................................................................................................................. 24
Livestock market ................................................................................................................................... 26
Current Market ................................................................................................................................. 26
Local Stock Data ............................................................................................................................ 26
Saleyard Competition .................................................................................................................... 28
“The Fight for Acres” ..................................................................................................................... 29
Other Sale Methods ...................................................................................................................... 30
Market Trends ................................................................................................................................... 32
Local and State Stock Trends ........................................................................................................ 32
Saleyard Comparison .................................................................................................................... 33

2 | L O C A L L I V E S T O C K M A R K E T A N A L Y S I S
Livestock Sale Methods ................................................................................................................. 40
Vision and Objectives for Local Livestock Market ................................................................................ 42
Requirements to Service Small or Part-time Farmers ...................................................................... 42
Future Requirements for Providing Livestock Trading Facility ......................................................... 42
Optimal Livestock Facility ................................................................................................................. 43
Options for Sale Facility for Geelong Region ........................................................................................ 44
Co-operative Operated Saleyards ..................................................................................................... 44
Transit Stock Hub .............................................................................................................................. 44
Direct Sales ........................................................................................................................................ 44
Private Equity Purchase/Development of Sale Facility ..................................................................... 45
Existing Colac Saleyards .................................................................................................................... 45
On-line Sales ..................................................................................................................................... 45
Peri-urban Exchange ......................................................................................................................... 46
Conclusion ............................................................................................................................................. 49
Consultations List .................................................................................................................................. 50
References ............................................................................................................................................ 51
Appendix ............................................................................................................................................... 52

3 | L O C A L L I V E S T O C K M A R K E T A N A L Y S I S
Executive Summary
This report has been commissioned by The City of Greater Geelong to gather information to assist
the council develop its strategic priorities in relation to the existing saleyards.
The gathering of data relating to the current situation, as well future livestock trends in the G21
region forms the basis of this report. Importantly, the consideration of the local demographic,
including the knowledge and understanding of a range of stakeholders, along with a clear vision of
the current situation.
Each saleyard has a unique dynamic, and the catchment area of the Geelong saleyards has specific
requirements that relate solely to its demographic.
The lack of investment in the ongoing maintenance of the saleyard is also considered; for better or
for worse, little has been invested in upkeep over recent years. Along with the location of the
existing saleyards, the decision of future ongoing investment is urgently needed.
A rational look at livestock sales facilities needed in this environment identifies that a “fit-for-
purpose” livestock exchange for the G21 region requires a very different model from the traditional
saleyard.
The City of Greater Geelong saleyards has a rich and long history of providing livestock selling
services to the community for over 150 years.
The current challenges facing the saleyard are not unique to Geelong. Questions of financial viability,
the need for ongoing investment, OH&S challenges and surrounding urban development are issues
that saleyards across Victoria have or are facing to various degrees.
The general response to these challenges across Victoria has been to see the private equity funding
of large regional saleyards replacing the smaller council run yards. Investors have been prepared to
build state-of-the-art saleyards with the intention of capturing significant market share to provide
expected returns on funds invested.
This development has resulted in the closure of many regional saleyards, and the pressure to
maintain stock numbers intensify on those small yards still operating. This ongoing challenge to
throughput will mean more yards are decommissioned in coming years.
While the response of many councils has been to close their yards as the large regional centres gain
momentum; the Geelong region has a somewhat unique challenge. There is an ongoing need to
provide livestock selling services to the peri-urban farmers who have evolved as a result of the
breakup of larger properties, especially evident in the Bellarine and Surf Coast areas.
To address the future of the City of Geelong saleyard, as well as the peri-urban producer’s livestock
sales requirements, an assessment of the future requirements for saleyards in the G21 region is
imperative.
In the research applied to this report, a number of key themes have been identified:
1. Livestock numbers in Victoria have declined. Across Victoria they are stagnant at best, with
the challenge from other broad acre farming options, as well as continued urbanisation in
the G21 region likely to maintain downward pressure on livestock numbers.

4 | L O C A L L I V E S T O C K M A R K E T A N A L Y S I S
2. Rationalisation of saleyards in Victoria is ongoing. Other selling options are rapidly emerging.
These options are providing a compelling case attracting sellers away from the small
saleyards. This challenge has a lot further to go with new regional sale yards approved and
on-line sales gaining support.
3. Profitability in saleyards is directly correlated with throughput. Achieving profitability under
the existing saleyard model in small local saleyards will be extremely difficult. Ongoing
competition for numbers from emerging competing interests will make the probability of
any increase in numbers unlikely.
4. The size of farm businesses in the Geelong region has reduced. Livestock sales facilities
needed in this environment of “peri-urban” farming is very different from the traditional
model. The peri-urban factor in relation to the expectation that the City of Greater Geelong
provide a livestock exchange is significant, and quite specific to the G 21 region. These
smaller lifestyle farmers have a need, and to some extent an expectation, that a livestock
exchange is provided. This report accepts this; however, the report does not agree that the
existing facility is the most suitable to meet this need. While it may be modified to suit the
future requirement, investigation is needed to identify the most suitable livestock exchange
facility for the future.
This report identifies the need for further investigation into the provision of a “fit-for-purpose”
livestock exchange, that may provide additional emerging services that suit the peri-urban farmer’s
needs. To identify the most appropriate model, analysis should be conducted into the following
options:
a) Facilitation of the forming of a co-operative to manage and run a livestock exchange.
b) Upgrade of the existing Colac Saleyards to provide the required services.
c) On-line sales options that can meet these needs.
d) A Peri-Urban Livestock Exchange, either at the existing saleyards site or a “green fields” site
located in the G21 region to provide bespoke livestock services including a livestock
exchange.

5 | L O C A L L I V E S T O C K M A R K E T A N A L Y S I S
Consultants Overview Ag Concepts Advisory P/L
Ag Concepts Advisory (A Ruralco Business) is an independent, specialist Agricultural strategy and
marketing advisory business.
The company was established by Robert Herrmann in Adelaide in 1996. With a strong background in
agriculture, Robert’s commitment was to deliver a high quality pro-active risk analysis and
management service to clients. The formation of Ag Concepts Advisory (ACA) was in response to the
changing landscape of the wool industry post the Reserve Price Scheme and has since expanded into
the areas of livestock and grain price risk management.
The independence of ACA allows it to seek the best outcome for its clients. ACA has vigorously
protected this independence, which has become a valuable asset for its clients.
Ag Concepts is recognised throughout the Australian rural sector for innovative thinking, thought
leadership and the capacity to design “disruptive technology & thinking” that challenges the status
quo.
Supply chain management and collaborative marketing advice and implementation are areas of ACA
expertise. This is due to the experience gained over a long time of analysing and understanding
markets and applying this knowledge to the farming and agribusiness sector.
ACU’s qualities and initiatives result in continued demand for their independent and valued opinion
in the Agricultural Sector.
Riemann Wool Forwards
ACA advised on the establishment of Riemann wool forwards in 2012 in conjunction with Financial
Energy Exchange (FEX), and now provides an on-line forward trading platform accessed by most of
Australian Wool Brokers representing over 95% of wool producers.
The ACA business has advised on the price risk management strategies and brokered wool for the
majority of all contracts traded on the Riemann exchange since its inception in 2012.
Mecardo
The most recent offering to the agricultural sector by Ag Concepts has been Mecardo. The Mecardo
platform has quickly become a household name in agriculture for independent analysis. In the past
year membership, has expanded to >7500 subscribers, and over 30,000 page views per month.
Mecardo offers analysis and commentary on news, data and analysis relevant to the Australian &
International grain, red meat and wool industries. The research and analysis is presented in easy to
understand terms with a focus on "What does it mean?" in the context of the reader.

6 | L O C A L L I V E S T O C K M A R K E T A N A L Y S I S
Employees The ACA business prides itself on being a diverse and capable business which has carefully selected
its employees to have complimentary skillsets.
Robert Herrmann
Robert Herrmann is the Managing Director of Ag Concepts Advisory Pty Ltd (ACA).
The company was established by Robert Herrmann in Adelaide in 1996. With a
longstanding background in agriculture, Robert’s commitment was to deliver a high
quality proactive risk analysis and management service to clients.
- Cert 4, Workplace Training and Assessment
- RG146 Derivatives
- AFSL 316516 Responsible Person
Matt Dalgleish
Prior to joining Ag Concepts, Matt began his career in 1993 with ANZ Bank as a
technical analyst for foreign currency and interest rate markets. Matt progressed
onto the currency trading desk, both in Australia and London.
In 2005, he left ANZ to pursue a career in training and education in the field of
economics, in this time completing a Diploma of Education with Monash University.
In 2015, Matt combined his passion for agriculture with his extensive experience of economics and
trading by joining the Ag Concepts team.
- BA Economics and Finance (RMIT)
- Diploma of Education (Monash)
Andrew Whitelaw
Andrew started his agricultural career in the United Kingdom in the feed and
biofuel industry, in a number of roles from quality management to logistics &
trading. It was during this time that Andrew discovered an interest in the
movement and trading of agricultural commodities.
The ACA business is an ideal fit for the Andrew’s skillset as it combines both his
knowledge of agricultural marketing and IT.
- BSc Business IT and eBusiness (West Scotland)
- MA Agribusiness (UQ)
- RG146 Derivatives (Kaplan)
- Chartered Quality Institute – ISO:9001 Certified Lead Auditor (SQMC)
Olivia Agar
Olivia completed a Bachelor of Science in Agriculture Degree (Hons) at the
University of Sydney in 2014, specialising in Agronomy. In 2017 Olivia joined the Ag
Concepts team, further developing her skillset in data analysis and client
consultancy.
- BSc Science in Agriculture, Agronomy and Crop Science (Sydney)
7 | L O C A L L I V E S T O C K M A R K E T A N A L Y S I S
Project Overview
In relation to the tender request from Greater Geelong City Council, Ag Concepts Advisory P/L,
trading as Mecardo, were selected to undertake a research project to gather information about the
strategic priorities related to the of City of Greater Geelong continuing to offer a livestock selling
facility.
The need for this study was a result of a number of issues identified with the Geelong Saleyards
including financial viability, sale throughput and OH&S issues, leading to its partial closure. In
addition, it was recognized that the needs of the local livestock market and Greater Geelong
Community have changed and will continue to change in the future which effects the resource
requirements and use of the saleyards.
This report will assist Council decisions as to the livestock selling needs of the future, and how funds
for infrastructure may be allocated. The report will also provide context including information about
the strategic priorities for farming generally and for emerging and future market trends for stock in
particular.
It was a request that the study include both desk and field-based research. The process of
community involvement in this study being of equal importance in the production of the final report
was made clear by the Council.
Project Objectives This analysis of the regional livestock market for the City of Greater Geelong was commissioned with
the following primary objectives:
1. Collect and collate information regarding the current and future livestock numbers in
Geelong using market data and by engaging with relevant stakeholders and local producers
to gain understanding of the history, current situation and future livestock sale
requirements.
2. Collect and collate information regarding the current stock numbers within the wider region.
3. Assess the potential for future usage of the Geelong Saleyards using collected data and
relevant market information.
4. Review and report on the present market trends locally and across the state with a
particular focus on livestock sale methods.
5. Investigate the current and future competition for the Geelong Market. This will include
identification of other sale options available to Geelong saleyard users, including the specific
requirements of small peri-urban farmers.
A secondary objective of this study is to suggest future areas of investigation for the council which
will help to support the G 21 region communities’ livestock market needs in the future.
Project Scope This independent report was prepared in 2017 by Ag Concepts Advisory for the Geelong City Council.
Previous studies and projects requested by the Council in relation to the Geelong livestock saleyards
were used as foundation to the report background. The aim of this report is to provide the Geelong
City Council with a review of the livestock market in the region using historical and current data. It

8 | L O C A L L I V E S T O C K M A R K E T A N A L Y S I S
will also comment on market trends, both at a local and regional level, affecting the livestock
industry.
The scope of this study is to collect and analyse historic/current data and future trends on the
livestock market in the Geelong region. This will be used in consideration with industry and regional
trends to suggest the future requirements and needs of the local livestock industry. The findings of
this study are expected to provide evidence and direction as to the rationalisation of the Geelong
saleyard operation for the Council, saleyard users and the community. Alternative sale methods and
opportunities will also be identified in this report which is expected to provide suggestion as to other
options to be explored in further studies.
Methodology The methodology used in the study was a combination of field work, stakeholder meetings and data
analysis.
This report has been prepared using the following sources of information and evidence to build a
detailed background and context for which to apply the findings:
• Previous studies for various Councils in the G21 region relevant to the local livestock market,
including the Geelong Saleyards Feasibility Study.
• Consultation and discussion with a range of stakeholders including The Geelong City Council,
Colac Council, staff of the Geelong saleyards, local users of the saleyards including livestock
producers, agents and buyers, and relevant advisory groups.
• Data provided by the Council regarding the throughput and financial performance of the
Geelong Saleyards.
• Collection and cross referencing of livestock data provided by Livestock Saleyard Association
of Victoria (LSAV), Scanclear, Regional Livestock Exchange (RLX), Australian Bureau of
Statistics (ABS), Meat and Livestock Australia (MLA) and Auctions Plus.
• Consultation with Livestock Saleyards Association of Victoria.
The study was undertaken using the following methods:
• Review previous regional sale yard rationalisation reports and other literature relevant to
the G21 region.
• Collect local and regional livestock market data from sources listed above.
• Meetings with relevant stakeholders and discussions with those directly impacted by
changes to the Geelong saleyard.
• Undertake analysis on the local livestock market using collected local data to compare to
trends in the wider region and future projections.
• Identify issues and opportunities with the current operations and resources available and
how these will impact future needs of the market.
• Research livestock sale methods in regions facing similar pressures to Geelong.
• Identify alternative sale methods that could meet the changing requirements of the local
market in the future.
• Investigate approaches and further projects that could be taken by the council to help
support the Geelong community and local livestock market needs in the future.

9 | L O C A L L I V E S T O C K M A R K E T A N A L Y S I S
Report Structure This report has been prepared in the following sections:
• Definition of study requirements, objectives and the process that will be followed to achieve
the desired outcomes.
• Background research relevant to the Geelong livestock market which provides context to
information collected in the study. This section can be considered an overview of factors
relevant to the local livestock market as well as a review of previous research and
recommendations relevant to the study and Geelong City Council.
• Overview of the Geelong Saleyard site and operation, based on previous reports, forums and
studies as well as site visits and consultations.
• Presentation of historic and current local market data collected from industry sources and
verified. This will include analysis of the data, linking local trends and changes in the
livestock market data to regional market & industry activity and perceived external
influences including social, policy and environment.
• Vision and Objectives for the local livestock market. This section will discuss the
requirements of the Geelong region for livestock sale in the future.
• Findings of the investigation into alternative options for sale of livestock in the region.
Recommendations for further activities and strategies which will best support the Geelong
Regions livestock market needs.

1 0 | L O C A L L I V E S T O C K M A R K E T A N A L Y S I S
Background
Geelong Region The Geelong Region is located in the Corangamite Natural Resource Management (NRM) region of
Victoria, approximately 75 kilometres South-West of the capital Melbourne. Three local government
areas make up the Geelong region, Greater Geelong, Queenscliff and Surf Coast as well as part of
Golden Plains (Figure 1). The Greater Geelong Region is part of the G21 Geelong Regional Alliance
which is made up of a municipality of five shires over 1247 square kilometres working with
government, business and community to deliver strategic projects that benefit the region. The City
of Geelong provides a central, regional hub for industry and service organisations, as well as
transport infrastructure that services the G21 region, key agricultural regions of south west and
western Victoria and areas beyond.
Land use in the Corangamite catchment is predominantly grazing modified pasture (Figure 2). A
large portion of the Southern coastal land mass is also dedicated as nature conservation area. Land
use in the immediate surrounds of Geelong City has quickly evolved over the last decade with
demand for urban development increasing due to Geelong’s proximity to Melbourne. The central
and western districts of the G21 are highly productive agricultural areas, being a major driver in the
region’s economy. Agricultural land in the Geelong region occupies 3080 square kilometres which
accounts for 70% of the region. The areas rich soil provides the basis for thriving industries in
horticulture, viticulture, dairy production, sheep & cattle grazing, broad acre farming, intensive
agriculture, niche producers and wool production.
Figure 1. G21 region and Greater Geelong LGA1
1 Vaughan, N. Greater Geelong Regional Profile, 2014

1 1 | L O C A L L I V E S T O C K M A R K E T A N A L Y S I S
Figure 2. Catchment Scale Land Use for Corangamite NRM Region with 25 and 40 km radius overlayed on saleyard locations2
Historical Context Saleyards in Victoria have been at the core of the livestock industry since first settlement, with the
saleyard providing a convenient service to buyers and sellers.
Saleyards are also non-discriminating, that is providing stock are in reasonable health the saleyard is
able to accommodate any type of stock with the auction process determining the relative value on
the day.
While the system has served the Victorian livestock industry well over the past 150 years, it is clear
that in recent times technology is impacting on the importance of saleyards into the future.
It is difficult to see a time where saleyards are not required, being most convenient for sale of small
lots. However, the move to direct sales to buyers and on-line selling will continue to provide
challenges to the future viability of all saleyards.
A number of saleyards currently service the NRM regions of Southern Victoria (Table 1 and Table 2).
The regional saleyard complex at Ballarat currently attracts stock from the Geelong Region with
large sheep & lamb producers electing to support this market due to greater throughput and
increased buyer support.
Both Ballarat & Colac saleyards conducts a weekly cattle market. Due to the current closure of the
Geelong cattle saleyards, cattle producers in the Geelong region utilise these markets
2 Australian Bureau of Agricultural and Resource Economics and Sciences, 2016

1 2 | L O C A L L I V E S T O C K M A R K E T A N A L Y S I S
The issue of transporting livestock is not significant for larger lots, with a range of up to two hours on
the truck considered reasonable when producers are looking to access markets with perceived
increased competition.
Small farmers (peri-urban farmers) find it more difficult to deliver small lots to Colac and Ballarat via
their own transport (car & trailer) due to the distances and the requirement of many to hold fulltime
weekly employment. The convenience of Geelong saleyards and the ability to deliver on Sunday is
attractive.
Table 1. Cattle Saleyards in selected Natural Resource Management regions of Victoria.
Corangamite Glenelg Hopkins
Ballarat Warrnambool
Geelong Hamilton
Colac
Camperdown
Table 2. Sheep Saleyards in selected Natural Resource Management regions of Victoria.
Corangamite North Central Glenelg Hopkins Wimmera
Ballarat Bendigo Hamilton Horsham
Geelong
Economic Context Agricultural production is a strong contributor to the local economy in the Geelong region and
provides important resources for the wider Victoria and export market. In 2014–15, the gross value
of agricultural production in the Geelong region was $458 million, which was 3.5 per cent of the
total gross value of agricultural production in Victoria ($13.1 billion).
In 2014-15, the sector employed 5,800 people, which represented 4 per cent of the Geelong regions
total workforce2. Census data shows a declining trend in the number of registered businesses in the
Agriculture, Forestry and Fishing sector in Geelong from 2011 to 2014. As shown in Table 3, this is
consistent with neighbouring regions in Southern Victoria.
Table 3. Number of Agriculture related businesses by region1
Region 2011 2012 2013 2014
Geelong 1587 1531 1498 1481
Warrnambool and Southwest 5799 5725 5620 5619
Ballarat 1923 1879 1852 1903
Melbourne West 824 761 701 672
The diversity of the Geelong regions agricultural sector has meant that it can withstand price
fluctuations in markets over time. However, livestock production is core to Geelong agriculture
contributing approximately 75 per cent gross value to total agricultural production in Geelong2.
The most important commodities in the region based on the gross value of agricultural production are
poultry ($193 million), followed by eggs ($41 million) and sheep and lambs ($39 million). These three

1 3 | L O C A L L I V E S T O C K M A R K E T A N A L Y S I S
commodities together contributed 60 per cent of the total value of agricultural production in the region
(Figure 3).
Figure 3. Value of agricultural commodities produced in Geelong region1
The number of farms in the region which derive majority of their gross value from livestock
production compared to cropping operations is significant in the Geelong region (Table 4).
Table 4. Number of farms by agriculture industry classification in Geelong and wider Victoria1
Industry classification
Geelong region Victoria
Number of farms % of region Number of
farms
Contribution of region to state
total %
Sheep Farming (Specialised) 294 31.7 2,987 9.8
Beef Cattle Farming (Specialised)
219 23.6 7,740 2.8
Grain-Sheep or Grain-Beef Cattle Farming
89 9.6 2,160 4.1
Other Grain Growing 84 9.1 2,939 2.9
Horse Farming 69 7.4 681 10.1
Sheep-Beef Cattle Farming 43 4.6 1,415 3
Other Crop Growing 43 4.6 503 8.5
Other 87 9.4 8,146 1.1
Total agriculture 927 100 26,571 3.5

1 4 | L O C A L L I V E S T O C K M A R K E T A N A L Y S I S
Figure 4. Distribution of farms estimated value of agricultural operations, Geelong Region 2014-15 1
Regional Industry Changes Changing trends and globalisation in the agriculture sector at a national level are flowing through to
effect change in the way local producers and local markets operate. New ideas, techniques and
technology are well received by those in the industry. Adoption is generally well considered and
investment is often significant, resulting in transitional movements and trends rather than quick
swings.
A number of key trends in the agriculture sector are leading to changing requirements and resources
for local markets. Consolidation throughout the food supply chain is evident in a range of production
sectors across Australia. Larger producers are becoming increasingly dominant, with small to
medium sized operators feeling growing pressure to intensify so as to remain viable in current
tight commodity markets. There is also an industry trend of consolidation of end purchasers of
agricultural produce. This is particularly evident in the beef supply chain, with companies such as JBS
Australia, Teys/Cargill and Nippon Australia owning multiple abattoirs and feedlots thereby
dominating market share. Significant purchasing power is held by large retailers and processors
who require consistent supply volumes and therefore often bypass small producers and traditional
small market sales.3
There has been a steady transition to fewer and larger farms over time In Australia. Between 1976
and 2004 the number of establishments with agricultural activity in Victoria decreased by 31% from
48,000 to 33,000. In addition, the average farm size increased from 296 ha to 420 ha over this time.
The trend towards farm amalgamations and increase in size in Victoria is reflective of the increasing
3 Macedon Ranges Shire, Kyneton Saleyards Plan, 2016

1 5 | L O C A L L I V E S T O C K M A R K E T A N A L Y S I S
pressure to improve productivity to sustain profits and export competitiveness in the current market
environment.4
Growing competition for land has also had an impact on the farm demographic and markets in
Victoria. Rising value of land combined with low margins in production has resulted in fragmentation
of regional properties, and where possible conversion of farms from primary production to peri-
urban farms.5
The Victorian livestock sector is undergoing changes with the National Livestock Identification
Scheme (NLIS) being phased in for sheep as of January 1. Sheep and goats must now be identified
with an electronic NLIS tag before leaving a property, this has been a requirement for cattle for
some years. Greater transparency for both producers and buyers in the supply chain will help parties
to make better sale decisions based on market information. It is expected that producers will more
readily transport their cattle to the areas where they will get the best return.
In Victoria, traditional livestock saleyards are still the most common method of sale. However,
changes in both the livestock market and technology have opened opportunities for producers to
access different markets and use new methods. Online auctions and direct sales have increased in
popularity. Such systems allow significant savings for producers in terms of cost and time and can
provide less risk of disease being spread (often an issue with saleyards). There is also a trend
towards direct sale from producers to buyers, circumventing the use of saleyards.
Hassal & Associates6 review of saleyards in Australia predicted that over the next decade many small
yards will close. A number of reasons were given to drive this change including:
- Increasingly stringent government regulations for Operational Health and Safety, NLIS
implementation and animal welfare requirements
- Urbanisation of regional centres
- Construction of large regional saleyards
- Increasing number of producers bypassing saleyards
- Increased concentration in the buying sector by the larger players will mean more livestock
are sold directly
4 Productivity Commission, Trends in Australian Agriculture, 2005 5 Effect of Market Consolidation on the Red Meat Processing Sector, 2016 6 Hassal & Associates P/L, Review and Analysis of Saleyard Marketing in Australia, 2014

1 6 | L O C A L L I V E S T O C K M A R K E T A N A L Y S I S
Overview of Issues A review of the Geelong saleyards and local market based on consultations with stakeholders
identified issues with the current model market model. These are outlined below and should be
considered by the council when determining strategic options and asset planning for support of the
local livestock market.
Issues
Saleyard Financials
Declining livestock throughput
Increasing cost to operate the facility
Ongoing net operating loss
Significant investment required for suggested upgrades & maintenance
Saleyard Infrastructure
Cattle yard operations have been closed since August 2016
Facility is below standard compared to competing saleyards in the region
Infrastructure is underutilised
Safety and OH&S concerns identified
Facility upgrades required to meet needs of NLIS scheme
Maintenance required
Saleyard Site & Location
Location may no longer be suitable for saleyards facility due to urban encroachment
Concern for cross contamination of airborne diseases
Significant land value
Site is the most convenient access to saleyard for some farmers
Heritage value
Social
Facility operation supports local allied businesses
Saleyard considered a gathering place for local agricultural community
Sentimental value due to history of the saleyards
Local Market
Trend towards smaller peri-urban farms
Declining livestock numbers
Trend towards crop production
Move towards more direct from paddock sales and online auctions
1 7 | L O C A L L I V E S T O C K M A R K E T A N A L Y S I S
The Geelong Saleyards
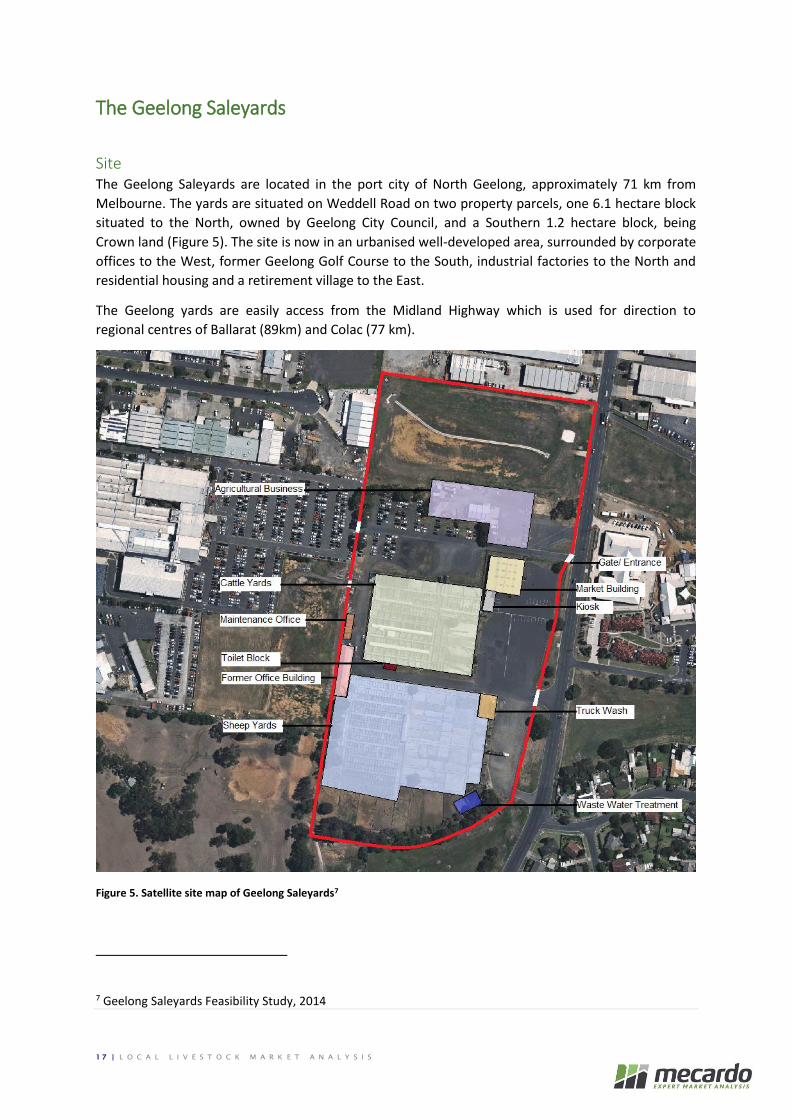
Site The Geelong Saleyards are located in the port city of North Geelong, approximately 71 km from
Melbourne. The yards are situated on Weddell Road on two property parcels, one 6.1 hectare block
situated to the North, owned by Geelong City Council, and a Southern 1.2 hectare block, being
Crown land (Figure 5). The site is now in an urbanised well-developed area, surrounded by corporate
offices to the West, former Geelong Golf Course to the South, industrial factories to the North and
residential housing and a retirement village to the East.
The Geelong yards are easily access from the Midland Highway which is used for direction to
regional centres of Ballarat (89km) and Colac (77 km).
Figure 5. Satellite site map of Geelong Saleyards7
7 Geelong Saleyards Feasibility Study, 2014

1 8 | L O C A L L I V E S T O C K M A R K E T A N A L Y S I S
Three site overlays exist over the grounds of the saleyard facility which can be seen in Figure 6. The
planning overlays place restrictions on development, maintenance and use of the site which are
detailed in the Conservation Management Plan report8. The site overlays are as follows:
• Heritage Overlay (HO1915)- applies to part of the site, including the Crown Land parcel and
the central section of the Council
• Design and Development Overlay (DDO20)- applies to part of the subject site, including all of
the Council parcel
• Special Building Overlay (SBO)- applies to a small section of the southern Crown Land parcel
and northern Council parcel
Figure 6. Planning overlay map of Geelong Saleyards site9
8 Conservation Management Plan Greater Geelong, 2007 9 Greater Geelong Maps- Planning Schemes Online, Department of Environment, Land, Water and Planning website

1 9 | L O C A L L I V E S T O C K M A R K E T A N A L Y S I S
Figure 7. Satellite zone overlay of Geelong saleyards site9
Infrastructure The Geelong saleyard has been in operation for livestock exchange since first opening in 1869.
Various changes to the infrastructure has occurred since the original construction of the saleyards
but currently includes a range of facilities including cattle and sheep yards, market building, land
leased to an agricultural business, a truck wash, maintenance sheds, temporary offices and a
portable kiosk, toilet block, waste water treatment facility, former market office building site and
three gates. The components and site map can be seen in Figure 5.
A 2016 engineers report has described the facility as “on very poor condition with significant decay
of timber elements observed along with corrosion of un-galvanised steel posts”. Occupation Health
and Safety issues were identified with the infrastructure and many structural elements were
deemed to require maintenance10. In August of 2016 the saleyards were closed due to OH&S
concerns identified in a condition report. After a series of maintenance upgrades and process
changes, the sheep market was reopened for operation in February 2017. However, use of the cattle
saleyard remains closed until further notice with no predicted date for the facility to reopen.
Heritage & Social Value The saleyards are considered a site of significant heritage value, with strong social and cultural ties
due to its historic purpose and the original 19th Century saleyards design and character which has
been retained. According to the Geelong Saleyards Conservation Management Plan 20078, the
Saleyards has “significance as the most intact functioning 19th Century municipal stock yards known
10 Geelong Saleyards Engineers Condition Report, 2016

2 0 | L O C A L L I V E S T O C K M A R K E T A N A L Y S I S
in Victoria” and reflects “the importance of the agricultural industry to the Geelong economy in the
19th Century”. The features recognised as of primary heritage significance include sections of the
cattle and sheep yards, the central thoroughfare, bluestone spoon drains, timber cattle ramp,
former latrines shed and former caretaker’s cottage. Building components of secondary heritage
significance include the open shed in the sheep yards, interwar toilet block, the altered and 20th
Century cattle and sheep ramps, and possible archaeological fabric in the vicinity of Fishermans Fully
and at the Eastern portion of the sheep yards7.
Due to its long-standing history, the saleyards are viewed as a place of sentimental value to
members of the regions rural community. As with many other saleyards, the Geelong centre is
considered a hub for business and acts as a social meeting place for farmers, stock agents, buyers
and the general public in the rural G21 community. The social value of the saleyards was
acknowledged in a stakeholder workshop as a place of “social connectedness”, offering an important
social meeting place and playing a key role in supporting mental wellbeing in the farming
community. The social disconnection and isolation of farming is a known contributing factor to
physiological distress which places greater importance on opportunities for social cohesion in the
rural community such as livestock sales. One user of the saleyards emphasized its social value,
stating “The yards are like an informal counselling session every Monday”11.
There are also noteworthy ancillary benefits of the yards operations for surrounding businesses
including local allied businesses such as machinery dealers, farm supplies, produce stores etc. The
site has also been used as a venue for a number of additional purposes. Over the last few years this
has included livestock show competitions, tourism and education activities.
Financial performance and outlook This section of the report will focus on the financial performance of the Geelong saleyards. The
information required to produce this section was provided by the City of Greater Geelong council.
The full breakdown of income and expenditure from 2005/06 to 2015/16 is detailed in Table 10 &
Figure 8 (Net Balance). In summary the financial performance for the Geelong Saleyard has been on
a steep decline over the reporting period.
The increasing losses for the Geelong saleyard can be attributed to increasing costs, at a time of
declining livestock throughout. Although alternate sources of income have increased in recent
years, they have not stymied the descent of the Geelong saleyard financial results.
The expected throughput in Geelong in coming years, is not likely to reverse the declining profit of
the Geelong saleyard.
• The saleyard has made a loss in every year since 2005/06.
• The average loss has been $161,536 in this period, however since the beginning of the
decade the loss has increased to an average of $206,958.
11 Geelong Saleyards- Stakeholders Workshop Report of Outputs, 2016

2 1 | L O C A L L I V E S T O C K M A R K E T A N A L Y S I S
Figure 8. Net Balance of Geelong Saleyard
Income The overall income has, as expected, tracked the saleyard throughput, which can be seen in Figure 9.
This is a result of yarding and agency fees being based on throughput, therefore as the number of
head decreases revenue will fall and vice versa.
The saleyard income has however started to rebound since it’s lows in 2010/11, a large percentage
of this rise can be attributed to an increase in other income sources (Figure 10).
The additional income sources have become increasingly important to the Geelong saleyards, in
2005/06 alternative incomes comprised 0.5% ($1380) of income, in 2015/16 this had increased to
21% ($38,315) (Figure 11).
• Total income from 2005/06 to 2015/16 has averaged $177,568.
• Despite the increased alternative income streams since 2010/11, the average income has
dropped to $160,454.
• On average since 2010/11 alternative income has provided 18.4% of the saleyard revenue.
Figure 9. Income value of Geelong saleyard Figure 10. Income value of Geelong saleyard by source

2 2 | L O C A L L I V E S T O C K M A R K E T A N A L Y S I S
Figure 12. Expenditure value of Geelong saleyard
Figure 11. Percentage value of Geelong saleyard income sources
Expenditure The annual expenditure on the saleyard has increased dramatically as can be seen in Figure 12. The
overall expenses have increased every year since 2009/10 with the exception of 2011/12. The
average increase in expenditure has been 7% in this period and 9%, if 2011/12 is excluded.
The largest saleyard cost over the 11 year period has been staffing costs, which have contributed to
45% ($1.7m) of the facilities running costs (Figure 13). The staffing requirements are at the minimal
levels required to operate the saleyards, and cost savings in this area are largely unachievable
without eroding service levels.
• The average expenditure since 2005/06 is $339,103, however since 2010/11 has increased
to $367,412.
• The labour cost per livestock unit has increased from 79¢/ph in 2005/06 to $3.41ph in
2015/16 (Figure 14).
It must be noted that these expenses do not include capital expenditure.
Figure 13. Percentage of expenditure value of Geelong saleyard by item

2 3 | L O C A L L I V E S T O C K M A R K E T A N A L Y S I S
Figure 14. Cost of labour per livestock unit at Geelong Saleyard
Saleyard Operations
Livestock Buyers There is a core group of buyers that support the Geelong yards and are vocal in re-iterating that they
will continue to support the yards for up to the next 6 years and therefore claim that the cattle &
sheep sales should continue.
Some buyers use the Geelong sales to “top-up” on purchases made earlier in the day at the Ballarat
yards. These buyers also provide a service to the wide range of producers and their wide range of
stock delivered to sale – the buyers are able to accommodate all types.
Livestock buyers base their decision to attend sales on where they are likely to be able to purchase
their requirements (both in terms of quantity & quality), or where they perceive stock can be
purchased to their advantage (reduced competition or close proximity to destination).
All major buyers operating at the Geelong Saleyard also purchase at other yards, so there would be
little impact on their capacity to purchase required weekly stock numbers with or without the
Geelong Saleyards. The “top-up” factor after the Ballarat sale is not significant from a buyer’s
perspective.
Geelong Saleyards also has buying activity around private purchase of stock for home slaughter, this
should not be a consideration as this market/trading operates on the periphery and is cash traded.
Livestock Agents There are two stock agents currently operating at the saleyards. These agents have a variety of other
markets in which they operate and so are not reliant on the Geelong market being open for their
business.
The sale day service which they provide to small producers is considered to be a high cost on a per
head of stock basis. The local agents are aware of this issue and it is reviewed constantly to no
solution. The agents’ business is also challenged by competition from other marketing options that
do not require an agent.

2 4 | L O C A L L I V E S T O C K M A R K E T A N A L Y S I S
Other Saleyards
Kyneton Saleyards
The Shire of Macedon Ranges owns & operates the Kyneton Saleyards, and has a similar
circumstance to the City of Greater Geelong saleyard.
It is 150 years old and “operates within a complex and changing industry…. with economic,
technological, environmental and demographic changes resulting in challenges to the traditional
function and viability of saleyards” as stated in a report by the Macedon Ranges Shire3.
The focus of the weekly prime markets is on the use by smaller producers who rely on the saleyard
for buying and selling, however the significant impact to throughput numbers by far is the monthly
store cattle sales. These clearly account for the highest throughput of the saleyards and are
considered to be by far the major strength of the facility.
Prime cattle sales have been in decline and sheep average less than 600 per sale (on 17/3/2017 the
fortnightly sale consisted of 8 cattle and 150 sheep).
The net operating result has been positive over the past 5 years; however, this has been augmented
by a 43% contribution of the income from the truck wash facility. Without this income, the saleyards
would have generated a loss from stock sales of $20 – 60,000 over the past 7 years. 3
Future viability is challenging. Currently the Council receives a trade waste discount from Coliban
Water to off-set the cost of disposing waste collected from the truck wash and saleyards. This is to
be progressively removed over the next 5 years resulting in an expected additional $58,000 p.a. cost.
Large scale producers by-pass the Kyneton saleyards to deliver their prime stock to the larger
regional centres of Ballarat, Bendigo & Packenham in order to receive better competition and prices.
Macedon Ranges Shire has decided to install a roof over the cattle yards, as well as soft flooring in an
attempt to attract greater cattle numbers while the 2016 report recommends the decommissioning
and closure of the sheep yards.
Macedon Ranges Shire has a difficult task; the shire has invested in the saleyards over recent years
with the cattle yards constructed of steel and the facility in a good state of repair. The current
Kyneton Saleyards Plan has recommended additional spending on a roof and soft flooring to support
and hopefully increase throughput; this is a risk as it is not clear that the recent trend of declining
sales and by-pass decisions by larger producers can be reversed.
FY 2011 FY2012 FY2013 FY2014 FY2015
Prime Cattle 5300 4700 2400 1600
Store Cattle 6900 10700 10000 7800 *Detailed breakdown for 2012/13 not available
Wangaratta and Benalla
In 2013 Benalla saleyards announced that it would close when the majority agent decided to divert
all cattle sales to Wangaratta. This boosted Wangaratta saleyards and they subsequently announced
a $3.7 million upgrade in 2015.
The idea of forming a Co-operative was explored in 2016, with council arranging meetings to assess
the interest of potential stakeholders including agents and producers taking on the management of
the saleyards.

2 5 | L O C A L L I V E S T O C K M A R K E T A N A L Y S I S
Wangaratta council has an ongoing interest repayment of $150,000 p.a. to cover loans for the
upgrade. This was proposed to be the rental fee in the floated option that a co-operative be formed
to run the saleyards.12
This proposal has now lapsed due to lack of commitment from possible co-operative members due
to uncertainty around returns. The Council has now decided to form a Committee of Management to
manage and run the saleyards.
Recent reports have seen local supporters express concern that several key local producers are
choosing to sell their cattle at Barnawatha, with some agents advising sellers to by-pass Wangaratta
due to “perceived higher prices” being received13.
Ouyen Saleyards
The Ouyen saleyard operates in northwest Victoria. The selling centre sells sheep only and
throughput averages 10-11,000 sheep per fortnight (Max 23,000, Min 6,000), with a drawing arc of
western NSW, S.A., northern Victoria and at times southwest QLD. Nearest other saleyard is Swan
Hill who sell on the same day – every second Thursday.
Mildura City Council own the saleyards and pay for power; however, management pay a rent to the
saleyard owners, (undisclosed), with ongoing maintenance provided via saleyard revenue and
managed by the Board. In recent years, a re-vamped truck wash has provided good cash surpluses
(undisclosed).
Ouyen Saleyards operates as a “not-for-profit” and applies for government grants from time to time.
The board of management has an annual reporting requirement to the saleyard owner.
12 Kelly, S. Producers cautious on Co-op proposal, 2016, Wangarratta Chronicle (website) 13 Kelly, S. Urgent action needed to save our Saleyards, 2017, Wangarratta Chronicle (website)

2 6 | L O C A L L I V E S T O C K M A R K E T A N A L Y S I S
Livestock market
Current Market This section of the report focuses on the current state of play with regard to livestock market data
within the Western Victorian region. It outlines the pattern of throughput and herd/flock numbers
over time for cattle and sheep/lamb. Included in the analysis is an assessment of the competition
faced by saleyards both in terms of available livestock (competition for acres) and alternative selling
methods, such as Auctions Plus or direct to meatworks.
The data used has been sourced from a variety of providers and where possible has been cross
checked for accuracy. Data tables within this section incorporate information from the 2008 to 2016
financial year periods. For example, the data column labelled FY2008 is data from 1st July 2007 to
30th June 2008.
A full table of data has been supplied in the appendices which includes data utilised for the longer-
term charts which encompasses the period from 2000 to 2016 (Table 11 and Table 12).
Local Stock Data Table 5 contains the cattle throughput in head numbers for the saleyards of Ballarat, Geelong, Colac,
Hamilton, Warrnambool, Camperdown and total Victorian throughput. Included in this table is the
available Auctions Plus cattle sale data for the Western Victorian region, which encompasses much
of the area relevant to the individual sale yards listed. The bottom row of the table lists the Victorian
cattle herd numbers as collected by the Australian Bureau of Statistics14
Table 5. Saleyard throughput volumes and herd size- Victorian Cattle
Reviewing the cattle throughput trend for each individual sale yard in a graphical format, Figure 15
shows Ballarat and Warrnambool are the only two sale yards with increasing yarding’s, ranging
between 10-15% over the period 2000 to 2016. Colac, Hamilton and Camperdown experienced a
moderate decline in throughput of between 15-25%, while Geelong has seen a significant decrease
over the same time frame, just shy of a 70% decline.
14 Australian Bureau of Statistics, 2016
FY2008 FY2009 FY2010 FY2011 FY2012 FY2013 FY2014 FY2015 FY2016
Ballarat 61,087 56,915 46,774 50,191 53,883 53,343 55,826 71,296 66,938
Geelong 8,987 8,303 6,841 5,151 5,201 8,160 9,284 11,372 8,744
Colac 44,284 51,599 46,156 47,783 42,462 36,347 38,691 45,540 40,892
Hamilton 46,776 47,776 42,897 45,590 41,273 - 36,192 47,396 38,982
Warrnambool 102,872 106,145 99,722 88,666 85,873 78,676 79,970 98,590 97,865
Camperdown 44,394 50,294 46,869 46,551 46,786 36,888 43,763 52,912 49,564
Total Vic 816,280 785,977 805,193 552,417 582,437 522,034 595,466 656,242 520,999
Auctions Plus - - - - - 6,858 6,325 12,635 19,655
Vic Herd 3,838,000 3,854,000 3,668,000 3,970,000 4,114,000 4,229,000 4,217,692 4,128,535 -
Sources: LSAV, RLX, Scanclear, Auctions Plus, ABS, ACA
*Throughput data not avai lable for Hami l ton FY2013

2 7 | L O C A L L I V E S T O C K M A R K E T A N A L Y S I S
Figure 15. Saleyard Cattle throughput 2000 - 2016
Table 6 contains the combined sheep and lamb throughout figures for the Ballarat, Geelong,
Hamilton, Bendigo and Horsham saleyards along with the total for Victoria. As presented with the
cattle data, Auctions Plus sheep and lamb sales are included in the table for the last four financial
years along with the size of the Victorian flock as measured by the ABS. 14
Table 6. Saleyard throughput volumes and flock size- Victorian sheep and lamb
Figure 16 displays the movement in throughout for the relevant sale yards from the period 2000 to
2016. Horsham and Ballarat have experienced increasing lamb and sheep yarding’s in the magnitude
of 20-40% during this time frame, while Hamilton and Bendigo have seen more moderate advances,
in the order of 5-10%. In contrast, Geelong has seen a significant reduction in lamb and sheep
yarding volumes over this period, in excess of 70%.
FY2008 FY2009 FY2010 FY2011 FY2012 FY2013 FY2014 FY2015 FY2016
Ballarat 1,436,242 1,496,762 1,347,934 1,232,545 1,353,088 1,261,815 1,372,287 1,516,526 1,402,315
Geelong 94,197 106,964 86,101 72,855 65,383 55,302 54,253 45,937 45,092
Hamilton 1,047,593 1,175,076 1,045,916 951,202 980,419 988,578 948,253 1,013,020 998,439
Bendigo 1,437,449 1,416,821 1,082,789 1,065,668 1,042,457 1,119,952 1,205,339 1,120,485 1,045,648
Horsham 527,730 627,874 609,918 571,548 516,006 502,379 565,167 526,375 471,910
Total Vic 3,695,120 4,215,556 3,616,500 3,104,694 3,143,484 3,667,164 3,790,821 3,956,150 3,767,913
Auctions Plus - - - - - 62,429 127,174 174,757 286,830
Vic Flock 16,765,000 15,082,000 14,378,000 15,212,000 15,928,000 16,067,032 15,365,155 14,572,262 -
Sources: LSAV, RLX, Scanclear, MLA, ABS, Auctions Plus, ACA

2 8 | L O C A L L I V E S T O C K M A R K E T A N A L Y S I S
Figure 16. Saleyard sheep and lamb throughput 2000 - 2016
Saleyard Competition Since 2008 the ABS14 have collected land use data according to Natural Resource Management
(NRM) regions as part of their annual agricultural commodities survey (Figure 17). Land use data has
been included from the Corangamite region along with the two bordering regions in this analysis of
Glenelg Hopkins and North Central.
Figure 17. Victorian Natural Resource Management Regions
Table 7 highlights the financial years from 2008 to 2015 and outlines the number of beef cattle,
number of sheep/lamb and hectare of broadacre crops according to the three NRM regions most
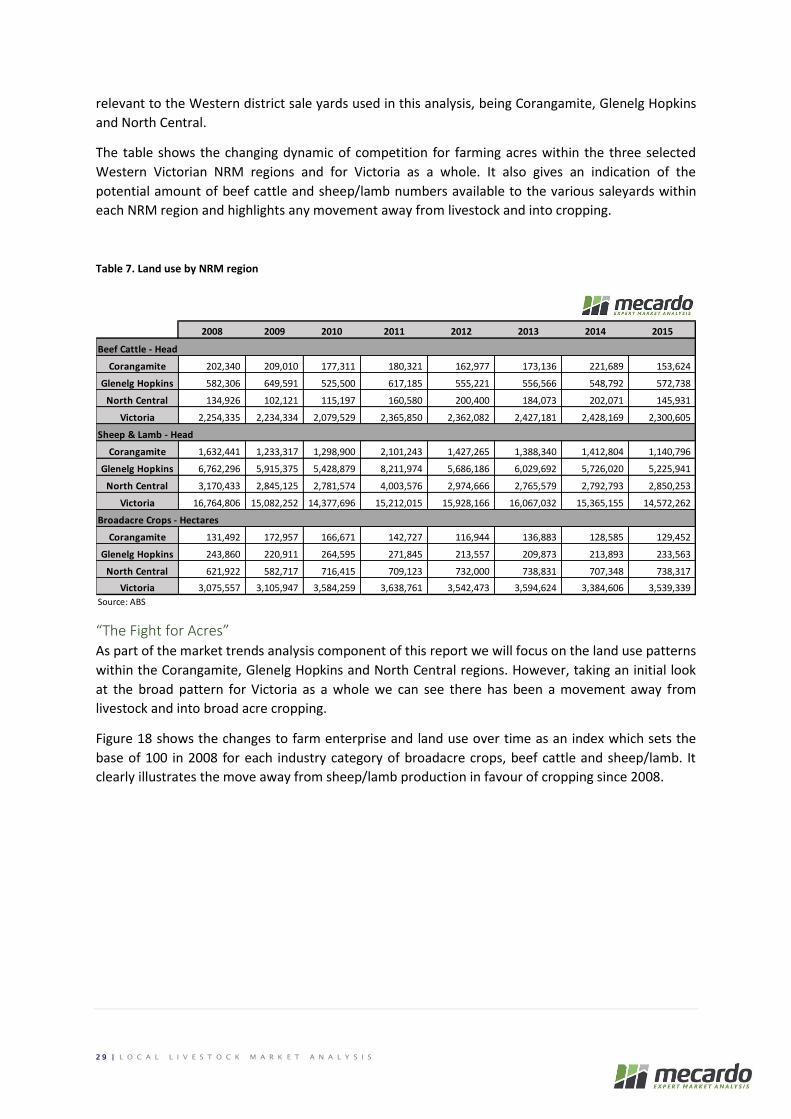
2 9 | L O C A L L I V E S T O C K M A R K E T A N A L Y S I S
relevant to the Western district sale yards used in this analysis, being Corangamite, Glenelg Hopkins
and North Central.
The table shows the changing dynamic of competition for farming acres within the three selected
Western Victorian NRM regions and for Victoria as a whole. It also gives an indication of the
potential amount of beef cattle and sheep/lamb numbers available to the various saleyards within
each NRM region and highlights any movement away from livestock and into cropping.
Table 7. Land use by NRM region
“The Fight for Acres” As part of the market trends analysis component of this report we will focus on the land use patterns
within the Corangamite, Glenelg Hopkins and North Central regions. However, taking an initial look
at the broad pattern for Victoria as a whole we can see there has been a movement away from
livestock and into broad acre cropping.
Figure 18 shows the changes to farm enterprise and land use over time as an index which sets the
base of 100 in 2008 for each industry category of broadacre crops, beef cattle and sheep/lamb. It
clearly illustrates the move away from sheep/lamb production in favour of cropping since 2008.
2008 2009 2010 2011 2012 2013 2014 2015
Beef Cattle - Head
Corangamite 202,340 209,010 177,311 180,321 162,977 173,136 221,689 153,624
Glenelg Hopkins 582,306 649,591 525,500 617,185 555,221 556,566 548,792 572,738
North Central 134,926 102,121 115,197 160,580 200,400 184,073 202,071 145,931
Victoria 2,254,335 2,234,334 2,079,529 2,365,850 2,362,082 2,427,181 2,428,169 2,300,605
Sheep & Lamb - Head
Corangamite 1,632,441 1,233,317 1,298,900 2,101,243 1,427,265 1,388,340 1,412,804 1,140,796
Glenelg Hopkins 6,762,296 5,915,375 5,428,879 8,211,974 5,686,186 6,029,692 5,726,020 5,225,941
North Central 3,170,433 2,845,125 2,781,574 4,003,576 2,974,666 2,765,579 2,792,793 2,850,253
Victoria 16,764,806 15,082,252 14,377,696 15,212,015 15,928,166 16,067,032 15,365,155 14,572,262
Broadacre Crops - Hectares
Corangamite 131,492 172,957 166,671 142,727 116,944 136,883 128,585 129,452
Glenelg Hopkins 243,860 220,911 264,595 271,845 213,557 209,873 213,893 233,563
North Central 621,922 582,717 716,415 709,123 732,000 738,831 707,348 738,317
Victoria 3,075,557 3,105,947 3,584,259 3,638,761 3,542,473 3,594,624 3,384,606 3,539,339
Source: ABS

3 0 | L O C A L L I V E S T O C K M A R K E T A N A L Y S I S
Figure 18. Victorian change in farm enterprise indices Figure 19. Victorian change in farm enterprise year on year
Taking a look at the percentage change year on year for each land use category we can see a mild
negative relationship between cropping and livestock in the sense that increases in one sector in a
given year often correspond to lower or negative gains to other sectors (Figure 19). Indeed, a longer
term look at the shift between sheep/lamb enterprises to cropping across Australia is demonstrated
by the moderate negative correlation between sheep numbers and hectares used for cropping on a
yearly basis since 1987 for the whole of Australia (Figure 20).
Figure 20. Comparison of sheep to cropping in Australia 1987 - 2016
Other Sale Methods Competition from online livestock sales methods such as Auctions Plus has also been increasing over
the last four years, particularly for sheep and lamb volumes. Figure 21 shows the cattle throughput
volumes for the selected Western district saleyards compared to Auctions Plus volumes. The
Auctions Plus data used is for the combined North West Victorian Zone and South West Victorian
Zones, which encompass the NRM regions of Corangamite, Glenelg Hopkins, North Central,
Wimmera and Mallee.

3 1 | L O C A L L I V E S T O C K M A R K E T A N A L Y S I S
The growth in Auctions Plus cattle volumes have seen the online sales increasing exponentially. This
is reflected in the numbers sold through Auctions Plus reflecting similar numbers as the Geelong
yards of around 8,000 head in 2013 to recording numbers equal to half the volume of Colac’s sale
yard of near to 20,000 head by 2016.
Figure 21. Saleyard and online cattle throughput for Western Victoria
Figure 22 highlights the year on year growth in Auctions Plus combined sheep and lamb sales
compared to the selected Western district saleyards which shows a steady trajectory of increasing
volumes. In 2013 Auctions Plus were recording sales similar to the Geelong saleyard’s sheep and
lamb throughput, circa 60,000 head. This increased to approximately 60% of the Horsham
throughput in 2016 at 286,000 head.
Figure 22. Saleyard and online sheep/lamb throughput for Western Victoria

3 2 | L O C A L L I V E S T O C K M A R K E T A N A L Y S I S
Market Trends
Local and State Stock Trends The trend index methodology was used to compare relative growth levels across the different
sectors of beef cattle, sheep/lamb and cropping for the three selected NRM regions. By using this
analysis, we get an indication of the availability of livestock for sale and the relative growth or
decline of cropping in each NRM region over time. This is compared to the broader Victorian trend.
As with the change in Victorian farm enterprise indices discussed previously, the base year of 2008
has been set at 100 and growth/decline in each series has been measured from this time onwards.
Figure 23 demonstrates the change to cropping since 2008 with the Victorian trend being largely
mirrored by the North Central NRM region. Similar declines in cropping are noted for both
Corangamite and Glenelg Hopkins by the 2015 season, despite a robust growth in cropping in
Corangamite during 2009/2010.
Figure 23. Broadacre crop trend indices
In terms of beef cattle, Glenelg Hopkins has been the region that most closely resembled the
Victorian pattern, with Corangamite deviating below the Victorian trend for much of the 2010 to
2015 period. In contrast, North Central has seen some strong growth recorded from 2010 to 2014 to
above the Victorian pattern most recently (Figure 24).

3 3 | L O C A L L I V E S T O C K M A R K E T A N A L Y S I S
Figure 24. Beef cattle trend indices
Reasonably similar patterns are visible for sheep and lamb trends across all three NRM regions.
There was a noticeable spike during the 2011 season which can be explained by favourable seasonal
impacts during 2010 and 2011 which saw lamb and sheep numbers increase significantly. However,
there is a slight deviation evident among NRM regions since 2014 with North Central flock numbers
remaining relatively consistent while Corangamite and Glenelg Hopkins staged a decline (Figure 25).
Figure 25. Sheep/lamb trend indices
Saleyard Comparison Individual saleyard throughput trends within the Western district were compared to Victorian totals
as well as Auctions Plus sales throughput and listed against the relative Victorian herd/flock size. This
analysis was produced using percentage year on year changes, measured average year on year
change and calculated Annual Compound Growth Rate (ACGR) for the period 2000 to 2016 (Table 13
and Table 14). Using the ACGR is a better measure of growth/decline in a series over time as it

3 4 | L O C A L L I V E S T O C K M A R K E T A N A L Y S I S
represents a steady geometric average growth or decline in contrast to a simple average calculation,
which doesn’t take into account compounding and can lead to an over/under estimation of growth
or decline.
Table 8 represents a defined period only. The entire analysis spanning year 2000 to 2016 is available
in the appendix (Table 13).
Table 8. Year on year change to throughput, herd size and growth rates for Victorian cattle 2000 - 2016
Cattle sales throughput shows that over the 2000 to 2016 period Ballarat and Warrnambool sale
yards were the only two to achieve steady growth over the time frame with regard to cattle
throughput on an ACGR basis, at 0.8% and 0.6% respectively (Figure 26). The Geelong saleyard
showed the greatest ACGR decline, effectively recording a fall in throughput of 6.8% each year from
2000 to 2016 on an ACGR basis.
Figure 26. Change in cattle throughput 2001 - 2016
FY2008 FY2009 FY2010 FY2011 FY2012 FY2013 FY2014 FY2015 FY2016 Average ACGR
Ballarat -18.3% -6.8% -17.8% 7.3% 7.4% -1.0% 4.7% 27.7% -6.1% 2.4% 0.8%
Geelong -51.7% -7.6% -17.6% -24.7% 1.0% 56.9% 13.8% 22.5% -23.1% -4.3% -6.8%
Colac -25.7% 16.5% -10.5% 3.5% -11.1% -14.4% 6.4% 17.7% -10.2% -0.1% -1.2%
Hamilton -2.2% 2.1% -10.2% 6.3% -9.5% 31.0% -17.8% 0.2% -1.6%
Warrnambool -12.9% 3.2% -6.1% -11.1% -3.2% -8.4% 1.6% 23.3% -0.7% 1.3% 0.6%
Camperdown -23.4% 13.3% -6.8% -0.7% 0.5% -21.2% 18.6% 20.9% -6.3% 0.0% -1.0%
Total Vic -10.8% -3.7% 2.4% -31.4% 5.4% -10.4% 14.1% 10.2% -20.6% -5.3% -5.9%
Auctions Plus -7.8% 99.8% 55.6% 49.2% 42.0%
Vic Herd -9.5% 0.4% -4.8% 8.2% 3.6% 2.8% -0.3% -2.1% -0.4% -0.2%
Sources: LSAV, RLX, Scanclear, Auctions Plus, ABS, ACA
*YOY change data not avai lable for Hami l ton FY2013/14

3 5 | L O C A L L I V E S T O C K M A R K E T A N A L Y S I S
This supports anecdotal evidence including submissions from agents, that the larger markets are
recognised as having increased competition, better prices and are therefore attracting greater
numbers from sellers. It is expected that this trend will not only continue but will likely increase with
the proposed construction of large regional yards at Mortlake and Ballarat. Not only is this a threat
to Geelong saleyards, but other council based yards in Victoria, namely the Ballarat and Mortlake
catchment areas, will be under pressure.
Looking at the selected individual Western district saleyard throughput as a trend index in
comparison to Victorian throughput and the Victorian cattle herd from 2003 to 2016 shows that the
ACGR performance is replicated with Ballarat and Warrnambool leading the pack. In contrast, the
Geelong saleyard the clear laggard, somewhat replicating the decline in total Victorian cattle
throughput (Figure 27).
Figure 27. Victorian cattle trend indices since 2003
Table 9 outlines the ACGR and simple average calculations for sheep/lamb throughput at the
selected Western district saleyards compared to total Victorian throughput, Auctions Plus sales and
the Victorian flock size from 2000 to 2016. As for cattle, the entire year on year table is available to
view in the appendix.

3 6 | L O C A L L I V E S T O C K M A R K E T A N A L Y S I S
Table 9. Year on year change to throughput, herd size and growth rates for Victorian sheep and lamb 2000 - 2016
Markedly, the Ballarat saleyard leads the table on an ACGR basis at 1.9% followed closely by
Horsham at 1.2%. Interestingly, all of the saleyards selected for this analysis have achieved an
increase on their respective ACGR figures apart from Geelong, recording a 7.6% decline (Figure 28).
It should be noted that in this comparison of saleyards in the region, Geelong is the smallest yard,
with the closest in number being Horsham with almost 10 times the Geelong sheep & lamb
throughput.
Figure 28. Change in sheep/lamb throughput 2001 - 2016
The trend indices analysis for sheep and lamb since 2003 shows the majority of selected saleyards
mirroring the Victorian throughput pattern, although Bendigo has drifted closer to the trend in flock
numbers most recently. In stark contrast is the sharp decline in the trend index for Geelong since
2006 onwards (Figure 29).
Since 2010, year on year throughput for Geelong has been negative, and while the comparative
saleyards have also had years of decline, these have been balanced by increases reflecting the
FY2008 FY2009 FY2010 FY2011 FY2012 FY2013 FY2014 FY2015 FY2016 Average ACGR
Ballarat -5.3% 4.2% -9.9% -8.6% 9.8% -6.7% 8.8% 10.5% -7.5% 2.6% 1.9%
Geelong -46.4% 13.6% -19.5% -15.4% -10.3% -15.4% -1.9% -15.3% -1.8% -6.4% -7.6%
Hamilton -2.0% 12.2% -11.0% -9.1% 3.1% 0.8% -4.1% 6.8% -1.4% 0.6% 0.3%
Bendigo -1.8% -1.4% -23.6% -1.6% -2.2% 7.4% 7.6% -7.0% -6.7% 1.6% 0.5%
Horsham -5.8% 19.0% -2.9% -6.3% -9.7% -2.6% 12.5% -6.9% -10.3% 2.2% 1.2%
Total Vic -5.4% 14.1% -14.2% -14.2% 1.2% 16.7% 3.4% 4.4% -4.8% 0.3% -0.3%
Auctions Plus 103.7% 37.4% 64.1% 68.4% 66.2%
Vic Flock -2.4% -10.0% -4.7% 5.8% 4.7% 0.9% -4.4% -5.2% -2.6% -2.7%
Sources: LSAV, RLX, Scanclear, Auctions Plus, ABS, ACA

3 7 | L O C A L L I V E S T O C K M A R K E T A N A L Y S I S
seasonal impact on the flock and therefore available sale numbers. In fact, the net average of these
yards is positive, as is the ACGR. With the Victorian flock stable over this period, this is leading to
the conclusion that there is a move to the larger yards at the expense of saleyards like Geelong.
Figure 29. Victorian sheep trend indices
The following series of charts show a long-term trend index pattern from 2000 to 2016 for the
selected Western district saleyards based on each NRM region overlaid with the Victorian herd/flock
trend index and the herd/flock trend index for the respective NRM region relevant to the sale yard.
Accompanying the long-term chart is a short-term visual which shows the index patterns from 2008
to 2016. The base year of 100 on the indices for these charts has been set at 2008 as that was the
first season that ABS began to collect data based on the NRM regions.
Since 2012 Geelong cattle throughput has shown some positive growth, albeit from quite a low base
increasing from 5,201 to 8,744 head in 2016. The visual snapshot from the shorter timeframe (2008
to 2016) potentially overstates the improved cattle throughput for Geelong when comparing the
trend indices due to the relatively low cattle numbers going through during 2011 and 2012. Taking
into account the longer-term picture from 2000 to 2016 gives a better indication of the increased
throughput required to return the Geelong saleyard to cattle numbers experienced between 2000
and 2005. Indeed, current numbers would have to triple to return it to levels seen during 2000.
The trend indices In Figure 30 and 31 show that growth in Corangamite beef herd numbers have
been unable to keep pace with the broader Victorian herd. Despite the lower Corangamite herd
numbers and a declining Victorian throughput trend for cattle the Camperdown sale yard has been
able to sustain reasonable growth in throughput numbers.

3 8 | L O C A L L I V E S T O C K M A R K E T A N A L Y S I S
Figure 30. Corangamite beef cattle indices 2000 – 2016 Figure 31. Corangamite beef indices 2008 – 2016
Beef cattle numbers in Glenelg Hopkins have tracked closer to the broader Victorian cattle herd
trend (Figure 32 and Figure 33). The cattle throughput trend for Warrnambool showing
improvement during 2015 and managing to hold onto the gains in throughput into 2016 as Hamilton
and Geelong cattle yarding declined in line with lower Victorian throughput figures.
Figure 32. Glenelg Hopkins beef cattle indices 2000 – 2016 Figure 33. Glenelg Hopkins beef cattle indices 2008 – 2016
North Central beef cattle herd trend index outperforming the index for the broader Victorian herd
for much of the last five years, only to give away these gains in the 2015 season. Growth in cattle
throughput for the Ballarat sale yard is evident since 2010, with the longer-term index pattern for
Ballarat mirroring the relative stability of the pattern set by the Victorian herd index (Figure 34 and
Figure 35).

3 9 | L O C A L L I V E S T O C K M A R K E T A N A L Y S I S
Figure 34. North Central beef cattle indices 2000 – 2016 Figure 35. North Central beef cattle indices 2008 – 2016
The trend index pattern for Ballarat sheep and lamb throughput closely following the Victorian
throughput pattern, somewhat unsurprising given the size of Ballarat sale yard’s sheep and lamb
figures. Despite the 2011 seasonal boost Corangamite sheep and lamb flock index trend has declined
since 2008. Geelong saleyard sheep and lamb throughput shows a fairly steady declining trajectory
to the trend index since 2009, despite the Victorian sheep and lamb flock numbers stabilising during
this time (Figure 36 and Figure 37).
Figure 36. Corrangamite sheep/lamb indices 2000 – 2016 Figure 37. Corrangamite sheep/lamb indices 2008 – 2016
The trend index for Hamilton sheep and lamb throughput mirrors Victorian throughput in a similar
fashion to the Ballarat sale yard. The Glenelg Hopkins sheep and lamb flock trend also not too dis-
similar to the pattern displayed by the Corangamite trend, although managing to hold up a little
better during the 2015 season (Figure 38 and Figure 39).

4 0 | L O C A L L I V E S T O C K M A R K E T A N A L Y S I S
Figure 38. Glenelg Hopkins sheep/lamb indices 2000 – 2016 Figure 39. Glenelg Hopkins sheep/lamb indices 2008 – 2016
The index trend for the North Central sheep and lamb flock the only NRM region to register a 2015
figure above the broader Victorian sheep and lamb flock trend, albeit marginally. Despite the NRM
flock numbers keeping pace with the Victorian flock the Bendigo sale yard has been unable to
capitalise on the situation displaying a steadily declining index trend since 2007 (Figure 40 and Figure
41).
Figure 40. North Central sheep/lamb indices 2000 – 2016 Figure 41. North Central sheep/lamb indices 2008 – 2016
Livestock Sale Methods The declining annual compound growth rate (ACGR) for both Victorian cattle and sheep/lamb
throughput of 5.9% and 0.3%, respectively, is indicative of a move towards online and direct from
paddock sales in more recent times.
Indeed, as outlined in Table 8, the 42% ACGR in Auctions Plus cattle throughput in the Western
Victorian region comes at a time when the Victorian cattle herd is relatively stable with a negative
ACGR of 0.2% for the 2000 to 2015 period. Measuring the ACGR for the Victorian cattle herd from
2013 onwards to compare similar time frames to the Auctions Plus ACGR measurement shows a
negative ACGR of 1.2%, showing that Auctions Plus has been able to achieve good sales growth in
the Western Victorian region despite slightly softer herd growth.

4 1 | L O C A L L I V E S T O C K M A R K E T A N A L Y S I S
Similarly, the Auctions Plus ACGR for sheep/lamb sales in the Western Victorian region of 66.2% has
been achieved with the Victorian flock ACGR posting a negative ACGR of 2.7% for the 2000-2015
period (Table 9 and Table 14). Measuring the ACGR for the Victorian sheep and lamb flock since
2013 shows a negative ACGR of 4.8%, highlighting that the growth in Auctions Plus sales volumes
were achieved despite an increasing rate of decline in the Victorian sheep and lamb flock in more
recent years.

4 2 | L O C A L L I V E S T O C K M A R K E T A N A L Y S I S
Vision and Objectives for Local Livestock Market
Requirements to Service Small or Part-time Farmers The demographic of farms in the City of Greater Geelong saleyard catchment has been evolving into
smaller holdings over time; this trend is likely to continue. The growth in peri-urban farms provides
many challenges; in the Geelong Saleyards catchment area, it is magnified as the impact from the
declining support of traditional farmers has exposed the viability of the yards where it is now
principally reliant on small scale stock sellers.
In the future, any larger scale farms close to Geelong will either be sold as farmers retire or be left to
beneficiaries in the event the current owner deceases. In many instances the beneficiary will be
required to make a payment to other siblings; with land values in the region making any return from
traditional farm practices problematic, a sale of a sub-divided property is most likely.
This will ensure that the region will continue to at least retain the current number of “small” farms,
in fact they can reasonably be expected to increase in number. These small holdings are likely to
elect to run livestock as a cropping business would be difficult given machinery requirements.
This demographic of small scale or peri-urban farmers has become accustomed to using the City of
Greater Geelong saleyards, it is convenient to deliver small loads to the saleyards. The City of
Greater Geelong yards provide further attraction by allowing stock to be delivered on Sunday night
for sale on Monday. Ballarat prime cattle sale is also held on Monday’s with delivery able to be made
on Sunday.
Small farmers need a ready access to either buy or sell livestock to assist in the care and
management of their small holdings. For example, in the Spring when grass growth is plentiful
buying stock to control the growth or generate an income would be the action. Later on, perhaps in
the Autumn, these stock would be sold for profit, or would need to be de-stocked as the grass had
become dormant and feeding was required.
Future Requirements for Providing Livestock Trading Facility The solution to providing services to small farms regarding livestock sales is not in the current
model of city or region based saleyards. These yards are principally designed to provide a service to
larger scale farm businesses; small holdings have utilised the service but this has been possible due
to the support of larger producers and therefore to the benefit of the small producer.
Without large scale farmers supporting the yards ongoing success is difficult for any traditional
model of livestock sale facility.
Traditional saleyards rely on large numbers to remain viable. This is currently being evidenced via
the ongoing rationalisation of small saleyards into larger regional facilities.
While it will be possible for small operators to use the regional saleyards, the reality is that this
option in the future will be more problematic. This will lead to increased sales via informal and
unregulated methods and other opportunities. This is not in the long-term interest of the livestock
industry with the probability of animal welfare, disease management and traceability becoming
further compromised.

4 3 | L O C A L L I V E S T O C K M A R K E T A N A L Y S I S
While there is strong vocal support to maintain the existing saleyards to meet the small farm
requirements, this is more based on comfort with the status quo and a fear of change than the
reality of what is “fit for purpose”.
The existing yards evolved to meet the needs of “professional” farmers who were well organised to
provide all other animal husbandry requirements, with the saleyards providing one component of
their management requirements.
The large-scale producer in the G21 region has now moved on to larger selling centres, with no
impediment or resistance to freighting livestock for up to 2 hours to access better markets. There is
nothing to suggest that a revived Geelong Saleyards will attract then back. Indeed, the trend looks
set to continue with large regional yards continuing to attract stock numbers.
The farming group in the Geelong area that now requires a livestock exchange, has a diverse range
of needs that by nature they find difficult to meet.
Shearing and crutching services, as well as animal husbandry (parasite and worm control)
requirements and general skills required to manage livestock are all a challenge for many who have
chosen the farm lifestyle while remaining employed in the city.
Optimal Livestock Facility A future facility should focus on providing a holistic approach to the needs of the small farmer
group, with all ancillary livestock management needs catered for providing a “one-stop shop”. As
an example, a service that provided a purchaser of store sheep at the market with shearing,
drenching and parasite control would make the term the sheep were grazing until sale in the future
an enjoyable exercise with minimal input from the lifestyle farmer.
As a response to the small farmer, the opportunity to buy/sell goats, alpacas, and any other grazing
livestock should be provided, with consideration for holding the sale on Saturday to encourage
participation. This model would lend itself to the provision of value add private sector services such
as education forums and workshops to improve the knowledge and skills of the peri-urban farmer.

4 4 | L O C A L L I V E S T O C K M A R K E T A N A L Y S I S
Options for Sale Facility for Geelong Region
Based on the findings in this study, the following options were identified as areas of further
investigation to support livestock sales in the Geelong region.
Co-operative Operated Saleyards It is wholly possible for a co-operative could be formed by current saleyard users to manage the
Geelong saleyard. A co-operative model could involve the council either providing a commercial
lease, or an outright sale of the facility to a co-operative group.
While this idea solves many problems, the planning and execution of a co-op model will be difficult.
Currently there are a group of peri-urban producers who have indicated strong support for the
Geelong Saleyards, but as yet they are not in any formal co-operative group.
This may be facilitated by the City of Greater Geelong in the future, it would however need a
detailed plan and significant investment to deal with the OH&S and maintenance issues if the
current yards were to be included.
There is no current precedent for this in Australia, however the nearest similar model is Ouyen
Saleyards.
Further investigation
Contact with Ouyen Saleyards CEO to discuss the Board of Management structure operating to
manage the Ouyen Saleyards with a view to identify if any of their current operating model has
possibilities for C of GG.
Transit Stock Hub A central point for collection of stock for on-route delivery to a larger regional saleyard would
provide a service to the peri-urban farmer.
Further investigation
A need to assess the demand for the hub, as well as identify infrastructure requirements to provide
this service should be completed. It should also be identified if the current Geelong saleyards can
provide the infrastructure necessary to receive and aggregate stock for on boarding.
This would also canvas the suitability of the current saleyards, the requirement for any infrastructure
investment, and the identification of suitable private providers.
Direct Sales It is possible that a local meat processor could offer pricing for small lots aggregated to a central
delivery.
Further investigation
Research to identify interested meatworks, as well as the infrastructure requirements should be
followed through to identify if this option could be suitable.
Any other existing models should be explored to understand the pricing models used, and if
weighing of stock is performed.

4 5 | L O C A L L I V E S T O C K M A R K E T A N A L Y S I S
Private Equity Purchase/Development of Sale Facility It could be that private equity would provide a livestock selling facility that meets the needs of the
G21 region.
Further investigation
Engagement with other shires in the G21 region to look at the possibility of either selling or leasing
the existing yards to a private provider, or providing land in the region for the construction of a
bespoke livestock facility.
Currently there is little appetite from private equity to be involved in the existing saleyard, however
a clear business model detailing the specific requirements of the G21 region would identify if this
model has potential and if it may be attractive to private investors.
Existing Colac Saleyards The Colac City saleyards is on the outskirts of the city and is predominately a cattle selling centre
operating on a weekly basis. The yards have 138 cattle pens under cover, a water collection system,
solar electricity generation and a modern weighing system as well as 80 holding yards.
It is considered to be at the leading edge of cattle auction sale facilities with soft flooring installed, is
under cover and operates under an audited Quality Assurance system.
Colac also has sheep & goat selling pens in good order with capacity for approximately 3,000 head.
The sheep & goat selling facility is not currently in use.
Colac Shire have the intention to continue to invest in the yards, aiming to at least maintain
throughput and to attempt to re-start sheep sales.
As with other saleyards in Victoria, Colac is currently under pressure to maintain throughput with
the expectation that the large regional yards will challenge further in the future.
The facility is underutilised, and has the capacity to provide both sheep and cattle selling services to
current users of the Geelong saleyard.
While the distance of 87.7 km from Geelong Saleyard is an inconvenience, the approximately 1 hour
journey is not seemed as overly onerous.
Further investigation
Colac Shire Council should be engaged to assess the appetite to provide bespoke peri-urban
livestock selling services.
On-line Sales Technology is quickly embraced by agriculture, and a case in point is on-line sale platform Auctions
Plus. After a difficult birth in 1986 as CALM (Computer Aided Livestock Marketing) - where an
organised resistance to change from existing livestock agents protecting the status quo slowed
uptake in the early years, Auctions Plus now accounts for 5pc of all non-stud cattle sold publicly last
year and almost 8pc of sheep.
Last year Auctions Plus electronically traded $460 million worth of livestock, or about 394,000 head
of cattle and 2.2m sheep.
4 6 | L O C A L L I V E S T O C K M A R K E T A N A L Y S I S
Auctions Plus “a rapidly evolving livestock marketing landscape in the next 10 to 20 years, relying
increasingly on electronic selling and a limited network of centralised super-sized saleyard sites.”15
Other factors supporting the continued growth of electronic selling include the price difference in
offering cattle via Auctions Plus at $6.50 a head compared with an average $15 in saleyards, or 70
cents/head for sheep against about $1 in most yards.
Auctions Plus engages in a wide variety of sale transactions across a variety of diverse commodities,
including sheep skins, milk, grain, stud sheep & cattle and farm machinery.
While not currently offering electronic selling for small niche stock sales to service peri-urban
producers; it is possible that in the future this bespoke service could be offered.
Further investigation
It is suggested that on-line sales providers be contacted to scope the capability to offer electronic
selling to the Geelong region. Specific focus should be on identifying:
1. The capacity to adjust/modify the on-line sales system to the challenges of selling small lots
2. The ability to provide a service that would meet the requirements of peri-urban farmers
3. The infrastructure requirements to conduct an on-line auction
Peri-urban Exchange The small farmer or lifestyle farmer demographic is significant in the City of Greater Geelong
Saleyard catchment area. These rate-payers as a group can be expected to increase over the next 10
years as larger properties in the area are sold and sub-divided.
These farmers are not generally full time on the farm, or expect to produce a sustainable income
from their activities. Due to their Monday to Friday work requirements, the lifestyle farming
activities are generally carried out on the weekends.
This lends to the offering of a Saturday market. The convenience for the sellers would be attractive,
and the opportunity for “weekend” farmers to engage with the selling process would foster ongoing
learning. A particular issue for the small farmer is government compliance in relation to
traceability of livestock movements.
Creating a livestock exchange specifically with the peri-urban farmer in mind, will also provide the
opportunity for the education of Dep of Agriculture requirements, the provision of identification
numbers (PIC numbers) and a resource to deal with any concerns or questions relating to
traceability.
Issues like Animal Welfare, biosecurity and animal husbandry can be addressed in a learning
environment improving the peri-urban farmer’s knowledge and experience, and providing greater
oversight of the livestock in the region.
This issue at the moment floats under the radar, with many stock from small producers trading on an
unregulated basis in terms of traceability. Some livestock are traded through local contacts, some via
Facebook or Gumtree, and other stock are purchased via cash transaction through established
contacts.
15 Anna Speer, Auctions Plus, 2016

4 7 | L O C A L L I V E S T O C K M A R K E T A N A L Y S I S
This provides concerns for animal welfare, bio-security and traceability; a “fit-for-purpose” livestock
exchange will provide an easy access to small farmers and bring a greater percentage of these sales
into the spotlight.
By providing a livestock exchange that is easily accessible, additional services can be either provided
by private investment or fostered by council to assist the small farmer. Small farmers struggle with
the requirements of livestock with the need for shearing sheds, yards and livestock mustering skills
all a challenge for the weekend farmer. An exchange that is “fit-for-purpose” would foster the supply
of these services, or at least an opportunity for entrepreneurs to promote these services. Services
offered could include:
1. Shearing services, with the offer to remove the fleece of sheep purchased before they are
transported to the farm.
2. Animal health requirements including required parasite control.
3. Tagging services.
4. Mustering & freight services
5. Farm butchery workshops and services.
The result would be that a peri-urban farmer needing to purchase sheep to manage spring growth
on the farm, could buy young lambs, have them shorn and drenched for parasites, feet and general
health checked and a carrier engaged to deliver at the livestock exchange. This would provide the
prospect that the livestock would not require any further maintenance before they were sold back
into the livestock exchange later in the year. The subsequent sale could include the engagement of
the same carrier to muster and deliver the stock, all in all providing ancillary services designed to
enhance the experience of farming and to overcome challenges.
The exchange should be capable of offering for sale other livestock including alpacas and goats;
providing a complete selling/buying exchange to meet the peri-urban needs.
Further investigation
While there has been no identifiable development in Australia of this proposed model, the model
does exist in other countries where farms are small. The UK and United States have a network of sale
yards designed to accommodate small mobs.
Other suggestions for Council activities or further analysis could include:
• Scanning and traceability functions designed with peri-urban farmers and small mobs in
mind which may include engagement with Agriculture Victoria and Meat and Livestock
Australia (NLIS) to identify requirements
• Identify potential private market operators
• The range of possible livestock to be sold
• Pen or ring selling
• Opportunities for “non-traditional sales” – sales destined for slaughter outside mainstream
processor outlets.
• Value add services including private providers identified
• Engage with other G21 council members to identify the most suitable site
Case studies
1. Dumfries Mart, Galloway District, Scotland and Longtown Mart, Herefordshire, UK.

4 8 | L O C A L L I V E S T O C K M A R K E T A N A L Y S I S
Both of these sale marts are managed by CD Auction Marts, with the two saleyards only 28 miles
apart offering similar numbers and categories of livestock.
On the recent market day (Wednesday 22nd March), 57 cattle were offered at Dumfries, 829 prime
sheep, 503 hogs and 326 cast ewes and rams.
Sales are held weekly for prime stock with other special sales as required. The Auction house also
maintains a traceability and declaration service in line with the expectations or requirements of the
Agricultural Departments.
http://www.cdauctionmarts.co.uk/forms/prime_cattle.pdf
An extended service is provided to assist small farmers including scanning and sheep crutching.
2. New Holland Sale Barn, P.A. USA.
Hogs, sheep, goats, cattle and horses are all sold. The close proximity to large populations where
traditional cultures like to purchase and slaughter their stock has this sale barn evolving to cater for
buyers who wish to purchase small numbers for personal consumption.
Buyer integrity, security of payment and delivery of stock have all been issues that the New Holland
sale barn has addressed.
While these saleyards are in fact catering in the main for farmers deriving their livelihood from
livestock, the farms in their catchment area are small. This has attracted buyers who are prepared to
purchase small lots and have the capacity to freight in small numbers. These yards are also owner
operated with the yard operator providing all services including an auctioneer, settling processes
and sale reports.

4 9 | L O C A L L I V E S T O C K M A R K E T A N A L Y S I S
Conclusion
The saleyard model that has existed in Geelong for over 150 years is not the solution to the
challenge of providing a livestock exchange for the demographic existing now and into the future.
This conclusion emanates from the current lack of support from large scale farmers and the unlikely
possibility that they would return. These producers are focused on achieving the optimum return to
support the core activity of their farm. To this end they have made the decision to send larger lots of
sheep and lambs to the regional market of Ballarat based on the perception that increased numbers
at saleyards equals increased competition.
Since the closure of the cattle yards, cattle sales are either going to Colac or Ballarat; both centres
provide a significant market place that attracts greater competition. While Colac is likely to come
under pressure from the proposed Mortlake Regional Saleyard, Ballarat can expect to have an
increasingly dominant role with the construction of its new saleyard.
Due to the larger offerings, both Colac & Ballarat have a perceived advantage of greater competition
and therefore either higher or more reliable prices. This will continue to attract the producer aiming
to maximise the price.
Conversely, the peri-urban farmer has a higher focus on convenience to market over price.
This report makes no judgement on the saleyard location; given the significant investment needed to
bring the cattle yards to an acceptable level it is reasonable to assume that the decision to continue
in the present location or build a “green fields” site will be the decision of council based firstly on the
on-going need for a livestock exchange, and if agreed followed by a decision on the most
appropriate location.
Regardless, for the future viability, and to ensure support a new model is needed to service the G21
region that effectively addresses the needs of the peri-urban farmer with the larger scale producer
comfortably catered for via other offerings.

5 0 | L O C A L L I V E S T O C K M A R K E T A N A L Y S I S
Consultations List
Name Organisation Interest Method
Fiona Conroy VFF Small producers – Bellarine Meeting
Russel Coad G21 G21 Advisory Meeting
Mark Kelly G21 G21 Advisory Meeting
Ian Kelly Saleyard Users Small producers Meeting
Laurie Fitton Saleyard Manager City of GG Meeting
Peter & Jamie McConachy Charles Stewart & Co Livestock Agents Meeting
Wil Richardson Richardson & Co Livestock Agent Meeting
Graeme Richards Colac Saleyard Manager Meeting
Keith Bailey & Matt Taylor Surf Coast Shire Meeting
Helena Charles Golden Plains Shire Meeting
K McGrath Rodwells – agents Kyneton sale yards Meeting
Stuart McLean LSAV Regional Saleyards Meeting
Elaine Carbines G21 Regional Development Meeting
Tim Ellis G21 – City of Greater Geelong Regional Development Meeting
Paul Ryan Ag Live Block chain for livestock Meeting
Anna Speer Auctions Plus On-line livestock exchange Phone
Ray Clarke Westside Meats Livestock Buyer Meeting
Bob Hackett Ralph Meats Livestock Buyer Meeting
Nathan Scott AgChieve Advisor Meeting
Steve Kelly Wangaratta Chronicle Journalist Phone
Prue Lynch Ouyen Saleyards Manager Phone

5 1 | L O C A L L I V E S T O C K M A R K E T A N A L Y S I S
References
ABARES, 2016. About my region – Geelong Victoria. [Online]
Available at: http://www.agriculture.gov.au/abares/publications/aboutmyregion/vic-
geelong#agricultural-sector
[Accessed 28 03 2016].
Ainsaar, M., Shipp, P. & Brewin, D., 2014. Geelong Saleyards Feasibility Study, Greater Geelong:
Urban Enterprise.
Australian Bureau of Statistics, 2016. Regional Statistics by ASGS, 2010-2014. Canberra: s.n.
Department of Environment, Land, Water and Planning, 2017. Greater Geelong Maps - Planning
Schemes Online. [Online]
Available at: http://planning-schemes.delwp.vic.gov.au/schemes/greatergeelong/maps
[Accessed 16 March 2017].
Hassal & Associates PTY LTD, 2014. A Review and Analysis of Saleyard Marketing in Australia, Dubbo:
Hassal & Associates PTY LTD.
Kelly, S., 2016. Producers cautious on Co-op proposal. [Online]
Available at: http://wangarattachronicle.com.au/2016/03/09/producers-cautious-on-co-op-
proposal/
[Accessed 27 March 2017].
Kelly, S., 2017. Urgent action needed to save our saleyards. [Online]
Available at: http://wangarattachronicle.com.au/2017/03/17/urgent-action-needed-to-save-our-
saleyards/
[Accessed 27 March 2017].
Liburn, J. & Chadler Ford, S., 2016. Geelong Saleyards- Stakeholder Workshop Report of Outputs,
Greater Geelong: Kismet Forward .
Macedon Ranges Shire Council, 2016. Kyneton Saleyards Plan, Kyneton: Macedon Ranges Shire
Council.
P.J.YTTRUP & Assiociates PTY LTD, 2016. Geelong Saleyards Engineers Condition Report, Geelong:
City of Greater Geelong.
Productivity Commission, 2005. Trends In Australian Agriculture, Canberra: s.n.
Rowe, D. & Jacobs, W., 2007. Conservation Management Plan, Greater Geelong: City of Greater
Geelong.
Rural and Regional Affairs and Transport References Committee, 2016. Effect of market
consolidation on the red meat processing sector, Canberra: Senate.
Rural Industries Research and Development Corporation, 2005. Small Farms- valued contributors to
health rural communities, Canberra: Australian Government.
Vaughan, N., 2014. Greater Geelong Region Profile. Greater Geelong: s.n.

5 2 | L O C A L L I V E S T O C K M A R K E T A N A L Y S I S
Appendix Table 10. Income and expenditure for Geelong Saleyard FY2006 - FY2016
Financial Year 2005/06 2006/07 2007/08 2008/09 2009/10 2010/11 2011/12 2012/13 2013/14 2014/15 2015/16
Income
Activities & Programs
Fees/General income
253,175 279,775 141,396 134,142 132,201 97,852 100,550 134,012 149,842 158,719 143,975
Truck wash 3,465 12,665 12,503 13,897 16,813 15,358 22,555 22,747 24,750 25,931
Facilities - Casual hire 1,380 1,380 1,380 1,580 1,580 1,496 1,755 2,066 -61
Lease income 7,548 7,824 8,304 8,304 12,384
Total Income 254,555 284,620 155,441 148,225 147,678 116,161 125,211 166,457 180,832 191,773 182,290
Expenditure
Staff Costs 131,554 149,705 134,354 140,634 149,496 159,268 158,739 163,957 178,751 176,322 183,957
Training & Development 364 1,123 1,289 417 -234 794 174 395
Contractors 70,010 58,584 32,741 11,699 33,254 47,412 45,159 45,478 67,211 61,583 80,295
Vehicle costs 13,787 14,572 15,869 20,856 21,304 21,515 21,324 31,508 31,095 31,600 31,850
Depreciation 38,662 40,325 41,266 25,209 27,551 28,728 29,147 27,887 25,521 58,151 62,367
Leases 21,273 15,600
Utilities 37,368 38,685 33,634 33,956 41,501 58,923 55,700 56,168 64,293 54,553 57,160
Internal other expenses 2,929 1,330 1,247 1,004 3,581 1,156 1,187 1,183 972 207
Other Expense items 29,447 27,963 36,410 29,989 14,302 14,526 7,862 7,823 7,061 15,124 11,439
Total Expenditure 321,192 333,886 296,893 264,007 309,685 333,719 319,087 350,402 375,289 398,305 427,670
Net Balance -66,637 -49,266 -141,452 -115,782 -162,007 -217,558 -193,876 -183,945 -194,457 -206,532 -245,380
Income and Expenditure (2005/06-2015/16)

5 3 | L O C A L L I V E S T O C K M A R K E T A N A L Y S I S
Table 11.
Table 12.
Saleyard throughput volumes and herd size - Victorian cattle
FY2000 FY2001 FY2002 FY2003 FY2004 FY2005 FY2006 FY2007 FY2008 FY2009 FY2010 FY2011 FY2012 FY2013 FY2014 FY2015 FY2016
Ballarat 57,994 48,649 41,659 62,416 61,860 54,644 61,087 74,810 61,087 56,915 46,774 50,191 53,883 53,343 55,826 71,296 66,938
Geelong 28,818 21,047 21,911 20,780 20,930 18,675 17,266 18,616 8,987 8,303 6,841 5,151 5,201 8,160 9,284 11,372 8,744
Colac 50,330 41,076 37,553 48,675 55,114 50,773 48,557 59,617 44,284 51,599 46,156 47,783 42,462 36,347 38,691 45,540 40,892
Hamilton 50,883 48,989 39,668 49,520 62,742 60,864 51,729 47,836 46,776 47,776 42,897 45,590 41,273 - 36,192 47,396 38,982
Warrnambool 89,011 81,607 79,511 104,741 113,864 114,956 102,275 118,044 102,872 106,145 99,722 88,666 85,873 78,676 79,970 98,590 97,865
Camperdown 59,192 59,071 49,606 63,703 67,237 58,805 53,250 57,942 44,394 50,294 46,869 46,551 46,786 36,888 43,763 52,912 49,564
Total Vic - - - 1,222,915 1,089,433 1,032,290 803,907 915,454 816,280 785,977 805,193 552,417 582,437 522,034 595,466 656,242 520,999
Auctions Plus - - - - - - - - - - - - - 6,858 6,325 12,635 19,655
Vic Herd 4,263,700 4,405,500 4,412,500 4,387,600 4,280,600 4,509,000 4,403,000 4,243,000 3,838,000 3,854,000 3,668,000 3,970,000 4,114,000 4,229,000 4,217,692 4,128,535 -
Sources: LSAV, RLX, Scanclear, Auctions Plus, ABS, ACA
*Throughput data not avai lable for Hami l ton FY2013
Saleyard throughput volumes and flock size - Victorian sheep and lamb
FY2000 FY2001 FY2002 FY2003 FY2004 FY2005 FY2006 FY2007 FY2008 FY2009 FY2010 FY2011 FY2012 FY2013 FY2014 FY2015 FY2016
Ballarat 1,017,032 1,126,330 1,210,787 1,522,874 1,346,853 1,262,140 1,520,078 1,516,393 1,436,242 1,496,762 1,347,934 1,232,545 1,353,088 1,261,815 1,372,287 1,516,526 1,402,315
Geelong 174,338 160,790 170,890 163,467 116,742 129,892 148,640 175,645 94,197 106,964 86,101 72,855 65,383 55,302 54,253 45,937 45,092
Hamilton 950,061 980,322 959,064 1,120,536 1,011,245 1,047,226 983,618 1,068,479 1,047,593 1,175,076 1,045,916 951,202 980,419 988,578 948,253 1,013,020 998,439
Bendigo 963,309 1,244,810 1,432,342 1,472,388 1,027,832 1,236,229 1,398,711 1,464,249 1,437,449 1,416,821 1,082,789 1,065,668 1,042,457 1,119,952 1,205,339 1,120,485 1,045,648
Horsham 385,217 549,170 536,487 563,925 525,583 466,799 568,313 559,940 527,730 627,874 609,918 571,548 516,006 502,379 565,167 526,375 471,910
Total Vic - - 1,662,715 3,919,288 3,238,247 3,213,443 3,633,721 3,907,988 3,695,120 4,215,556 3,616,500 3,104,694 3,143,484 3,667,164 3,790,821 3,956,150 3,767,913
Auctions Plus - - - - - - - - - - - - - 62,429 127,174 174,757 286,830
Vic Flock 22,663,800 22,271,900 21,349,700 20,388,300 19,978,300 20,575,000 17,909,000 17,174,000 16,765,000 15,082,000 14,378,000 15,212,000 15,928,000 16,067,032 15,365,155 14,572,262 -
Sources: LSAV, RLX, Scanclear, MLA, ABS, Auctions Plus, ACA

5 4 | L O C A L L I V E S T O C K M A R K E T A N A L Y S I S
Table 13.
Table 14.
Year on year change to throughput, herd size and growth rates (2000 to 2016) - Victorian cattle
FY2001 FY2002 FY2003 FY2004 FY2005 FY2006 FY2007 FY2008 FY2009 FY2010 FY2011 FY2012 FY2013 FY2014 FY2015 FY2016 Average ACGR
Ballarat -16.1% -14.4% 49.8% -0.9% -11.7% 11.8% 22.5% -18.3% -6.8% -17.8% 7.3% 7.4% -1.0% 4.7% 27.7% -6.1% 2.4% 0.8%
Geelong -27.0% 4.1% -5.2% 0.7% -10.8% -7.5% 7.8% -51.7% -7.6% -17.6% -24.7% 1.0% 56.9% 13.8% 22.5% -23.1% -4.3% -6.8%
Colac -18.4% -8.6% 29.6% 13.2% -7.9% -4.4% 22.8% -25.7% 16.5% -10.5% 3.5% -11.1% -14.4% 6.4% 17.7% -10.2% -0.1% -1.2%
Hamilton -3.7% -19.0% 24.8% 26.7% -3.0% -15.0% -7.5% -2.2% 2.1% -10.2% 6.3% -9.5% 31.0% -17.8% 0.2% -1.6%
Warrnambool -8.3% -2.6% 31.7% 8.7% 1.0% -11.0% 15.4% -12.9% 3.2% -6.1% -11.1% -3.2% -8.4% 1.6% 23.3% -0.7% 1.3% 0.6%
Camperdown -0.2% -16.0% 28.4% 5.5% -12.5% -9.4% 8.8% -23.4% 13.3% -6.8% -0.7% 0.5% -21.2% 18.6% 20.9% -6.3% 0.0% -1.0%
Total Vic -10.9% -5.2% -22.1% 13.9% -10.8% -3.7% 2.4% -31.4% 5.4% -10.4% 14.1% 10.2% -20.6% -5.3% -5.9%
Auctions Plus -7.8% 99.8% 55.6% 49.2% 42.0%
Vic Herd 3.3% 0.2% -0.6% -2.4% 5.3% -2.4% -3.6% -9.5% 0.4% -4.8% 8.2% 3.6% 2.8% -0.3% -2.1% -0.4% -0.2%
Sources: LSAV, RLX, Scanclear, Auctions Plus, ABS, ACA
*YOY change data not avai lable for Hami l ton FY2013/14
Year on year change to throughput, herd size and growth rates (2000 to 2016) - Victorian sheep and lamb
FY2001 FY2002 FY2003 FY2004 FY2005 FY2006 FY2007 FY2008 FY2009 FY2010 FY2011 FY2012 FY2013 FY2014 FY2015 FY2016 Average ACGR
Ballarat 10.7% 7.5% 25.8% -11.6% -6.3% 20.4% -0.2% -5.3% 4.2% -9.9% -8.6% 9.8% -6.7% 8.8% 10.5% -7.5% 2.6% 1.9%
Geelong -7.8% 6.3% -4.3% -28.6% 11.3% 14.4% 18.2% -46.4% 13.6% -19.5% -15.4% -10.3% -15.4% -1.9% -15.3% -1.8% -6.4% -7.6%
Hamilton 3.2% -2.2% 16.8% -9.8% 3.6% -6.1% 8.6% -2.0% 12.2% -11.0% -9.1% 3.1% 0.8% -4.1% 6.8% -1.4% 0.6% 0.3%
Bendigo 29.2% 15.1% 2.8% -30.2% 20.3% 13.1% 4.7% -1.8% -1.4% -23.6% -1.6% -2.2% 7.4% 7.6% -7.0% -6.7% 1.6% 0.5%
Horsham 42.6% -2.3% 5.1% -6.8% -11.2% 21.7% -1.5% -5.8% 19.0% -2.9% -6.3% -9.7% -2.6% 12.5% -6.9% -10.3% 2.2% 1.2%
Total Vic -17.4% -0.8% 13.1% 7.5% -5.4% 14.1% -14.2% -14.2% 1.2% 16.7% 3.4% 4.4% -4.8% 0.3% -0.3%
Auctions Plus 103.7% 37.4% 64.1% 68.4% 66.2%
Vic Flock -1.7% -4.1% -4.5% -2.0% 3.0% -13.0% -4.1% -2.4% -10.0% -4.7% 5.8% 4.7% 0.9% -4.4% -5.2% -2.6% -2.7%
Sources: LSAV, RLX, Scanclear, Auctions Plus, ABS, ACA