living cully walks report
TRANSCRIPT
Park Access in Cully Portland State University USP 430: Participatory Research Methods of Community Development Methods of Madness Tim Baker Lauren Bruschi Savannah Harris Nick McCarty Kristin Plekan Dr. Nathan McClintock Toulan School of Urban Studies and Planning
Living Cully
Living Cully Walks is a coordinated initiative that is working to
bring a diversity of travel options, improve mobility, and reduce
pollution for the residents of the Cully neighborhood. Methods of
Madness were responsible for assembling the surveys into data,
analyzing the findings, and compiling a report to be utilized by
Living Cully to improve the park access for Cully residents.
How do Cully residents access parks and open
spaces in their neighborhood?
pg. 2
Project Summary Portland State University’s USP 430 Participatory Research Methods for Community Development course
teamed up with Living Cully Walks, which is a combination of three organizations: Verde, Hacienda CDC,
and NAYA. Living Cully is a community organization that specializes in culturally specific marketing and
outreach to historically underserved communities. Their goal is to increase travel options, reduce
pollution and improve mobility and environmental amenities that support healthy livability and economic
opportunity. Verde supplies communities with outreach and advocacy, as well as social enterprise to build
environmental wealth amongst Cully residents, specifically low-‐income residents and people of color.
The PSU team, Methods of Madness, analyzed and interpreted survey information that was collected last
year by Living Cully Walks from the Cully neighborhood community. This report was produced to present
the data collected and analyze the findings. The objective for this project was to discover how Cully
residents access parks and open spaces in their neighborhood. The team was responsible for entering data
into spreadsheets, creating graphs, and interpreting the data to compose an analysis of our findings.
Results show that of those who were surveyed, over 2/3 of them were aware of the three parks referenced
in the surveys (Whitaker Ponds, Columbia Slough, and Cully Park). However, the two most preferred parks
were Fernhill Park and Rigler School. The majority of respondents, 54%, used walking as their preferred
mode of transportation to the parks. It was found that security concerns included lack of safety around
traffic and a need for more safety at night. The suggestions for improvement in infrastructure included
sidewalks, bike routes, lighting, signage, and walking routes.
pg. 3
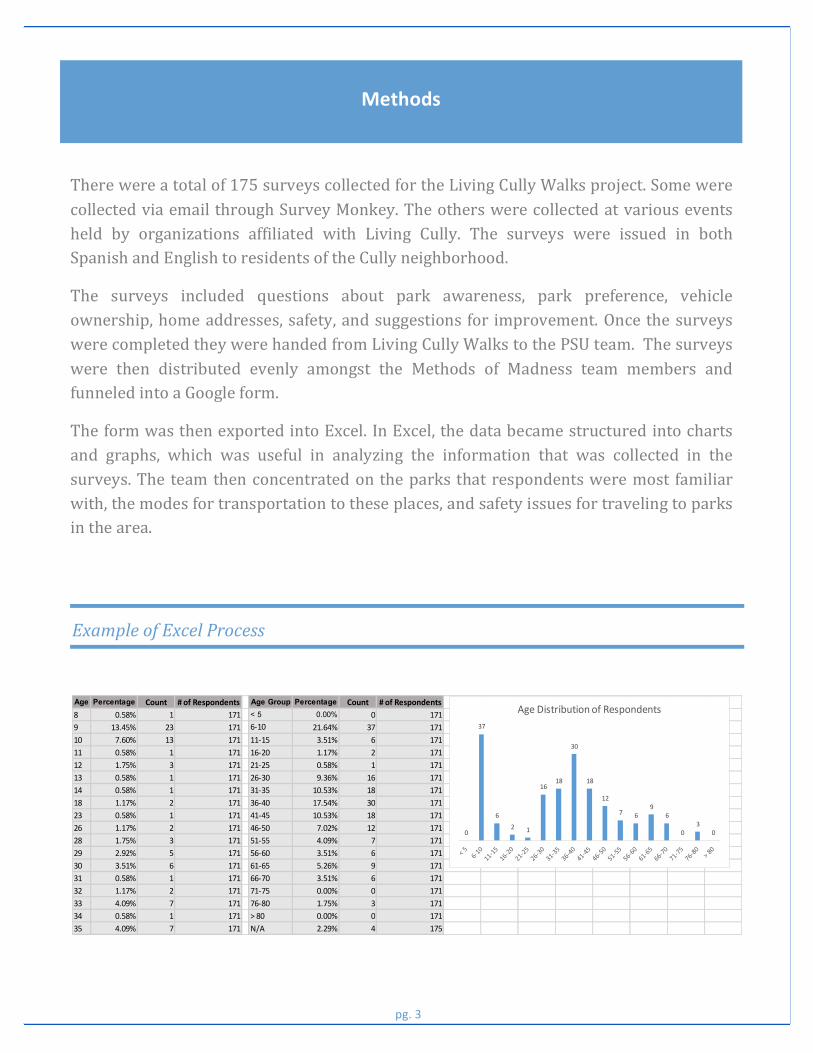
Example of Excel Process
Age Percentage Count # of Respondents Age Group Percentage Count # of Respondents8 0.58% 1 171 < 5 0.00% 0 1719 13.45% 23 171 6-‐10 21.64% 37 17110 7.60% 13 171 11-‐15 3.51% 6 17111 0.58% 1 171 16-‐20 1.17% 2 17112 1.75% 3 171 21-‐25 0.58% 1 17113 0.58% 1 171 26-‐30 9.36% 16 17114 0.58% 1 171 31-‐35 10.53% 18 17118 1.17% 2 171 36-‐40 17.54% 30 17123 0.58% 1 171 41-‐45 10.53% 18 17126 1.17% 2 171 46-‐50 7.02% 12 17128 1.75% 3 171 51-‐55 4.09% 7 17129 2.92% 5 171 56-‐60 3.51% 6 17130 3.51% 6 171 61-‐65 5.26% 9 17131 0.58% 1 171 66-‐70 3.51% 6 17132 1.17% 2 171 71-‐75 0.00% 0 17133 4.09% 7 171 76-‐80 1.75% 3 17134 0.58% 1 171 > 80 0.00% 0 17135 4.09% 7 171 N/A 2.29% 4 175
0
37
6
2 1
1618
30
18
12
7 69
6
03
0
Age Distribution of Respondents
Methods
There were a total of 175 surveys collected for the Living Cully Walks project. Some were collected via email through Survey Monkey. The others were collected at various events held by organizations affiliated with Living Cully. The surveys were issued in both Spanish and English to residents of the Cully neighborhood.
The surveys included questions about park awareness, park preference, vehicle ownership, home addresses, safety, and suggestions for improvement. Once the surveys were completed they were handed from Living Cully Walks to the PSU team. The surveys were then distributed evenly amongst the Methods of Madness team members and funneled into a Google form.
The form was then exported into Excel. In Excel, the data became structured into charts and graphs, which was useful in analyzing the information that was collected in the surveys. The team then concentrated on the parks that respondents were most familiar with, the modes for transportation to these places, and safety issues for traveling to parks in the area.

pg. 4
Park Preference/Awareness The survey asked the respondents’ level of awareness of Whitaker Ponds, Cully Park, and the
Columbia River Slough. Two-‐thirds of the respondents were aware of these parks, while most
preferred to access Fernhill Park and Rigler School. This raises the question as to why Fernhill and
Rigler were preferred by respondents.
Figure 1; The Cully neighborhood in comparison to the five of the most popular parks.
Demographic Information
The majority, 80%, of survey respondents were Caucasian and Latino.
There were a large number of respondents under the age of 16 (the majority of whom were in the 6-‐
10 age group), with the next largest represented age group being 36-‐40. However, there was a lack
of survey respondents between the ages of 15-‐25. This may be an age group to target, as their
responses could be beneficial in answering the question as to how parks can be better accessed by
Cully residents.

pg. 5
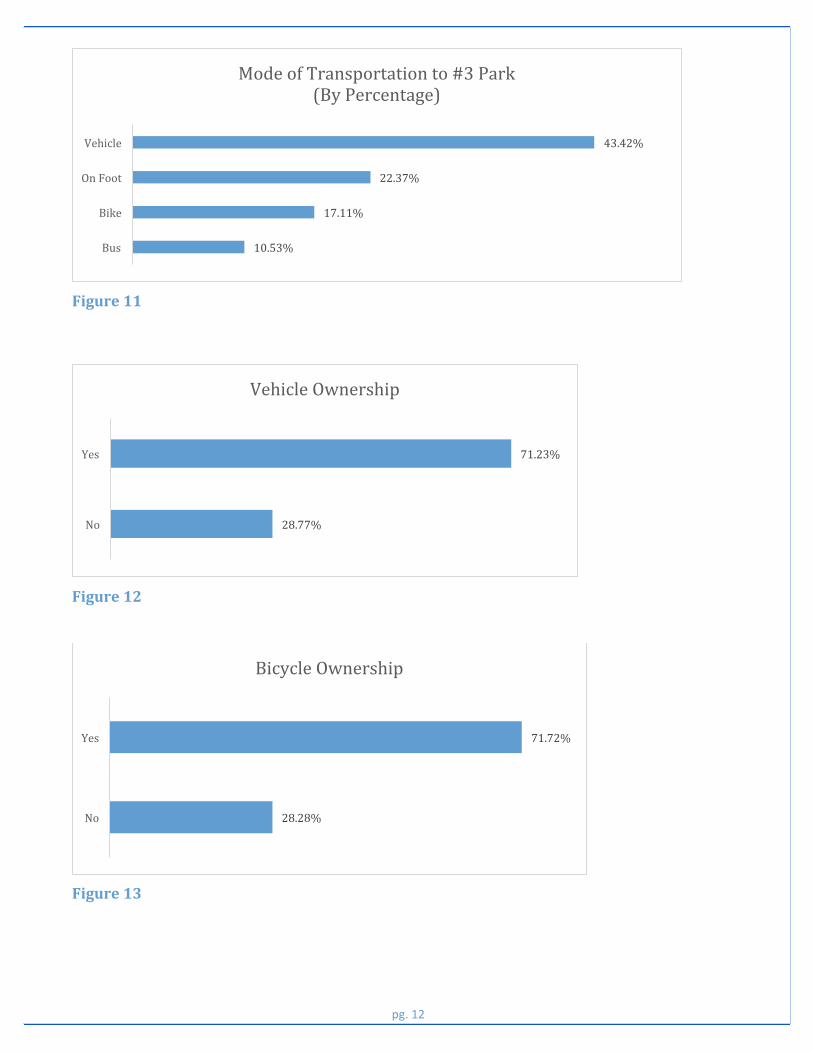
Mode of Transportation Around 54% of respondents reported walking to the park they ranked #1 in preference, while
around 25% reported walking to the parks they ranked #2 and #3 (Fig. 9, Fig. 10, Fig. 11). The
reported use of bicycles, vehicles, and public transit was higher for parks ranked #2 and #3,
indicating an increased reliance on those modes of transportation as distance to parks increased.
The graphs do not contain the various other modes of transportation mentioned by respondents,
but rather the most commonly reported ones in each ranking category. A variety of modes were
mentioned by a few of the respondents, including “skate” and “all” and such combinations of
“bike/vehicle” (Appendix).
Vehicle & Bicycle Ownership Both vehicle and bicycle ownership were above 70% for survey respondents.
This shows that many residents do not consider “lack of transportation” as a barrier to accessing
parks and open spaces in the Cully neighborhood (Fig. 12, Fig. 13).
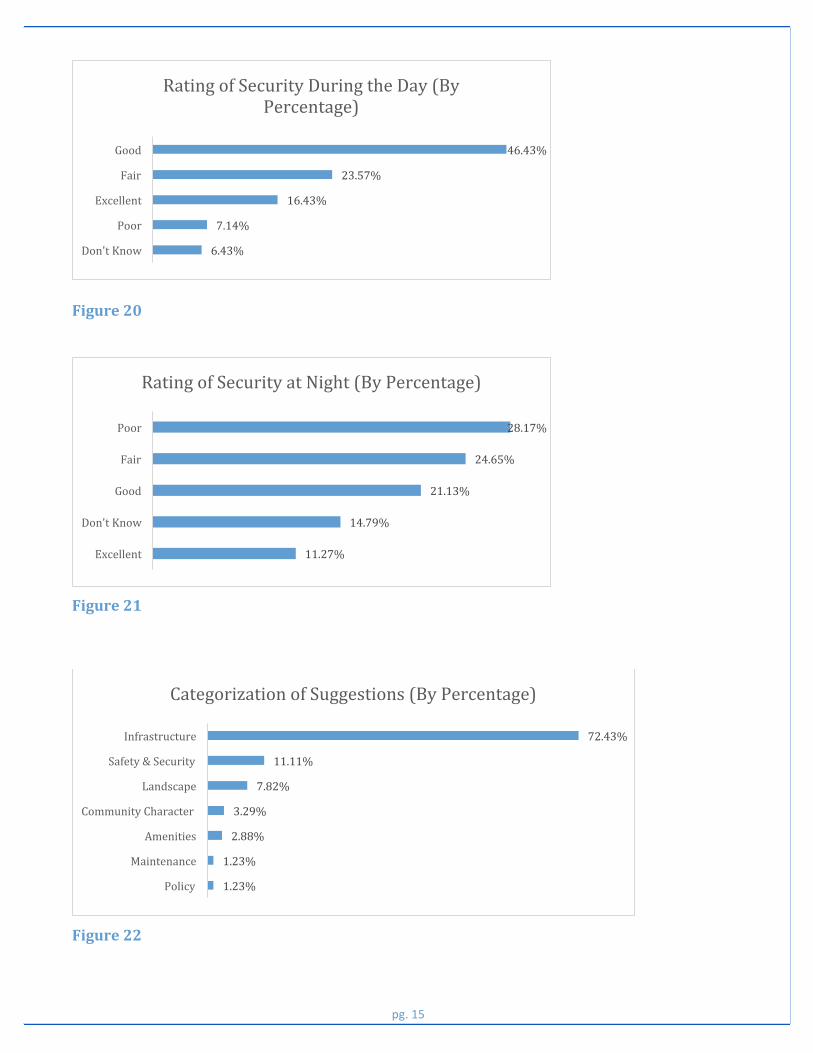
Rating of Infrastructure in Cully As Figure 20 shows, 7% of respondents rated their sense of security during the day as "poor,"
while 62% rated safety during the day as "good" or "excellent." In regards to safety at night,
almost 30% of respondents rated their sense of security as "poor," while 32% rated it as "good" or
"excellent." This tells us that there is a sharp contrast in the degrees of safety residents feel during
the day versus during the night. This could have to do with the lighting in parks being insufficient.
The contrast in the sense of security at night versus the daytime is notable, but it seems
reasonable to assume the parks are being used primarily during the day.
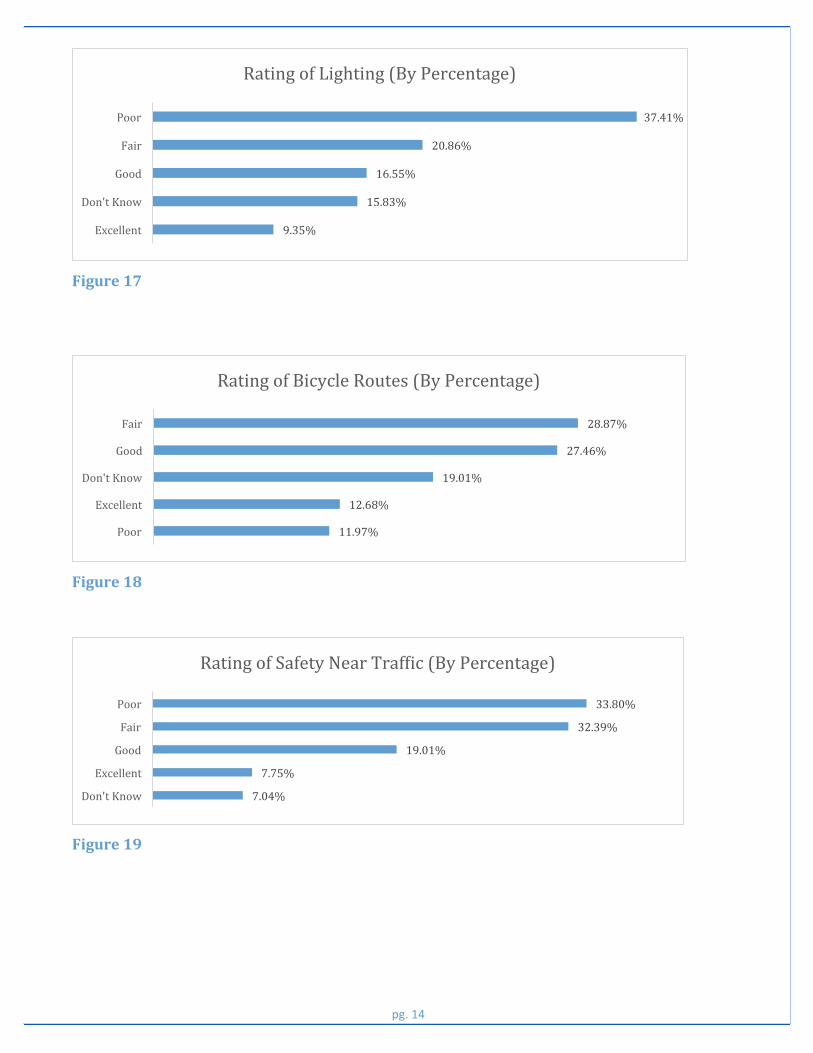
Other infrastructure that could affect safety is both signage and lighting of the parks. Signage
received either a “poor” or “fair” rating by 55% of the respondents, and less than 10% rated them
as “excellent” (Fig. 16). Lighting was rated as either “poor” or “fair” by 58% of the respondents
(Fig. 17).
Sidewalks were rated either “poor” or “fair” by 53% of the respondents and only 12% rated them
as “excellent” (Fig. 14). Crosswalks were rated as “poor” or “fair” by over 60% of the respondents
and less than 12% rated them as “excellent” (Fig. 15).

pg. 6
The ratings of the bicycle routes were split receiving a rating of either “poor” or “fair” by 40% and
a rating of either “good” or “excellent” by 40% (Fig. 18).
As Figure 19 shows, 33% of respondents rated their safety near traffic as being "poor”, while 26%
rated it as being "good" or "excellent”. The majority of respondents rated safety near traffic as
“poor”, which shows that this could be a deterrent in regards to accessing parks.
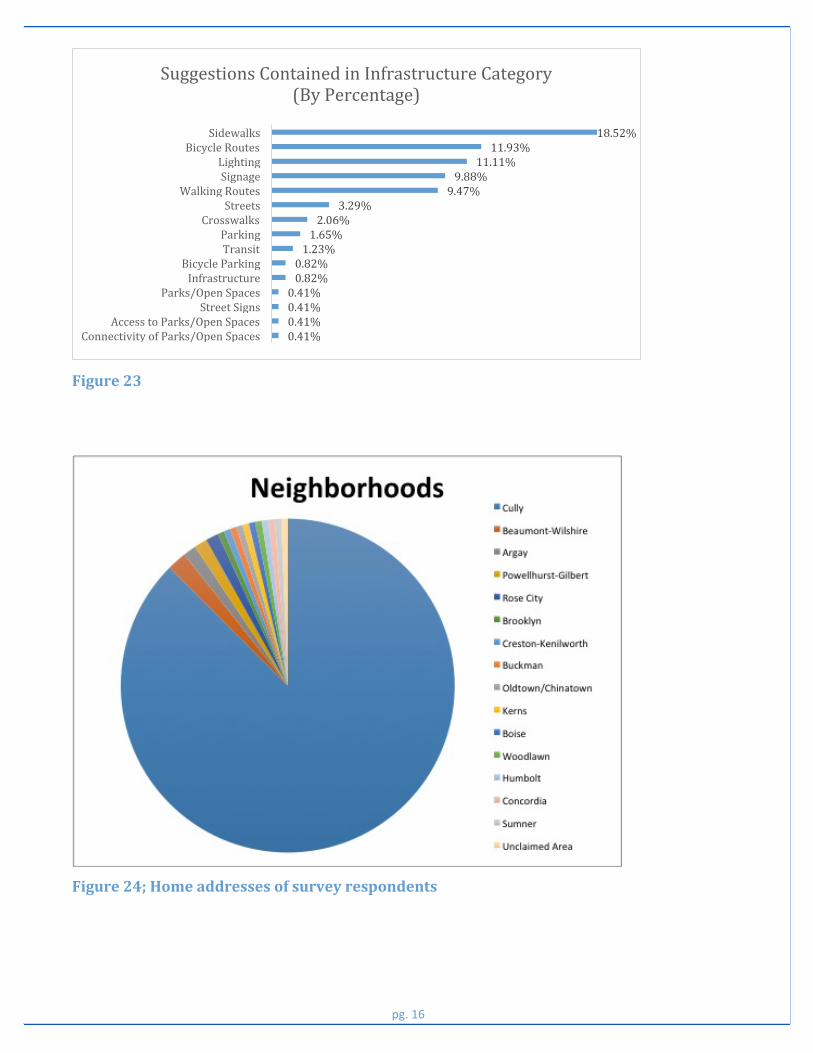
Suggestions for Improvement in Cully The main areas of concern for survey respondents were connected to infrastructure. It was the top
priority for 72% of all respondents, while safety ranked at a distant second. This implies that
respondents feel that making improvements to sidewalks, bicycle routes, lighting, signage, and
walking routes would have a positive impact on the experience and accessibility of the parks in
the Cully neighborhood (Fig. 22, Fig. 23).
Results The common themes found in the survey data include: top park preferences are located near or
within Cully’s borders, the majority of people are walking in spite of the fact vehicle and bicycle
ownership are high, and the infrastructure people use to access the parks on foot received a
“poor” or “fair” rating by the majority of respondents.
All age groups were represented with the exception of the 16-‐25 age range and senior citizens.
This may reflect flaws in the data collection or possibly raise a question as to why these age
groups are not using the parks (Fig. 2). Over two-‐thirds of the respondents were aware of the
three parks inquired by the survey. However, the two most preferred parks were Fernhill Park
and Rigler School. The majority of respondents, 54%, walked to their preferred park. This might
explain the popularity of Fernhill and Rigler School, as they are located either within Cully or on
its perimeters. Whitaker Ponds was the third most popular and its proximity to the Cully
neighborhood may be negated by the need for residents to cross the Columbia River Blvd and
Route 30. The lack of preference to the Columbia River Slough could be do to its proximity to Cully,
which would require residents to drive. While Cully Park is situated in the neighborhood, it is
lacking amenities. It is interesting to note that both vehicle and bicycle ownership of respondents
were over 70%, and yet 54% were walking to their “preferred” park. The preference of walking

pg. 7
also explains why infrastructure was the key area of concern for suggested improvements. The
majority of respondents gave the sidewalks, signage, lighting, and crosswalks a rating of “poor” or
“fair”.
Conclusion Based on our analysis of the Living Cully Walks survey data, park preference and mode of
transportation seem to be influenced by the proximity of parks to the residential locations that are
assumed to be the point of departure. Mode of transportation may also be influenced by
infrastructure. Poor sidewalks, crosswalks, signage, and lighting reduce the practicality of walking
or biking as an alternative to driving. Given the safety and security concerns, the fact that the
majority of suggestions for improvement focused on infrastructure serves to validate this point.
Problems with the data included whether or not to consider the recommendations made by
people who did not identify themselves as park users. Additionally, in categorizing the
suggestions for the parks there was no way to tell which park the respondents were referring to,
especially in the cases where they mentioned accessing more than one park. Finally, the selection
of respondents could have produced skewed data. There was a large representation of children
respondents, many of who did not fill out the survey in its entirety. This created large gaps of
information in some areas, especially in the areas where they questions may have been confusing
to that demographic. In conjunction with this, as mentioned before, we were missing other age
demographics.
Bibliography Central Northeast Neighbors. 25 Aug. 2009. City of Portland, Office of Neighborhood Involvement and Bureau of Planning and Sustainability. Map. PDF. Web. Cully Neighborhood Association. 21 Mar. 2012. City of Portland, Office of Neighborhood Involvement and Bureau of Planning and Sustainability. Map. PDF. Web. DeFalco, T., Fry, D., Teske, N. Jun. 2013. Not in Cully: Anti-‐Displacement Strategies for the Cully Neighborhood. Living Cully: A Cully EcoDistrict. PDF. Web. North Portland Neighborhood Services. 12 Feb. 2009. City of Portland, Office of Neighborhood Involvement and Bureau of Planning and Sustainability. Map. PDF. Web.

pg. 8
Appendix
Figure 2
Figure 3
45.34%
36.02%
8.07%
4.97%
2.48%
2.48%
0.62%
Caucasian
Latino
Biracial
Asian
Native American
African American
Other
Race/Ethnicity of Respondents (By Percentage)
64.96%
29.20%
5.84%
Yes
No
Maybe
Awareness of Whitaker Ponds (By Percentage)

pg. 9
Figure 4
Figure 5
65.99%
23.81%
10.20%
Yes
No
Maybe
Awareness of Cully Park (By Percentage)
64.03%
25.18%
10.79%
Yes
No
Maybe
Awareness of Columbia Slough (By Percentage)

pg. 10
Figure 6
Figure 7
27.85%
13.29%
12.66%
5.70%
4.43%
3.80%
3.80%
3.80%
Fernhill Park
Rigler School
Sacajawea Dog Park
Harvey Scott School
Whitaker Ponds
Peninsula Park
Wellington Park
Wilshire Park
#1 Park Preference (By Percentage)
20.17%
10.92%
8.40%
6.72%
4.20%
4.20%
4.20%
4.20%
Fernhill Park
Rigler School
Whitaker Ponds
Alberta Park
Columbia Slough
Harvey Scott School
Sacajawea Dog Park
Wilshire Park
#2 Park Preference (By Percentage)

pg. 11
Figure 8
Figure 9
Figure 10
12.16%
9.46%
6.76%
5.41%
5.41%
5.41%
4.05%
4.05%
Fernhill Park
Rigler School
Whitaker Ponds
Forest Park
Harvey Scott School
Wilshire Park
Columbia Slough
Sacajawea Dog Park
#3 Park Preference (By Percentage)
54.43%
29.75%
6.33%
5.70%
On Foot
Vehicle
Bike
Bus
Mode of Transportation to #1 Park (By Percentage)
40.52%
28.45%
18.97%
9.48%
Vehicle
On Foot
Bike
Bus
Mode of Transportation to Park #2 (By Percentage)
pg. 12
Figure 11
Figure 12
Figure 13
43.42%
22.37%
17.11%
10.53%
Vehicle
On Foot
Bike
Bus
Mode of Transportation to #3 Park (By Percentage)
71.23%
28.77%
Yes
No
Vehicle Ownership
71.72%
28.28%
Yes
No
Bicycle Ownership

pg. 13
Figure 14
Figure 15
Figure 16
39.16%
28.67%
13.99%
11.89%
6.29%
Poor
Good
Fair
Excellent
Don't Know
Rating of Sidewalks (By Percentage)
30.07%
30.07%
20.98%
10.49%
8.39%
Fair
Poor
Good
Excellent
Don't Know
Rating of Crosswalks (By Percentage)
38.57%
23.57%
16.43%
12.14%
9.29%
Poor
Good
Fair
Don't Know
Excellent
Rating of Signage (By Percentage)
pg. 14
Figure 17
Figure 18
Figure 19
37.41%
20.86%
16.55%
15.83%
9.35%
Poor
Fair
Good
Don't Know
Excellent
Rating of Lighting (By Percentage)
28.87%
27.46%
19.01%
12.68%
11.97%
Fair
Good
Don't Know
Excellent
Poor
Rating of Bicycle Routes (By Percentage)
33.80%
32.39%
19.01%
7.75%
7.04%
Poor
Fair
Good
Excellent
Don't Know
Rating of Safety Near Trafkic (By Percentage)
pg. 15
Figure 20
Figure 21
Figure 22
28.17%
24.65%
21.13%
14.79%
11.27%
Poor
Fair
Good
Don't Know
Excellent
Rating of Security at Night (By Percentage)
72.43%
11.11%
7.82%
3.29%
2.88%
1.23%
1.23%
Infrastructure
Safety & Security
Landscape
Community Character
Amenities
Maintenance
Policy
Categorization of Suggestions (By Percentage)
46.43%
23.57%
16.43%
7.14%
6.43%
Good
Fair
Excellent
Poor
Don't Know
Rating of Security During the Day (By Percentage)
pg. 16
Figure 23
Figure 24; Home addresses of survey respondents
18.52% 11.93%
11.11% 9.88% 9.47%
3.29% 2.06% 1.65% 1.23% 0.82% 0.82% 0.41% 0.41% 0.41% 0.41%
Sidewalks Bicycle Routes
Lighting Signage
Walking Routes Streets
Crosswalks Parking Transit
Bicycle Parking Infrastructure
Parks/Open Spaces Street Signs
Access to Parks/Open Spaces Connectivity of Parks/Open Spaces
Suggestions Contained in Infrastructure Category (By Percentage)

pg. 17
Figure 25; Home addresses of surveys respondents
Figure 26; Home addresses of survey respondents plotted in Google Maps