liverpool city council draft water efficiency plan - may 2012€¦ · water efficiency plan may...
TRANSCRIPT

Liverpool City Council Water Efficiency Plan 1
Liverpool City Council Water Efficiency Plan
May 2012

Liverpool City Council Water Efficiency Plan 2
Contents Executive Summary 3
1 - Introduction to Liverpool City Council 4
1.1 Integration of Water Efficiency and Operational plans 4
2 - Energy Management at Liverpool 5
2.1 Key Water Using Facilities 7
3 - Site Audits 8
3.1 Description of Sites 9
3.2 Historical Water Use 10
3.3 Baseline Water Use and Key Performance Indicators 11
3.4 Water Fixtures and Usage 12
3.5 Priority Water Saving Projects 17 4 - Summary of Projects for Key Sites 24 5 – Appendices 29 5.1 Water Audit Methodology 29 5.2 Water Audit reports for Key Facilities 31
Liverpool City Council Water Efficiency Plan

Liverpool City Council Water Efficiency Plan 3
Executive Summary In March 2006 Council conducted a water audit of the organization, to create a list of water management recommendations, to be incorporated into Council’s Water Savings Action Plan. During the term of this plan Council was part of several water management and efficiency programs, including the Sydney Water Every Drop Counts Program. Water-saving initiatives for both the organization and the general community included retrofits, education programs and changing works practices as part of a water demand program. During the term of Council’s Water Savings Action Plan Liverpool City Council reduced average potable water use by 13.9%. However, by 2011 the plan had run full course and a new list of actions for water efficiency was needed. This Water Efficiency Plan has been informed by the NSW Office of Environment and Heritage - Local council guidelines for Water Efficiency Plans. The process began with an audit of key sites, engaged key stakeholders in a review of water management and produced a list of key actions to help Council reduce water consumption. The result of these actions will be reported annually via Council’s management report. The 2012 Water Efficiency Plan aims to: § Set the strategic direction for Council’s water use § Provide a unified approach by Council to water conservation and
management § Identify key actions to achieve water savings § Allocate responsibility for water conservation actions to be undertaken in
relation to Council’s operations § Identify resources required to implement water saving programs.
The majority of potable water consumed in the Liverpool local government area is used by households (60.3%), followed by flats/units (12.4%), commercial sector (16.4%), industrial sector (6.6%) and finally miscellaneous uses of 4.3%. Current Council water use (averaged baseline) is approximately 454 megalitres per year. Council uses range from filling public pools, irrigating parks to flushing public toilets. The list of major water users has varied over time, and will continue to do so as facilities grow and change. Focusing on key water using facilities will enable Council to direct limited resources to where they will be of most benefit. Endorsement / Signoff of the Plan The Liverpool City Council Water Efficiency Plan provides a progressive approach to improving our local environment. On behalf of Council I am pleased to endorse the Liverpool City Council Water Efficiency Plan for the financial years of 2011/12 to 2014/15. Farooq Portelli General Manager

Liverpool City Council Water Efficiency Plan 4
Section 1- Introduction to Liverpool City Council Australians are among the highest water users in the world, making water efficiency a vital challenge for NSW. The NSW Government Sustainability Policy set a state-wide target to reduce water consumption by 15 per cent by the year 2011. Meanwhile the NSW Metropolitan Water Plan identified water efficiency as a critical to ensuring Sydney’s long-term water supplies. With this in mind Local Councils across the state have been given the task of helping to maintain and where possible improve water efficiency, for both their organizations and the community. Liverpool City Council manages a large property portfolio. Currently over 236 water meters track water deliver to Council’s 501 parks, 236 buildings and over 600 staff. In 2008 the population of the LGA was 176 903, with the population is expected to rise significantly in the next ten years. Limited resource availability will impact the growth and development of Liverpool. Liverpool City Council is committed to reducing the environmental impact of its facilities and activities, conserving resources and leading by example. In 2006 Council conducted a water audit of the organizations key facilities, to help understand the organizations water use, and created a list of recommendations for improved water management. These recommendations were incorporated into the Water Savings Action Plan for 2006/07 to 2009/10. Actions included participation in several water management and efficiency programs, including the Sydney Water Every Drop Counts Program. During the term of Council’s Water Savings Action Plan Liverpool City Council reduced average potable water use by 13.9%. However, by 2011 the plan had run full course and a new list of actions for water efficiency was needed. With this in mind Council determined a new plan was needed. 1.1 Integration of Water Efficiency and Operational Plans Integrated Environmental Sustainability Action Plan (IESAP) Liverpool City Council’s Integrated Environmental Sustainability Action Plan provides the mechanism for better integration of Council’s broad range of sustainability-based strategies/actions with Council’s corporate processes. This includes integration of the water efficiency plans or related documentation. The Liverpool City Council IESAP lists corporate environmental sustainability objectives and indicators. In the area of water management these are as follows. § Key Performance Area: Water § Objective : Reduce Council’s water use – Potable water only § Environmental Sustainability Indicator: Monitor trend in corporate and
community total annual water consumption. (Initially only potable water purchases will be reported).
Staff from relevant sections of Council will oversee the development and implementation of the water savings actions, to align with the Community Strategic Plan and Council’s Delivery Program.
Liverpool City Council Water Efficiency Plan

Liverpool City Council Water Efficiency Plan 5
Section 2 - Water Management at Liverpool Since 2006 Council has worked on a number of water-saving initiatives for both community facilities and the organisation as a whole. The 2006 Water Savings Action Plan was a medium-term plan for water conservation and demand management of Council’s operations, providing Council with a strategic direction for management until 2009/10. Planned actions included retrofits, education programs and changing works practices as part of a water demand program. The table below lists Council’s current response to management specific water conservation actions suggested by the NSW Office of Environment and Heritage.
Table 1: Management Actions for Water Savings Management System Implemented
Y / N Notes Responsible
for action A centralised record of water consumption is kept for each council site, either through recording and monitoring volumes in from bills or an electronic monitoring system.
Yes Records collected by an independent data collection agency
City Planning
Leakage is quantified for the top 20 highest water using sites every 6 months.
Yes Quantified annually, and in the billing period they occur
City Planning & City Services
Water efficiency KPIs have been calculated for all council sites and are examined every 6 months.
Yes Baseline calculations provided to facility managers. Site performance examined annually
Facility Managers
Five star water efficient fixtures are specified for every new council development or refurbishment.
Yes - partial Appropriate star- rated water efficient fixtures installed
Facility Managers
A regular, proactive maintenance regime is in place for water using fixtures at all council sites.
No Maintenance is on a needs basis
City Assets
Signage/stickers are visible in all council amenities inviting users to reduce water wastage and report leaks.
Yes - partial Trialled and in place were appropriate
City Planning
Water efficiency KPIs have been set for all facilities and are part of Operations or Facilities Managers KPIs. Staff Engagement Program is in place for council staff to target water efficiency in council operations.
Yes - partial Engagement program in place with actions under review
Facility Managers
Water consumption is monitored at all sites to identify leaks, excessive use and whether savings at project sites have been sustained.
Yes - partial Water monitoring was conducted at key sites only
City Service & City Planning
An annual council meeting is held, where project, facilities and management staff review management systems and plan implementation of actions.
No Initial meeting held 2011. Subsequent meetings yet to be held
Whole of Council
Regular meetings held with facility managers to plan actions
Yes City Planning

Liverpool City Council Water Efficiency Plan 6
In 2011 Liverpool City Council delivered the last Water Savings Action Plan report, as required under the State Government scheme. Council has reviewed the Water Savings Action Plan, to take into account changes in Council’s strategic direction, results achieved and changes in council amenities, in order to guide future water management plans. With the existing Water Savings Action Plan redundant and water efficiency a continuing priority, a new plan for water management of Council facilities is needed. This Water Efficiency Plan aims to:
§ Set the strategic direction for Council’s water use
§ Provide a unified approach by Council to water conservation and management
§ Identify key actions to achieve water savings
§ Allocate responsibility for water conservation actions to be undertaken in relation to Council’s operations
§ Identify costs and savings (water and financial) to implement water retrofits In 2010 the NSW Office of Environment and Heritage reviewed existing guidelines for local councils, to produce the Local council guide for Water Efficiency Plans. This document has informed Liverpool City Council’s water management plan. The first step in planning process is collection of water data from existing sources. This allows Council to develop an understanding of water use and prioritise key sites. Since 2009 Council has used the services of a data aggregation service. Utility data for all facilities was collected, on Council’s behalf, then analysed by the service provider to assist Council monitor key water using facilities, as well as track water use generally. From this analysis water efficiency actions can be planned. 2.1 Key (Top) Water Using Facilities Prioritisation of key sites is an important first step in creating relevant and applicable water efficiency plans. Focusing on key water using facilities enables Council to direct limited resources to where they will be of most benefit. These facilities account for over 60% of the organisations total consumption of potable water. As such water monitoring and recent water saving retrofits has focused on the list of key facilities below. § Casula Powerhouse Art Centre - 1 Casula Road, Casula
§ Council Administration Building
– Initial - 1 Hoxton Park Road, Liverpool
– Current - 33 Moore Street, Liverpool
§ Hammondville Park - Heathcote Road, Hammondville
§ Holsworthy Swimming Centre - 2 Huon Crescent, Holsworthy
§ Liverpool City Library complex (incl. carpark) - 170 George Street, Liverpool
§ Michael Wenden Aquatic Leisure Centre - 62 Cabramatta Ave, Miller
§ Rosedale Oval - Stroud Street, Warwick Farm
§ Rose Street Depot (multiple buildings) - 99 and 101 Rose Street, Liverpool
§ Whitlam Leisure Centre – 90a Memorial Ave, Liverpool

Liverpool City Council Water Efficiency Plan 7
A detailed description of each site is included in section 3 of this report, though it should be noted that: § In late 2010 the building at 1 Hoxton Park Road was almost completely destroyed
by fire and now only houses only 50 to 60 staff. The building is to be decommissioned, thus water actions on site are suspended.
§ Meanwhile Council has recently purchased an office tower at 33 Moore Street,
Liverpool. This building is scheduled for a complete retrofit, to improve functionality, including improving water and energy efficiency. Actions listed in this report may be modified as plans for building major works are completed.
§ Liverpool City Council has been collating water data for approximately 14 sites,
yet audits were limited to 9 key locations. In the case of playing fields such as Rosedale Oval, Greenway Park and South Park Council monitors irrigation and thus has reliable water use / water efficiency data (excluding the need for formal audits). In the case of branch libraries such as Moorebank and Casula, data from Planet Footprint (and audit recommendations from Liverpool City Library) are combined to exclude the need for detailed audits.
§ The list of key sites above includes large open spaces (parks and ovals).
Irrigation of these green spaces is to a significant extent determined by climatic conditions. As global temperatures rise irrigation of these areas will vary. Yet as a per-capita or point source of consumption the Whitlam Leisure Centre, Michael Wenden Aquatic Leisure Centre and Holsworthy Swimming Centre will remain Council’s sites of highest water use, by nature of their operation.
In general Council’s list of major water users has varied over time, and will continue to do so as facilities grow, change and improve their water management. Centres like the Casula Powerhouse Arts Centre have undergone major refurbishment, resulting in higher patronage and thus energy/water use. Meanwhile efficiency retrofits at the aquatic centres has reduced their water use as a portion of overall consumption. However, as a rule actions included in this Water Efficiency Plan will be limited to those for the sites listed above. Sydney Water - Every Drop Counts The ’Every Drop Counts’ program assisted Council to understand its systems for water management, through assessment, reporting and recommendations. It aimed to promote and drive improvements in water efficiency, and to reduce water use and supply costs to Council. While the program has now ceased, preparation of water efficiency audits was assisted by support from the Every Drop Counts Program.

Liverpool City Council Water Efficiency Plan 8
Section 3 - Site Audits Council’s first step in assessing water use was to utilise Planet Footprint data, to determine which sites had the highest usage of potable water (in absolute and relative terms). This list determined the sites for audit. Two levels of audit were conducted. A comprehensive water audit was conducted for Council’s administration buildings, aquatic/leisure centres and the newly refurbished Casula Powerhouse Art Centre. The comprehensive water audit involved: § On-site investigation to quantify potable water use attributable to each source § A review of the customer’s water maintenance practices. § Leakage measurement through flow monitoring. § A review of the existing water meter for adequate sizing. § A review of the customer’s water re-use arrangements (where applicable).
Water billing data for at least the two most recent years of full billing was analysed to determine average annual water consumption. Water consumption was compared with accepted standards for similar facilities, using such guides as Water Efficiency Guide: Office and Public Buildings (Department of the Environment and Heritage). The site component of the audit included inspection of the of both indoor and outdoor water fixtures, as well as an inspection of cooling towers and associated plant. The water efficiency of fixtures used in the building was assessed by examining a sample of each fixture in operation and estimating the flow rates or flush rates based on a combination of observations and known standards for high-flow taps and high-volume flush toilets. An estimate of the total water losses to leakage was also determined. Several sites benefited from remote monitoring of water meters both during and post the audit process (see section 3.5). A ‘walk-through’ audit was conducted at sports fields/parks and Rose Street Depot. The audit process at these, less complex sites reflected that of the comprehensive audits; varying only in the level of detail to which the auditors reported. From this information was calculated appropriate baseline water use levels for these sites/facilities, as well as baselines for the organisation as a whole. As part of the review of water use water-management experts then provided several recommendations on ways Liverpool City Council can save water, indicating significant water savings were possible. Council has since sought funding and resource opportunities to implement the recommendations provided. Both during and after site audits, remote 24 hour monitoring was employed at the current Council Administration Building, Casula Powerhouse Art Centre, Hammondville Park, Holsworthy Swimming Centre, Liverpool City Library complex (incl. carpark), Michael Wenden Aquatic Leisure Centre, Rose Street Depot and Whitlam Leisure Centre. Continued monitoring was a recommendation of the audits. Remote monitoring is available to all water use sites however; to date the technology has been limited to sites with sufficient staff to respond to monitoring alerts. 3.1 Description of Sites As mentioned above, prioritisation of key sites is an important first step in creating relevant and applicable water efficiency plans. The following key water using facilities were audited for water management in 2010-2011; with the exception of the recently acquired Council Administration Building at 33 Moore Street, which was audited in December 2012.

Liverpool City Council Water Efficiency Plan 9
Table 2: Description of key audit sites Site Name Site Address Site Description Casula Powerhouse Art Centre
Casula Road, Casula
Casula Powerhouse is a regional arts centre that provides facilities for theatre performances, exhibitions, functions and education programs.
Council Administration Building - Initial
1 Hoxton Park Road, Liverpool
This audit was conducted when the building comprised of three levels, indoor and outdoor car parking and landscaped areas. This Administration building was largely destroyed by fire in 2010. This facility currently provides a range of services for the local community including engineering and maintenance services.
Council Administration Building - Current
33 Moore Street, Liverpool
The building is a seven storey office complex with ground floor retail and a three storey basement carpark. Tenants include Liverpool City Council, the NSW Police service, other NSW State Government agencies and private organisations.
Hammondville Park
Heathcote Road, Hammondville
The site has five sporting fields for soccer, rugby, cricket and baseball. The site also has five netball courts, five amenities blocks, a grandstand and car park areas. The sporting fields border Moorebank Sports Club and Harris Creek Reserve.
Holsworthy Swimming Centre
2 Huon Crescent, Holsworthy
The centre has two indoor pools; a 25 meter main swimming pool and a small 8 meter teaching pool. Both pools are heated during winter. Other facilities within the centre include public change rooms (male and female), public amenities, staff amenities, reception and a kiosk selling light refreshments.
Liverpool City Library complex (incl. carpark)
170 George Street, Liverpool
The car park building has six levels with open air parking on level 5 and provides approximately 666 parking spaces. The library building is located adjacent to the car park level 1. The library has three levels with a small café on the ground floor of the library.
Michael Wenden Aquatic Leisure Centre
62 Cabramatta Avenue, Miller
The aquatic leisure centre is owned by Liverpool City Council and operated by Belgravia on Council’s behalf. The aquatic leisure centre consists of three swimming pools, which include a 50m outdoor heated pool, an indoor heated programs pool and a children’s splash pool. The aquatic leisure centre also contains a fitness centre, two indoor fitness (indoor soccer) courts, childminding area and kiosk.
Rose Street Depot 99 and 101 Rose Street, Liverpool
A total of 185 staff are employed at the depot, of this, approximately 30 staff work full time at the depot per day. The remainder of staff work on council maintenance and operations projects throughout the local community. The depot currently consists of an operations centre, trades workshop, training facilities, and mechanical workshop (with vehicle wash). Construction of a new operations centre (with amenities) is underway. The new centre will include water reuse technologies and is expected to be completed by August 2012.

Liverpool City Council Water Efficiency Plan 10
Whitlam Leisure Centre
Memorial Avenue, Woodward Park, Liverpool
The leisure centre is owned and operated by Liverpool City Council and operated by Belgravia on Council’s behalf. The leisure centre contains an aquatic centre, stadium, fitness centre and function facilities. The aquatic centre consists of a 50m outdoor heated pool, an indoor 25m heated pool, an indoor leisure pool, spa and sauna. The stadium and function facilities have seating capacities of up to 3,000 people and 3,200 guests respectively.
3.2 Historical Water Use The majority of potable water consumed in the Liverpool local government area is used by households (60.3%), followed by flats/units (12.4%), commercial sector (16.4%), industrial sector (6.6%) and finally miscellaneous uses of 4.3% (Sydney Water data for 2008–2009). Liverpool City Council uses range from filling public pools to irrigating parks and even flushing public toilets. However, Council’s aquatic centres are, for obvious reasons, large consumers of water (see section 3.3). The following tables illustrate historical water use, both within the community and for Liverpool City Council.
Table 3: Water use within Liverpool LGA
User Consumption in kL for 2010/11 Ave Prop/ Unit Cons (kL)
Commercial 55,996,259 1,280
Houses 218,858,142 211
Industrial 45,354,400 2,877
Other 21,121,196 613
Units/Flats 106,769,745 189
Total 448,099,741 Within Council itself, During the 2010/11 financial year Liverpool City Council used approximately 222,073 kilolitres of water, a reduction of approximately 19.1% over the previous year (see figure 1 below).
Fire damage to Council’s administration centre on Hoxton Park Road

Liverpool City Council Water Efficiency Plan 11
Figure 1: Liverpool City Council Water Consumption (historical)
*Note: the totals shown for the 2011-2012 financial year reflect the year-to-date only, up to December 2011 (the 2nd quarter of the financial year). Total water consumption for 2011-12 is expected to be between 338 and 472 megalitres. The 2009-2010 financial year saw a disruption to Council services, including a disruption to water monitoring/efficiency programs, due to the loss (by fire) of Council’s administration building. Water use at this time was unregulated as staff struggled with temporary facilities. Overall the rise in water use during 2009/10 seen in figure 1 is less than the increase in the size of Council. That is, in real terms Liverpool City Council has achieved a reduction in water use (per person or per square metre). This is illustrated in Council’s reduction in Baseline water use and improved Key Performance Indicator results. 3.3 Baseline Water Use and Key Performance Indicators The Baseline for Liverpool City Council as a whole may be determined as average organisational usage for the past three years. However, given the large changes that have occurred over the last three years (from fires to renovations) it is considered more accurate to compared current water use to an indicator year. Given the data above, the baseline for Council water use can be taken as the average of 2008/09 to 2010/11, excluding the anomalous 2009-10 year. This equates to a Baseline water use for Liverpool City Council of 454kL per year. The general reduction in water use highlights Council’s proactive approach to the water management and modification of water-use behaviour. However, the key challenge is to ensure that reductions in water use are sustainable and that processes are put in place to ensure that Council can consistently meet reduction targets for each key facility. A summary of the baseline water use and indicators for the facilities that were included in Council’s audit of 2010-11 is outlined below. Further audits details for these properties are included in the appendix to this report. The Key Performance Indicator (KPI) identified below is defined as the annual consumption in kilolitres (kL) divided by the measure used to judge the business (also known as the Business Activity Indicator or BAI). For example the BAI for a

Liverpool City Council Water Efficiency Plan 12
sports oval may be quare meters, while the BAI for an office may be the number of staff. Thus KPI will be usage per square metre (m2) or per person.
Table 4: Baselines and performance indicators for key Council sites Site Sydney
Water property number (and NMI)
Baseline Key Performance Indicator
Baseline Water Use in KPI Units
Litres/m2/day 9L/m2/day Council Administration Building – Initial
4565380 10.7kL/day Litres/person/day
42L/person/day Litres/m2/day 0.74L/m2/day Council
Administration Building – Current
4672957 (GDRH0030)
24.7kL/m2 or 20065kL annually
Litres/person/day 13.8L/person/day
Casula Powerhouse Art Centre
4555589 5.5 kL/day Litres/person/day 72 L/person/day
Hammondville Park 4564279 16 309 kL Litres/m2/day 0.022 L/m2
Holsworthy Swimming Centre
4566164 (EDOJ1342)
10.5kL/day Litres/person/day 96L/person/day
Liverpool City Library complex (incl. carpark)
5043671 (GDZK0060)
Library - 28.1 kL/d Carpark - 0.1 kL/d
Litres/person/day 15 L/person/day
Michael Wenden Aquatic Leisure Centre
4554537 35 454 kL Litres/person/day 127.5 L/person/day (0.12 kL/person)
Rosedale Oval 4578088 9,708 kL Litres/m2/day 21L/m2/day Rose Street Depot 4576966
(DDQJ0355, DDPK0386 & EDOH0487)
6.5kL/day Litres/person/day 3.5L/person/day (approximately)
Whitlam Leisure Centre
4565382 42 072 kL Litres/person/day 0.039 kL/person/day (148kL/day in total)
3.4 Water Fixtures and Usage To begin to understand water usage at key sites, and improve audit accuracy Council (and auditors) needed to develop a hydraulic diagram of water supply for each site. Given the number of properties and the scale of the buildings involved this becomes a difficult task. See Appendix 1 for water diagrams of audit sites. The next stage of the process was to conduct a Fixtures Inventory, to identify and understand the efficiency of fixtures installed as well as identify retrofit opportunities. A complete inventory of each site is included in the audit report details for each site found in Appendix 1. Finally a water-use profile was developed for each site to allow Council to determine retrofit priorities, and establish cost effectiveness of water savings actions for each site. The site audit reports included in appendix section 5.2 provide a breakdown of water use at each site. These profiles are summarised in the diagrams included here.

Liverpool City Council Water Efficiency Plan 13
Figure 2a: Water use profile for 1 Hoxton Park Road (Total = 10.7kL/d)
Hot Water Units, 0.1kL/d (1%)Irrigation, 0.01kL/d (0.01%)Toilets, 3.3kL/d (31%)Leakage, 2.5kL/d (23%)Showers, 2.1kL/d (20%)Urinals, 0.8kL/d (8%)Basins, 0.9kL/d (8%)Cleaning, 0.4kL/d (4%)Sinks, 0.2kL/d (2%)Other Fixtures, 0.3kL/d (3%)
Figure 2b: Water use profile for 33 Moore Street (Total = 59.97kL/d)
Cooling Tower (includingleakage) (46%)Urinal (33%)
Toilet (9%)
Single tap (8%)
Leakage (3%)
Dishwasher and Zip Unit (0.2%)

Liverpool City Council Water Efficiency Plan 14
Figure 2c: Water use profile for Casula Powerhouse Art Centre
(Total = 5.5kL/d)
Café & Restaurant, 0.8kL/d(14.5%)Public Amenities, 0.8kL/d(14.5%)Artist Accommodation, 0.4kL/d(7.3%)Staff Amenities & Kitchenette,0.5kL/d (9.1%)Unknown Usage/Leakage, 3kL/d(54.6%)
Figure 2d: Water use profile for Hammondville Park (Total = 13.2kL/d)
Unknown Usage/Leakage,2.5kL/d (18.9%)Amenities Usage, 4.7kL/d (35.6)
Unauthorised Irrigation, 4.5kL/d(34.1%)Bore Water Makeup, 1kL/d(7.6%)Amenities Leakage, 0.5kL/d(3.8%)

Liverpool City Council Water Efficiency Plan 15
Figure 2e: Water use profile for Holsworthy Swim Centre (Total = 10.5kL/d)
Basins, 0.25kL/d (2.3%)Pool, 5kL/d (47.7%)Showers, 4.75kL/d (45.2%)Toilets, 0.5kL/d (4.8%)
Figure 2f: Water use profile for Liverpool City Library complex*
*Note: while total for site is 34.5kL per day, only 28.2kL per day is Council related. The remainder is used by commercial premises on site with Council receiving reimbursement from the tenants on site. The chart below-left indicates the portion of total potable water received on site that is Liverpool City Library related.
Commercial Properties, 6.3kL/d(18.3%)Library, 28.1kL/d (81.4%)
Car Park, 0.1kL/d (0.3%)
Urinals, 0.5kL/d (1.8%)Basins, 0.8kL/d (2.9%)Showers, 0.2kL/d (0.5%)Sinks, 0.4kL/d (1.3%)Cooling Towers, 3.4kL/d (12.1%)Other Fixtures, 0.1kL/d (0.4%)Cleaning, 0.1kL/d (0.4%)Leakage, 19.9kL/d (70.6%)Toilets, 2.8kL/d (9.9%)

Figure 2g: Water use profile for Michael Wendon Centre (Total = 37.4kL/d)
Basins, 0.6kL/d (1.6%)
Leaks, 3.5kL/d (9.4%)
Pool - Balance Tanks, 13kL/d(34.8%)Pool - General, 7.95kL/d(21.3%)Showers, 10.75kL/d (28.7%)
Toilets, 1.6kL/d (4.3%)
Figure 2h: Water use profile for Rose Street Depot (Total = 6.5kL/d)
Meter 1 - Mechanical Workshop,2.8kL/d (43.1%)
Meter 2 - Operations Centre &Trades Workshop, 2.1kL/d(32.3%)Meter 3 - Training & BusinessDevelopment Centres, 1.6kL/d(24.6%)
Figure 2i: Water use profile for Whitlam Leisure Centre (Total = 148kL/d)
Basins, 3.75kL/d (2.5%)
Leaks, 14.7kL/d (9.9%)
Pool - Indoor Make-up, 12.1kL/d(8.2%)Pool - Outdoor Make-up,67.3kL/d (45.5%)Showers, 7.5kL/d (5.1%)
Toilets, 25.4kL/d (17.1%)
Urinals, 17.3kL/d (11.7%)

3.5 Priority Water Saving Projects NSW Public Works monitoring data has been used both to inform the auditing process as well as identify facility management actions to reduce inefficiencies (costs/wastage). Monitoring of the main water meter was also a component of the 2011 audit of Council’s current administration building at 33 Moore Street, Liverpool. The following tables list priority actions as determined by the water auditors, as well as a summary review of key sites. A detailed review of the way Liverpool City Council manages water resources has not been conducted at this time. Council Administration Building/s The recent loss of 1 Hoxton Park Road has rendered water actions on site unnecessary. Water consumption can be reduced at Council’s new Administration Building at 33 Moore Street, as evident from list of priority actions below. While not exhaustive, the lists below is of actions that can feasibly reduce water use given a payback period of less than 10 years. NSW Police currently lease two floors of the Moore Street building, preventing access to these floors. Retrofit of building water systems should be made a priority as soon as these floors are vacated by NSW Police. Council Administration Building - Initial In 2010, prior to the loss by fire, Council’s Administration Building had a total average daily potable use of 10.7kL/day. This represents normal operation for the site and, had the building persisted, would have been adopted as the baseline. The baseline irrigation use is estimated to be 0.02kL/day. At the time of auditing the benchmark figures for the site in terms of number of staff (255) and floor space (1,185m2) were 42L/person/day and 9L/m2/day respectively. The site has a rainwater reticulation system which continues to provide reuse water to toilets within the extension section (surviving section) of the building. This system is estimated to save 0.5kL/day of potable water which is equivalent to a saving of $540p.a in water and sewerage charges.
Table 5a: Summary of Feasible Water Saving Options – Admin. Building - Initial

Council Administration Building - Current The building is a seven storey office complex, including ground floor retail and a three storey basement carpark. Based on published standards a building of this size should have a baseline water consumption of 9,130kL p.a. Current water usage is an estimated 20,065kL p.a. The water savings identified in table 5b have the potential to save approximately 15,600kL p.a. to give a building baseline of 6,785kL p.a. The key water users in the building are:
§ Cooling towers (46%) – Water is lost through evaporation, bleed, drift, splash-out, overflow and system leakages. Re-fit of the cooling system would be the action with the greatest impact on reducing site water consumption.
§ Urinals (34%), Toilets (9%) and Taps (8%) – The current urinals operate on a ‘fill and dump’ flush method that involves flushing every 30 seconds, 24 hours a day, 7 days a week. For obvious reasons this is a significant overuse of water.
§ Toilets (9%) and Taps (8%) – The majority of toilets are single flush models while taps have no flow restriction or aerators installed. Retrofits in both these areas can be simple, with quick payback. The toilet retrofit suggested below is for replacement of the cisterns with the latest technology. Low cost alternatives include fitting cistern weights or cistern volume reduction.
§ Leakage (3%) – Whilst not measured, it is estimated that water loss due to leakages (other than cooling tower leakages) contributes to the water use profile for the building.
Table 5b: Summary of Feasible Water Saving Options - Admin. Building - Current
Casula Powerhouse Art Centre (CPAC) This is site includes galleries, a café, restaurant and artist accommodation. The baseline usage for the site is 5.5kL/day. During the audit period, the average daily water usage for the site was 13.4kL/day (72L/person/day) indicating a major leak. The target usage for the site is 2.8kL/day (42L/person/day). Total leakage on an average annual basis amounts to 3kL/day (or 55% of total site usage). Maintenance by Sydney Water has now addressed the subterraneous leaking of the water identified in table 5c below. However at a cost to Council of approximately $70 per day potential further leakages must be monitored.

Table 5c: Summary of Feasible Water Saving Options – Casula Powerhouse Art Centre
Hammondville Park At Hammondville Park the baseline usage for the site is 13.2kL/day, which equates to a current benchmark of 50L/person/day based on an estimated of 265 patrons/day. The target usage for the site is 7.9kL/day. This is equivalent to 30L/person/day based on 265 patrons/day. Key water saving opportunities identified in the review include on-going monitoring, unknown usage/leakage investigation and unauthorised irrigation prevention. Also unauthorised irrigation and an unknown usage/leakage was identified during the audit and accounted for 5kL/day. Water saving opportunity identified have the potential to save 5.3kL/day (40% reduction based on a baseline usage of 13.2kL/day) reducing usage to 7.9kL/day. The saving of 5.3kL/day is equivalent to a cost saving of $3,900 p.a in water charges. The recent audit revealed that the Sports Club is using potable water for irrigation purposes. Water re-use, specifically rainwater tanks, have been trialled on site and are an alternative to potable water use. The recent audit also revealed that Council staff members wish to increase the amount of potable water used on site in order to mix with bore water for irrigation purposes. Once again, rainwater tanks can be used to supplement bore water and are an alternative to potable water use.
Table 5d: Summary of Feasible Water Saving Options – Hammondville Park

Holsworthy Swimming Centre The baseline usage for the swimming centre is 10.5 kL/day and 89 patrons/day. That is benchmark for the site is 118L/patron/day. The target benchmark for the site is 96L/patron/day. The target usage can be further reduced to 7.9kL/day if the site implements all feasible recommendations as well as a rainwater harvesting system. Presently, neither the facility manager nor the private operator is listed to receive weekly reports, monthly reports or alarms for water use anomalies. It is recommended that the site implement the following identified water saving options: § Nomination of staff to respond to water use issues § Installation of Water Efficiency Showerheads § Installation of Flow Control Devices in Basins
The above retrofit recommendations have the potential to save 2kL/dayay ($2,300p.a in water charges), which is equivalent to a reduction of 19% from the baseline usage. Nominating a member of staff to respond to water issues, alarms etc has the potential to save thousands more litres of potable water Table 5e: Summary of Feasible Water Saving Options – Holsworthy Swimming Centre
Liverpool City Library complex (incl. carpark) The baseline usage for the library has been determined to be 28.1kL/day and 0.1 kL/day for the car park. The commercial properties accounts for the remaining 6.3kL/day. Based on the library base line usage and 1708 visitors/day, the current benchmarks for the library are 17L/visitor/day and 15L/person/day (including 119 staff). Three key issues to note when attempting to understand site hydrology are: § The library café, Council Chambers and Warren Serviceway Carpark are all
drawing water from the Library meter without adequately compensating the Library.
§ The shops outside the building may be drawing water from the Library meter
without compensating the Library. § During the audit there appears to be a significant leak from the Council
Chambers cooling towers. While noted, this issue has since been resolved.

The total leakage on an annual basis accounts for 22.5kL/day. Approximately 19.9kL/day is due to issues with the aforementioned cooling tower and one faulty toilet. The remaining 2.6 kL/day is believed to be through the commercial properties amenities. The total leakage is costing the council $27,800 p.a in water related charges. Water saving opportunities identified have the potential to save 18.2 kL/day, which is 65% reduction based on a baseline usage of 28.2 kL/day (not including 6.3 kL/day through the commercial properties). The saving of 18.2 kL/day is equivalent to a cost saving of $22,500 p.a in water related charges. The target usage for the library is 9.9 kL/day and the car park is 0.1kL/day. The target benchmarks for the library are 5L/person/day (including 119 staff).
Table 5f: Summary of Feasible Water Saving Options – Liverpool Library Complex
Michael Wenden Aquatic Leisure Centre The baseline usage Michael Wenden Aquatic Leisure Centre is 37.4kL/day or 121L/patron/day based on 310 patrons/day. During the recent audit, 4.5kL/d or 12.5% of daily water use was wasted through overfilling of pools (excessive make-up). Potential water savings are 12.6kL/day ($8,590p.a in water charges), which is equivalent to a reduction of 34% from the baseline usage. Based on a target usage of 24.8kL/day (feasible recommendation implemented) and 310 patrons/day, the target benchmark for the site is 80L/patron/day.
Aquatic and Leisure centres like Michael Wenden provide more than just an outdoor pool

Table 5g: Summary of Feasible Water Saving Options – Michael Wenden A.L. Centre
Rose St Depot Total average usage at the Council Depot over the monitored period was 6.6kL/day. There are three water mains on site and each was monitored during the audit. The target usage for the site is 5.4kL/day, if the recommended key water saving options identified for the site are implemented. The baseline usage for the site is 6.5kL/day (based on the previous five years of data). Benchmarking for the site is not indicative of water use per person as approximately 60% of the total site water use is through filling of the street sweeping vehicles. Major works are planned for the site, with staff moving to a refurbished operations centre. Water and energy guidelines should inform any refurbishment or retrofit of the operations centre. However, until the new operations centre is complete, and while staff continue to use existing facilities, it is recommended that the site implement the following identified water saving recommendations: § Installation of Flow Control Devices in Basins § Installation of Water Efficient Showerheads § Leakage Investigation and Permanent Monitoring
Leakage Investigation and Permanent Monitoring is an important action that is pertinent to both existing facilities and any new facility that may be built. In fact leakage investigation is a key action for every water using site owned by Council. The above recommendations have the potential to save 1.1kL/day ($1,270p.a in water and sewerage charges), which is equivalent to a reduction of 17% from the baseline usage (6.5kL/day).
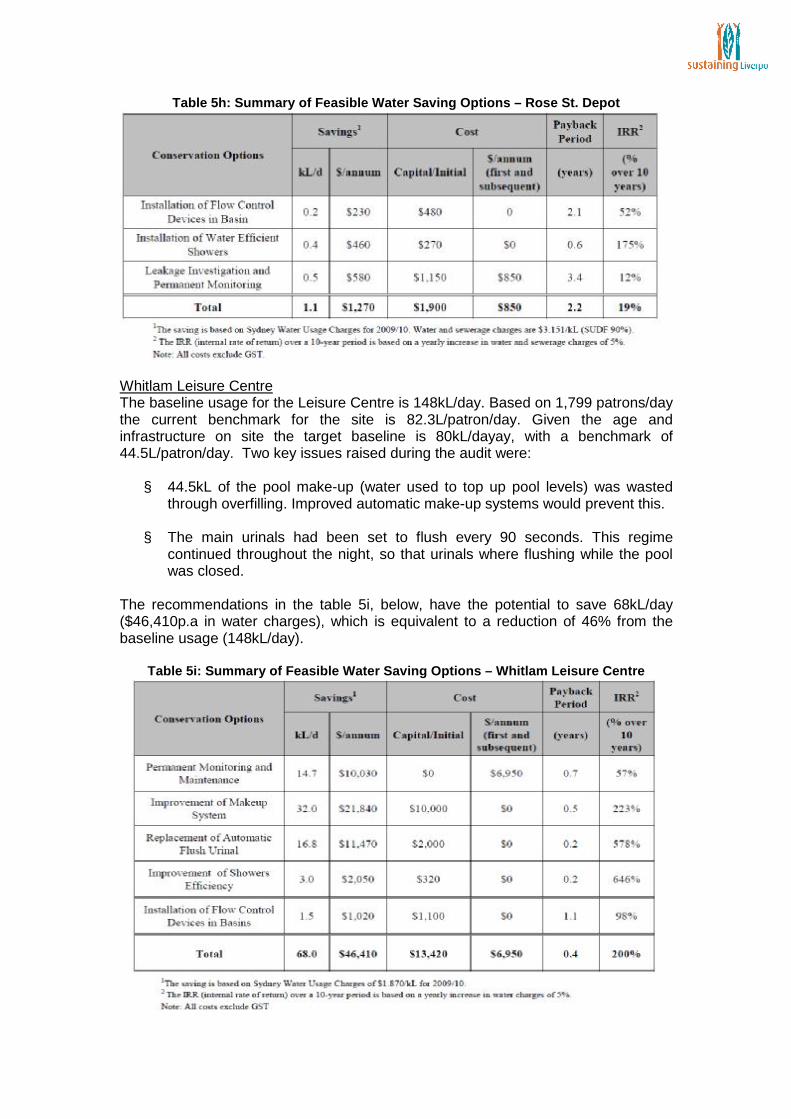
Table 5h: Summary of Feasible Water Saving Options – Rose St. Depot
Whitlam Leisure Centre The baseline usage for the Leisure Centre is 148kL/day. Based on 1,799 patrons/day the current benchmark for the site is 82.3L/patron/day. Given the age and infrastructure on site the target baseline is 80kL/dayay, with a benchmark of 44.5L/patron/day. Two key issues raised during the audit were: § 44.5kL of the pool make-up (water used to top up pool levels) was wasted
through overfilling. Improved automatic make-up systems would prevent this. § The main urinals had been set to flush every 90 seconds. This regime
continued throughout the night, so that urinals where flushing while the pool was closed.
The recommendations in the table 5i, below, have the potential to save 68kL/day ($46,410p.a in water charges), which is equivalent to a reduction of 46% from the baseline usage (148kL/day).
Table 5i: Summary of Feasible Water Saving Options – Whitlam Leisure Centre

Section 4 – Summary of Project for Key Sites The following list of water efficiency actions will be a priority for Council over the four year term of this Water Efficiency Plan. Whilst the actions are taken primarily from the water audit, other sources include Council’s Waste and Sustainability Improvement Payment (WaSIP) program, and facility manager maintenance plans. However this list is not exhaustive. As facilities are renovated, expanded and otherwise enhanced new actions may be developed. The current list is comprised of actions from three sources. Actions in BLACK are those suggested by the audit process. Actions in GREEN are a component of WaSIP projects. Actions in BLUE are a component of Action Plans developed by the contractor managing the site to meet Council contractual requirements. While priorities may change over time, Council continues to be committed to reducing water use at and operating efficiently.
Table 6: Site water saving opportunities Site Action Primary
Responsibility
Time frame
(years)
Cost to Imple-ment
Saving -Water (kL/yr)
Saving -Cost ($/yr)
Casula Power house Art Centre
Upgrade and retrofit artist residency studio
Business Manager, CPAC
2011-12 $7000 varies varies
Casula Powerhouse Arts Centre
Unknown usage/leakage investigation and ongoing monitoring
Business Manager, + Technical Manager CPAC
2011-12 $1210 initial then $850 per
year
986 $3,300
Casula Powerhouse Arts Centre
Permanent Monitoring
Manager Property Services + Manager -Sustainable Environment
To be determined
$1,210 first year
then $850 p.a.
0 $0
Council Admin Building
Instillation of Waterless urinals
Manager -Buildings and Open Space Construction
As per Building
Master Plan (major retrofit)
$18,000 9,460 $19,880
Council Admin Building
Instillation of dual flush toilets
Manager -Buildings and Open Space Construction
As per Building
Master Plan (major retrofit)
$35,250 770 $1,630
Council Admin Building
Instillation of Aqualoc in tap fittings
Manager -Buildings and Open Space Construction
As per Building
Master Plan (major retrofit)
$2,400 985 $2,070
Council Admin Building
Replacement of cooling towers
Manager -Buildings and Open Space Construction
As per Building
Master Plan (major retrofit)
$117,000 4,390 $9,225
Hammondville Oval
Investigation of leakage/unknown usage and Permanent Monitoring
Manager Recreation, CBD and Cleansing Services + Manager -Sustainable
Leakage works
completed remaining
works to be determined
$2,070 then
$1,600p.a.
1,938 $3,900

Environment Hammondville Oval
Stormwater harvesting
Manager Civil Construction and Assets
To be determined
$31,000 1,320 $1337
Holsworthy Swimming Centre
Instillation of water efficient showerheads
Manager Recreation, CBD and Cleansing Services + Centre Contractor
Beginning 2011-12.
$600 695 $2,190
Holsworthy Swimming Centre
Instillation of Flow Control device in basins
Manager Recreation, CBD and Cleansing Services + Centre Contractor
Beginning 2011-12
$60 34.9 $110
Holsworthy Swimming Centre
Instillation of Permanent Monitoring System
Manager Recreation, CBD and Cleansing Services + Manager Sustainable Environment + Centre Contractor
To be determined
$1,150 to install then $850 per
year
0 $0
Liverpool City Library
Investigation of leakage/unknown usage and Permanent Monitoring
Manager Library Services + Manager Property Services
Beginning 2011-12
$2,360 initial then $850 per
year
6,519 $22,100
Liverpool City Library
Separate Water Meters at Liverpool Library complex
Manager Library Services + Manager Property Services
Postponed till further
notice
$5,700 0 $0
Liverpool City Library
Investigate ways to secure fire hoses in carpark
Manager - Buildings and Open Space Construction
Beginning 2011-12
N/A 0 $0
Liverpool City Library
Instillation of Flow Control Devices in basins
Manager Library Services + Manager - Buildings and Open Space Construction
2011-12 $200 118 $400
Michael Wenden Aquatic and Recreation Centre
Improvement of maintenance and Makeup system
Facility Manager
Beginning 2011-12
$6,000 2,920 $5,460
Michael Wenden Aquatic and Recreation Centre
Sub-meter Purchase
Manager Sustainable Environment + Facility Manager
2011-12 $900 0 $0

Michael Wenden Aquatic and Recreation Centre
Sub-meter instillation
Facility Manager
2011-12 $2,000 0 $0
Michael Wenden Aquatic and Recreation Centre
Ongoing permanent monitoring
Manager - Recreation and Community Services + Facility Manager
2011-12 $1,300 initial then $1,800 per
year
0 $0
Michael Wenden Aquatic and Recreation Centre
Improvement of Showers Efficiency
Facility Manager
2011-12 $720 1,567 $2,930
Michael Wenden Aquatic and Recreation Centre
Instillation of Flow Control device in basins
Facility Manager
Beginning 2011-12
$320 107 $200
Michael Wenden Aquatic and Recreation Centre
Follow backwash schedule
Facility Manager + facility staff
Ongoing 0 varies Varies
Michael Wenden Aquatic and Recreation Centre
Educate patrons on water savings
Facility Manager + facility staff
Ongoing 0 varies Varies
Michael Wenden Aquatic and Recreation Centre
Restrictions on watering gardens
Facility Manager + facility staff
Ongoing 0 varies Varies
Michael Wenden Aquatic and Recreation Centre
Minimise hosing of pool deck
Facility Manager + facility staff
Ongoing 0 varies Varies
Michael Wenden Aquatic and Recreation Centre
Efficient use of Pressure cleaner (rather than hose)
Facility Manager + facility staff
Ongoing 0 varies Varies
Michael Wenden Aquatic and Recreation Centre
Discharge from manual pool vacuum into pool scum channels
Facility Manager + facility staff
Ongoing 0 varies Varies
Michael Wenden Aquatic and Recreation Centre
Daily recording of water meter
Facility Manager + facility staff
Ongoing 0 varies Varies
Michael Wenden Aquatic and Recreation Centre
Ensure regular servicing of depth sensor and overfill alarm
Facility Manager + facility staff
Ongoing 0 varies Varies
Michael Wenden
Identify and repair potential
Facility Manager +
Ongoing 0 varies Varies

Aquatic and Recreation Centre
leaks facility staff
Michael Wenden Aquatic and Recreation Centre
Develop a report to identify loss of water through backwashing
Facility Manager + facility staff
Ongoing 0 varies Varies
Rose Street Depot
Instillation of Flow Control device in basins
Director City Assets
Beginning 2011-12
$480 73 $230
Rose Street Depot
Instillation of water efficient showers
Director City Assets
Beginning 2011-12
$270 146 $460
Rose Street Depot
Leakage Investigation and permanent monitoring
Manager Property Services + Manager Sustainable Environment
Beginning 2011-12
$1,150 184 $580
Whitlam Leisure Centre
Automatic make-up system for spa pool
Facility Manager
2011-12 $2,475 varies varies
Whitlam Leisure Centre
Pool Blanket for 50m pool
Facility Manager
2011-12 $38,000 varies varies
Whitlam Leisure Centre
Automatic make-up system for 50m pool
Facility Manager
2011-12 $3,250 varies varies
Whitlam Leisure Centre
Instillation of duel-flush toilets
Facility Manager
2012-13 $59,000 To be determ.
To be determ.
Whitlam Leisure Centre
Reclamation of pool backwash water
Project Manager – City Assets
2011-12 $30,000 for initial phases
($300,000 for final phase)
To be determ.
To be determ.
Whitlam Leisure Centre
Harvesting of rainwater from new pool shade structure
Project Manager – City Assets
2011-12 $22,000 (initial
estimate)
To be determ.
To be determ.
Whitlam Leisure Centre
Re-use of Backwash water
Project Manager – City Assets
2011-12 to 2012-13
To be determ.
To be determ.
To be determ.
Whitlam Leisure Centre
Water saving shower heads/shower flow control valves
Facility Manager
2012-13 320 1,096 $2,050
Whitlam Leisure Centre
Instillation of Flow Control device in basins
Facility Manager
2012-13 $1,100 545 $1,020
Whitlam Leisure Centre
Permanent monitoring maintenance to ensure efficient water use
Manager Recreation, CBD and Cleansing Services
2011-12 6,950 5,364 $10,030
Whitlam Leisure Centre
Improvement of Makeup System
Facility Manager
2011-12 $10,000 11,679 $21,840
Whitlam Leisure Centre
Replacement of Automatic Flush Urinal
Facility Manager
2011-12 $2,000 6,134 $11,470
Whitlam Leisure Centre
Follow backwash schedule
Facility Manager +
Ongoing 0 varies Varies

facility staff Whitlam Leisure Centre
Educate patrons on water savings
Facility Manager + facility staff
Ongoing 0 varies Varies
Whitlam Leisure Centre
Restrictions on watering gardens
Facility Manager + facility staff
Ongoing 0 varies Varies
Whitlam Leisure Centre
Minimise hosing of pool deck
Facility Manager + facility staff
Ongoing 0 varies Varies
Whitlam Leisure Centre
Efficient use of Pressure cleaner (rather than hose)
Facility Manager + facility staff
Ongoing 0 varies Varies
Whitlam Leisure Centre
Discharge from manual pool vacuum into pool scum channels
Facility Manager + facility staff
Ongoing 0 varies Varies
Whitlam Leisure Centre
Daily recording of water meter
Facility Manager + facility staff
Ongoing 0 varies Varies
Whitlam Leisure Centre
Ensure regular servicing of depth sensor and overfill alarm
Facility Manager + facility staff
Ongoing 0 varies Varies
Whitlam Leisure Centre
Identify and repair potential leaks
Facility Manager + facility staff
Ongoing 0 varies Varies
Whitlam Leisure Centre
Develop a report to identify loss of water through backwashing
Facility Manager + facility staff
Ongoing 0 varies Varies

Section 5 – Appendix 5.1 Water Audit Methodology Audits were conducted for key Liverpool City Council water using facilities. At each site the auditors conducted a leakage assessment and an amenities assessment. Furthermore, for Council’s administration buildings and libraries irrigation systems and cooling towers were assessed. For leisure centres, swim centres and the like a pool backwash and top-up assessment was also conducted. Sub-metering and water monitoring beyond the period of audit, has also been part of the water management protocols for these sites. The Table below sets out the sites for walk through audits and detailed audits. With the exception of 33 More Street, Liverpool, the audits were subsidised (50%) by Sydney Water as part of the Every Drop Counts program. By definition a detailed audit will provide more information on a site than a ‘Walkthrough’ audit. In fact there is no protocol for a walkthrough of a site using 156kL/d. In this case however, as a detailed audit was completed for all ‘Walkthrough’ sites in June 2007. Thus helping to simplify the audit required in 2010.
Table 7: Type of audit conducted for key sites Audit Type Water
Usage (kL/d)
Notes
Walk Through Whitlam Leisure Centre 156 Existing logging of 9 meters Michael Wenden Centre 42 Existing logging of Main meter
Holsworthy Swimming Centre 9.2 1 Meter Rose Street Depot 6.9 4 meters. Allows for monitoring 2
meters Full Audit Liverpool Library + Carpark 31 1 meter Administration Building – 1 Hoxon Park Road
7.1 (current 11 kL/d)
2 meters
Administration Building – 33 Moore Street
60 1 meter
Casula Powerhouse 7.3 1 meter
Hammondville Oval 14.2 2 Meters
Audit Methodology In general terms a detailed water audit requires the auditor to:
• Identify current water usage patterns • Describe the current plumbing system and identify any deficiencies • Identify water conservation opportunities including re-use • Document the extent of existing water efficiency, re-use • Recommend plumbing retro-fit and other water saving initiatives,
demonstrating the costs & savings (including calculation of payback period)
• Benchmark water usage where comparison data is available
This includes

1. On-site investigation of the customer’s property to quantify water usage as applicable, attributable to each of the following: • Amenities facilities -Toilets, urinals, basins and showers • Process water • Laboratory /Canteen • Plant sanitation and cleaning • Boiler / Hot water. • Cooling water • Maintenance programs • Other water using fixtures and equipment • Trade waste discharge • Irrigation
2. A review of the customer’s water maintenance practices. 3. Leakage measurement through flow monitoring. 4. Review existing water meter size for adequate sizing 5. Identify opportunities for alternated water sources and if applicable recommend further detailed investigation/design documentation.
6. Review the customer’s water re-use arrangements (where found). In general terms a Walkthrough water audits have many of the components listed in section 2 above. However they do not include the same level of investigation work. However in the case of Liverpool Council, Holsworthy Swimming Centre and Rose Street Depot the site were visited to check the main meters as part of the audit process. At the Whitlam Leisure Centre five sub-meters were installed and monitored, with the main focus of the walk-through being to determine the cause of the significant level of leakage that was observed.

5.1 Facility Audit Reports for Key Facilities.
Appendix 5.1 is a 191 page document.
A copy will be made available at the EAC Meeting.