irrigation district water efficiency cost analysis and ... · irrigation district water efficiency...
TRANSCRIPT
Irrigation District Water Efficiency Cost Analysis and Prioritization
DWA Final Report
August 2006
David Newton, P.E.1
Mathias Perle1
The authors wish to thank the Bureau of Reclamation for sponsoring this report as part of the Deschutes Water Alliance Water 2025 Grant (see www.deschutesriver.org/Water_summit for more information).
1, Newton Consultants, Inc. 521 SW 6th Street, Suite 100, Redmond, OR, 97756; (541) 504-9960 [email protected]
Deschutes Water Alliance Irrigation District Water Efficiency Cost Analysis and Prioritization– May 2006 Prepared by: David Newton Newton Consultants, Inc.Mathias Perle Newton Consultants, Inc. Feedback and comments were received by: Patrick Griffiths City of Bend Tom Hickman City of Bend Pat Dorning City of Redmond Ray Johnson City of Redmond Kyle Gorman Oregon Water Resources Department Tod Heisler Deschutes River Conservancy Bruce Aylward Deschutes River Conservancy Kate Fitzpatrick Deschutes River Conservancy Brett Golden Deschutes River Conservancy Steve Johnson Central Oregon Irrigation District & Deschutes Basin Board of ControlJan Lee Swalley Irrigation District Kathy Kihara Bureau of Reclamation Bonnie Lamb Oregon Department of Environmental Quality Jan Houck Oregon Parks & Recreation Department Steven Marx Oregon Department of Fish and Wildlife Gail Achterman Oregon State University, Institute for Natural Resources
FOREWORD
BACKGROUND
The upper Deschutes Basin comprises about 4,500 square miles of watershed between the highland areas to the east, south and west, and Lake Billy Chinook to the north. The Central Oregon area, located within the upper basin, is experiencing rapid growth and changes in both lifestyle and land uses. Along with these changes, long-recognized water resources issues have become more important and a number of others have developed.
More effective use of water resources to broaden the benefits of water use in connection with irrigation, stream flow restoration, protection of scenic waterway flows and water quality improvements has long been an important resource management issue in the upper basin. Other developing issues include need for safe, reliable water supply for future basin needs, urbanization of irrigated lands and impacts on agriculture, and needs to protect flows for fishery, recreation and other in-stream uses.
The significance of basin water issues has increased considerably over the last few years. The rapid growth and subsequent water needs that the region is experiencing presents an opportunity to study these issues in more detail given changing values and availability of funding. Consequently, water usage and availability are now a major topic in discussions among basin water suppliers and planners. Due to increased dialogue and awareness relative to water issues, regional urban water suppliers, irrigation districts and other private, government and individual water users now recognize their interdependency in the use, management and protection of Deschutes Basin water resources. This recognition and related dialogue enjoined the major water suppliers in a common vision that commits energy and resources in a collaborative effort to respond to basin water issues.
Water supply, water quality, flow depletion and irrigation district urbanization issues in the upper Deschutes Basin establish the framework for need for the Deschutes Water Alliance. Mutually beneficial opportunities exist for municipalities and flow restoration interests to obtain needed water supply and for irrigation districts to resolve urbanization and conservation issues. Some of the key management considerations involved with these opportunities:
• Full appropriation of surface waters
• Declaration of groundwater restrictions and related mitigation requirements
• Dependency of municipal water providers on groundwater for future needs
• Diversion of substantial river flows by irrigation districts
• 303(d) listings for water quality parameters and need for TMDLs throughout the Deschutes and Crooked Subbasins.
• Protection of scenic waterway flows in the lower reaches of the Deschutes and Crooked Rivers
District Water Conservation Cost Analysis & Prioritization FW-1 Deschutes Water Alliance Issue Paper – Final Report
• Potential Endangered Species Act issues
• Re-Introduction of anadramous fish species in the Deschutes and Crooked Rivers
• Rapid growth, urbanization and land-use change in the basin
Organization
The Deschutes Water Alliance (DWA) was formed by four major basin partners to develop and implement integrated water resources management programs in the upper Deschutes Basin. The partners include:
• Deschutes Basin Board of Control (DBBC): represents seven irrigation districts in the basin including Bureau of Reclamation’s Deschutes Project North Unit Irrigation District and Ochoco Projects formed under ORS 190.125.
• Central Oregon Cities’ Organization (COCO): which is comprised of cities in the basin and affiliated drinking water districts and private companies providing potable water supply.
• Deschutes River Conservancy (DRC):
• Confederated Tribes of Warm Springs (CTWS)
Goals and objectives
The DWA is investing in managing the water resources of the Deschutes Basin in a unified way to provide:
• Reliable and safe water supply for the region’s future municipal and agriculture needs and sustained economic viability considering growth, urbanization and related effects on water resources;
• Financial stability for the Basin’s irrigation districts and their patrons;
• Protection of the fishery, wildlife, existing water rights, recreational and aesthetic values of the Deschutes River along with stream flow and water quality improvements;
• Focus on maintaining the resource and land base in the Basin, consistent with acknowledged comprehensive land use plans; and
• An institutional framework that supports the orderly development of local water markets to protect participants and create an “even playing field” for water transactions.
These considerations are key elements to be incorporated into development of the integrated water resources management and restoration program.
Approach
Mutually beneficial opportunities exist to boost water supply for agriculture, municipal needs and stream flow for fish, wildlife and water quality improvements. Mutually beneficial
District Water Conservation Cost Analysis & Prioritization FW-2 Deschutes Water Alliance Issue Paper – Final Report
opportunities also exist through integrated planning for irrigation districts to resolve urbanization issues. In order to develop a framework and program to achieve these objectives, the DWA is implementing five planning studies under a Water 2025 Program grant to generate facts and background information necessary for program formulation. The planning study results will be synthesized into a Water Supply, Demand and Water Reallocation document with project scenarios, five-year implementation bench marks and 20-year timeframe. The five planning studies are as follows:
• Irrigation District Water Conservation Cost Analysis and Prioritization-an evaluation and prioritization of opportunities to save water through piping and lining of canals, laterals and ditches, as well as through on-farm conservation technologies.
• Growth, Urbanization and Land Use Change: Impacts on Agriculture and Irrigation Districts in Central Oregon. (Title in Water 2025 Grant was Impacts of Urbanization on Irrigable Lands) -an inventory of amounts, patterns and rates of district water rights becoming surplus due to urbanization or other changes in land use patterns in Central Oregon and corresponding impact on district assessments.
• Reservoir Management (Title in Water 2025 Grant was Reservoir Optimization Study and Water Quality)- prepare rapid assessment of potential gains from optimization of existing reservoirs and their potential impact on improving flow and quality, and prepare terms of reference for more formal and rigorous assessment.
• Future Groundwater Demand in the Deschutes Basin (Title in Water 2025 Grant was Municipal Water Demand)-assessment of the water supply needs, quantity and timeline of the Basin’s regional urban suppliers.
• In-stream Flow in the Deschutes Basin: Monitoring, Status and Restoration Needs (Title in Water 2025 Grant was Measurement, Monitoring and Evaluations Systems)- In-stream Flow Needs for Fish, Wildlife and recreation along with Measurement, Monitoring and Evaluation Systems-assessment of the suitability and completeness of existing flow measurement sites and existing Water Quality and Monitoring Plan for the Upper Deschutes Basin and prepare funding and implementation action plan.
District Water Conservation Cost Analysis & Prioritization FW-3 Deschutes Water Alliance Issue Paper – Final Report
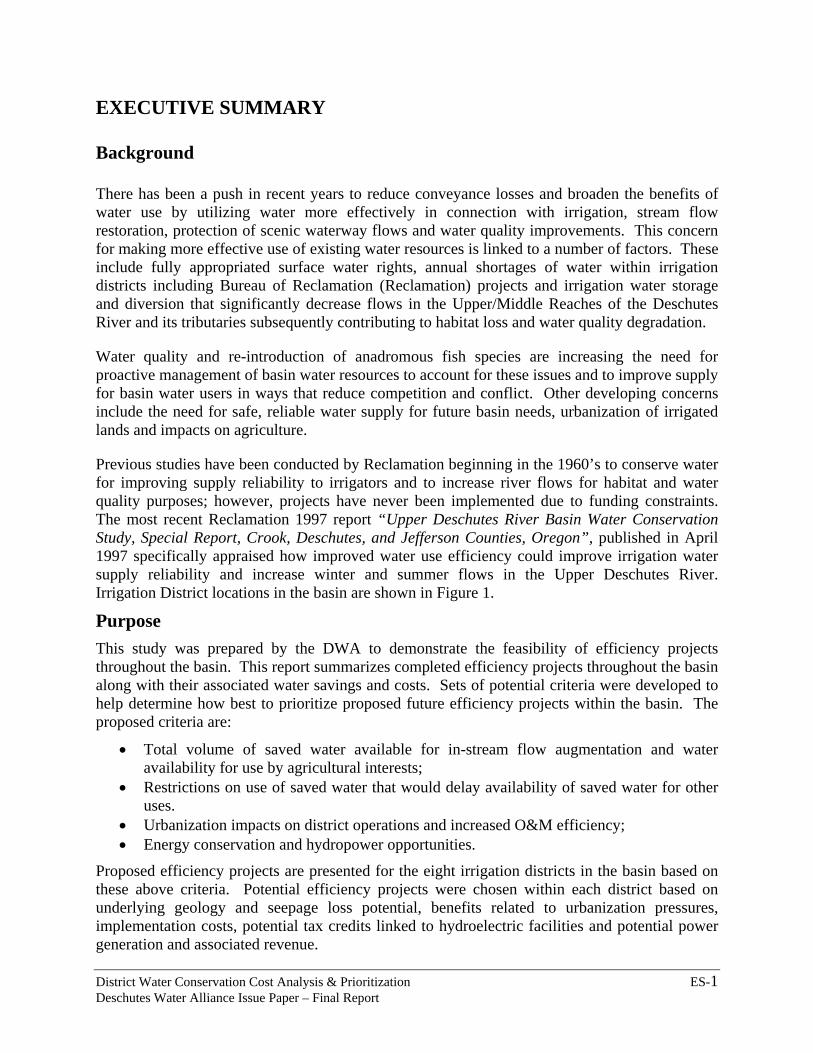
EXECUTIVE SUMMARY Background There has been a push in recent years to reduce conveyance losses and broaden the benefits of water use by utilizing water more effectively in connection with irrigation, stream flow restoration, protection of scenic waterway flows and water quality improvements. This concern for making more effective use of existing water resources is linked to a number of factors. These include fully appropriated surface water rights, annual shortages of water within irrigation districts including Bureau of Reclamation (Reclamation) projects and irrigation water storage and diversion that significantly decrease flows in the Upper/Middle Reaches of the Deschutes River and its tributaries subsequently contributing to habitat loss and water quality degradation.
Water quality and re-introduction of anadromous fish species are increasing the need for proactive management of basin water resources to account for these issues and to improve supply for basin water users in ways that reduce competition and conflict. Other developing concerns include the need for safe, reliable water supply for future basin needs, urbanization of irrigated lands and impacts on agriculture.
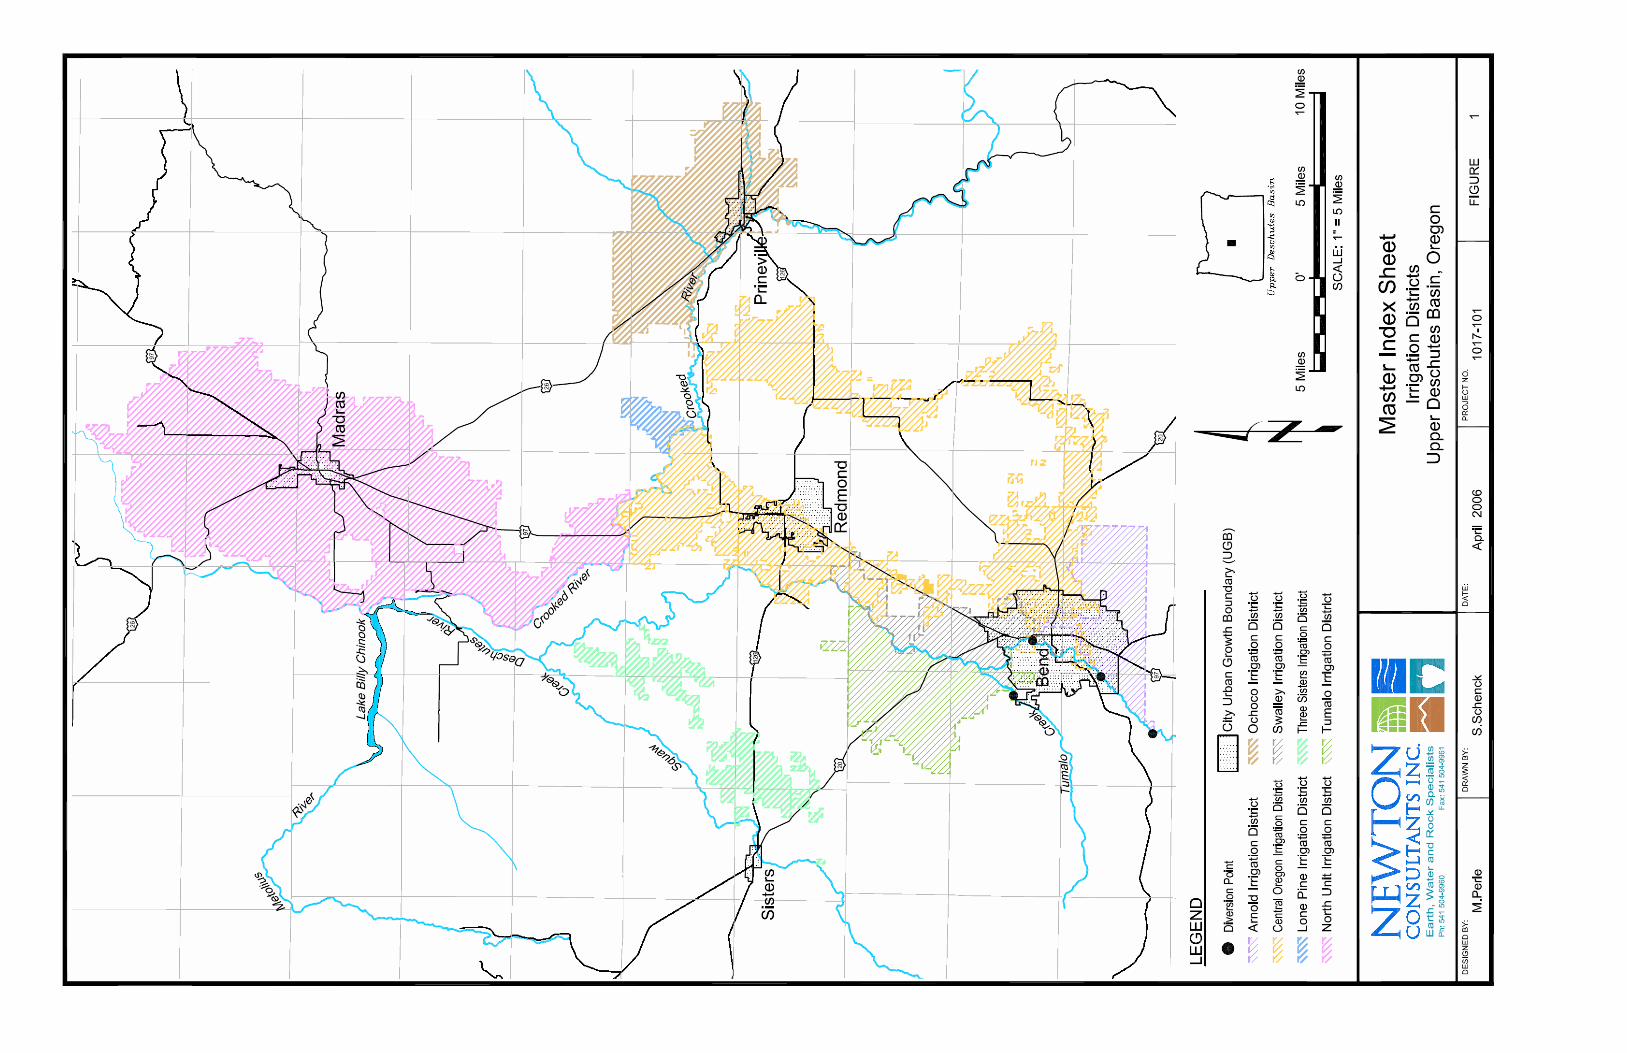
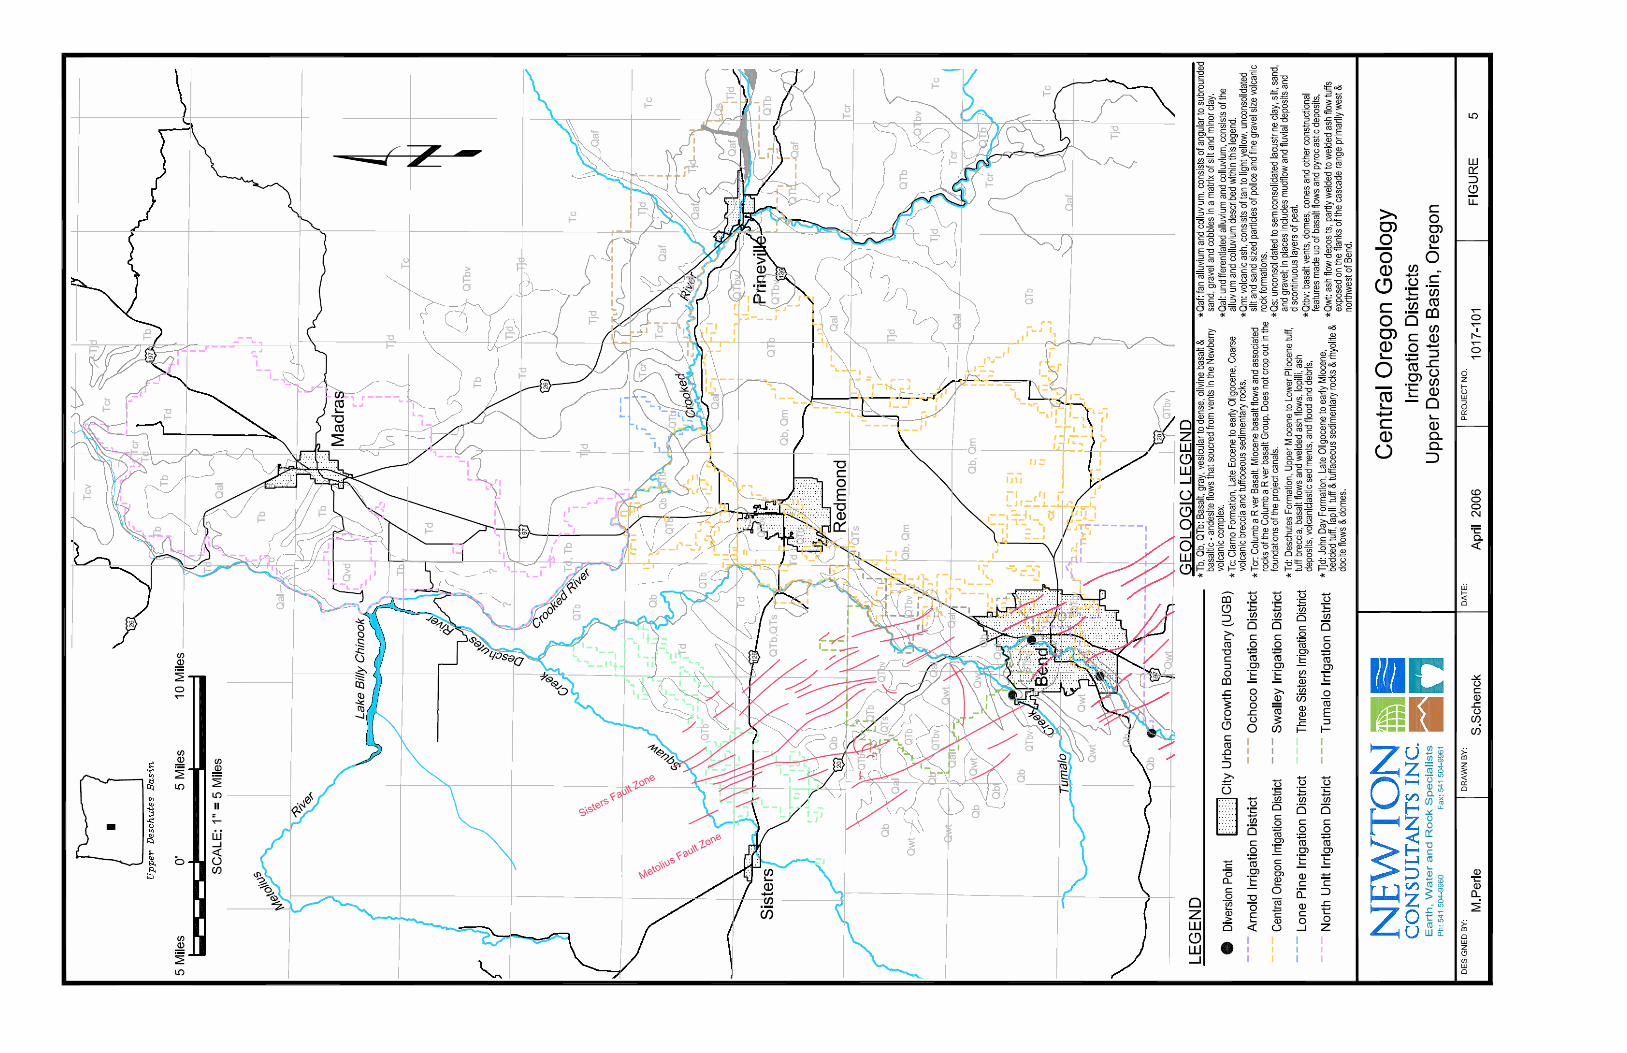
Previous studies have been conducted by Reclamation beginning in the 1960’s to conserve water for improving supply reliability to irrigators and to increase river flows for habitat and water quality purposes; however, projects have never been implemented due to funding constraints. The most recent Reclamation 1997 report “Upper Deschutes River Basin Water Conservation Study, Special Report, Crook, Deschutes, and Jefferson Counties, Oregon”, published in April 1997 specifically appraised how improved water use efficiency could improve irrigation water supply reliability and increase winter and summer flows in the Upper Deschutes River. Irrigation District locations in the basin are shown in Figure 1.
Purpose This study was prepared by the DWA to demonstrate the feasibility of efficiency projects throughout the basin. This report summarizes completed efficiency projects throughout the basin along with their associated water savings and costs. Sets of potential criteria were developed to help determine how best to prioritize proposed future efficiency projects within the basin. The proposed criteria are:
• Total volume of saved water available for in-stream flow augmentation and water availability for use by agricultural interests;
• Restrictions on use of saved water that would delay availability of saved water for other uses.
• Urbanization impacts on district operations and increased O&M efficiency; • Energy conservation and hydropower opportunities.
Proposed efficiency projects are presented for the eight irrigation districts in the basin based on these above criteria. Potential efficiency projects were chosen within each district based on underlying geology and seepage loss potential, benefits related to urbanization pressures, implementation costs, potential tax credits linked to hydroelectric facilities and potential power generation and associated revenue.
District Water Conservation Cost Analysis & Prioritization ES-1 Deschutes Water Alliance Issue Paper – Final Report
A brief overview of potential water savings from on-farm conservation practices is also presented along with common on-farm conservation methods and associated water savings. More analysis should be conducted to accurately determine costs and associated water savings of on-farm conservation measures within individual districts.
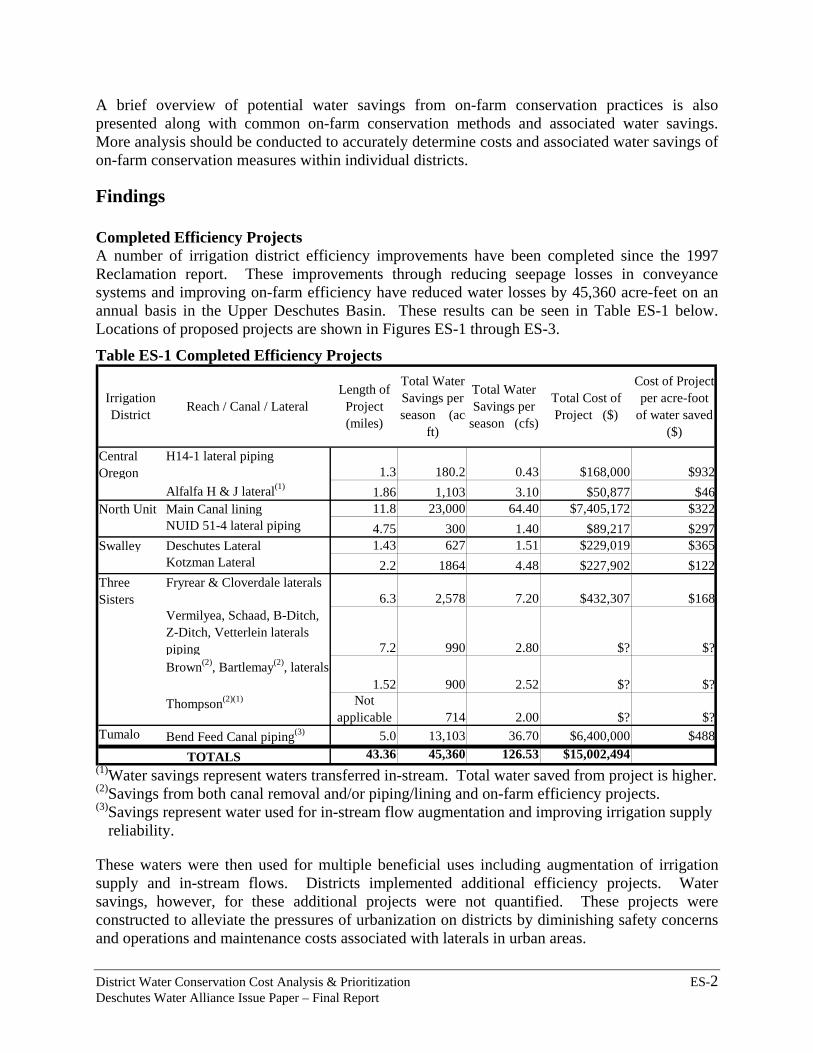
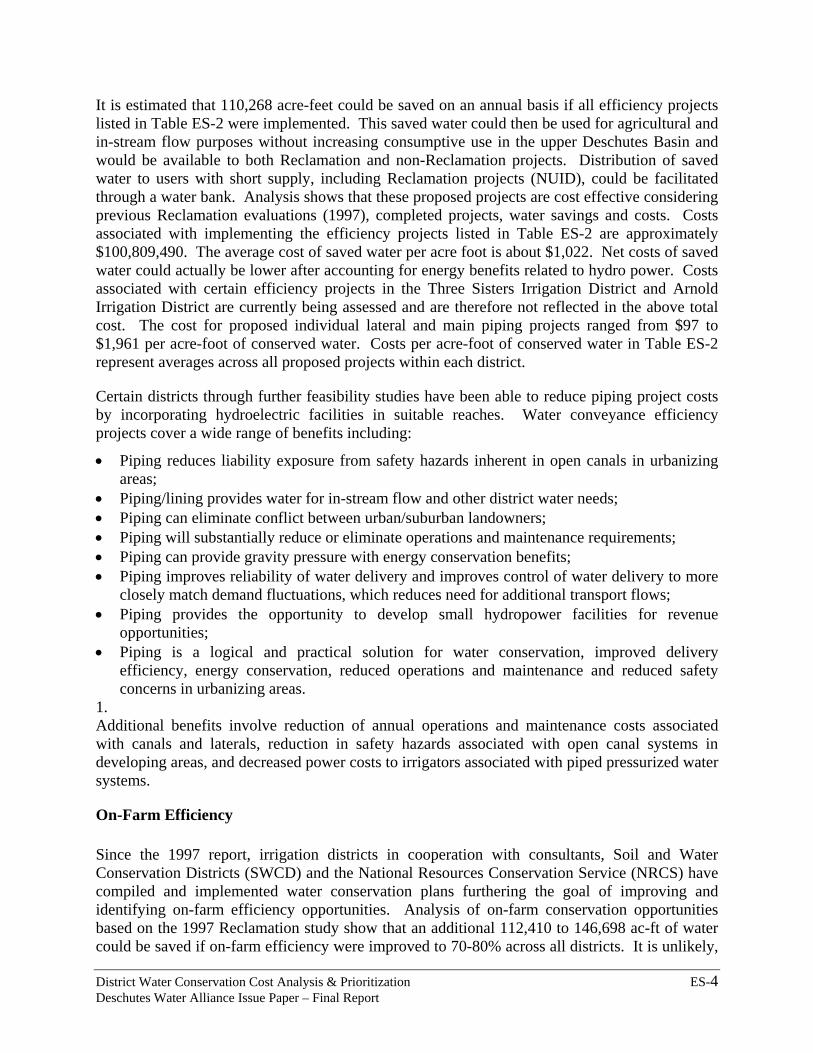
Findings Completed Efficiency Projects A number of irrigation district efficiency improvements have been completed since the 1997 Reclamation report. These improvements through reducing seepage losses in conveyance systems and improving on-farm efficiency have reduced water losses by 45,360 acre-feet on an annual basis in the Upper Deschutes Basin. These results can be seen in Table ES-1 below. Locations of proposed projects are shown in Figures ES-1 through ES-3.
Table ES-1 Completed Efficiency Projects
n-stream. Total water saved from project is higher.
supply
These waters were then used for multiple beneficial uses including augmentation of irrigation
and operations and maintenance costs associated with laterals in urban areas.
(1)Water savings represent waters transferred i
Irrigation District Reach / Canal / Lateral
Length of Project (miles)
Total Water Savings per season (ac-
ft)
Total Water Savings per
season (cfs)
Total Cost of Project ($)
Cost of Project per acre-foot
of water saved ($)
Central Oregon
H14-1 lateral piping1.3 180.2 0.43 $168,000 $932
Alfalfa H & J lateral(1) 1.86 1,103 3.10 $50,877 $46 North Unit Main Canal lining 11.8 23,000 64.40 $7,405,172 $322
NUID 51-4 lateral piping 4.75 300 1.40 $89,217 $297 Swalley Deschutes Lateral 1.43 627 1.51 $229,019 $365
Kotzman Lateral 2.2 1864 4.48 $227,902 $122 Three Sisters
Fryrear & Cloverdale laterals6.3 2,578 7.20 $432,307 $168
Vermilyea, Schaad, B-Ditch, Z-Ditch, Vetterlein laterals piping 7.2 990 2.80 $? $?Brown(2), Bartlemay(2), laterals
1.52 900 2.52 $? $?Thompson(2)(1) Not
applicable 714 2.00 $? $?Tumalo Bend Feed Canal piping(3) 5.0 13,103 36.70 $6,400,000 $488
43.36 45,360 126.53 $15,002,494 TOTALS
(2)Savings from both canal removal and/or piping/lining and on-farm efficiency projects. (3)Savings represent water used for in-stream flow augmentation and improving irrigation
reliability.
supply and in-stream flows. Districts implemented additional efficiency projects. Water savings, however, for these additional projects were not quantified. These projects were constructed to alleviate the pressures of urbanization on districts by diminishing safety concerns
District Water Conservation Cost Analysis & Prioritization ES-2 Deschutes Water Alliance Issue Paper – Final Report
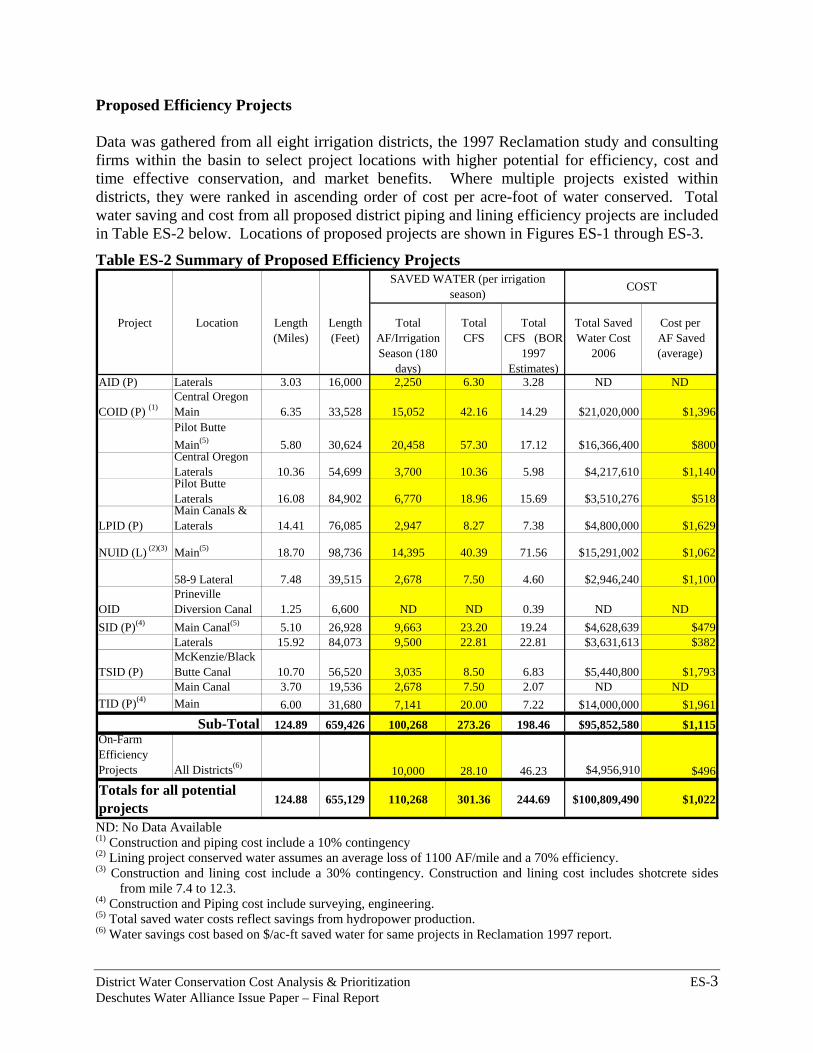
Proposed Efficiency Projects Data was gathered from all eight irrigation districts, the 1997 Reclamation study and consulting
project locations with higher potential for efficiency, cost and me effective conservation, and market benefits. Where multiple projects existed within
firms within the basin to selecttidistricts, they were ranked in ascending order of cost per acre-foot of water conserved. Total water saving and cost from all proposed district piping and lining efficiency projects are included in Table ES-2 below. Locations of proposed projects are shown in Figures ES-1 through ES-3.
Table ES-2 Summary of Proposed Efficiency Projects SAVED WATER (per irrigation
season) COST
Project Location Length Length Total Total Total Total Saved Cost per (Miles) (Feet) AF/Irrigation
Season (180 da
CFS CFS (BOR 1997
Estimatesys) )
Water Cost 2006
AF Saved (average)
AID (P) Laterals 3.03 16,000 2,250 6.30 3.28 ND ND
COID (P) (1)Central Oregon Main 6.35 33,528 15,052 42.16 14.29 $21,020,000 $1,396Pilot Butte Main(5) 5.80 30,624 20,458 57.30 17.12 $16,366,400 $800Central Oregon Laterals 10.36 54,699 3,700 10.36 5.98 $4,217,610 $1,140Pilot Butte Laterals 16.08 84,902 6,770 18.96 15.69 $3,510,276 $518
LPID (P)Main Canals & Laterals 14.41 76,085 2,947 8.27 7.38 $4,800,000 $1,629
NUID (L) (2)(3) Main(5) 18.70 98,736 14,395 40.39 71.56 $15,291,002 $1,062
58-9 Lateral 7.48 39,515 2,678 7.50 4.60 $2,946,240 $1,100
OIDPrineville Diversion Canal 1.25 6,600 ND ND 0.39 ND ND
SID (P)(4) Main Canal(5) 5.10 26,928 9,663 23.20 19.24 $4,628,639 $479Laterals 15.92 84,073 9,500 22.81 22.81 $3,631,613 $382
TSID (P)McKenzie/Black Butte Canal 10.70 56,520 3,035 8.50 6.83 $5,440,800 $1,793Main Canal 3.70 19,536 2,678 7.50 2.07 ND ND
TID (P)(4) Main 6.00 31,680 7,141 20.00 7.22 $14,000,000 $1,961
124.89 659,426 100,268 273.26 198.46 $95,852,580 $1,115On-Farm Efficiency Projects All Districts(6) 10,000 28.10 46.23 $4,956,910 $496
124.88 655,129 110,268 301.36 244.69 $100,809,490 $1,022Totals for all potential projects
Sub-Total
ND: No Data Available (1) Construction and piping cost include a 10% contingency (2) Lining project conserved water assumes an average loss of 1100 AF/mile and a 70% efficiency.
g cost include a 30% contingency. Construction and lining cost includes shotcrete sides
(6)
(3) Construction and lininfrom mile 7.4 to 12.3.
(4) Construction and Piping cost include surveying, engineering. (5) Total saved water costs reflect savings from hydropower production.
Water savings cost based on $/ac-ft saved water for same projects in Reclamation 1997 report.
District Water Conservation Cost Analysis & Prioritization ES-3 Deschutes Water Alliance Issue Paper – Final Report
It is estimated that 110,268 acre-feet could be saved on an annual basis if all efficiency projects ral and
ter conveyance efficiency
ements;
more
Addon in safety hazards associated with open canal systems in
t, irrigation districts in cooperation with consultants, Soil and Water (SWCD) and the National Resources Conservation Service (NRCS) have
l sted in Table ES-2 were implemented. This saved water coi uld then be used for agricultuin-stream flow purposes without increasing consumptive use in the upper Deschutes Basin and would be available to both Reclamation and non-Reclamation projects. Distribution of saved water to users with short supply, including Reclamation projects (NUID), could be facilitated through a water bank. Analysis shows that these proposed projects are cost effective considering previous Reclamation evaluations (1997), completed projects, water savings and costs. Costs associated with implementing the efficiency projects listed in Table ES-2 are approximately $100,809,490. The average cost of saved water per acre foot is about $1,022. Net costs of saved water could actually be lower after accounting for energy benefits related to hydro power. Costs associated with certain efficiency projects in the Three Sisters Irrigation District and Arnold Irrigation District are currently being assessed and are therefore not reflected in the above total cost. The cost for proposed individual lateral and main piping projects ranged from $97 to $1,961 per acre-foot of conserved water. Costs per acre-foot of conserved water in Table ES-2 represent averages across all proposed projects within each district.
Certain districts through further feasibility studies have been able to reduce piping project costs by incorporating hydroelectric facilities in suitable reaches. Waprojects cover a wide range of benefits including:
• Piping reduces liability exposure from safety hazards inherent in open canals in urbanizing areas;
• Piping/lining provides water for in-stream flow and other district water needs; • Piping can eliminate conflict between urban/suburban landowners; • Piping will substantially reduce or eliminate operations and maintenance requir
ts; • Piping can provide gravity pressure with energy conservation benefi• Piping improves reliability of water delivery and improves control of water delivery to
ansport flows; closely match demand fluctuations, which reduces need for additional tr• Piping provides the opportunity to develop small hydropower facilities for revenue
opportunities; • Piping is a logical and practical solution for water conservation, improved delivery
efficiency, energy conservation, reduced operations and maintenance and reduced safety concerns in urbanizing areas.
1. itional benefits involve reduction of annual operations and maintenance costs associated canals and laterals, reductiwith
developing areas, and decreased power costs to irrigators associated with piped pressurized water systems.
On-Farm Efficiency Since the 1997 repor
onservation DistrictsCcompiled and implemented water conservation plans furthering the goal of improving and identifying on-farm efficiency opportunities. Analysis of on-farm conservation opportunities based on the 1997 Reclamation study show that an additional 112,410 to 146,698 ac-ft of water could be saved if on-farm efficiency were improved to 70-80% across all districts. It is unlikely,
District Water Conservation Cost Analysis & Prioritization ES-4 Deschutes Water Alliance Issue Paper – Final Report
however, that on-farm efficiency improvements could be implemented district wide within the next 20 years. Given implementation feasibility, it has been estimated that approximately 10,000 ac-ft could be saved within the next 20 years by on-farm conservation at a cost of approximately $496 per acre-foot of water saved.
Issues Further study should be conducted inbasis. B
order to identify efficiency projects on a district by district y utilizing measuring and monitoring systems combined with seepage analysis,
fficiency projects providing the greatest potential for saved water can be identified. This
ntly, the
ject selection criteria developed in this report to ensure that all basin g these criteria by all interested parties will heduling.
cts is approximately 3% of total average annual recharge.
•
er and during summer in the middle Deschutes River.
eanalysis combined with studies of implementation costs, surrounding land use pressures and use of saved water limitation will help further prioritize potential projects in the basin. Currethis level of detailed analysis has been carried out for only a number of irrigation districts inDeschutes Basin. These studies carried out for all districts will further help prioritize efficiency project implementation.
Additional issues to be addressed are listed below:
• Further evaluate proneeds and concerns are addressed. Solidifyinpromote project selection and implementation sc
• Further determine and assess restraints that exist on the use of saved water for multiple purposes so that projects selected have the greatest potential for satisfying water supply needs of the upper basin.
• Piping and lining of canals and laterals reduces seepage, which contributes to aquifer recharge in the central area of the upper basin. The estimated annual water savings from piping and lining projeNonetheless, considerations of potential impacts of piping and lining related to aquifer recharge are warranted.
Reduced water demand brought about by conveyance efficiency projects should be integrated with reservoir management to help allocate saved water to in-stream flows during winter in the upper Deschutes Riv
• Further evaluate the non-water savings benefit potential of these projects so as to provide additional financing sources.
District Water Conservation Cost Analysis & Prioritization ES-5 Deschutes Water Alliance Issue Paper – Final Report
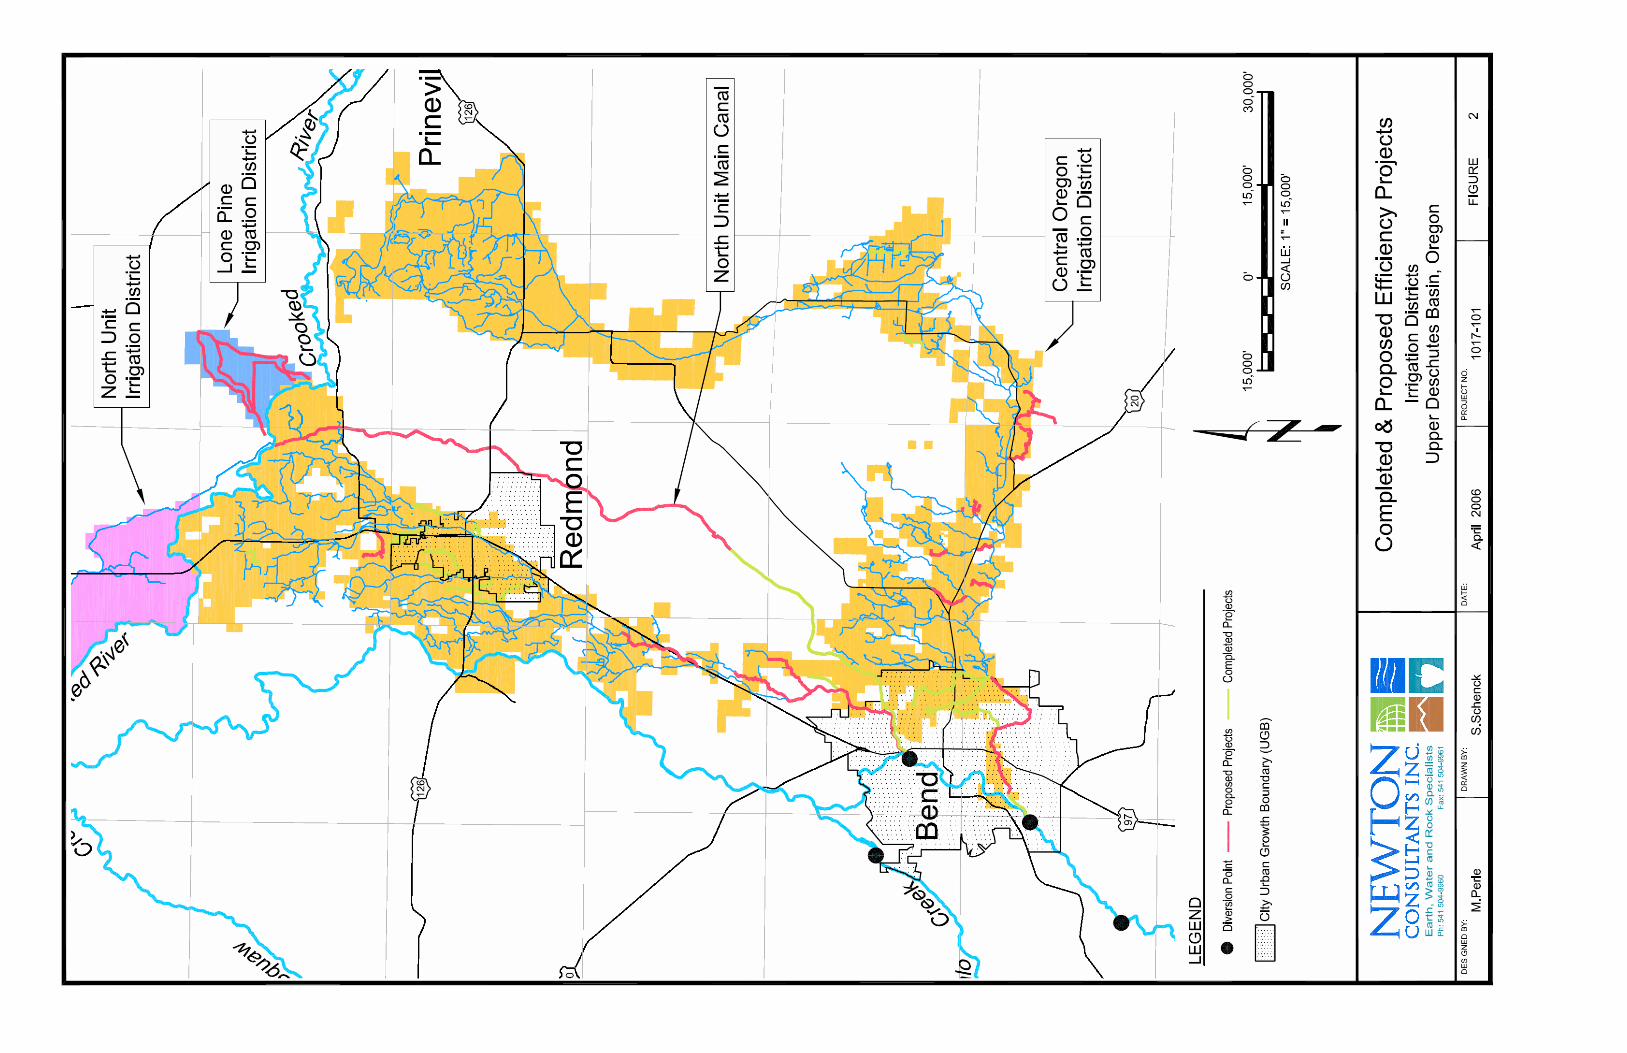
Figure ES-1 Completed and Proposed Efficiency Projects (COID, NUID, LPID)
District Water Conservation Cost Analysis & Prioritization ES-6 Deschutes Water Alliance Issue Paper – Final Report
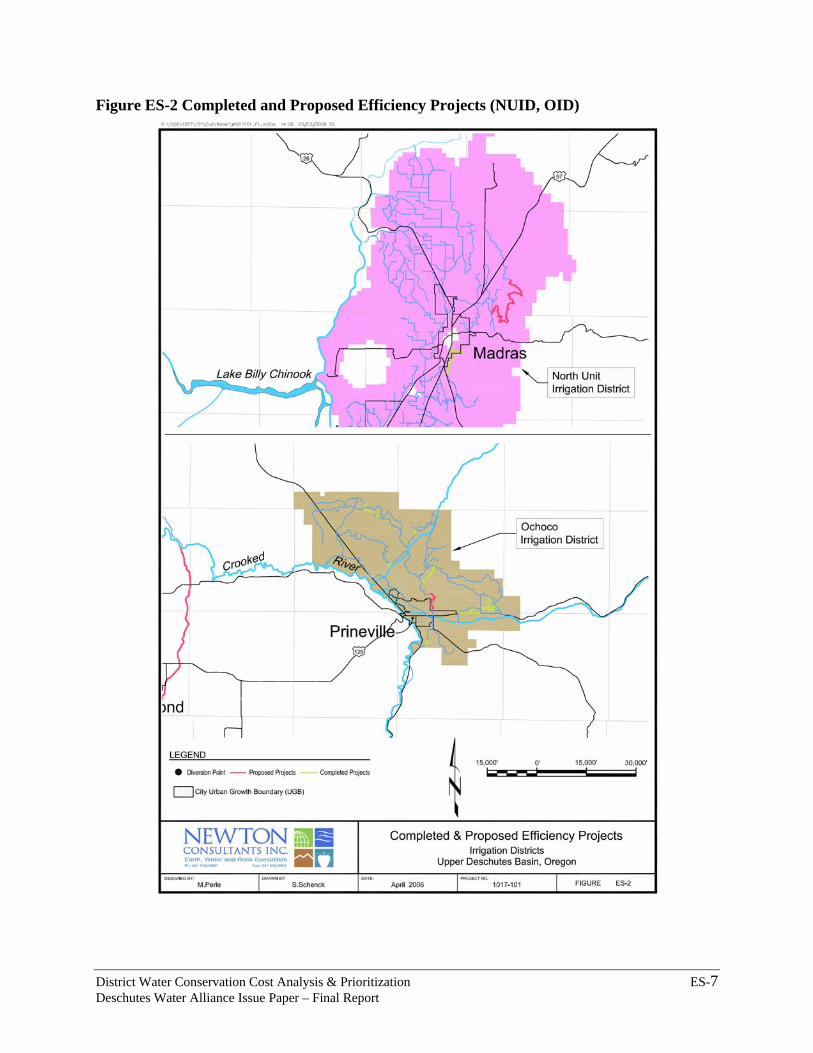
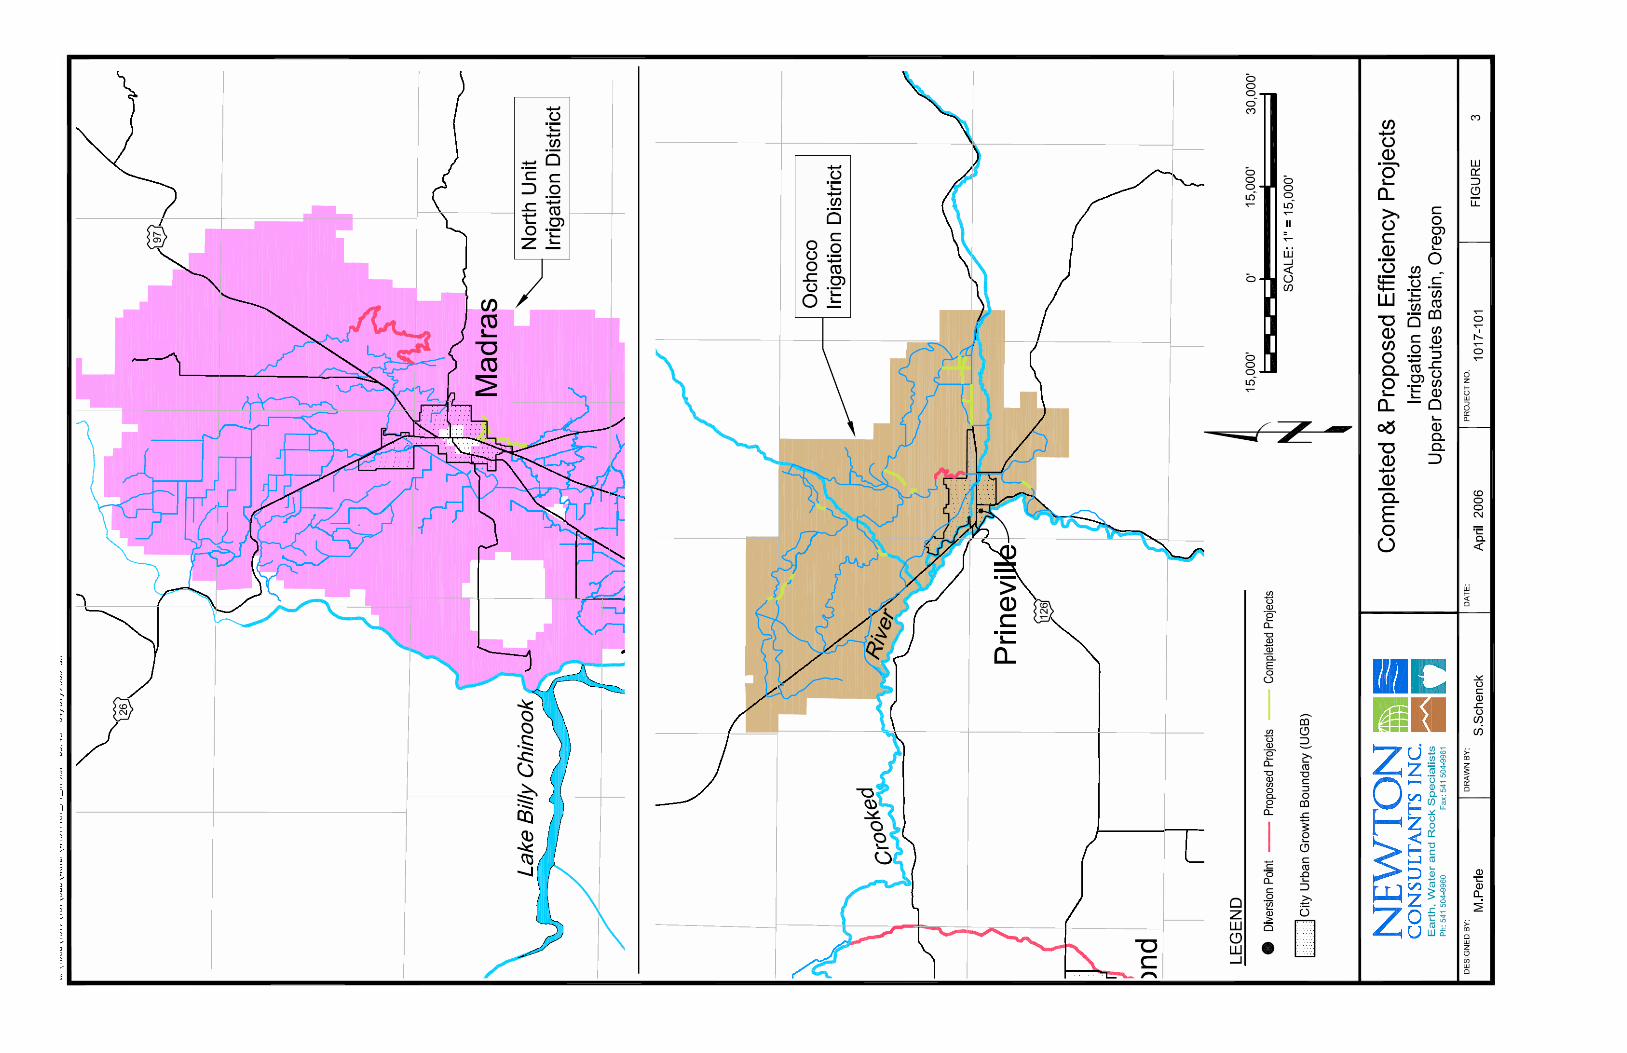
Figure ES-2 Completed and Proposed Efficiency Projects (NUID, OID)
District Water Conservation Cost Analysis & Prioritization ES-7 Deschutes Water Alliance Issue Paper – Final Report
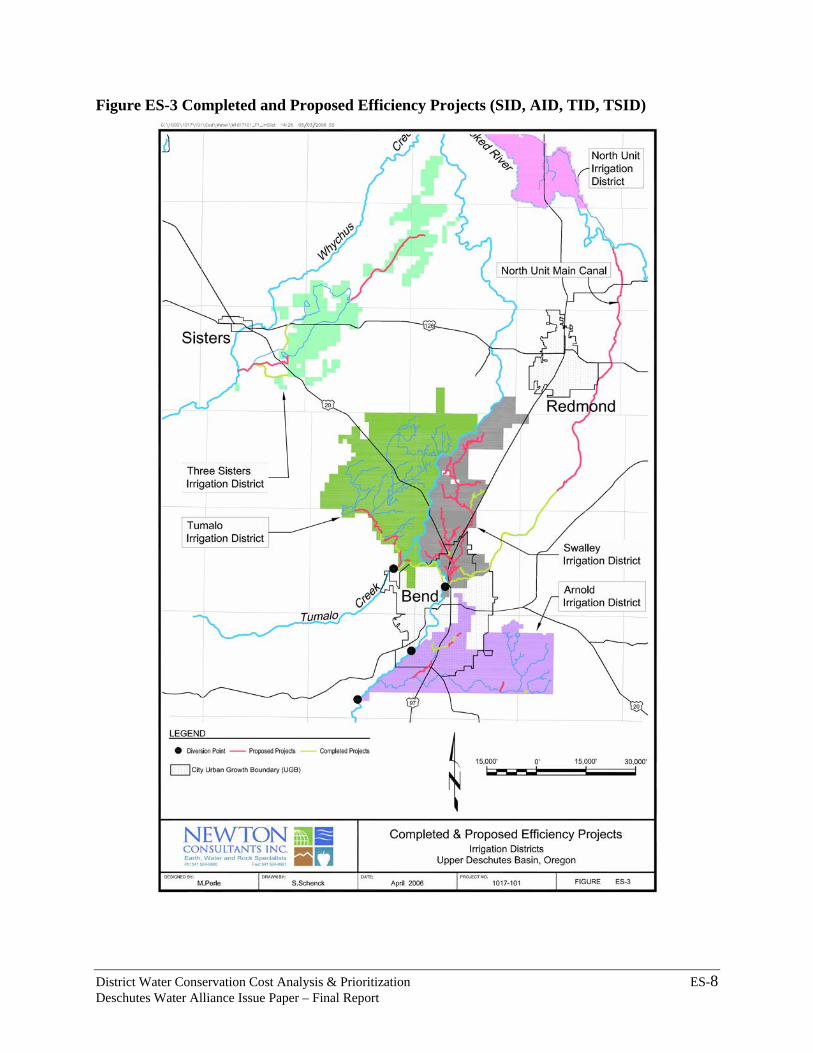
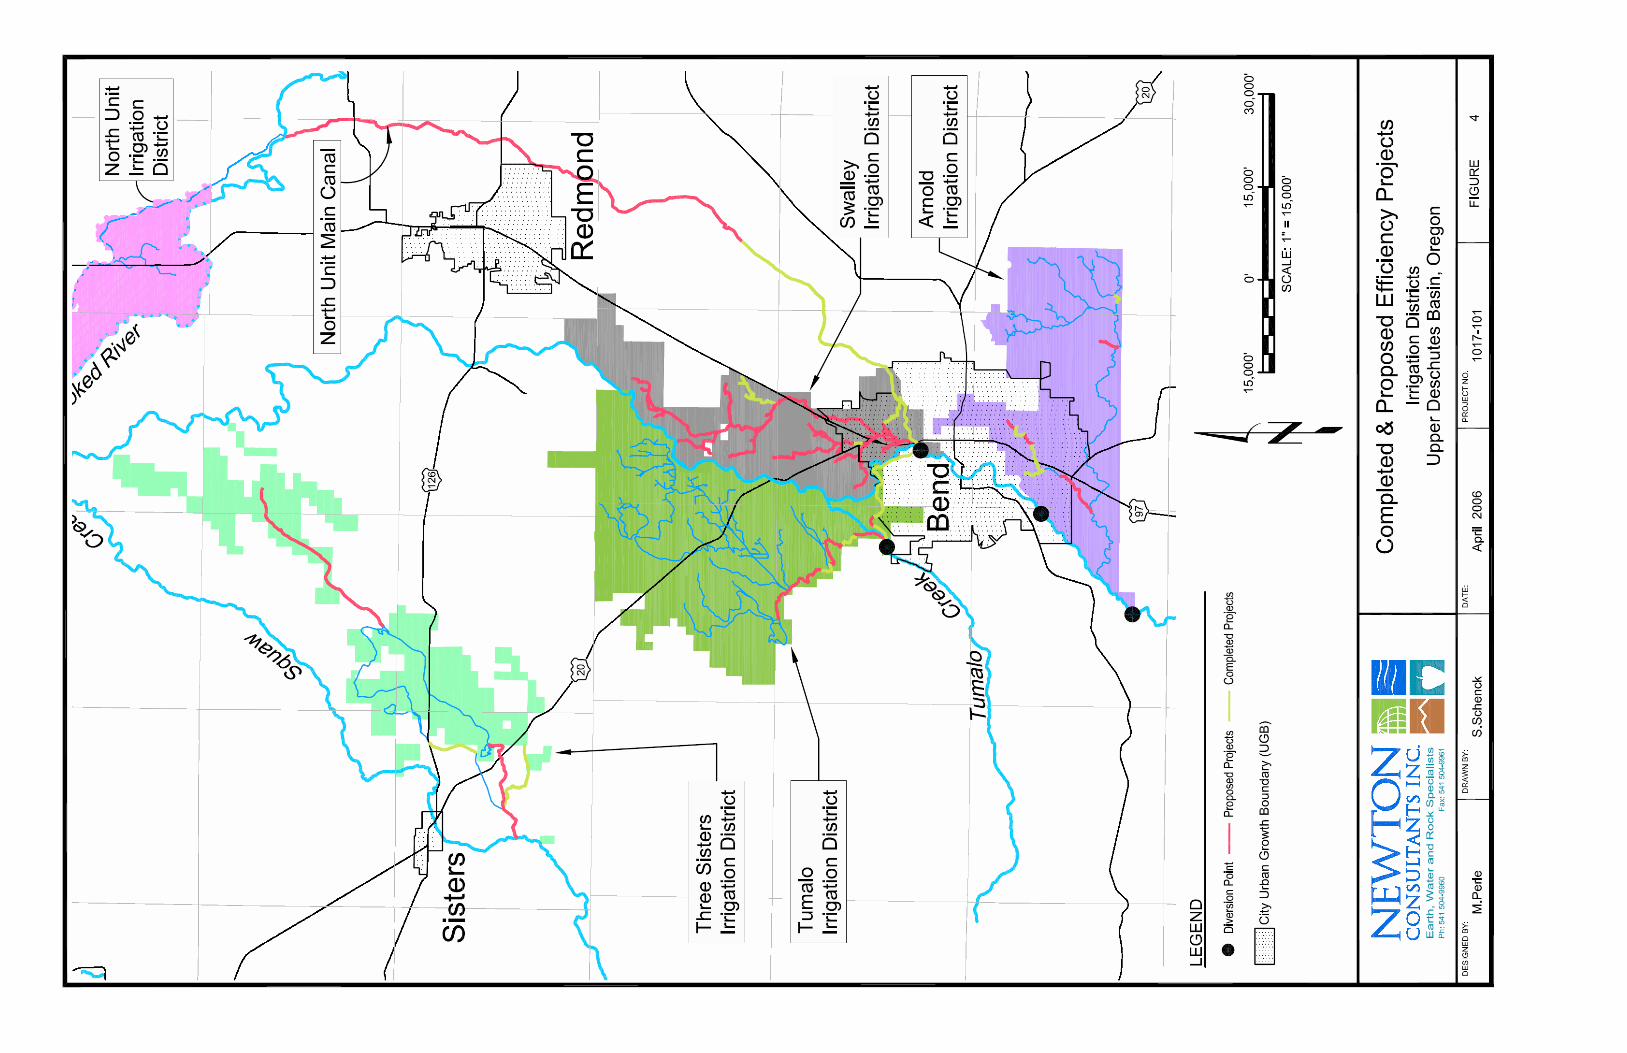
Figure ES-3 Completed and Proposed Efficiency Projects (SID, AID, TID, TSID)
District Water Conservation Cost Analysis & Prioritization ES-8 Deschutes Water Alliance Issue Paper – Final Report
Table of Contents
DEFINITIONS ----------------------------------------------------------------------------- 1
1 PURPOSE------------------------------------------------------------------------------- 2
2 PREVIOUS STUDIES---------------------------------------------------------------- 2
3 COMPLETED PROJECTS--------------------------------------------------------- 5
3.1 CENTRAL OREGON IRRIGATION DISTRICT--------------------------------- 6 3.2 NORTH UNIT IRRIGATION DISTRICT ---------------------------------------- 6 3.3 SWALLEY IRRIGATION DISTRICT -------------------------------------------- 6 3.4 THREE SISTERS IRRIGATION DISTRICT ------------------------------------- 6 3.5 TUMALO IRRIGATION DISTRICT --------------------------------------------- 7
4 CONSIDERATIONS IN SELECTING EFFICIENCY IMPROVEMENT OPPORTUNITIES FOR ANALYSIS--------------------------------------------- 7
4.1 OBJECTIVE ---------------------------------------------------------------------- 7 4.2 BENEFIT POTENTIAL FROM EFFICIENCY IMPROVEMENTS--------------- 8
4.2.1 Agriculture ----------------------------------------------------------------------- 8 4.2.2 Stream Flow ---------------------------------------------------------------------- 9 4.2.3 Urbanization ------------------------------------------------------------------- 10
4.3 FEDERAL & OTHER CONSTRAINTS ON REALLOCATED WATER-------- 10 4.3.1 Federal Constraint ------------------------------------------------------------ 10
4.4 URBANIZATION IMPACTS ON DISTRICTS----------------------------------- 12
5 OVERVIEW OF DISTRICT CONDITIONS ---------------------------------- 12
5.1 GEOLOGIC INFLUENCE ------------------------------------------------------- 12 5.2 ARNOLD IRRIGATION DISTRICT (AID)------------------------------------- 13 5.3 CENTRAL OREGON IRRIGATION DISTRICT (COID) --------------------- 13 5.4 LONE PINE IRRIGATION DISTRICT (LPID) -------------------------------- 13 5.5 NORTH UNIT IRRIGATION DISTRICT (NUID) ----------------------------- 14 5.6 OCHOCO IRRIGATION DISTRICT (OID) ------------------------------------ 14 5.7 SWALLEY IRRIGATION DISTRICT (SID)------------------------------------ 14 5.8 THREE SISTERS IRRIGATION DISTRICT (TSID) -------------------------- 15 5.9 TUMALO IRRIGATION DISTRICT (TID) ------------------------------------ 15
6 METHODS FOR EFFICIENCY IMPROVEMENTS ------------------------ 15
6.1 LINERS -------------------------------------------------------------------------- 15 6.2 PIPE------------------------------------------------------------------------------ 16
District Water Conservation Cost Analysis & Prioritization i Deschutes Water Alliance Issue Paper – Final Report
7 PROPOSED PROJECT ANALYSIS--------------------------------------------- 17
7.1 CONVEYANCE EFFICIENCY -------------------------------------------------- 17 7.1.1 Arnold Irrigation District --------------------------------------------------- 18 7.1.2 Central Oregon Irrigation District ---------------------------------------- 18 7.1.3 Lone Pine Irrigation District------------------------------------------------ 20 7.1.4 North Unit Irrigation District ---------------------------------------------- 21 7.1.5 Ochoco Irrigation District--------------------------------------------------- 22 7.1.6 Swalley Irrigation District--------------------------------------------------- 23 7.1.7 Three Sisters Irrigation District-------------------------------------------- 24 7.1.8 Tumalo Irrigation District -------------------------------------------------- 25
7.2 ON-FARM EFFICIENCY ------------------------------------------------------- 26 7.2.1 Potential Water Savings & Limitations ---------------------------------- 26 7.2.2 On-Farm Efficiency Methods----------------------------------------------- 27 7.2.3 Sprinkler Irrigation System Improvements: ---------------------------- 28 7.2.4 Surface (flood) Irrigation Systems----------------------------------------- 29 7.2.5 Delivery Systems -------------------------------------------------------------- 29 7.2.6 Conversion of Flood Systems to Sprinkler Systems-------------------- 29
8 SUMMARY OF FINDINGS ------------------------------------------------------- 29
9 REFERENCES ----------------------------------------------------------------------- 33
Tables Table 1. USGS 2001 Canal Losses ............................................................................................... 4 Table 2. Completed Lining and Piping Projects and Water Savings....................................... 5 Table 3. AID Summary of Potential Projects........................................................................... 18 Table 4. COID Proposed Efficiency Projects ........................................................................... 19 Table 5. LPID Proposed Efficiency Projects ............................................................................ 20 Table 6. NUID Proposed Efficiency Projects ........................................................................... 21 Table 7. OID Proposed Efficiency Projects .............................................................................. 22 Table 8. SID Proposed Efficiency Projects ............................................................................... 23 Table 9. TSID Proposed Efficiency Projects ............................................................................ 25 Table 10. TID Proposed Efficiency Projects............................................................................. 25 Table 11. On-Farm Efficiency Summary (1997 BOR) ............................................................ 26 Table 12. Potential Irrigation Efficiency (Ultimate, Design, Seasonal & Typical) ............... 28 Table 13. Summary of Potential Water Savings From All Districts ...................................... 30
District Water Conservation Cost Analysis & Prioritization ii Deschutes Water Alliance Issue Paper – Final Report
DEFINITIONS
Saved Water: Efficiency improvements including piping/lining of canals and improved on-farm efficiency reduce seepage losses that would recharge groundwater. The total amount of water available from these efficiency improvements is considered saved water.
Conserved water: Amount of saved water that is made available for transfer. Conserved water
transfers allow for a portion of the conserved water to either be used on additional lands, apply the water to new uses, or dedicate the water to in-stream use. The percentage of saved water that may be applied to new uses or lands depends on the amount of state or federal funding contributed to the conservation project. The State of Oregon defines Conserved Water as: “that amount of water that results from conservation measures, measured as the difference between the smaller of the amount stated on the water right or the maximum amount of water that can be diverted using the existing facilities and the amount of water needed after implementation of conservation measures to meet the beneficial use under the water right certificate. (ORS 537.455 & ORS 537.460)
Seepage Loss: Refers to waters infiltrating into the ground through the walls of open irrigation distribution systems. In the Deschutes Basin, this water “lost” to the ground becomes in large part recharge to basin groundwater. This distribution system “seepage loss” therefore moves through the Deschutes subbasin as groundwater and eventually into the Lower Deschutes River. Piping and lining by reducing “seepage loss” does not generate new water but redistributes how the water flows through surface/groundwater system.
Acre-foot: The amount of water required to cover one acre to a depth of one foot. An acre-foot equals 326,851 gallons, or 43,560 cubic feet.
CFS: The rate of discharge representing a volume of 1 cubic foot passing a given point during 1 second and equivalent to 7.48 gallons per second or 448.8 gallons per minute.
District Water Conservation Cost Analysis & Prioritization 1 Deschutes Water Alliance Issue Paper – Final Report
1 PURPOSE
This paper presents the results of Irrigation District cost analysis and prioritization evaluation for efficiency improvements in irrigation districts located in the upper Deschutes Basin, Oregon. The evaluation is focused on opportunities for efficiency improvements in water conveyance facilities and in on-farm irrigation practice.
Improvement of water use efficiency is an important element of water resources planning and management activities in the upper basin for responding to changing basin needs. Opportunities for improving efficiency were evaluated and prioritized according to costs and potential for broadening the benefits of water use in the upper basin under existing water rights. The intent of this paper is to identify specific projects and their priorities for implementation under an integrated water resources management and restoration program implemented by the Deschutes Water Alliance. The intent is also to describe the amount of water that can be made available through efficiency improvements that can be used to broaden water use benefits in the upper basin under existing water rights. A fundamental objective is to help meet water supply needs with existing water rights, while maintaining consumptive use increases at limited levels. Finally, the intent of this paper is to also provide a basis for planning and implementing other projects in conjunction with efficiency improvements. A companion Reservoir Optimization Study paper addresses how efficiency improvements and reduced water demand described in this paper combined with optimizing reservoir management can help provide for future basin water needs.
2 PREVIOUS STUDIES
Improved effectiveness of water use for a broader range of benefits has long been considered for the upper basin. Previous investigations and reports reflect management objectives with the intent and prior commitment of upper basin stakeholders to develop solutions for water supply issues.
The Bureau of Reclamation (BOR) prepared a report in 1961 on unassigned space in Prineville Reservoir. This report indicated that much more dry land was available that could be irrigated with available water supply. The Oregon State Water Resources Board evaluated the entire Deschutes Basin and concluded that water shortages on irrigated land could be reduced significantly by sealing reservoirs and lining canals and ditches. Sealing would reduce seepage losses, providing more water for beneficial uses.
The BOR initiated plans in 1963 for studying final disposition of unassigned water in Prineville Reservoir. The scope of the BOR study was modified to account for a flume crossing pumping plant planned by the North Unit Irrigation District (NUID) and public demand for fish and wildlife enhancement, recreation, water quality and domestic, municipal and industrial water. The study was then directed to development and use of water supplies for existing and potential needs in the Central Deschutes area.
Field studies for the 1963 study were essentially complete for a “plan of development”; however, dramatic increases in project costs and increases in federal discount rate made the plan economically infeasible. On this basis, the purpose of the study was changed to develop a
District Water Conservation Cost Analysis & Prioritization 2 Deschutes Water Alliance Issue Paper – Final Report
“framework plan” with recommendations for detailed studies of project components that appeared economically justifiable at that time.
The “framework plan” was presented in the 1972 BOR investigation “Special Report on Potentials for Expansion and Improvement of Water Supplies, Deschutes Project, Central Division, Oregon”. The framework plan is based on the utilization of water from: 1) unassigned space in Prineville Reservoir, 2) new storage in the Deschutes and Crooked Rivers and 3) an extensive canal lining-water savings program. Components of the framework plan were intended to meet portions of the intermediate and long-range multipurpose water resource needs of the Central Deschutes area. These fundamental components provided for the following:
• Reservoir recreation development; • Storage releases to sustain flows for enhancing stream fishery resources and recreation
opportunities, and to improve stream quality and esthetic values; • Provision of water supply for irrigation of about 178,000 acres, of which about 53,000
acres were dry at the time; and • Provisions for municipal, industrial and domestic water supplies to meet the growing
needs of the area.
The unassigned space in Prineville Reservoir remains at 82,500 acre-feet. Although the framework plan assigned the unassigned space in the Prineville Reservoir to various uses, this was never implemented. The framework plan assigned 73,400 acre-feet to reservoir fishery and recreation enhancement. The plan assigned 6,500 acre-feet to municipal, industrial and domestic water supplies for the City of Prineville and around Prineville Reservoir, and assigned 2,600 acre-feet for irrigation of about 300 acres of new land in the Jap Creek area downstream from Prineville.
Four new storage reservoirs were proposed in the framework plan: Monner, Big Marsh, Big Prairie and Beaver Creek. The total storage capacity of these four reservoirs was estimated at 393,000 acre-feet.
The BOR conducted investigations of various liner alternatives in the early to middle 1990’s as part of a follow-up study of conservation opportunities in the upper Deschutes Basin. The report “Upper Deschutes River Basin Water Conservation Study, Special Report, Crook, Deschutes, and Jefferson Counties, Oregon”, published in April 1997 by the BOR is the culmination of this study and presents a wide range of potential conservation projects intended for the following purposes:
• Improve the reliability of irrigation supplies; and • Improve the availability of water for other uses, including in-stream flows, through
increased water use efficiency in the upper Deschutes River basin.
Specific emphasis of the study was on increasing winter flows in the Deschutes River downstream from Wickiup Dam and increasing summer flows in the River downstream from the North Dam in Bend. The BOR recognized that improvement of flows in these two reaches would enhance fish and wildlife resources, recreation and water quality.
District Water Conservation Cost Analysis & Prioritization 3 Deschutes Water Alliance Issue Paper – Final Report
Although the study presents many potential conservation projects in the various irrigation districts, it also stipulates that districts must develop a systematic plan for implementing conservation projects. Water resources issues in the upper basin resulted in more district focus on conservation planning to find proactive ways for responding to these issues. Conservation planning efforts by many districts in recent years provide a basis for implementing conservation projects in a systematic manner.
The State of Oregon has declared a policy in statute, ORS 537.460(2), that conservation and efficient utilization of water benefits all water users, provides water to satisfy current and future needs through reduction of consumptive waste, improves water quality by reducing contaminated return flow, prevents erosion and allows increased in-stream flow by aggressively promoting conservation, encouraging the highest and best use of water by allowing the sale or lease of the right to the use of conserved water; and encourage local cooperation and coordination in development of conservation projects to provided incentives for increased efficiency and to improve stream flows. All of the upper basin districts have prepared conservation plans, which identify specific projects, potential reductions in seepage loss and costs based on more detailed consideration of district operations. In conjunction with these plans, many districts also implemented flow measurement programs to obtain more accurate seepage loss information and to better define conservation opportunities.
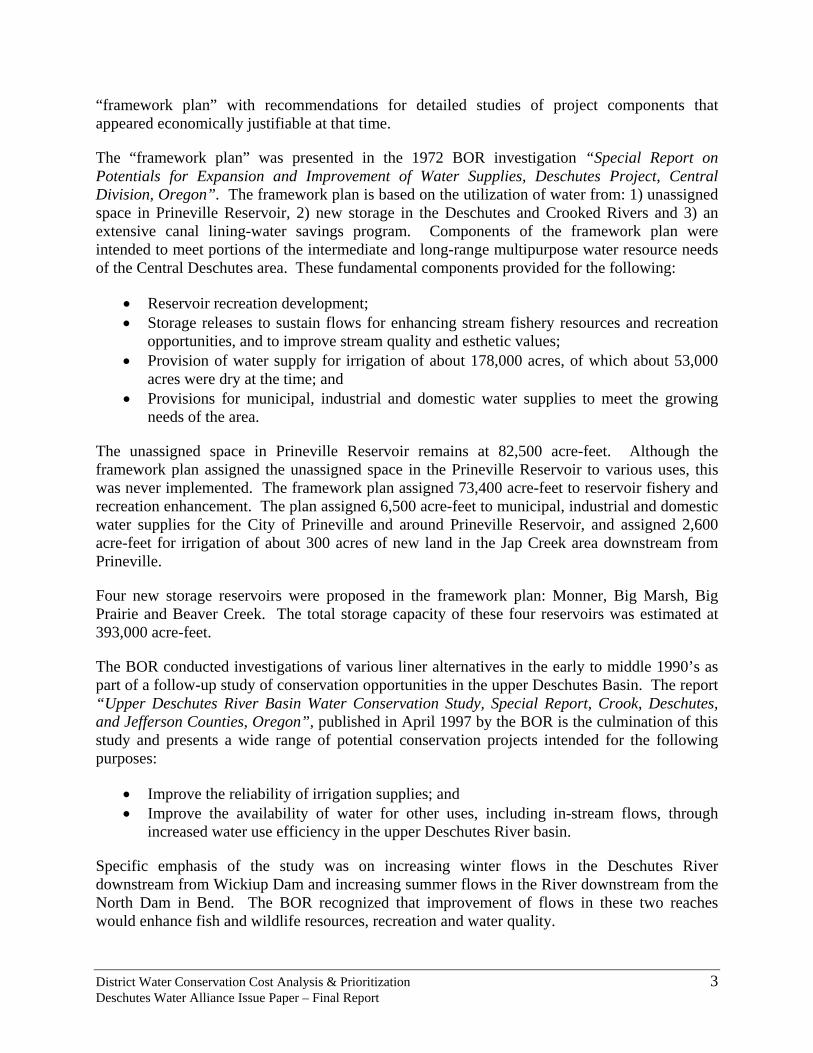
The USGS 2001 report “Groundwater Hydrology of the Upper Deschutes Basin, Oregon” determined seepage losses by major canal service areas in evaluating the groundwater hydrology of the basin. The findings are summarized in Table 1. The summary also includes the estimated seepage losses per acre of irrigated area to help indicate locations of higher seepage losses. This ratio is based on irrigated area of only high and medium water-use crops and does not include area of low water-use crops. .
Table 1. USGS 2001 Canal Losses
able 1 indicates that districts with highest seepage losses, in descending order are Swalley, Arnold, Central Oregon (Pilot Butte and Central Oregon Canals) and Tumalo. The least amount of seepage loss is in the Ochoco Irrigation District.
CanalTotal
Irrigated Area
High & Medium Water use
Irrigated Area (ac)
Losses (ac-ft)
Losses / ac (ac-ft / ac)
Arnold 4,385 2,310 16,170 7.00Central Oregon 44,800 37,300 142,050 3.81
North Unit 58,925 45,000 99,520 2.21Lone Pine 2,369 2,390 4,920 2.06Ochoco 20,145 16,600 21,680 1.31
Three Sisters 7,570 5,450 13,210 2.42Tumalo 8,195 4,890 23,770 4.86Swalley 4,540 2,450 27,500 11.22Totals 150,929 116,390 348,820
T
District Water Conservation Cost Analysis & Prioritization 4 Deschutes Water Alliance Issue Paper – Final Report
3 COMPLETED PROJECTS
Irrigation districts have completed many conservation projects since 1997 to improve or irrigation and stream flow augmentation.
Figures 2, 3, 4. As can be seen on the maps, certain canals and laterals were piped within Bend, Redmond and Madras Urban Growth Boundaries to
Irrigation Saving per
conveyance efficiency and provide water fCompleted project locations are shown in
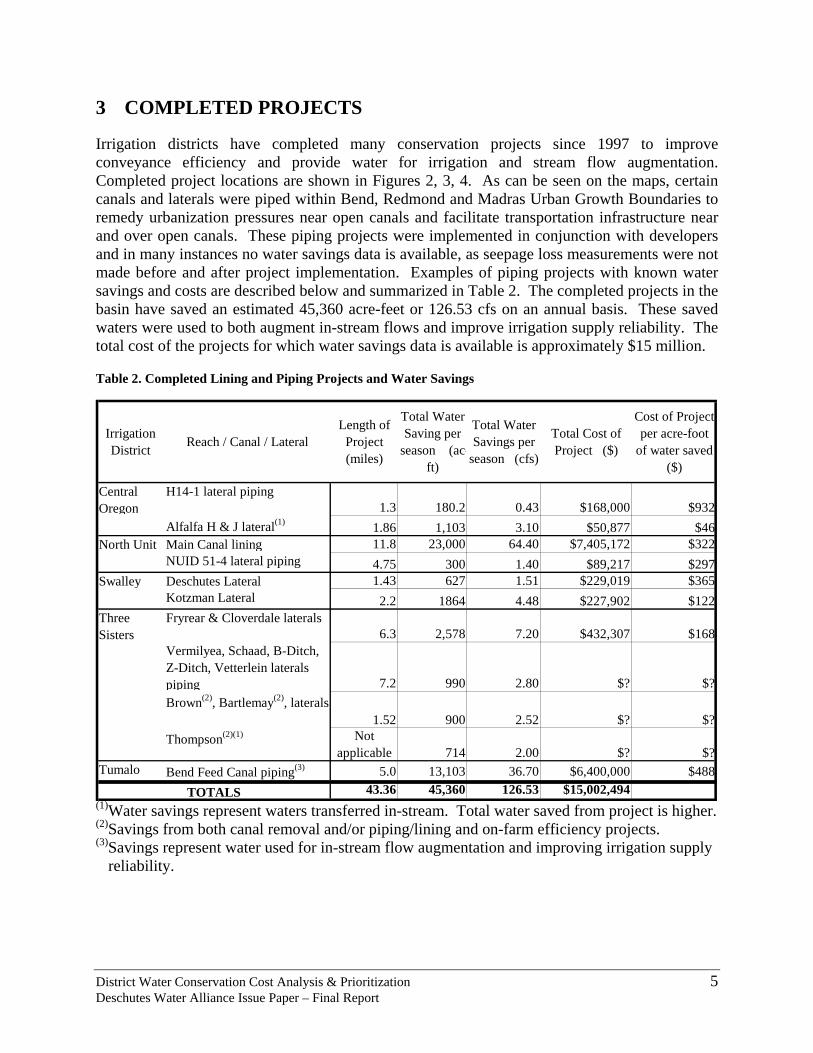
remedy urbanization pressures near open canals and facilitate transportation infrastructure near and over open canals. These piping projects were implemented in conjunction with developers and in many instances no water savings data is available, as seepage loss measurements were not made before and after project implementation. Examples of piping projects with known water savings and costs are described below and summarized in Table 2. The completed projects in the basin have saved an estimated 45,360 acre-feet or 126.53 cfs on an annual basis. These saved waters were used to both augment in-stream flows and improve irrigation supply reliability. The total cost of the projects for which water savings data is available is approximately $15 million.
Table 2. Completed Lining and Piping Projects and Water Savings
Length of Total Water
(1)Water savings represent waters transferred in-stream. Total water saved from project is higher. (2)Savings from both canal removal and/or piping/lining and on-farm efficiency projects. (3)Savings represent water used for in-stream flow augmentation and improving irrigation supply
reliability.
District Reach / Canal / Lateral Project (miles) season (ac-
ft)
avings per ason (cfs)
Total Cost of Project ($)
per acre-foot of water saved
($)
Central Ore
Total Water Cost of Project
Sse
gonH14-1 lateral piping
1.3 180.2 0.43 $168,000 $932Alfalfa H & J lateral(1) 1.86 1,103 3.10 $50,877 $46
North Unit Main Canal lining 11.8 23,000 64.40 $7,405,172 $322 NUID 51-4 lateral piping 4.75 300 1.40 $89,217 $297
Swalley Deschutes Lateral 1.43 627 1.51 $229,019 $365 Kotzman Lateral 2.2 1864 4.48 $227,902 $122
Three Sisters
Fryrear & Cloverdale laterals6.3 2,578 7.20 $432,307 $168
Vermilyea, Schaad, B-Ditch, Z-Ditch, Vetterlein laterals piping 7.2 990 2.80 $? $?Brown(2), Bartlemay(2), laterals
1.52 900 2.52 $? $?Thompson(2)(1) Not
applicable 714 2.00 $? $?Tumalo Bend Feed Canal piping(3) 5.0 13,103 36.70 $6,400,000 $488
43.36 45,360 126.53 $15,002,494 TOTALS
District Water Conservation Cost Analysis & Prioritization 5 Deschutes Water Alliance Issue Paper – Final Report
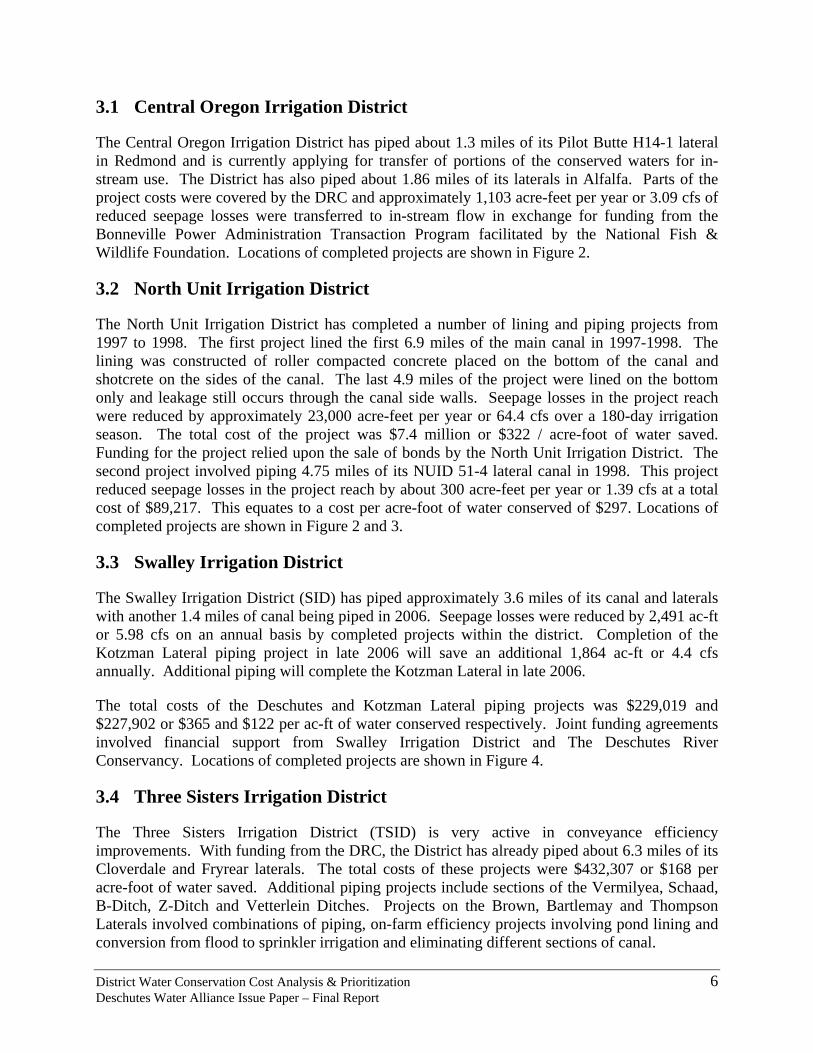
3.1 Central Oregon Irrigation District
The Central Oregon Irrigation District has piped about 1.3 miles of its Pilot Butte H14-1 lateral in Redmond and is currently applying for transfer of portions of the conserved waters for in-stream use. The District has also piped about 1.86 miles of its laterals in Alfalfa. Parts of the project costs were covered by the DRC and approximately 1,103 acre-feet per year or 3.09 cfs of reduced seepage losses were transferred to in-stream flow in exchange for funding from the Bonneville Power Administration Transaction Program facilitated by the National Fish & Wildlife Foundation. Locations of completed projects are shown in Figure 2.
3.2 North Unit Irrigation District
The North Unit Irrigation District has completed a number of lining and piping projects from 1997 to 1998. The first project lined the first 6.9 miles of the main canal in 1997-1998. The lining was constructed of roller compacted concrete placed on the bottom of the canal and shotcrete on the sides of the canal. The last 4.9 miles of the project were lined on the bottom only and leakage still occurs through the canal side walls. Seepage losses in the project reach were reduced by approximately 23,000 acre-feet per year or 64.4 cfs over a 180-day irrigation season. The total cost of the project was $7.4 million or $322 / acre-foot of water saved. Funding for the project relied upon the sale of bonds by the North Unit Irrigation District. The second project involved piping 4.75 miles of its NUID 51-4 lateral canal in 1998. This project reduced seepage losses in the project reach by about 300 acre-feet per year or 1.39 cfs at a total cost of $89,217. This equates to a cost per acre-foot of water conserved of $297. Locations of completed projects are shown in Figure 2 and 3.
3.3 Swalley Irrigation District
The Swalley Irrigation District (SID) has piped approximately 3.6 miles of its canal and laterals with another 1.4 miles of canal being piped in 2006. Seepage losses were reduced by 2,491 ac-ft or 5.98 cfs on an annual basis by completed projects within the district. Completion of the Kotzman Lateral piping project in late 2006 will save an additional 1,864 ac-ft or 4.4 cfs annually. Additional piping will complete the Kotzman Lateral in late 2006.
The total costs of the Deschutes and Kotzman Lateral piping projects was $229,019 and $227,902 or $365 and $122 per ac-ft of water conserved respectively. Joint funding agreements involved financial support from Swalley Irrigation District and The Deschutes River Conservancy. Locations of completed projects are shown in Figure 4.
3.4 Three Sisters Irrigation District
The Three Sisters Irrigation District (TSID) is very active in conveyance efficiency improvements. With funding from the DRC, the District has already piped about 6.3 miles of its Cloverdale and Fryrear laterals. The total costs of these projects were $432,307 or $168 per acre-foot of water saved. Additional piping projects include sections of the Vermilyea, Schaad, B-Ditch, Z-Ditch and Vetterlein Ditches. Projects on the Brown, Bartlemay and Thompson Laterals involved combinations of piping, on-farm efficiency projects involving pond lining and conversion from flood to sprinkler irrigation and eliminating different sections of canal.
District Water Conservation Cost Analysis & Prioritization 6 Deschutes Water Alliance Issue Paper – Final Report
These projects have improved water use efficiency allowing more reliable water supply to water users and augmentation of stream flows in Whychus Creek. Reducing seepage losses and increasing on-farm efficiency in the TSID has allowed approximately 5,182 acre-feet per year, or an average of 14.5 cfs to be saved on annual basis. This saved water has been used to provide reliable irrigation supply to irrigators and to improve in-stream flows. As a result of these projects, year round flow has been restored to Whychus Creek where it had traditionally been dewatered during the irrigation season. Locations of completed projects are shown in Figure 4.
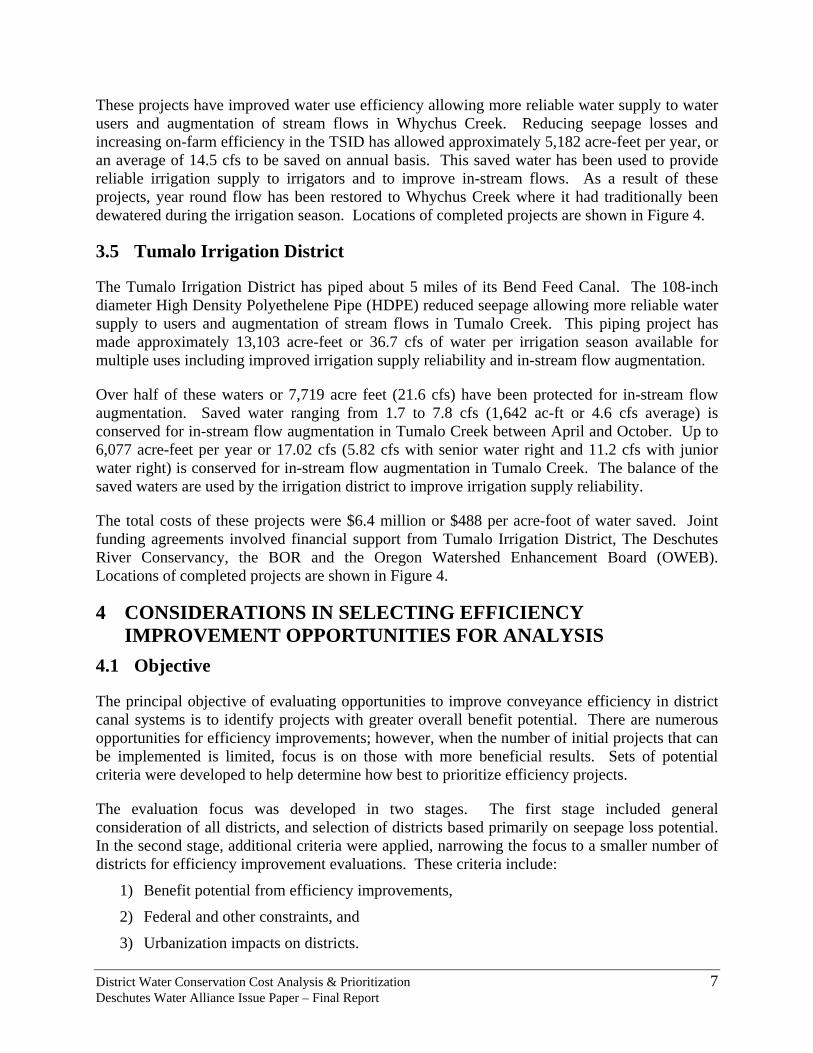
3.5 Tumalo Irrigation District
The Tumalo Irrigation District has piped about 5 miles of its Bend Feed Canal. The 108-inch diameter High Density Polyethelene Pipe (HDPE) reduced seepage allowing more reliable water supply to users and augmentation of stream flows in Tumalo Creek. This piping project has made approximately 13,103 acre-feet or 36.7 cfs of water per irrigation season available for multiple uses including improved irrigation supply reliability and in-stream flow augmentation.
Over half of these waters or 7,719 acre feet (21.6 cfs) have been protected for in-stream flow augmentation. Saved water ranging from 1.7 to 7.8 cfs (1,642 ac-ft or 4.6 cfs average) is conserved for in-stream flow augmentation in Tumalo Creek between April and October. Up to 6,077 acre-feet per year or 17.02 cfs (5.82 cfs with senior water right and 11.2 cfs with junior water right) is conserved for in-stream flow augmentation in Tumalo Creek. The balance of the saved waters are used by the irrigation district to improve irrigation supply reliability.
The total costs of these projects were $6.4 million or $488 per acre-foot of water saved. Joint funding agreements involved financial support from Tumalo Irrigation District, The Deschutes River Conservancy, the BOR and the Oregon Watershed Enhancement Board (OWEB). Locations of completed projects are shown in Figure 4.
4 CONSIDERATIONS IN SELECTING EFFICIENCY IMPROVEMENT OPPORTUNITIES FOR ANALYSIS
4.1 Objective
The principal objective of evaluating opportunities to improve conveyance efficiency in district canal systems is to identify projects with greater overall benefit potential. There are numerous opportunities for efficiency improvements; however, when the number of initial projects that can be implemented is limited, focus is on those with more beneficial results. Sets of potential criteria were developed to help determine how best to prioritize efficiency projects.
The evaluation focus was developed in two stages. The first stage included general consideration of all districts, and selection of districts based primarily on seepage loss potential. In the second stage, additional criteria were applied, narrowing the focus to a smaller number of districts for efficiency improvement evaluations. These criteria include:
1) Benefit potential from efficiency improvements,
2) Federal and other constraints, and
3) Urbanization impacts on districts.
District Water Conservation Cost Analysis & Prioritization 7 Deschutes Water Alliance Issue Paper – Final Report
4.2 Benefit Potential from Efficiency Improvements
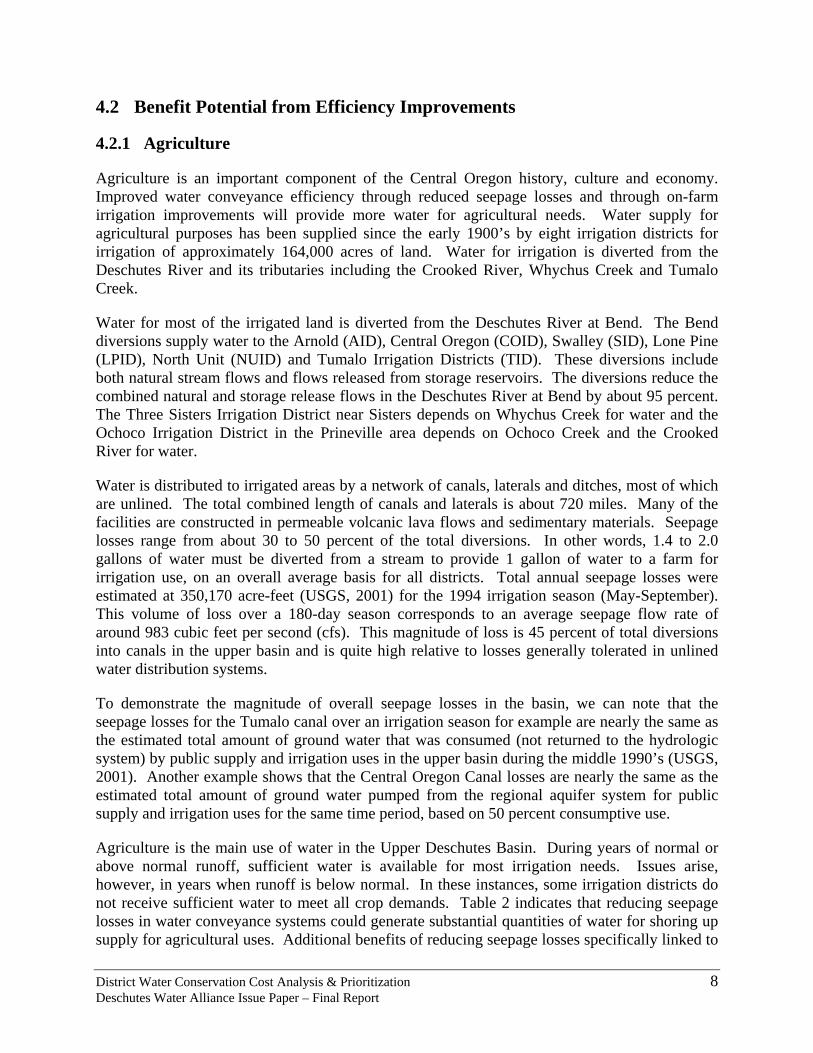
4.2.1 Agriculture
Agriculture is an important component of the Central Oregon history, culture and economy. Improved water conveyance efficiency through reduced seepage losses and through on-farm irrigation improvements will provide more water for agricultural needs. Water supply for agricultural purposes has been supplied since the early 1900’s by eight irrigation districts for irrigation of approximately 164,000 acres of land. Water for irrigation is diverted from the Deschutes River and its tributaries including the Crooked River, Whychus Creek and Tumalo Creek.
Water for most of the irrigated land is diverted from the Deschutes River at Bend. The Bend diversions supply water to the Arnold (AID), Central Oregon (COID), Swalley (SID), Lone Pine (LPID), North Unit (NUID) and Tumalo Irrigation Districts (TID). These diversions include both natural stream flows and flows released from storage reservoirs. The diversions reduce the combined natural and storage release flows in the Deschutes River at Bend by about 95 percent. The Three Sisters Irrigation District near Sisters depends on Whychus Creek for water and the Ochoco Irrigation District in the Prineville area depends on Ochoco Creek and the Crooked River for water.
Water is distributed to irrigated areas by a network of canals, laterals and ditches, most of which are unlined. The total combined length of canals and laterals is about 720 miles. Many of the facilities are constructed in permeable volcanic lava flows and sedimentary materials. Seepage losses range from about 30 to 50 percent of the total diversions. In other words, 1.4 to 2.0 gallons of water must be diverted from a stream to provide 1 gallon of water to a farm for irrigation use, on an overall average basis for all districts. Total annual seepage losses were estimated at 350,170 acre-feet (USGS, 2001) for the 1994 irrigation season (May-September). This volume of loss over a 180-day season corresponds to an average seepage flow rate of around 983 cubic feet per second (cfs). This magnitude of loss is 45 percent of total diversions into canals in the upper basin and is quite high relative to losses generally tolerated in unlined water distribution systems.
To demonstrate the magnitude of overall seepage losses in the basin, we can note that the seepage losses for the Tumalo canal over an irrigation season for example are nearly the same as the estimated total amount of ground water that was consumed (not returned to the hydrologic system) by public supply and irrigation uses in the upper basin during the middle 1990’s (USGS, 2001). Another example shows that the Central Oregon Canal losses are nearly the same as the estimated total amount of ground water pumped from the regional aquifer system for public supply and irrigation uses for the same time period, based on 50 percent consumptive use.
Agriculture is the main use of water in the Upper Deschutes Basin. During years of normal or above normal runoff, sufficient water is available for most irrigation needs. Issues arise, however, in years when runoff is below normal. In these instances, some irrigation districts do not receive sufficient water to meet all crop demands. Table 2 indicates that reducing seepage losses in water conveyance systems could generate substantial quantities of water for shoring up supply for agricultural uses. Additional benefits of reducing seepage losses specifically linked to
District Water Conservation Cost Analysis & Prioritization 8 Deschutes Water Alliance Issue Paper – Final Report
canal piping include added advantages in power savings related to pressurized water and potential for power production. Pressurized water in pipes can significantly reduce or eliminate the power needed to operate sprinkler irrigation pumps. The potential for power production that that arises with piping canals can help defray the costs of construction and make the projects more feasible from an economic standpoint.
Additional water can be generated by improving efficiency of water use during irrigation. These “on-farm” opportunities basically include switching from flood irrigation to pressurized sprinkler systems, upgrading nozzles in sprinklers and application of weather-control systems to better match water demand with crop need. The USGS (2001) estimated on-farm losses at 166,560 acre-feet over a total irrigated area (high and medium water-use crops only) of 117,930 acres. On-farm losses based on these numbers are about 1.41 acre-feet per acre. On-farm losses are lowest in the North Unit Irrigation District (94 percent mean irrigation efficiency) and highest in the Central Oregon Irrigation District (43 percent mean irrigation efficiency). Although significant quantities of water can be conserved by on-farm improvements, reduction of seepage losses in conveyance systems will generate the largest volume of water for expanding benefits of water use to agriculture and other basin needs.
4.2.2 Stream Flow
The flow regime of the Upper Deschutes River has been altered from historic natural conditions as a result of construction and operation of reservoirs and irrigation diversions in the upper basin. In the river reach above Bend, summer flows exceed historic natural flows to provide water for irrigation diversions at Bend. Heavy summer flows in this reach carry irrigation water released from the storage reservoirs in the extreme upper end of the basin. Up to 95 percent of Deschutes River flows (natural plus storage releases) are diverted into irrigation district canals at the North Dam in Bend. The irrigation diversions reduce flows in the Middle Deschutes River below Bend to well below historic natural flows. During winter, flows in the Upper Deschutes above Bend are well below natural Historic flows due to reservoir filling.
Similar alterations to natural historic flows occur in tributaries of the Deschutes River such as the Crooked River and Tumalo Creek. Even in creeks without storage reservoirs like Whychus creek, irrigation diversions during the summer irrigation season alter the historic natural flow conditions.
The wide fluctuation of flows and timing of releases in different reaches of the Deschutes and its tributaries are detrimental to aquatic and riparian habitat. In-stream flow rights for fish and wildlife are junior in priority to irrigation district rights in most reaches of the river. The health of aquatic and riparian habitat in stressed reaches of the Deschutes River could be significantly improved through more effective use of water. More efficient water use will increase the amount of water available under existing appropriations that can be reallocated for flow restoration along with other uses including irrigation for agriculture as discussed above.
Improved conveyance efficiency in canals and laterals by piping and lining will generate significant quantities of water that can be used for flow restoration. Reductions in seepage losses also make water available in storage that can be used for a variety of purposes. Reservoir management scenarios can be developed for restoring winter flows in the upper Deschutes River,
District Water Conservation Cost Analysis & Prioritization 9 Deschutes Water Alliance Issue Paper – Final Report
when flows are now diminished to fill the reservoirs. Scenarios can also be developed to restore summer flows in the middle Deschutes River, when flows are now depleted by irrigation diversions at Bend. More details on in-stream flows and reservoir management can be found in the DWA companion papers “In-stream Flow in the Deschutes Basin: Monitoring, Status and Restoration Needs” and “Reservoir Management”.
4.2.3 Urbanization
Growth in the upper basin is rapidly converting land use inside city Urban Growth Boundaries (UGB’s) from agricultural uses to urban uses. The land use conversions often bring municipal water supply for the new urban land uses, eliminating the need for irrigation district water. Urbanization also brings residential subdivisions, commercial and industrial developments to near proximity of irrigation canals and laterals, often making district operations and maintenance of the facilities more difficult and expensive.
Although piping of canals and laterals in these situations can generate substantial quantities of water for a variety of needs, piping also eliminates public safety hazards and greatly reduces operations and maintenance costs while improving water conveyance efficiency and generating pressurized irrigation water for outlying irrigators. Piping can also provide revenue for additional district projects and efficiency upgrades through power generation related to hydroelectric facilities. These hydroelectric facilities where feasible with piping projects can be cost effective given their potential eligibility for Business Energy Tax Credits (BETC). The corresponding revenue contribution from renewable power generation can help support district sustainability and could offset assessment changes related to urbanization impacts.
4.3 Federal & Other Constraints on Reallocated Water
Water rights held by the irrigation districts are subject to restrictions on where irrigation water is diverted, the quantity of use, location of use and purpose of use. Flexibility in these restrictions exists to some degree, depending on whether the district status (federal or non federal) or if they are subject to federal contracts.
Private districts can change the place and type of water use with transfers according to rules for this purpose (OAR 690.380). Districts formed as federal projects, or districts with federal contracts are restricted in flexibility to change the place and type of water use.
Selection of districts for potential efficiency improvement projects includes consideration of restrictions that could limit the range of benefits resulting from the projects, or that could increase the transaction requirements for achieving the benefits.
4.3.1 Federal Constraint
The North Unit Irrigation District (NUID) was constructed by the BOR as part of the BOR’s Deschutes Project. The authorized use of water is for irrigation. Use of project canals to move water for other purposes than those laid out in federal permits requires special permits and/or legislation. For example, if water made available from reduced seepage is to be conveyed from a private district through NUID canals for boosting irrigation supply, federal authorization is
District Water Conservation Cost Analysis & Prioritization 10 Deschutes Water Alliance Issue Paper – Final Report
required under the Warren Act. Use of conserved water generated by NUID efficiency improvements for other purposes is also subject to federal authorization; however, restrictions on use of conserved water are less onerous, evidenced by water leases currently in place between NUID and the DRC on a year-to-year basis. These temporary leases do not alter the water rights of individual users.
The Ochoco Irrigation District (OID) is under contract with the BOR for repairs to the Ochoco Dam. Contract provisions restrict use of District water to irrigation. Presently, use of water for in-stream purposes is prohibited under the contracts. Flexibility in use of water for in-stream purposes is under investigation.
The allocation of conserved water program was developed as an incentive to conserve water (OAR 690.018). Under the program, a water user can conserve water through efficiency improvements and use part of the conserved water for other uses under the user’s existing water rights. A condition of the additional water use is that at least 25 percent of the conserved water is dedicated to public use (transferred in-stream). If public or other funds are used to implement the conservation project, the amount of conserved water dedicated to in-stream use is proportional to the funding amount provided by the public, or other sources.
The net amount of conserved water available for use by the water user is subject to factors other than proportionate amounts of outside funding. Water right transfers are required in accordance with OAR 690.380 to change the place and type of use for conserved water. Approval of transfers and the net amount allowed for other uses under the transfer are subject to potential for injury to other water rights. Injury potential is determined by the Oregon Water Resources Department (OWRD) in the transfer review process. Based on injury potential, a transfer application can be denied, or the net amount of water for other uses can be reduced to protect other water rights.
Transfer of conserved water resulting from efficiency improvements is also subject to consideration of district water rights and flows historically conveyed by the canal or lateral subject to the improvements. The issue in this situation is the amount of credit for conserved water considering whether the canal carried its full water right allotment, or some lesser historic flow. In one case, the amount of credit could be calculated as the difference between the maximum water right flow and the flow after conservation. In another case, the amount of credit could be calculated as the difference between historic canal flows and conservation, possibly a lesser amount than for the first case. Finally, credit could be calculated as the difference between flow that the district is “ready, willing and able” to deliver and conservation.
The above constraints apply to efficiency improvement projects, where use of conserved water is intended for in-stream and irrigation uses. Injury constraints also apply to use of conserved water from canal efficiency improvements for mitigation in connection with new ground water permits required under OAR 690.505. In this case, piping of canals and laterals reduces seepage losses. Water from reduced seepage can then be transferred to in-stream use, increasing stream flow. For mitigation, the concept is that increased stream flow in an amount equal to consumed water under a new ground water permit would offset impacts of the ground water appropriation on stream flow. However, the issue relative to mitigation is that piping reduces aquifer recharge by the canal leakage and the effect of a new consumptive use (ground water pumping) is a net
District Water Conservation Cost Analysis & Prioritization 11 Deschutes Water Alliance Issue Paper – Final Report
deficit in ground water discharge to stream flow. This deficit theoretically reduces stream flow, resulting in injury to senior water rights (in-stream flows, lower Deschutes River, etc.).
Based on the above considerations, water generated from efficiency improvements to canals and laterals could be used primarily for agriculture and in-stream purposes. Water for mitigation purposes must be obtained from other sources based on present conditions.
4.4 Urbanization Impacts on Districts
Consideration of urbanization impact potential is warranted in selecting opportunities to improve water use efficiency with an extended range of benefits for the capital investment. In many instances, costs to pipe canals are less expensive than engineering, building and maintaining the water/sewer systems, bridges and infrastructure that must go over or under irrigation canals when development occurs. In addition to reducing public safety hazards, piping canals reduces risks of water contamination in urban environments. Canals in Central Oregon are designated by the Army Corps of Engineers (ACOE) as Waterways of the United States. Under this designation, these canals would be subject to provisions of the Clean Water Act (CWA) and any accidental or incidental discharge of pollutants from storm water runoffs from parking lots, streets, bridges or other improvements would be subject to potential National Pollutant Discharge Elimination System (NPDES) permit requirements. As discussed earlier, piping of canals and laterals also greatly reduces operations and maintenance costs, and conflicts between districts and owners of urban real estate located near the facilities. The impacts of urbanization on district operations is discussed further in the companion DWA paper entitled “Growth, Urbanization and Land Use Change: Impacts on Agriculture and Irrigation Districts in Central Oregon”.
5 OVERVIEW OF DISTRICT CONDITIONS
An overview of all irrigation districts indicates that seepage loss potential is very high in some and very low in others. Further evaluation indicates seepage potential can be correlated with geologic conditions in the district areas. Therefore, consideration of geology and seepage potential reveals opportunities to increase the benefits of efficiency projects.
The criteria discussed above were applied to the eight irrigation districts in an attempt to determine where to focus more detailed evaluation of potential efficiency improvement projects.
5.1 Geologic Influence
District records and Table 1 suggest that relatively high seepage loss in canals and laterals occurs generally in the Bend area. The Arnold, Central Oregon, Tumalo and Swalley Irrigation District main canals and laterals were constructed in permeable lava terrain with many uplifted pressure ridges of broken lava. A northwest-trending band of faults of the Sisters Fault Zone also passes through the Bend area, crossing locations of canals and laterals utilized by the above districts. Faulting and related shearing and crushing of rock, also contributes to increased permeability and higher seepage losses through the lavas in this area. Geology and fault zones are shown in Figure 5. Generally, seepage losses decrease, although they remain high, in the northward direction from Bend. Decreasing losses appear to reflect geologic influences.
District Water Conservation Cost Analysis & Prioritization 12 Deschutes Water Alliance Issue Paper – Final Report
District records also indicate that seepage losses in and around urbanization areas near Bend are higher than in similar geology outside urbanization areas. This can be linked to the impact of blasting that occurs in developing areas. Blasting is a common method used in Central Oregon to provide graded building sites for homes and infrastructure in the basalt rock geology. Blasting has the effect of increasing infiltration by “loosening” surrounding rock and potentially increasing basalt fracture size or fracture connectivity.
5.2 Arnold Irrigation District (AID)
District records suggest that relatively high seepage loss in AID canals and laterals occurs generally in the Bend area. The AID main canal foundation materials are mainly comprised of basalt covered over by basalt alluvium and colluvium and volcanic ash. The canal also crosses at least seven northwest-trending normal faults of the Sisters Fault Zone. District records indicate zones of high seepage loss in areas that coincide with openwork basalt vent rocks adjacent to prominent fault zones (Figure 5). Other potential areas of high seepage losses can be expected where the unlined canal traverses the broken basalt associated with faults. The Arnold Irrigation District provides water to 550 acres of irrigated land now inside the Bend UGB and 49 acres inside the Bend URA. This represents approximately 15% of the 4,384 irrigated acres in the District. Location of AID canals within Bend UGB are shown in Figure 4.
5.3 Central Oregon Irrigation District (COID)
COID records also indicate areas of very high seepage loss in the Bend area. At several locations in the first 10 miles of the Pilot Butte canal, short dike sections constructed of Volcanic Ash are used to cross collapse depressions in the basalt. These dike sections likely are highly permeable. COID records also document severe canal losses 12 miles north of Bend in areas where the pilot butte canal traverses unconsolidated to lightly cemented pumice.
District records also indicate that much of the seepage in the main Central Oregon canal occurs in the southern section of the canal, south and east of Bend up to approximately canal mile 27.5. This is corroborated by geologic observations whereby the foundation materials north of canal mile 27.5 contain local sections of highly fractured basalt and more uniform foundation conditions with more fine sediments are more conspicuous south of canal mile 27.5 (BOR 1991).
The Central Oregon Irrigation District provides irrigation water to 738 acres of irrigated land now inside the Bend UGB. The District also supplies water to 533 acres inside the present Urban Reserve Area (URA) of Bend. Location of COID canals within Bend UGB are shown in Figure 2. The District also delivers water to irrigators inside the Redmond UGB and URA. Irrigated acreage inside Redmond UGB and URA is 1,517 and 2,595 acres, respectively. Location of COID canals within Redmond UGB are shown in Figure 2. Therefore, a total of 5,383 acres of COID irrigated land lies within the present UGB and URA boundaries of Bend and Redmond. This represents approximately 13% of the irrigated acres in the District.
5.4 Lone Pine Irrigation District (LPID)
The LPID is a small irrigation district serving seventeen water users on 2369 acres in Lone Pine near Terrebonne, Oregon. District water is diverted out of the Deschutes River near Bend,
District Water Conservation Cost Analysis & Prioritization 13 Deschutes Water Alliance Issue Paper – Final Report
travels through COID’s Pilot Butte Canal, is diverted at the Lone Pine weir and travels across the Crooked River in a flume to Lone Pine Valley. The network of unlined canals are constructed in alluvium and glacial outwash made up of sands and gravels. District records and past studies indicate that seepage losses are high in these canals and represent up to 32% of total water diverted at the Lone Pine weir. The LPID currently does not provide water to irrigated lands with any city UGB’s or URA’s. 5.5 North Unit Irrigation District (NUID)
The NUID main canal conveys water about 65 miles from the river diversion at Bend to irrigated areas near the Warm Springs Reservation and Gateway area north of Madras. The first approximate 12 miles of the NUID main canal passes through fractured permeable lava terrain. This section of the canal was recently lined, reducing seepage losses by more than 60 cfs, or 23,000 acre-feet per year. Analysis of the next 12 miles to the Crooked River indicates that canal lining could eliminate about 37 cfs in seepage losses, or about 13,000 acre-feet. Irrigation district records suggest that over half of the leakage from the NUID main canal occurs between Bend and the Crooked River crossing. The North Unit Irrigation District provides water to 536 acres of irrigated land now inside the Madras UGB (Figure 3). This represents approximately 1% of the irrigated acres by NUID.
5.6 Ochoco Irrigation District (OID)
The Ochoco Irrigation District (OID) in the Prineville area is located primarily in sedimentary deposits developed in lake beds, stream beds, river terraces and slope wash areas. The source of the sediments is primarily the Ochoco Mountains, consisting of relatively old, weathered volcanic rocks with a significant silt and clay content. Permeability of these materials is generally less than the broken lava terrain in the Bend area, resulting in reduced levels of seepage. Although canal and lateral piping or lining can reduce seepage losses in the OID, the overall magnitude of potential seepage reductions is significantly less than in the Arnold, Central Oregon and Swalley Districts. These conditions are reflected in Table 1.
The Ochoco Irrigation District serves about 1,571 acres inside the present Prineville UGB (Figure 3). This represents approximately 8% of the 20,150 irrigated acres in the District. The District is presently developing a management plan for responding to changing operational needs and urbanization pressures.
5.7 Swalley Irrigation District (SID)
Discussion with the Swalley Irrigation District reveals areas of very high seepage loss in the Bend area, extending to approximately Deschutes Junction, about 6 miles north of Bend. Given canal foundation geology, potentially high water losses are to be expected in the Swalley main canal where the canal crosses fault scarps in the basalt. High losses can also be expected where the canal crosses collapse-depression terrain and skirts frontal areas of pressure ridges with uplifted and broken basalt flows.
The Swalley Irrigation District provides water to approximately 343 acres of irrigated land now inside the Bend UGB. The District also supplies water to 559 acres inside the present Bend
District Water Conservation Cost Analysis & Prioritization 14 Deschutes Water Alliance Issue Paper – Final Report
URA. Location of SID canals within Bend UGB are shown in Figure 4. This acreage is approximately 20 percent of the 4,587 acres served by the District. Urbanization of these lands will put about 7.2 miles of main canal and laterals in areas of high-density land use and related infrastructure.
5.8 Three Sisters Irrigation District (TSID)
The Three Sisters Irrigation District (TSID) east and northeast of Sisters is located primarily in an area of sedimentary deposits formed by stream and glacial activity. Certain canal and lateral reaches pass through broken and permeable lavas as well. The sedimentary deposits are generally less weathered and more permeable than sediments in the OID area, resulting in relatively high seepage losses in local areas. The TSID has completed several canal and lateral piping projects to reduce seepage losses. The TSID is also outside the Sisters UGB (Figure 4) and is not subject to urbanization issues faced by the COID, OID, AID, NUID and SID.
5.9 Tumalo Irrigation District (TID)
Tumalo Irrigation District canals and laterals traverse areas of broken, permeable lava. Review of geologic maps indicates at least three faults cross the area of district canals. Leakage potential was considered moderate for the District by the BOR in development of the 1991 geologic report. Table 1 above reflects a potential mid-range level of seepage potential at 4.86 acre-feet per acre of irrigated area, recognizing that this value is based on acreage of high to medium water use only. The Bend Feed Canal has been piped and funding is being requested for piping the approximate five-mile reach of the Tumalo Feed Canal.
The Tumalo Irrigation District provides water to approximately 2 acres of irrigated land now inside the Bend UGB. Location of TID canals within Bend UGB are shown in Figure 4. The District also supplies water to 131 acres inside the present Bend URA. This acreage is less than 2 percent of the 8,109 total acres served by the District.
6 METHODS FOR EFFICIENCY IMPROVEMENTS
6.1 Liners
Lining canals is intended to reduce seepage by sealing the bottom and sides of canal channels with liners. Reduction of seepage in canals can provide water to improve reliability and amount of supply for agriculture. It can also reduce diversions and make more water available to the middle reach of the Deschutes River as part of a multi-benefit water management program. In addition to water conservation, canal lining reduces maintenance requirements relative to aquatic vegetation control on canal banks (where they are lined) and will also bring some related water quality benefit. Drawbacks include the necessity for continued maintenance to account for weathering and cracking of canal materials over time. Also safety hazards of open canals remain with lined delivery systems, and in fact, may be increased. These increased safety concerns are linked to increased water velocities due to reduced friction losses and increased difficulty in climbing out of canals related to smooth sloping sidewalls.
District Water Conservation Cost Analysis & Prioritization 15 Deschutes Water Alliance Issue Paper – Final Report
Traditional canal-lining materials typically include compacted earth, reinforced or un-reinforced concrete and buried geomembranes. For many jobs, these materials are not always viable in the Upper Deschutes Basin because they are either: not locally available, too expensive or require extensive over-excavation and easy access for heavy equipment. The issues of access and over excavation become important drawbacks when considering lining of canals in urban environments.
The Bureau of Reclamation conducted multiple studies “Canal-Lining Demonstration Project” between 1992 and 2000 whereby a variety of lining materials were tested on 18 sections of canals in the Upper Deschutes Basin. The study looked at less expensive alternative canal lining materials that were easier to construct with limited access and were more compatible with severe rocky sub-grades such as the fractured volcanic rock commonly found in central Oregon. These alternative options included: fluid-applied membrane, concrete alone, exposed geomembrane and geomembrane with concrete covers.
Of these four options, the concrete with geomembrane underliner provides the best long-term performance. The effectiveness at seepage reduction is approximately 95% while long term durability ranges from 40 to 60 years. The concrete protects the geomembrane from mechanical damage due to weathering, animal traffic, construction equipment and vandalism while the geomembrane provides the water barrier. Irrigation district personnel are familiar with concrete and can easily perform the required maintenance (BOR 1999). Operations and maintenance costs can however be high with open canal using concrete given the frost-heave situation that occurs annually in the Central Oregon climate. District records and experience however indicate durability of 20 years at a maximum for these lining options in Central Oregon with 15 years being the average.
Lining of canals does not address a key component in urban and agricultural areas. Urbanization brings a substantial list of issues to bordering canals, including trespass and safety. Lining of canals does not address water quality problems that may occur in urbanized and agricultural areas due to close proximity of roadways and bridges along with runoff from agricultural lands. In urban areas this infrastructure presents potential contamination sources in the form of runoff from parking lots, streets and bridges.
6.2 Pipe
Piping of canals shifts water conveyance to buried pipelines, eliminating open canals and related operations and maintenance issues in urbanizing areas. Use of pipe materials such as High Density Poly-Ethylene (HDPE) has the advantage of reducing seepage losses to nearly zero. By reducing seepage losses, piping of canals also can provide additional water for agriculture and stream flow restoration. In addition, the near elimination of seepage losses associated with the increased efficiency by which water is conveyed helps secure irrigation district function and viability by ensuring water deliveries to irrigators furthest from the point of water diversion.
Piping of canals has the added advantage of providing pressurized water created by gravity. This can either eliminate the need for pumps or significantly reduce power demand and related costs associated with sprinkler systems. Canal piping can also offer the opportunity for low-head
District Water Conservation Cost Analysis & Prioritization 16 Deschutes Water Alliance Issue Paper – Final Report
hydropower generation in canals with sufficient head drops. The power produced from these plants can help offset the cost of piping construction as well as irrigation operating costs.
HDPE pipe also offers many savings both in water and in cost. Joints between sections of pipe are heat fused and are as strong as the pipe itself. These types of joints reduce maintenance costs and eliminate potential leak points that might occur every 10-20 feet PVC and Ductile Iron bell and spigot connections. Due to the lower density of HDPE compared to steel or PVC it is much easier to handle and install. This translates to cost savings in the construction process. HDPE pipe can also withstand impacts better than other pipe materials, especially in cold weather installations when other pipes are more prone to cracks and breaks. Since it is flexible, it is well suited for dynamic soils including areas prone to earthquake. Finally, the polyethylene pipe industry conservatively estimates a service life for HDPE pipe to be 50-100 years. This nearly doubles the maximum expected life of 40-60 years for concrete canal lining.
Some of the disadvantages of canal piping include reduced artificial groundwater recharge, loss of aesthetics associated with open canals or laterals, loss of habitat provided by open canals, laterals & ditches and potential reduction in spring discharge to the Deschutes River and its tributaries.
7 PROPOSED PROJECT ANALYSIS
7.1 Conveyance Efficiency
Although urbanization is occurring on significant land areas within the Districts, large areas of irrigated agricultural land outside urban areas rely on the Districts for water. The diversions for COID, SID and NUID main canals supply water by gravity flow and will remain at their existing locations in urban areas for this reason. The Deschutes River enters a deepening canyon at Bend and diversions farther north of the City require pumping for water delivery. Relocating diversions farther south outside City limits are not practical due to extensive construction of new canals to maintain supply to the existing lateral network. Therefore, main canals and laterals remain key water distribution components for water delivery through urban areas to outlying irrigation areas.
Laterals require the largest commitment of operations and maintenance budgets, particularly in urbanizing areas and are therefore the primary focus of efficiency projects. Ditches are relatively minor components of the distribution. Ditches in urbanizing areas are most often abandoned and investments in efficiency projects bring short-term results.
The focus on conveyance efficiency opportunities in this analysis is on irrigation districts in the upper Deschutes Basin. Although conveyance efficiency is important among all water providers and users, the districts provide opportunities to conserve relatively large quantities of water for significant up-front benefits for the basin. Seepage from unlined canals comprises a large amount of water and opportunities to conserve this water for other uses are controlled by basin geology, institutional barriers to use of conserved water and costs related to construction of efficiency projects. Accordingly, conveyance efficiency opportunities in some districts are much greater than others and warrant priority in project implementation.
District Water Conservation Cost Analysis & Prioritization 17 Deschutes Water Alliance Issue Paper – Final Report
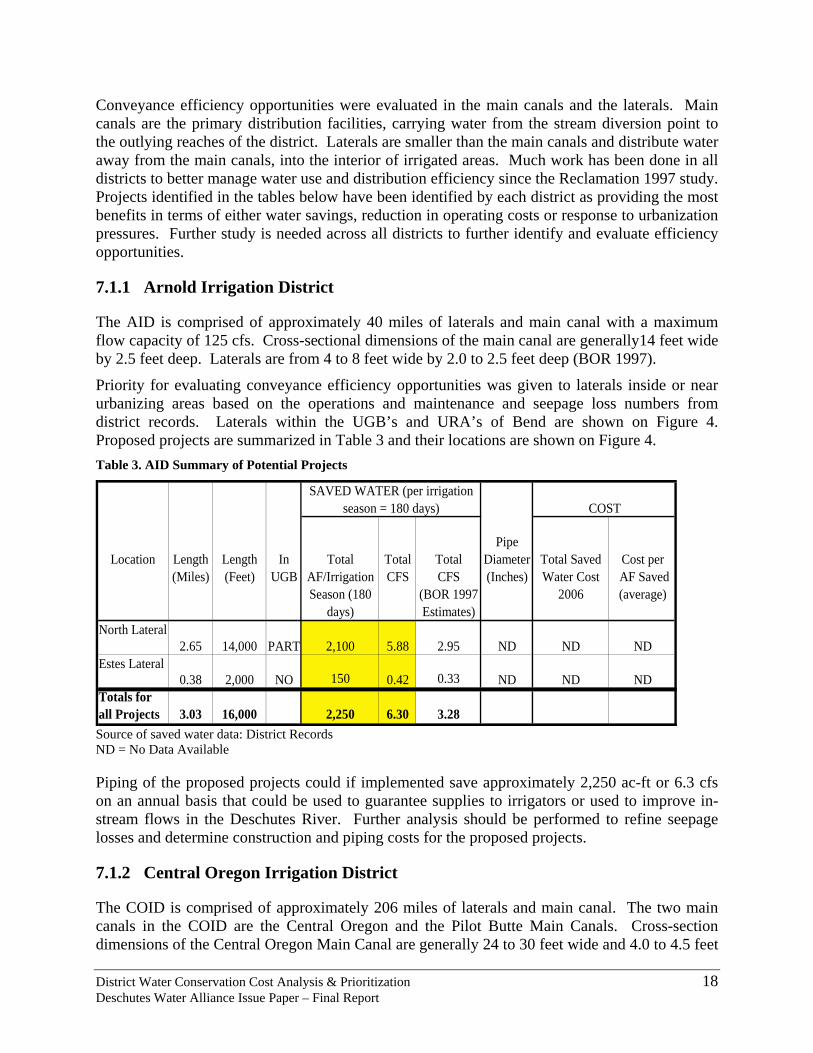
Conveyance efficiency opportunities were evaluated in the main canals and the laterals. Main canals are the primary distribution facilities, carrying water from the stream diversion point to the outlying reaches of the district. Laterals are smaller than the main canals and distribute water away from the main canals, into the interior of irrigated areas. Much work has been done in all districts to better manage water use and distribution efficiency since the Reclamation 1997 study. Projects identified in the tables below have been identified by each district as providing the most benefits in terms of either water savings, reduction in operating costs or response to urbanization pressures. Further study is needed across all districts to further identify and evaluate efficiency opportunities.
7.1.1 Arnold Irrigation District
The AID is comprised of approximately 40 miles of laterals and main canal with a maximum flow capacity of 125 cfs. Cross-sectional dimensions of the main canal are generally14 feet wide by 2.5 feet deep. Laterals are from 4 to 8 feet wide by 2.0 to 2.5 feet deep (BOR 1997).
Priority for evaluating conveyance efficiency opportunities was given to laterals inside or near urbanizing areas based on the operations and maintenance and seepage loss numbers from district records. Laterals within the UGB’s and URA’s of Bend are shown on Figure 4. Proposed projects are summarized in Table 3 and their locations are shown on Figure 4. Table 3. AID Summary of Potential Projects
Location Length Length In Total Total TotalPipe
Diameter Total Saved Cost per(Miles) (Feet) UGB AF/Irrigation
Season (180 days)
CFS CFS (BOR 1997 Estimates)
(Inches) Water Cost 2006
AF Saved (average)
North Lateral2.65 14,000 PART 2,100 5.88 2.95 ND ND ND
Estes Lateral0.38 2,000 NO 150 0.42 0.33 ND ND ND
Totals for all Projects 3.03 16,000 2,250 6.30 3.28
SAVED WATER (per irrigation season = 180 days) COST
Source of saved water data: District Records ND = No Data Available
Piping of the proposed projects could if implemented save approximately 2,250 ac-ft or 6.3 cfs on an annual basis that could be used to guarantee supplies to irrigators or used to improve in-stream flows in the Deschutes River. Further analysis should be performed to refine seepage losses and determine construction and piping costs for the proposed projects.
7.1.2 Central Oregon Irrigation District
The COID is comprised of approximately 206 miles of laterals and main canal. The two main canals in the COID are the Central Oregon and the Pilot Butte Main Canals. Cross-section dimensions of the Central Oregon Main Canal are generally 24 to 30 feet wide and 4.0 to 4.5 feet
District Water Conservation Cost Analysis & Prioritization 18 Deschutes Water Alliance Issue Paper – Final Report
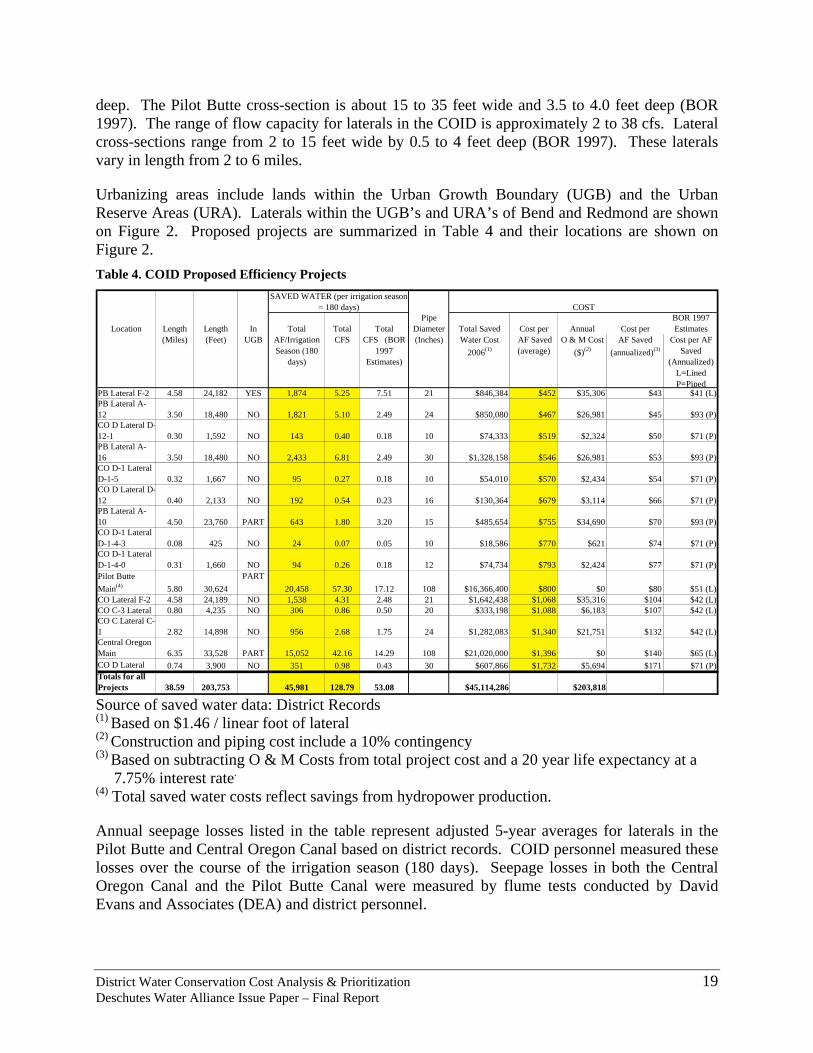
deep. The Pilot Butte cross-section is about 15 to 35 feet wide and 3.5 to 4.0 feet deep (BOR 1997). The range of flow capacity for laterals in the COID is approximately 2 to 38 cfs. Lateral cross-sections range from 2 to 15 feet wide by 0.5 to 4 feet deep (BOR 1997). These laterals vary in length from 2 to 6 miles.
Urbanizing areas include lands within the Urban Growth Boundary (UGB) and the Urban Reserve Areas (URA). Laterals within the UGB’s and URA’s of Bend and Redmond are shown on Figure 2. Proposed projects are summarized in Table 4 and their locations are shown on Figure 2. Table 4. COID Proposed Efficiency Projects
Location Length Length In Total Total TotalPipe
Diameter Total Saved Cost per Annual Cost perBOR 1997 Estimates
(Miles) (Feet) UGB AF/Irrigation Season (180
days)
CFS CFS (BOR 1997
Estimates)
(Inches) Water Cost 2006(1)
AF Saved (average)
O & M Cost ($)(2)
AF Saved (annualized)(3)
Cost per AF Saved
(Annualized) L=Lined P=Piped
PB Lateral F-2 4.58 24,182 YES 1,874 5.25 7.51 21 $846,384 $452 $35,306 $43 $41 (L)PB Lateral A-12 3.50 18,480 NO 1,821 5.10 2.49 24 $850,080 $467 $26,981 $45 $93 (P)CO D Lateral D-12-1 0.30 1,592 NO 143 0.40 0.18 10 $74,333 $519 $2,324 $50 $71 (P)PB Lateral A-16 3.50 18,480 NO 2,433 6.81 2.49 30 $1,328,158 $546 $26,981 $53 $93 (P)CO D-1 Lateral D-1-5 0.32 1,667 NO 95 0.27 0.18 10 $54,010 $570 $2,434 $54 $71 (P)CO D Lateral D-12 0.40 2,133 NO 192 0.54 0.23 16 $130,364 $679 $3,114 $66 $71 (P)PB Lateral A-10 4.50 23,760 PART 643 1.80 3.20 15 $485,654 $755 $34,690 $70 $93 (P)CO D-1 Lateral D-1-4-3 0.08 425 NO 24 0.07 0.05 10 $18,586 $770 $621 $74 $71 (P)CO D-1 Lateral D-1-4-0 0.31 1,660 NO 94 0.26 0.18 12 $74,734 $793 $2,424 $77 $71 (P)Pilot Butte Main(4) 5.80 30,624
PART20,458 57.30 17.12 108 $16,366,400 $800 $0 $80 $51 (L)
CO Lateral F-2 4.58 24,189 NO 1,538 4.31 2.48 21 $1,642,438 $1,068 $35,316 $104 $42 (L)CO C-3 Lateral 0.80 4,235 NO 306 0.86 0.50 20 $333,198 $1,088 $6,183 $107 $42 (L)CO C Lateral C-1 2.82 14,898 NO 956 2.68 1.75 24 $1,282,083 $1,340 $21,751 $132 $42 (L)Central Oregon Main 6.35 33,528 PART 15,052 42.16 14.29 108 $21,020,000 $1,396 $0 $140 $65 (L)CO D Lateral 0.74 3,900 NO 351 0.98 0.43 30 $607,866 $1,732 $5,694 $171 $71 (P)Totals for all Projects 38.59 203,753 45,981 128.79 53.08 $45,114,286 $203,818
SAVED WATER (per irrigation season = 180 days) COST
Source of saved water data: District Records (1) Based on $1.46 / linear foot of lateral (2) Construction and piping cost include a 10% contingency (3) Based on subtracting O & M Costs from total project cost and a 20 year life expectancy at a
7.75% interest rate.
(4) Total saved water costs reflect savings from hydropower production.
Annual seepage losses listed in the table represent adjusted 5-year averages for laterals in the Pilot Butte and Central Oregon Canal based on district records. COID personnel measured these losses over the course of the irrigation season (180 days). Seepage losses in both the Central Oregon Canal and the Pilot Butte Canal were measured by flume tests conducted by David Evans and Associates (DEA) and district personnel.
District Water Conservation Cost Analysis & Prioritization 19 Deschutes Water Alliance Issue Paper – Final Report
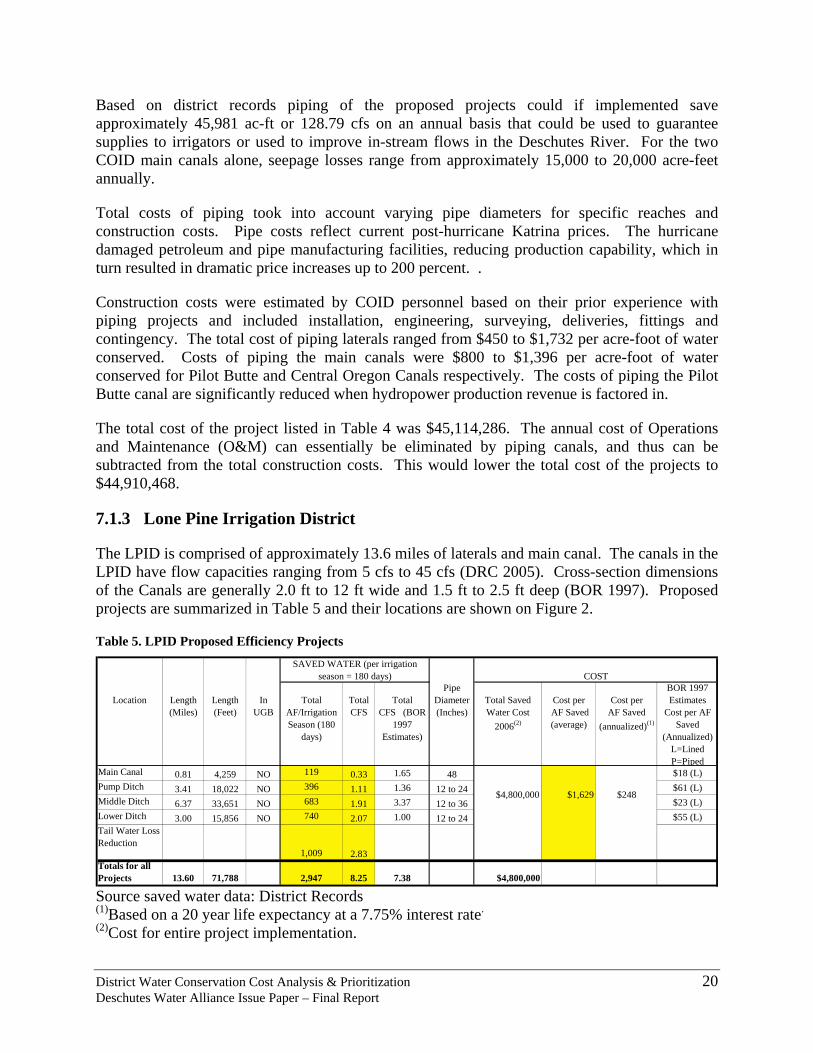
Based on district records piping of the proposed projects could if implemented save approximately 45,981 ac-ft or 128.79 cfs on an annual basis that could be used to guarantee supplies to irrigators or used to improve in-stream flows in the Deschutes River. For the two COID main canals alone, seepage losses range from approximately 15,000 to 20,000 acre-feet annually.
Total costs of piping took into account varying pipe diameters for specific reaches and construction costs. Pipe costs reflect current post-hurricane Katrina prices. The hurricane damaged petroleum and pipe manufacturing facilities, reducing production capability, which in turn resulted in dramatic price increases up to 200 percent. .
Construction costs were estimated by COID personnel based on their prior experience with piping projects and included installation, engineering, surveying, deliveries, fittings and contingency. The total cost of piping laterals ranged from $450 to $1,732 per acre-foot of water conserved. Costs of piping the main canals were $800 to $1,396 per acre-foot of water conserved for Pilot Butte and Central Oregon Canals respectively. The costs of piping the Pilot Butte canal are significantly reduced when hydropower production revenue is factored in.
The total cost of the project listed in Table 4 was $45,114,286. The annual cost of Operations and Maintenance (O&M) can essentially be eliminated by piping canals, and thus can be subtracted from the total construction costs. This would lower the total cost of the projects to $44,910,468.
7.1.3 Lone Pine Irrigation District
The LPID is comprised of approximately 13.6 miles of laterals and main canal. The canals in the LPID have flow capacities ranging from 5 cfs to 45 cfs (DRC 2005). Cross-section dimensions of the Canals are generally 2.0 ft to 12 ft wide and 1.5 ft to 2.5 ft deep (BOR 1997). Proposed projects are summarized in Table 5 and their locations are shown on Figure 2.
Table 5. LPID Proposed Efficiency Projects
Location Length Length In Total Total TotalPipe
Diameter Total Saved Cost per Cost perBOR 1997 Estimates
(Miles) (Feet) UGB AF/Irrigation Season (180
days)
CFS CFS (BOR 1997
Estimates)
(Inches) Water Cost 2006(2)
AF Saved (average)
AF Saved (annualized)(1)
Cost per AF Saved
(Annualized) L=Lined P=Piped
Main Canal 0.81 4,259 NO 119 0.33 1.65 48 $18 (L)Pump Ditch 3.41 18,022 NO 396 1.11 1.36 12 to 24 $61 (L)Middle Ditch 6.37 33,651 NO 683 1.91 3.37 12 to 36 $23 (L)Lower Ditch 3.00 15,856 NO 740 2.07 1.00 12 to 24 $55 (L)Tail Water Loss Reduction
1,009 2.83Totals for all Projects 13.60 71,788 2,947 8.25 7.38 $4,800,000
$1,629$4,800,000
SAVED WATER (per irrigation season = 180 days)
$248
COST
Source saved water data: District Records (1)Based on a 20 year life expectancy at a 7.75% interest rate.
(2)Cost for entire project implementation.
District Water Conservation Cost Analysis & Prioritization 20 Deschutes Water Alliance Issue Paper – Final Report
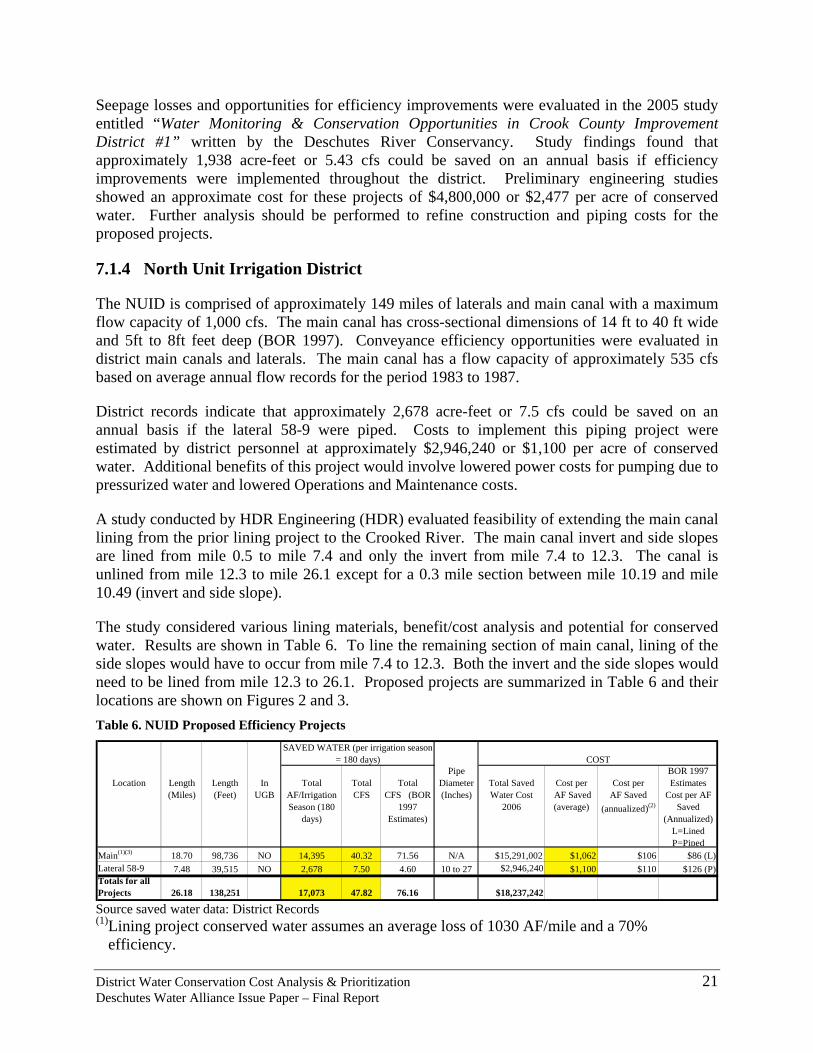
Seepage losses and opportunities for efficiency improvements were evaluated in the 2005 study entitled “Water Monitoring & Conservation Opportunities in Crook County Improvement District #1” written by the Deschutes River Conservancy. Study findings found that approximately 1,938 acre-feet or 5.43 cfs could be saved on an annual basis if efficiency improvements were implemented throughout the district. Preliminary engineering studies showed an approximate cost for these projects of $4,800,000 or $2,477 per acre of conserved water. Further analysis should be performed to refine construction and piping costs for the proposed projects.
7.1.4 North Unit Irrigation District
The NUID is comprised of approximately 149 miles of laterals and main canal with a maximum flow capacity of 1,000 cfs. The main canal has cross-sectional dimensions of 14 ft to 40 ft wide and 5ft to 8ft feet deep (BOR 1997). Conveyance efficiency opportunities were evaluated in district main canals and laterals. The main canal has a flow capacity of approximately 535 cfs based on average annual flow records for the period 1983 to 1987.
District records indicate that approximately 2,678 acre-feet or 7.5 cfs could be saved on an annual basis if the lateral 58-9 were piped. Costs to implement this piping project were estimated by district personnel at approximately $2,946,240 or $1,100 per acre of conserved water. Additional benefits of this project would involve lowered power costs for pumping due to pressurized water and lowered Operations and Maintenance costs.
A study conducted by HDR Engineering (HDR) evaluated feasibility of extending the main canal lining from the prior lining project to the Crooked River. The main canal invert and side slopes are lined from mile 0.5 to mile 7.4 and only the invert from mile 7.4 to 12.3. The canal is unlined from mile 12.3 to mile 26.1 except for a 0.3 mile section between mile 10.19 and mile 10.49 (invert and side slope).
The study considered various lining materials, benefit/cost analysis and potential for conserved water. Results are shown in Table 6. To line the remaining section of main canal, lining of the side slopes would have to occur from mile 7.4 to 12.3. Both the invert and the side slopes would need to be lined from mile 12.3 to 26.1. Proposed projects are summarized in Table 6 and their locations are shown on Figures 2 and 3. Table 6. NUID Proposed Efficiency Projects
Location Length Length In Total Total TotalPipe
Diameter Total Saved Cost per Cost perBOR 1997 Estimates
(Miles) (Feet) UGB AF/Irrigation Season (180
days)
CFS CFS (BOR 1997
Estimates)
(Inches) Water Cost 2006
AF Saved (average)
AF Saved (annualized)(2)
Cost per AF Saved
(Annualized) L=Lined P=Piped
Main(1)(3) 18.70 98,736 NO 14,395 40.32 71.56 N/A $15,291,002 $1,062 $106 $86 (L)Lateral 58-9 7.48 39,515 NO 2,678 7.50 4.60 10 to 27 $2,946,240 $1,100 $110 $126 (P)Totals for all Projects 26.18 138,251 17,073 47.82 76.16 $18,237,242
COSTSAVED WATER (per irrigation season
= 180 days)
Source saved water data: District Records (1)Lining project conserved water assumes an average loss of 1030 AF/mile and a 70%
efficiency.
District Water Conservation Cost Analysis & Prioritization 21 Deschutes Water Alliance Issue Paper – Final Report
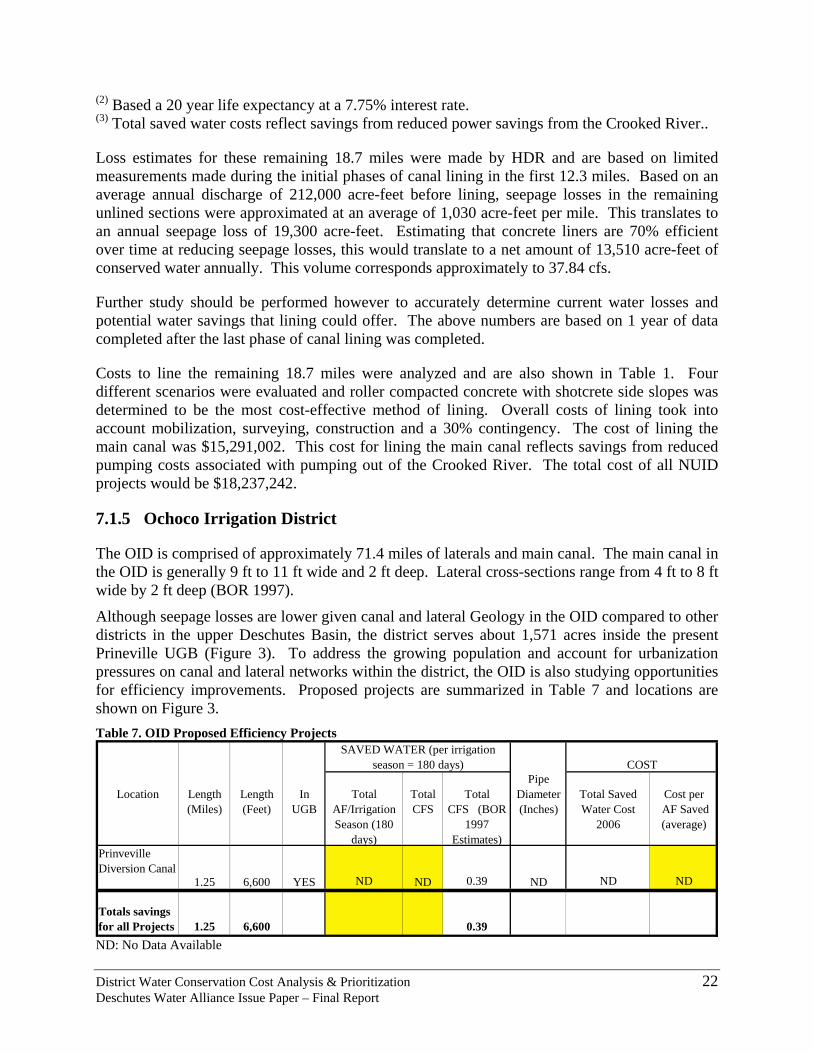
(2) Based a 20 year life expectancy at a 7.75% interest rate. (3) Total saved water costs reflect savings from reduced power savings from the Crooked River..
Loss estimates for these remaining 18.7 miles were made by HDR and are based on limited measurements made during the initial phases of canal lining in the first 12.3 miles. Based on an average annual discharge of 212,000 acre-feet before lining, seepage losses in the remaining unlined sections were approximated at an average of 1,030 acre-feet per mile. This translates to an annual seepage loss of 19,300 acre-feet. Estimating that concrete liners are 70% efficient over time at reducing seepage losses, this would translate to a net amount of 13,510 acre-feet of conserved water annually. This volume corresponds approximately to 37.84 cfs.
Further study should be performed however to accurately determine current water losses and potential water savings that lining could offer. The above numbers are based on 1 year of data completed after the last phase of canal lining was completed.
Costs to line the remaining 18.7 miles were analyzed and are also shown in Table 1. Four different scenarios were evaluated and roller compacted concrete with shotcrete side slopes was determined to be the most cost-effective method of lining. Overall costs of lining took into account mobilization, surveying, construction and a 30% contingency. The cost of lining the main canal was $15,291,002. This cost for lining the main canal reflects savings from reduced pumping costs associated with pumping out of the Crooked River. The total cost of all NUID projects would be $18,237,242.
7.1.5 Ochoco Irrigation District
The OID is comprised of approximately 71.4 miles of laterals and main canal. The main canal in the OID is generally 9 ft to 11 ft wide and 2 ft deep. Lateral cross-sections range from 4 ft to 8 ft wide by 2 ft deep (BOR 1997).
Although seepage losses are lower given canal and lateral Geology in the OID compared to other districts in the upper Deschutes Basin, the district serves about 1,571 acres inside the present Prineville UGB (Figure 3). To address the growing population and account for urbanization pressures on canal and lateral networks within the district, the OID is also studying opportunities for efficiency improvements. Proposed projects are summarized in Table 7 and locations are shown on Figure 3. Table 7. OID Proposed Efficiency Projects
Location Length Length In Total Total TotalPipe
Diameter Total Saved Cost per(Miles) (Feet) UGB AF/Irrigation
Season (180 days)
CFS CFS (BOR 1997
Estimates)
(Inches) Water Cost 2006
AF Saved (average)
Prinveville Diversion Canal
1.25 6,600 YES ND ND 0.39 ND ND ND
Totals savings for all Projects 1.25 6,600 0.39
SAVED WATER (per irrigation season = 180 days) COST
ND: No Data Available
District Water Conservation Cost Analysis & Prioritization 22 Deschutes Water Alliance Issue Paper – Final Report
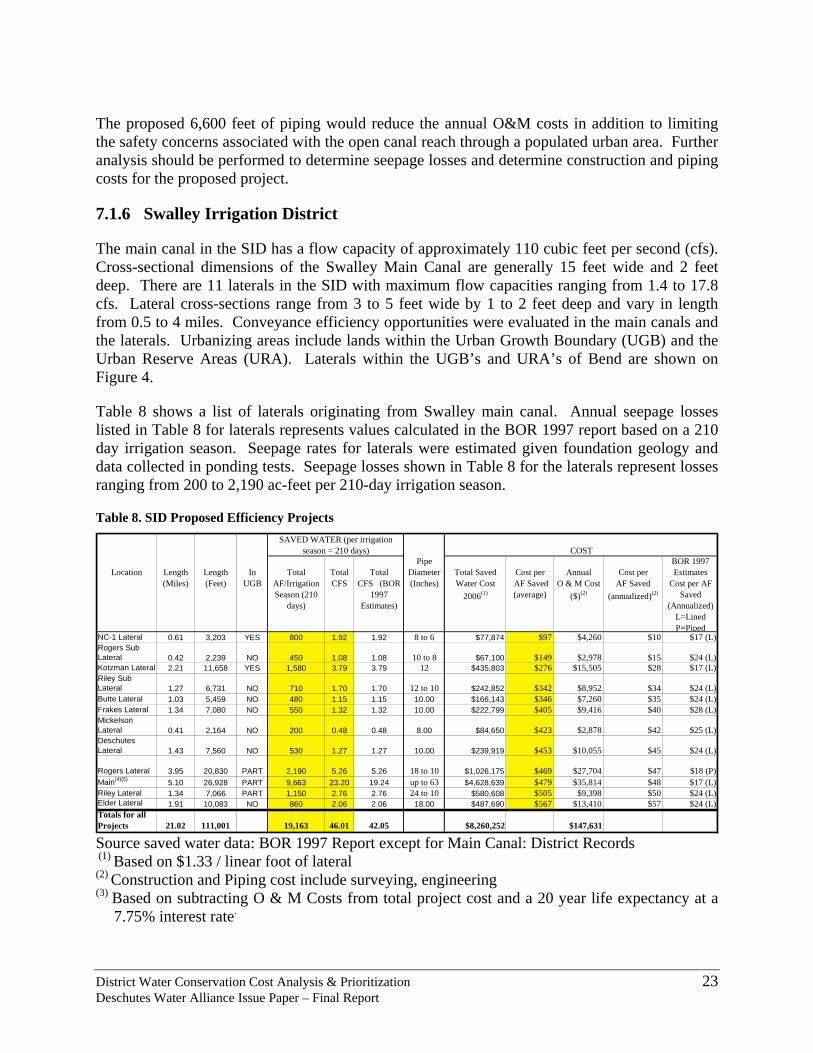
The proposed 6,600 feet of piping would reduce the annual O&M costs in addition to limiting the safety concerns associated with the open canal reach through a populated urban area. Further analysis should be performed to determine seepage losses and determine construction and piping costs for the proposed project.
7.1.6 Swalley Irrigation District
The main canal in the SID has a flow capacity of approximately 110 cubic feet per second (cfs). Cross-sectional dimensions of the Swalley Main Canal are generally 15 feet wide and 2 feet deep. There are 11 laterals in the SID with maximum flow capacities ranging from 1.4 to 17.8 cfs. Lateral cross-sections range from 3 to 5 feet wide by 1 to 2 feet deep and vary in length from 0.5 to 4 miles. Conveyance efficiency opportunities were evaluated in the main canals and the laterals. Urbanizing areas include lands within the Urban Growth Boundary (UGB) and the Urban Reserve Areas (URA). Laterals within the UGB’s and URA’s of Bend are shown on Figure 4.
Table 8 shows a list of laterals originating from Swalley main canal. Annual seepage losses listed in Table 8 for laterals represents values calculated in the BOR 1997 report based on a 210 day irrigation season. Seepage rates for laterals were estimated given foundation geology and data collected in ponding tests. Seepage losses shown in Table 8 for the laterals represent losses ranging from 200 to 2,190 ac-feet per 210-day irrigation season.
Table 8. SID Proposed Efficiency Projects
Location Length Length In Total Total TotalPipe
Diameter Total Saved Cost per Annual Cost perBOR 1997 Estimates
(Miles) (Feet) UGB AF/Irrigation Season (210
days)
CFS CFS (BOR 1997
Estimates)
(Inches) Water Cost 2006(1)
AF Saved (average)
O & M Cost ($)(2)
AF Saved (annualized)(2)
Cost per AF Saved
(Annualized) L=Lined P=Piped
NC-1 Lateral 0.61 3,203 YES 800 1.92 1.92 8 to 6 $77,874 $97 $4,260 $10 $17 (L)Rogers Sub Lateral 0.42 2,239 NO 450 1.08 1.08 10 to 8 $67,100 $149 $2,978 $15 $24 (L)Kotzman Lateral 2.21 11,658 YES 1,580 3.79 3.79 12 $435,803 $276 $15,505 $28 $17 (L)Riley Sub Lateral 1.27 6,731 NO 710 1.70 1.70 12 to 10 $242,852 $342 $8,952 $34 $24 (L)Butte Lateral 1.03 5,459 NO 480 1.15 1.15 10.00 $166,143 $346 $7,260 $35 $24 (L)Frakes Lateral 1.34 7,080 NO 550 1.32 1.32 10.00 $222,799 $405 $9,416 $40 $28 (L)Mickelson Lateral 0.41 2,164 NO 200 0.48 0.48 8.00 $84,650 $423 $2,878 $42 $25 (L)Deschutes Lateral 1.43 7,560 NO 530 1.27 1.27 10.00 $239,919 $453 $10,055 $45 $24 (L)
Rogers Lateral 3.95 20,830 PART 2,190 5.26 5.26 18 to 10 $1,026,175 $469 $27,704 $47 $18 (P)Main(4)(5) 5.10 26,928 PART 9,663 23.20 19.24 up to 63 $4,628,639 $479 $35,814 $48 $17 (L)Riley Lateral 1.34 7,066 PART 1,150 2.76 2.76 24 to 10 $580,608 $505 $9,398 $50 $24 (L)Elder Lateral 1.91 10,083 NO 860 2.06 2.06 18.00 $487,690 $567 $13,410 $57 $24 (L)Totals for all Projects 21.02 111,001 19,163 46.01 42.05 $8,260,252 $147,631
SAVED WATER (per irrigation season = 210 days) COST
Source saved water data: BOR 1997 Report except for Main Canal: District Records (1) Based on $1.33 / linear foot of lateral (2) Construction and Piping cost include surveying, engineering (3) Based on subtracting O & M Costs from total project cost and a 20 year life expectancy at a
7.75% interest rate.
District Water Conservation Cost Analysis & Prioritization 23 Deschutes Water Alliance Issue Paper – Final Report
(4) Seepage losses for the main canal were measured in flumes on four occassions by DEA during Summer 2005 with 20-25% uncertainty. Measured flows and losses were:
Date Flow Loss 06/15/05 83.91 cfs 23.55 cfs 07/14/05 98.73 cfs 27.1 cfs 07/20/05 113.88 cfs 27.46 cfs 09/27/05 64.1 cfs 14.67 cfs
(5) Total saved water costs reflect savings from hydropower production. Seasonal seepage losses for the Swalley Main Canal were estimated by a series of flume measurements during Summer 2005 by David Evans & Associates (DEA) in coordination with SID. The area measured for the Swalley Main Canal took into account the first approximate 5.1 miles of canal from the diversion at North Dam in Bend northward. Seepage losses shown in Table 10 for the Swalley Main Canal represents the average amount of water that could be conserved over a 210 day irrigation season given a measurement uncertainty of 25%. Actual seepage losses and potential for water use efficiency could range from 17 to 29 cfs. Seepage rates measured by DEA for the Seepage losses for the Swalley Main Canal over the first 5.1 miles were 9,663 ac-ft or 23.20 cfs over a 210 irrigation season.
Costs to convert these open unlined canals to pipe were analyzed and are also shown in Table 8. Overall costs of piping took into account varying pipe diameters for specific reaches and installation construction costs. Pipe costs reflected current post-hurricane Katrina prices. Construction costs were estimated by SID personnel and included installation, engineering, surveying, deliveries, fittings and contingency. The cost of piping lateral canals were $97 to $567 per acre-foot of water conserved. The cost of piping the main canal was $497 per acre-foot of water conserved. This cost for the main canal piping reflects savings from hydropower production that would help offset construction costs.
The total cost of the projects listed in Table 8 was $8,260,252. The annual cost of Operations and Maintenance (O&M) can essentially be eliminated by piping canals, and thus can be subtracted from the total construction costs. This would lower the total cost of the projects to $8,112,621.
7.1.7 Three Sisters Irrigation District
The TSID is comprised of approximately 60.4 miles of laterals and main canal. The main canal in the TSID is generally 12 ft to 14 ft wide and 2 ft deep. Lateral cross-sections range from 2 ft to 10 ft wide by 2 ft deep (BOR 1997).
The TSID has implemented a number of efficiency projects and is continuing in its efforts to improve the efficiency of its irrigation network. Proposed projects are summarized in Table 9 and their locations are shown on Figure 4.
District Water Conservation Cost Analysis & Prioritization 24 Deschutes Water Alliance Issue Paper – Final Report
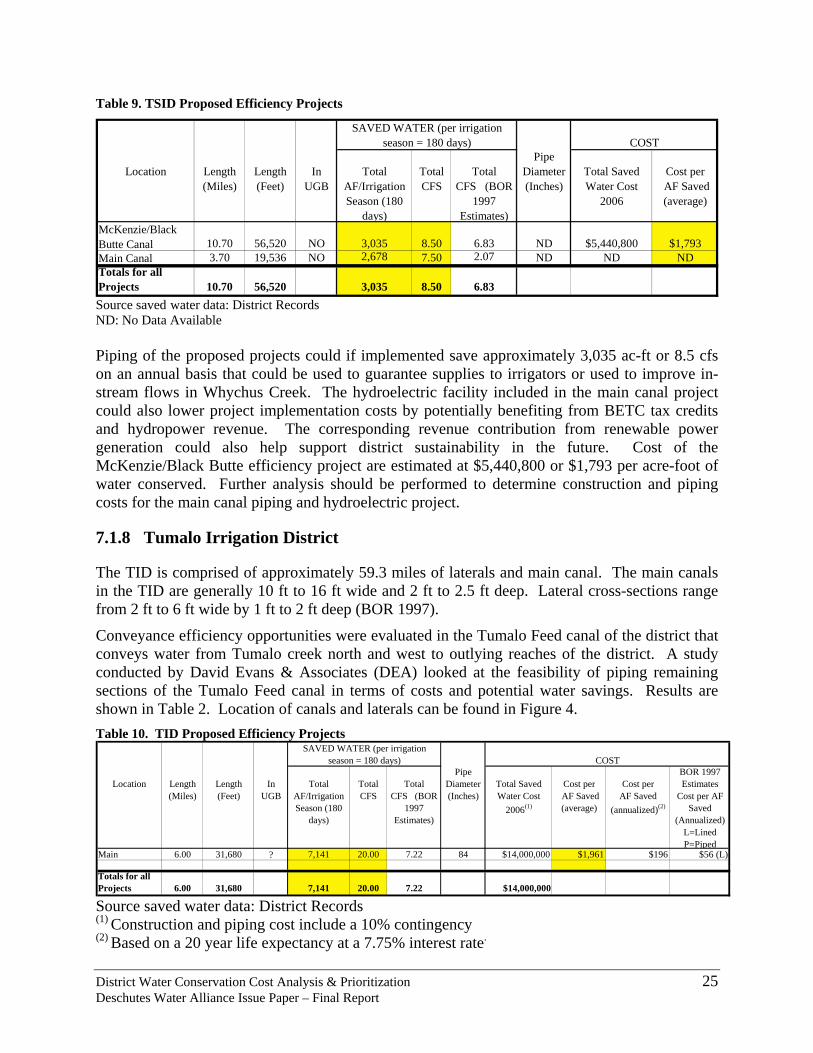
Table 9. TSID Proposed Efficiency Projects
Location Length Length In Total Total TotalPipe
Diameter Total Saved Cost per(Miles) (Feet) UGB AF/Irrigation
Season (180 days)
CFS CFS (BOR 1997
Estimates)
(Inches) Water Cost 2006
AF Saved (average)
McKenzie/Black Butte Canal 10.70 56,520 NO 3,035 8.50 6.83 ND $5,440,800 $1,793Main Canal 3.70 19,536 NO 2,678 7.50 2.07 ND ND NDTotals for all Projects 10.70 56,520 3,035 8.50 6.83
SAVED WATER (per irrigation season = 180 days) COST
Source saved water data: District Records ND: No Data Available Piping of the proposed projects could if implemented save approximately 3,035 ac-ft or 8.5 cfs on an annual basis that could be used to guarantee supplies to irrigators or used to improve in-stream flows in Whychus Creek. The hydroelectric facility included in the main canal project could also lower project implementation costs by potentially benefiting from BETC tax credits and hydropower revenue. The corresponding revenue contribution from renewable power generation could also help support district sustainability in the future. Cost of the McKenzie/Black Butte efficiency project are estimated at $5,440,800 or $1,793 per acre-foot of water conserved. Further analysis should be performed to determine construction and piping costs for the main canal piping and hydroelectric project.
7.1.8 Tumalo Irrigation District
The TID is comprised of approximately 59.3 miles of laterals and main canal. The main canals in the TID are generally 10 ft to 16 ft wide and 2 ft to 2.5 ft deep. Lateral cross-sections range from 2 ft to 6 ft wide by 1 ft to 2 ft deep (BOR 1997).
Conveyance efficiency opportunities were evaluated in the Tumalo Feed canal of the district that conveys water from Tumalo creek north and west to outlying reaches of the district. A study conducted by David Evans & Associates (DEA) looked at the feasibility of piping remaining sections of the Tumalo Feed canal in terms of costs and potential water savings. Results are shown in Table 2. Location of canals and laterals can be found in Figure 4. Table 10. TID Proposed Efficiency Projects
Location Length Length In Total Total TotalPipe
Diameter Total Saved Cost per Cost perBOR 1997 Estimates
(Miles) (Feet) UGB AF/Irrigation Season (180
days)
CFS CFS (BOR 1997
Estimates)
(Inches) Water Cost 2006(1)
AF Saved (average)
AF Saved (annualized)(2)
Cost per AF Saved
(Annualized) L=Lined P=Piped
Main 6.00 31,680 ? 7,141 20.00 7.22 84 $14,000,000 $1,961 $196 $56 (L)
Totals for all Projects 6.00 31,680 7,141 20.00 7.22 $14,000,000
SAVED WATER (per irrigation season = 180 days) COST
Source saved water data: District Records (1) Construction and piping cost include a 10% contingency (2) Based on a 20 year life expectancy at a 7.75% interest rate.
District Water Conservation Cost Analysis & Prioritization 25 Deschutes Water Alliance Issue Paper – Final Report
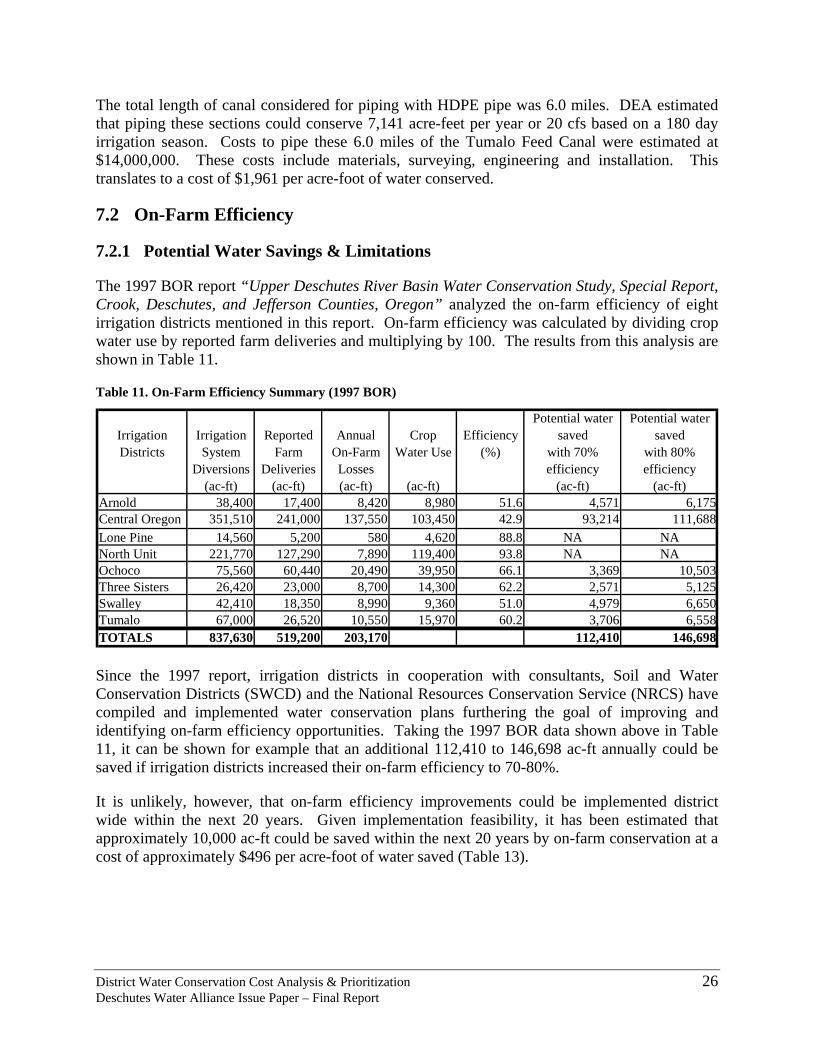
The total length of canal considered for piping with HDPE pipe was 6.0 miles. DEA estimated that piping these sections could conserve 7,141 acre-feet per year or 20 cfs based on a 180 day irrigation season. Costs to pipe these 6.0 miles of the Tumalo Feed Canal were estimated at $14,000,000. These costs include materials, surveying, engineering and installation. This translates to a cost of $1,961 per acre-foot of water conserved.
7.2 On-Farm Efficiency
7.2.1 Potential Water Savings & Limitations
The 1997 BOR report “Upper Deschutes River Basin Water Conservation Study, Special Report, Crook, Deschutes, and Jefferson Counties, Oregon” analyzed the on-farm efficiency of eight irrigation districts mentioned in this report. On-farm efficiency was calculated by dividing crop water use by reported farm deliveries and multiplying by 100. The results from this analysis are shown in Table 11.
Table 11. On-Farm Efficiency Summary (1997 BOR)
Irrigation Irrigation Reported Annual Crop EfficiencyPotential water
savedPotential water
savedDistricts System
DiversionsFarm
DeliveriesOn-Farm Losses
Water Use (%) with 70% efficiency
with 80% efficiency
(ac-ft) (ac-ft) (ac-ft) (ac-ft) (ac-ft) (ac-ft)Arnold 38,400 17,400 8,420 8,980 51.6 4,571 6,175Central Oregon 351,510 241,000 137,550 103,450 42.9 93,214 111,688Lone Pine 14,560 5,200 580 4,620 88.8 NA NANorth Unit 221,770 127,290 7,890 119,400 93.8 NA NAOchoco 75,560 60,440 20,490 39,950 66.1 3,369 10,503Three Sisters 26,420 23,000 8,700 14,300 62.2 2,571 5,125Swalley 42,410 18,350 8,990 9,360 51.0 4,979 6,650Tumalo 67,000 26,520 10,550 15,970 60.2 3,706 6,558TOTALS 837,630 519,200 203,170 112,410 146,698 Since the 1997 report, irrigation districts in cooperation with consultants, Soil and Water Conservation Districts (SWCD) and the National Resources Conservation Service (NRCS) have compiled and implemented water conservation plans furthering the goal of improving and identifying on-farm efficiency opportunities. Taking the 1997 BOR data shown above in Table 11, it can be shown for example that an additional 112,410 to 146,698 ac-ft annually could be saved if irrigation districts increased their on-farm efficiency to 70-80%.
It is unlikely, however, that on-farm efficiency improvements could be implemented district wide within the next 20 years. Given implementation feasibility, it has been estimated that approximately 10,000 ac-ft could be saved within the next 20 years by on-farm conservation at a cost of approximately $496 per acre-foot of water saved (Table 13).
District Water Conservation Cost Analysis & Prioritization 26 Deschutes Water Alliance Issue Paper – Final Report
The following are estimates for various opportunities for improvements, and reduction in water use:
• Sprinkler system improvements: 5 % • Surface (flood) system improvements: 10 – 20% • Piping open earth ditches (seepage loss) 30 – 45% • Irrigation scheduling 5% • Convert surface to sprinkler irrigation systems: 30 – 35%
It must be recognized that it takes specialized experience to provide adequate technical assistance to landowners to improve or convert to alternative on-farm irrigation methods and systems. Some of these issues could be addressed by the following:
• Provide experienced on-farm technical assistance to irrigators, possibly through a DWA funded OSU irrigation engineering/technician (or team). This would reduce possible friction with many other local agencies and groups. Current technology is readily available through OSU, NRCS and SWCDs. Cost estimate would be approximately $150,000 to $200,000 per year.
• Provide cost sharing funding (i.e. materials) for on-farm installations of water efficiency practices. Cost share estimate would be approximately $1,500,000 per year.
Within the Upper Deschutes Basin, many miles of on-farm delivery and distribution system pipelines, sprinkler irrigation systems, gated pipe facilities, tail water collection and pump back facilities, have been installed with technical assistance from local Soil & Water Conservation Districts (SWCD), Natural Resources & Conservation Service (NRCS) and irrigation equipment supply dealers. Financial cost sharing from the NRCS and the American Society of Civil Engineers (ASCE) has been provided on many installations over the years.
7.2.2 On-Farm Efficiency Methods
On-farm improvements may include: delivery & distribution facilities, improvements to existing sprinkler and surface irrigation systems, conversion from surface (flood) to sprinkler irrigation systems, reducing seepage in small ponds by lining, improving irrigation system operations and water management (i.e. irrigation scheduling) and providing adequate maintenance to sprinkler system hardware and pumps. Potential irrigation efficiencies using these different methods can be found in Table 12.
District Water Conservation Cost Analysis & Prioritization 27 Deschutes Water Alliance Issue Paper – Final Report
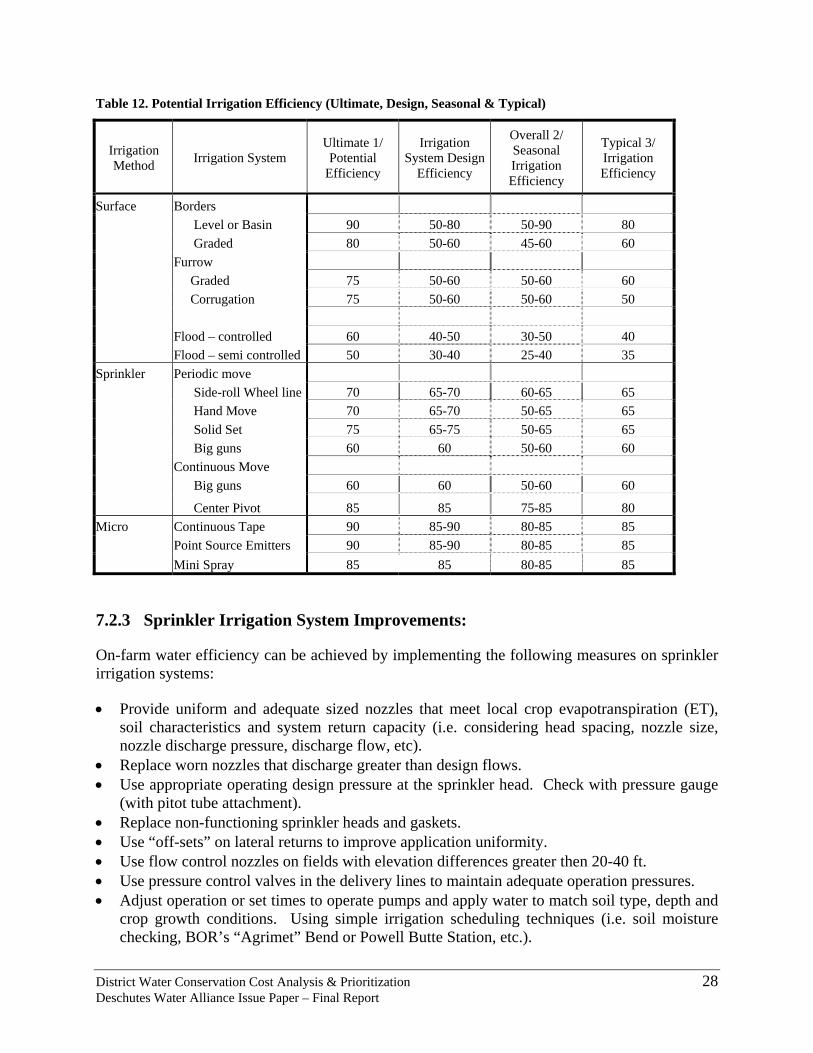
Table 12. Potential Irrigation Efficiency (Ultimate, Design, Seasonal & Typical)
Irrigation Method Irrigation System
Ultimate 1/ Potential
Efficiency
Irrigation System Design
Efficiency
Overall 2/ Seasonal Irrigation Efficiency
Typical 3/ Irrigation Efficiency
Surface Borders Level or Basin 90 50-80 50-90 80 Graded 80 50-60 45-60 60 Furrow Graded 75 50-60 50-60 60 Corrugation 75 50-60 50-60 50 Flood – controlled 60 40-50 30-50 40 Flood – semi controlled 50 30-40 25-40 35 Sprinkler Periodic move Side-roll Wheel line 70 65-70 60-65 65 Hand Move 70 65-70 50-65 65 Solid Set 75 65-75 50-65 65 Big guns 60 60 50-60 60 Continuous Move Big guns 60 60 50-60 60
Center Pivot 85 85 75-85 80 Micro Continuous Tape 90 85-90 80-85 85 Point Source Emitters 90 85-90 80-85 85 Mini Spray 85 85 80-85 85
7.2.3 Sprinkler Irrigation System Improvements:
On-farm water efficiency can be achieved by implementing the following measures on sprinkler irrigation systems:
• Provide uniform and adequate sized nozzles that meet local crop evapotranspiration (ET), soil characteristics and system return capacity (i.e. considering head spacing, nozzle size, nozzle discharge pressure, discharge flow, etc).
• Replace worn nozzles that discharge greater than design flows. • Use appropriate operating design pressure at the sprinkler head. Check with pressure gauge
(with pitot tube attachment). • Replace non-functioning sprinkler heads and gaskets. • Use “off-sets” on lateral returns to improve application uniformity. • Use flow control nozzles on fields with elevation differences greater then 20-40 ft. • Use pressure control valves in the delivery lines to maintain adequate operation pressures. • Adjust operation or set times to operate pumps and apply water to match soil type, depth and
crop growth conditions. Using simple irrigation scheduling techniques (i.e. soil moisture checking, BOR’s “Agrimet” Bend or Powell Butte Station, etc.).
District Water Conservation Cost Analysis & Prioritization 28 Deschutes Water Alliance Issue Paper – Final Report
• Repair leaks in flex hose, valve gaskets, pipe gaskets, etc. • Measure delivery flows. • Provide a pump audit/evaluation to potentially improve pump operation. • Maintain trash screens to prevent plugging of pump and sprinkler head nozzles.
7.2.4 Surface (flood) Irrigation Systems
On-farm water efficiency can be achieved by implementing the following measures on surface irrigation systems:
• Use tail water collection systems and pump-back systems to reuse runoff from flood irrigation. A summary of cumulative overall efficiency with reuse of runoff can be found in Table 6.
• Install lengths-of-run and use appropriate in-flow at head of field, for graded borders, furrows and corrugations, that is based on soil intake and water holding characteristics, field slope, and crop growth. Runoff from the lower end of the field must occur to obtain optimum irrigation application efficiency throughout the field length (i.e. 30 – 35%).
• Convert from open head ditch operations to gated pipe in order to optimize & control flow at the head of field, and decrease seepage losses in head ditch.
7.2.5 Delivery Systems
On-farm water efficiency can be achieved by implementing the following measures on Delivery systems:
• Pipe open earth delivery and distribution facilities that have high seepage losses. • Line existing ponds and pump sumps that have high seepage losses. • Convert open earth pump sumps to “concrete boxes”.
7.2.6 Conversion of Flood Systems to Sprinkler Systems
On-farm water efficiency can be achieved by converting from flood irrigation systems to sprinkler irrigation systems. Sprinkler irrigation systems make more efficient use of irrigation water by reducing surface runoff due to over irrigating lands. Although a pumping cost can occur if delivered water is not pressurized, labor for sprinkler irrigation may actually be less. Surface (flooding) irrigation requires knowledgeable physical labor rather frequently. It may not, however, be currently provided as often as is necessary to prevent excessive runoff and deep percolation. Sprinkler irrigation, which includes periodic move wheel line and hand line systems, typically requires moving fixtures twice per day. Center pivot systems require very little day-to-day labor.
8 SUMMARY OF FINDINGS
This paper presents the results of a cost analysis and prioritization evaluation for efficiency improvements in irrigation districts located in the upper Deschutes Basin, Oregon. Evaluation focus looked at opportunities for efficiency improvements in water conveyance facilities and in on-farm irrigation practices.
District Water Conservation Cost Analysis & Prioritization 29 Deschutes Water Alliance Issue Paper – Final Report
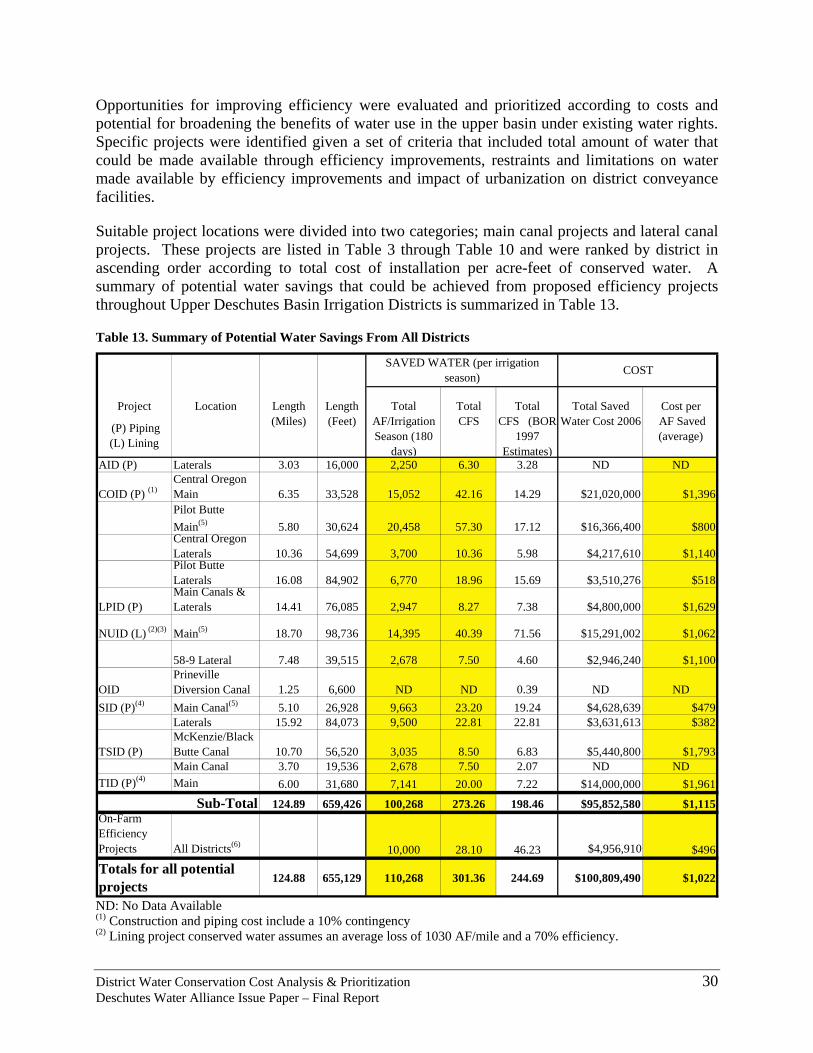
Opportunities for improving efficiency were evaluated and prioritized according to costs and potential for broadening the benefits of water use in the upper basin under existing water rights. Specific projects were identified given a set of criteria that included total amount of water that could be made available through efficiency improvements, restraints and limitations on water made available by efficiency improvements and impact of urbanization on district conveyance facilities.
Suitable project locations were divided into two categories; main canal projects and lateral canal projects. These projects are listed in Table 3 through Table 10 and were ranked by district in ascending order according to total cost of installation per acre-feet of conserved water. A summary of potential water savings that could be achieved from proposed efficiency projects throughout Upper Deschutes Basin Irrigation Districts is summarized in Table 13.
Table 13. Summary of Potential Water Savings From All Districts
Project Location Length Length Total Total Total Total Saved Cost per
(P) Piping (L) Lining
(Miles) (Feet) AF/Irrigation Season (180
days)
CFS CFS (BOR 1997
Estimates)
Water Cost 2006 AF Saved (average)
AID (P) Laterals 3.03 16,000 2,250 6.30 3.28 ND ND
COID (P) (1)Central Oregon Main 6.35 33,528 15,052 42.16 14.29 $21,020,000 $1,396Pilot Butte Main(5) 5.80 30,624 20,458 57.30 17.12 $16,366,400 $800Central Oregon Laterals 10.36 54,699 3,700 10.36 5.98 $4,217,610 $1,140Pilot Butte Laterals 16.08 84,902 6,770 18.96 15.69 $3,510,276 $518
LPID (P)Main Canals & Laterals 14.41 76,085 2,947 8.27 7.38 $4,800,000 $1,629
NUID (L) (2)(3) Main(5) 18.70 98,736 14,395 40.39 71.56 $15,291,002 $1,062
58-9 Lateral 7.48 39,515 2,678 7.50 4.60 $2,946,240 $1,100
OIDPrineville Diversion Canal 1.25 6,600 ND ND 0.39 ND ND
SID (P)(4) Main Canal(5) 5.10 26,928 9,663 23.20 19.24 $4,628,639 $479Laterals 15.92 84,073 9,500 22.81 22.81 $3,631,613 $382
TSID (P)McKenzie/Black Butte Canal 10.70 56,520 3,035 8.50 6.83 $5,440,800 $1,793Main Canal 3.70 19,536 2,678 7.50 2.07 ND ND
TID (P)(4) Main 6.00 31,680 7,141 20.00 7.22 $14,000,000 $1,961
124.89 659,426 100,268 273.26 198.46 $95,852,580 $1,115On-Farm Efficiency Projects All Districts(6) 10,000 28.10 46.23 $4,956,910 $496
124.88 655,129 110,268 301.36 244.69 $100,809,490 $1,022
SAVED WATER (per irrigation season) COST
Totals for all potential projects
Sub-Total
ND: No Data Available (1) Construction and piping cost include a 10% contingency (2) Lining project conserved water assumes an average loss of 1030 AF/mile and a 70% efficiency.
District Water Conservation Cost Analysis & Prioritization 30 Deschutes Water Alliance Issue Paper – Final Report
(3) Construction and lining cost include a 30% contingency. Construction and lining cost includes shotcrete sides from mile 7.4 to 12.3.
(4) Construction and Piping cost include surveying, engineering.
These projects represent a small fraction of total potential efficiency projects that exist throughout the basin irrigation districts. Certain irrigation districts have further studied the potential for piping projects by conducting engineering and construction cost analysis in addition to studying the potential for installing hydroelectric facilities. Costs of piping projects that include hydroelectric facilities could be significantly lowered given the Oregon BETC benefits and hydropower revenue. The pressurized water in piped canals could generate power revenue and reduce power cost to irrigators by eliminating or reducing the need for pumps. Piping projects would also eliminate O&M costs associated with open un-lined canals and laterals. These reduced O&M costs would lower the cost of the initial project construction and would also be eliminated in future years effectively lowering annual operating costs.
Table 13 indicates that implementing all efficiency projects could potentially reduce seepage losses by 100,268 ac-ft or 273.26 cfs on an annual basis. Costs of these projects would be approximately $95,852,580, however, costs for certain projects listed in Table 13 were not available.
Analysis of on-farm conservation opportunities showed that an additional 112,410 to 146,698 ac-ft of water could be saved if on-farm efficiency were improved to 70-80% across all districts. It is unlikely, however, that on-farm efficiency improvements could be implemented district wide within the next 20 years. Given implementation feasibility, it has been estimated that approximately 10,000 ac-ft could be saved within the next 20 years by on-farm conservation at a cost of approximately $496 per acre-foot of water saved (Table 13).
If both proposed piping/lining projects and on-farm conservation measures were implemented throughout the basin, approximately 110,268 acre-feet or 301.36 cfs of water could be made available on an annual basis to broaden the benefits of water use in the upper basin under existing water rights. The total cost of this saved water would be approximately $100,809,490.
The effective reductions in demand brought about by efficiency projects could then help implement alternative reservoir management schemes. Combining these two management practices could significantly improve ecosystem functions by increasing both the volume and timing of in-stream flows. A companion DWA paper “Reservoir Management” addresses how efficiency improvements and reduced water demand described in this paper combined with optimizing reservoir management can help provide for future basin water needs.
Further considerations and study must be made before implementing these projects. Prioritization criteria for how these projects are selected should be further evaluated to ensure that all basin needs and concerns are addressed. Some of these considerations are listed below:
• The North Unit main canal lining project has the potential for reducing seepage losses by 37.84 CFS on annual basis. These seepage losses as mentioned above are estimated and are based on very limited measurements. In addition, reallocation of water obtained by efficiency improvements requires special federal legislations approving other than irrigation use on a federal project.
District Water Conservation Cost Analysis & Prioritization 31 Deschutes Water Alliance Issue Paper – Final Report
• Prioritization criteria in selecting project implementation scheduling should further be solidified.
• In order to compare and prioritize projects between districts, true construction and piping costs must be determined. While uniform piping costs in terms of cost per linear foot of pipe can be determined, construction costs for each district may vary according to district capabilities or options to subcontract project construction.
• Further analysis must be conducted with the districts to determine where piping and lining in specific lateral and main reaches would be most effective in terms of reducing seepage losses.
• Potential opportunities for offsetting construction costs should be further evaluated. These opportunities can include reduced operations and maintenance costs, power production, tax credits and cost sharing with land owners and developers in urban areas.
• Piping laterals before mains can reduce costs of piping main canals in the future by reducing pipe sizes needed to pipe main canals.
• Further analysis must be conducted to refine the feasibility and potential water savings that could be made available by implementing on-farm conservation measures.
District Water Conservation Cost Analysis & Prioritization 32 Deschutes Water Alliance Issue Paper – Final Report
9 REFERENCES
USDA/NRCS, National Engineering Handbook, Part 652, “Irrigation Guide”
USGS, “Geologic Framework of the Regional Ground-Water Flow System in the Upper Deschutes Basin, Oregon.”. Water Resources Investigation Report 02-4015. 2002
USGS, “Ground-Water Hydrology of the Upper Deschutes Basin, Oregon.”. Water Resources Investigation Report 00-4162. 2001
US Bureau of Reclamation, “Upper Deschutes River Basin Water Conservation Study, Special Report, Crook, Deschutes, and Jefferson Counties, Oregon” 1997
American Society of Agricultural Engineers, ASAE Design Standards, ASAE EP408.2, March 1995
USDA/NRCS, National Engineering Handbook, Part 623, Chapter 2, Irrigation Water Requirements, 1993
US Bureau of Reclamation, “Geology Report, Central Oregon Canal System, Upper Deschutes River Basin Water Conservation Project, Oregon”, 1991
US Bureau of Reclamation, “Canal-Lining Demonstration Project Year 7 Durability Report”, R-99-06, 1999.
USDA/NRCS “Farm Irrigation Rating Index”, A Method for Planning, Evaluating, and Improving Irrigation Management, June 1991
American Society of Civil Engineers, ASCE, Proceedings of National Irrigation and Drainage Conference, p24, 1991
USDA/NRCS, Colorado Irrigation Guide, Part 686, Subpart F, “Tail water Recovery Facilities”; & others, December 1988.
US Bureau of Reclamation, “Special Report on Potentials for Expansion and Improvement of Water Supplies, Deschutes Project, Central Division, Oregon”. 1972
Agricultural Research Service, ARS Publication “Design of Re-circulating Irrigation Systems”, by James Bondurant, Kimberly, ID Research Station, 1969
Oregon State Water Law Statutes 537-455 and 537-460, “Conservation and Use of Conserved Water”.
Deschutes River Conservancy (DRC), “Water Monitoring & Conservation Opportunities In Crook County Improvement District #1 Final Report”, December 2005.
District Water Conservation Cost Analysis & Prioritization 33 Deschutes Water Alliance Issue Paper – Final Report