liquid biopsy in breast cancer - uef electronic...
TRANSCRIPT

Liquid biopsy in breast cancer: Identifying circulating tumor DNA from
breast cancer patient serum samples using
PIK3CA-H1047R mutation specific castPCR
Emmi Lotta Karoliina Honkala
Master’s thesis
University of Eastern Finland
School of Medicine
Biomedicine
April 2016

University of Eastern Finland, Faculty of Health Sciences
Department of biomedicine
Lotta Honkala: Liquid biopsy in breast cancer: Identifying of circulating tumor DNA from
breast cancer patient serum samples using PIK3CA-H1047R mutation specific castPCR
April 2016
Key words: breast cancer, cell-free DNA, PIK3CA, castPCR
ABSTRACT
Circulating nucleic acids have been researched as a new potential biomarker for the diagnosis,
prognosis and treatment of breast cancer. Circulating tumor DNA can be accessed by a liquid
biopsy, which would give a snapshot of the primary tumor with a noninvasive technique. This
could allow early diagnosis and enable monitoring during and after cancer therapies even if
the primary tumor has been surgically removed.
The aim of this Master’s Thesis was to study if circulating DNA could be used as a biomarker
in breast cancer. Serum samples from 82 breast cancer patients were chosen for this study.
The first 38 patient samples had ductal breast carcinoma with a T1N0 status at the time of
diagnosis and thus a good prognosis. However, 19 of these patients relapsed or died during
the follow-up time. The second set of 44 patients had triple negative breast cancer.
DNA was extracted using the CNA-kit (Qiagen) and DNA concentration and quality was
measured with Qubit (Thermo Fisher Scientific). Those serum samples which showed a high-
enough DNA concentration were further analyzed with castPCR PIK3CA-H1047R mutation
analysis. Also 22 primary tumor DNA samples were run with castPCR.
In this study, the concentration of circulating cell free DNA was found to be associated with
tumor grade, hormone receptor status of the tumors and relapse. Patients with higher
concentrations of circulating cell free DNA were more likely to express hormone receptors
and to relapse. Furthermore they had a higher mortality rate than patients with low
concentrations. castPCR PIK3CA mutation analysis did not detect the H1047R mutation in
serum samples although 9 out of 22 primary tumor DNA samples were positive in the analysis.
This study shows the potential of circulating nucleic acids as a tumor biomarker for breast
cancer. Quantification of circulating cell free DNA could serve as a prognostic marker for
relapse and survival. However, according to the castPCR analysis, none of the serum DNA
contained the H1047R mutation, and the method for assessing cfDNA must be considered for
the clinical setting. Further research is required to enable the use of cfDNA as an informative
biomarker in the diagnosis, prognosis and treatment of breast cancer.

Itä-Suomen yliopisto, Terveystieteiden tiedekunta
Biolääketieteen laitos
Lotta Honkala: Liquid biopsy in breast cancer: Identifying of circulating tumor DNA from
breast cancer patient serum samples using PIK3CA-H1047R mutation specific castPCR
Huhtikuu 2016
Avainsanat: rintasyöpä, soluvapaa DNA, PIK3CA, castPCR
TIIVISTELMÄ
Sirkuloivia nukleiinihappoja ja niiden potentiaalista roolia on tutkittu rintasyövän
diagnosoinnissa, ennusteessa ja hoidossa. Tuumorista peräisin olevaan DNA:han voidaan
päästä käsiksi ns. nestemäisen biopsian avulla, joka voi olla esimerkiksi yksinkertainen
verinäyte. Nestemäinen biopsia mahdollistaa diagnosoinnin ja taudin seurannan, vaikka
primäärituumori olisi poistettu.
Tutkimukseen valittiin 82 rintasyöpäpotilasta, joilla 38:lla oli pienikokoinen tuumori ja hyvä
ennuste. Näistä potilaista 19 kuitenkin kuoli rintasyöpään tai se uusiutui. Lopuilla 44 potilaalla
oli triple-negatiivinen rintasyöpä.
DNA eristettiin CNA-kitillä (Qiagen) ja sen pitoisuus ja laatu mitattiin Qubit-fluorometrillä
(Thermo Fisher Scientific). Ne seeruminäytteet, joiden DNA-pitoisuus oli tarpeeksi korkea
tutkittiin castPCR PIK3CA -mutaatioanalyysillä. Näiden lisäksi 22 primäärituumori-DNA-
näytettä ajettiin castPCR:llä.
Tässä tutkimuksessa todettiin soluvapaan DNA:n pitoisuudella olevan assosiaatio tuumorin
koon ja reseptoristatuksen sekä relapsin kanssa. Potilailla, joilla oli korkeammat pitoisuudet
soluvapaata DNA:ta, oli korkeampi taipumus relapsiin sekä korkeampi kuolleisuus. castPCR
PIK3CA -mutaatioanalyysi ei havainnut H1047R-mutaatiota seeruminäytteistä, vaikka 9
primaarituumorinäytettä antoivat analyysissä positiivisen tuloksen.
Tämä tutkimus osoittaa sirkuloivien nukleiinihappojen potentiaalin rintasyövän
biomarkkereina. Soluvapaan DNA:n kvantifiointi voisi toimia rintasyövän ennusteen
markkerina syövän uusiutumiselle ja eloonjäämiselle. Mutaatioanalyysi ei kuitenkaan
löytänyt H1047R-mutaatiota seeruminäytteistä, joten menetelmää, jolla soluvapaata DNA:ta
tutkitaan kliinisessä ympäristössä, täytyy harkita. Jatkotutkimus on tarpeen, jotta soluvapaan
DNA:n käyttöön informatiivisena biomarkkerina rintasyövässä voidaan luottaa.

Abbreviations
ATM = ATM serine/threonine kinase gene
BRCA 1/2 = Breast cancer gene 1/2
BRIP1 = BRCA1 interacting protein C-terminal helicase 1 gene
castPCR = Competitive allele-specific TaqMan polymerase chain reaction
cfDNA = cell-free DNA
CHEK2 = Checkpoint kinase 2 gene
CNA = Circulating nucleic acid
COSMIC = Catalogue of somatic mutations in cancer
ctDNA = circulating tumor DNA
DCIS = Ductal carcinoma in situ
DNA = Deoxyribonucleic acid
IDC = Invasive ductal carcinoma
ER = estrogen receptor
FGFR2 = Fibroblast growth factor receptor 2 gene
HER2 = human epidermal growth factor receptor 2
H1047R = histidine to arginine substitution at position 1047 on PIK3CA
IPC = Internal positive control
MAP3K1 = Mitogen-activated protein kinase kinase kinase 1 gene
OS = Overall survival
PALB2 = Partner and localizer of BRCA2 gene
PIK3 = phosphatidylinositol-3-kinase
PIK3CA = phosphoinositide-3-kinase catalytic alpha polypeptide gene

PIK3CA = phosphatidylinositol-4,5-biphosphate-3-kinase catalytic subunit α
PR = progesterone receptor
PTEN = Phosphatase and tensin homolog gene
RFS = relapse-free survival
RNA = Ribonucleic acid
RT = room temperature
SNP = single nucleotide polymorphism
STK11 = Serine/threonine kinase 11 gene
TNM = Tumor, Node, Metastasis
TP53 = Tumor protein p53 gene
UICC = International Union Against Cancer

Acknowledgements
I had the opportunity to carry out this Master’s Thesis in the Department of Clinical Pathology
and Forensic Medicine at the University of Eastern Finland.
I had the privilege to work with a talented research team who took me under their wing and
who helped and guided me through this process. I would like to thank my supervisors PhD,
Associate Professor Arto Mannermaa and PhD, Hanna Peltonen for their guidance, support
and expertise. This project was very interesting and the results exciting. I am very grateful to
have been able to do this particular thesis work and with these individuals. Other than my
supervisors I would also like to extend my thanks to the whole research group at the
Department of Clinical Pathology and Forensic Medicine, including Helena Kemiläinen for
technical assistance and especially Eija Myöhänen, who was my mentor in the lab.
Also I want to express my thanks to my fellow students and my friends, who kept motivating
me and supporting me throughout the process. I won’t name names but you know who you
are and I am forever grateful.

TABLE OF CONTENTS
ABSTRACT……………………………………………………………………………….
TIIVISTELMÄ…………………………………………………………………………….
Abbreviations………………………………………………………………………………
Acknowledgements………………………………………………………………………..
LITERARY REVIEW ........................................................................................................... 10
1. Introduction ........................................................................................................................ 10
1.1. Breast cancer ............................................................................................................... 10
1.1.1 Classification ......................................................................................................... 11
1.1.2 Risk factors ............................................................................................................ 13
1.1.3 Diagnosis and treatment......................................................................................... 15
1.2 Tumor biomarkers ........................................................................................................ 16
1.3. Circulating cell-free nucleic acids as markers for breast cancer ................................. 17
1.3.1 Origin of cell-free DNA in the blood ..................................................................... 18
1.3.2 Amounts of cfDNA found in healthy individuals and cancer patients .................. 19
1.4. PIK3CA is a frequently mutated gene in sporadic breast cancer................................. 19
1.4.1. The H1047R mutation located on the catalytic domain of PIK3CA .................... 20
2. Aims of the study ............................................................................................................... 21
3. MATERIALS AND METHODS ....................................................................................... 22
3.1 Patients and samples ..................................................................................................... 22
3.1.1 Patients ................................................................................................................... 22
3.1.2 Serum samples ....................................................................................................... 22
3.1.3 Cell lines ................................................................................................................ 24
3.1.5 Primary tumor samples .......................................................................................... 24
3.2 DNA extraction ............................................................................................................ 24
3.2.1 Circulating nucleic acid extraction ........................................................................ 24
3.2.2 Extraction of MDA-MB-453 cell line DNA .......................................................... 24

3.3 Quantification of serum and MDA-MB-453 DNA ...................................................... 25
3.4 Competitive Allele-Specific TaqMan PCR .................................................................. 25
3.4.1 The castPCR protocol ............................................................................................ 26
3.4.2 Workflow ............................................................................................................... 27
3.5 Statistical analysis ........................................................................................................ 29
4. RESULTS .......................................................................................................................... 30
4.1 Quantification of cell-free DNA from patient serum samples ..................................... 30
4.2 Analysis of tumor-related cell-free DNA using PIK3CA mutation specific cast-PCR 32
4.2.1 The reference genome assay has high sensitivity at all tested concentrations ....... 32
4.2.2 MDA-MB-453 is a positive control for the H1047R mutation ............................. 33
4.2.3 The PIK3CA mutation assay has high sensitivity when mutation frequency is 100
% ..................................................................................................................................... 33
4.2.4 Dilution of the mutation frequency lowers sensitivity of the PIK3CA mutation assay
........................................................................................................................................ 34
4.2.5 Serum cell-free DNA samples are mutation negative when using PIK3CA mutation-
specific castPCR ............................................................................................................. 36
4.2.6 Association between patients’ clinicopathological characteristics and cell-free DNA
concentrations obtained from extraction......................................................................... 41
5. DISCUSSION .................................................................................................................... 50
5.1 Low tumor burden and prolonged storage of serum may account for lower cfDNA
concentration ...................................................................................................................... 51
5.2 Detecting tumor-related genetic changes in cell-free DNA ......................................... 52
5.2.1 Competitive Allele-specific TaqMan PCR is sensitive and specific ..................... 53
5.2.2 Quality control of castPCR using specified control samples ................................. 54
5.2.3 Patient serum DNA samples with triple negative or T1N0 breast cancer analyzed
with Competitive Allele-Specific TaqMan PCR PIK3CA mutation assay .................... 55
5.2.4 castPCR run of available primary tumor DNA samples and re-run of serum samples
with mutation positive primary tumor DNA................................................................... 55

5.2.5. No detection of H1047R mutation with high enough frequency from cfDNA using
PIK3CA mutation specific castPCR ............................................................................... 56
5.3 cfDNA concentration may be a viable prognostic marker in breast cancer ................. 57
5.4 Effects of disease progression and treatment must be considered when examining
cfDNA as a prognostic marker ........................................................................................... 58
5.4.1 Sequencing study shows correlation between common samples ........................... 59
5.4.2 Limited mutation detection range of castPCR may hinder its clinical application 60
6. Conclusions ........................................................................................................................ 60
7. References .......................................................................................................................... 61

10
LITERARY REVIEW
1. Introduction
1.1. Breast cancer
Breast cancer is one of the most prevalent cancers worldwide. In 2012 over 1.6 million new
breast cancer cases were diagnosed making it the most common cancer in women and the
second-most common cancer overall. One in four of all cancers in women is breast cancer and
it is ranked the fifth most common cancer-related cause of death worldwide. Breast cancer alone
accounts for approximately half a million deaths per year. (Ferlay et al., 2015)
In Finland 4831 new breast cancer cases were diagnosed in 2013 representing 30.6 % of all
cancers diagnosed in females that year. It has 22.4 % prevalence in the Finnish adult population
and caused 878 deaths in the year 2013. (Ferlay et al., 2015; the Finnish Cancer Registry, 2015)
Breast cancer can occur in men also but cases are very rare with 231 prevalent cases in Finland
in 2014 (the Finnish Cancer Registry, 2015).
Cancer is a heterogeneous disease. Cancerous growth begins when cells start to grow
uncontrollably, with regular cell cycle arrest dysfunctioning. This is usually due to DNA
damage which is not repaired by normal DNA repair systems. In a normal situation if DNA
damage is not repaired, the cell goes into apoptosis and dies, preventing damaged cells from
growing. Most mutations cause programmed cell death, however some remain. In cancer cells
this regulated cell death does not occur. Genes which attain mutations that cause cancerous
growth are called oncogenes. These genes encode proteins and enzymes that take part in normal
cell functions such as cell growth, however when these genes contain mutated DNA the proteins
encoded are faulty and cause changes in these functions. Mutations in DNA can be inherited or
they are caused by mistakes made in normal DNA replication processes or by environmental
factors. Most mutations are spontaneous. (Girish et al., 2014)

11
1.1.1 Classification
Breast cancers are classified according to the tissue that the cancer originates from. Solid tumors
derived from epithelial tissues, like tumors of the breast, are known as carcinomas (Alix-
Panabieres et al., 2012). Invasive ductal carcinoma (IDC) is the most common type of breast
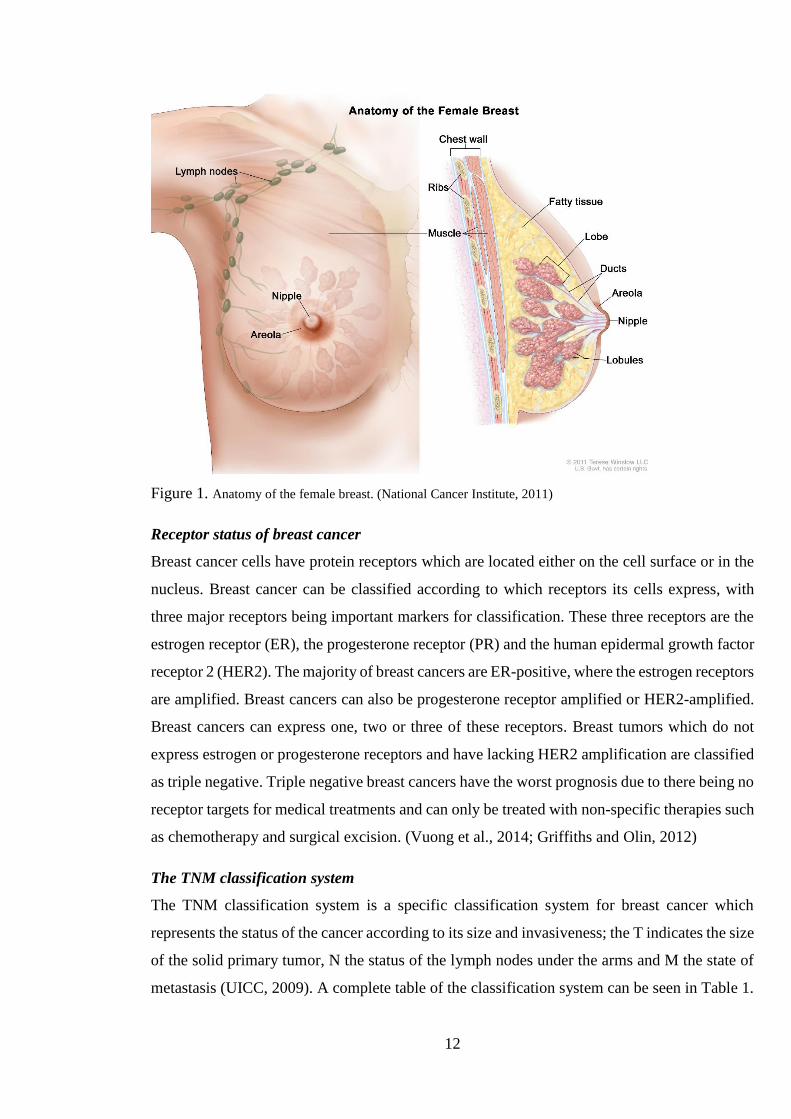
cancer which represents up to 80 % of all cases (www.breastcancer.org;
www.cancerresearchuk.org). The anatomy of the female breast and its most prominent
structures can be visualized in Figure 1.
Tissue origin
Ductal carcinoma signifies that the cancer is of ductal origin, i.e. the cancer has originated from
the normal ductal tissue of the breast. It can be classified as ductal carcinoma in situ (DCIS) or
invasive ductal carcinoma (IDC). In situ indicates that the cancer is growing locally and has not
yet invaded surrounding tissue, in particular the basement membrane. In situ carcinoma’s
priority treatment is dissection of the mass with enough margin to be sure that all cancerous
cells are removed. This type of breast cancer can be of varying size and it is usually benign.
However, ductal carcinoma can become malignant, meaning that it is able to invade
surrounding tissues and spread to other organs of the body via the blood stream and lymph
vessels. It is not known whether breast cancer always starts out as in situ from which it evolves
into a malignant cancer, or if it can be in situ without connection to the malignant or vice versa.
Some studies support the notion of DCIS being a precursor to IDC due to similar non-genetic
risk factors. (Petridis et al., 2016)
Breast cancer can also be lobular, which originates from milk-producing glands (lobules) in the
breast. Lobular breast cancer is much less common; only about 1 in 10 cases are lobular. There
are also very rare forms of breast cancer including tubular, medullar, and papillary carcinoma,
in which the names indicate where the cancer originated from. Other rare forms are Paget
disease and inflammatory breast cancer. (Abdulkareem, 2013)
12
Figure 1. Anatomy of the female breast. (National Cancer Institute, 2011)
Receptor status of breast cancer
Breast cancer cells have protein receptors which are located either on the cell surface or in the
nucleus. Breast cancer can be classified according to which receptors its cells express, with
three major receptors being important markers for classification. These three receptors are the
estrogen receptor (ER), the progesterone receptor (PR) and the human epidermal growth factor
receptor 2 (HER2). The majority of breast cancers are ER-positive, where the estrogen receptors
are amplified. Breast cancers can also be progesterone receptor amplified or HER2-amplified.
Breast cancers can express one, two or three of these receptors. Breast tumors which do not
express estrogen or progesterone receptors and have lacking HER2 amplification are classified
as triple negative. Triple negative breast cancers have the worst prognosis due to there being no
receptor targets for medical treatments and can only be treated with non-specific therapies such
as chemotherapy and surgical excision. (Vuong et al., 2014; Griffiths and Olin, 2012)
The TNM classification system
The TNM classification system is a specific classification system for breast cancer which
represents the status of the cancer according to its size and invasiveness; the T indicates the size
of the solid primary tumor, N the status of the lymph nodes under the arms and M the state of
metastasis (UICC, 2009). A complete table of the classification system can be seen in Table 1.

13
Table 1. The TNM breast tumor classification system (UICC, 2009)
Primary tumor (T)
TX Primary tumor cannot be assessed
T0 No evidence of tumor
Tis Carcinoma in situ
T1
T1a
T1b
T1c
Tumor is < 2 cm in its greatest dimension
Tumor is > 0.1 cm but less than 0.5 cm
Tumor is more than 0.5 cm but less than 1 cm
Tumor is more than 1 cm but not more than 2 cm
T2 Tumor is > 2 cm but no more than 5 cm in its greatest dimension
T3 Tumor is > 5 cm in its greatest dimension
T4 Tumor has attached to chest wall and/or skin
Regional lymph nodes (N)
NX Regional lymph nodes cannot be assessed
N0 No regional lymph node metastasis
N1 Metastasis in ipsilateral level I and II axillary lymph node(s)
N2
N2a
N2b
Metastasis in ipsilateral level I and II axillary OR internal mammary lymph
node(s)
Metastasis in axillary lymph node(s) fixed to one another or to other structures
Metastasis in internal mammary lymph node(s) in the absence of metastasis in
axillary lymph node(s)
N3
N3a
N3b
N3c
Metastasis in level III axillary ipsilateral infraclavicular lymph node(s)
Metastasis in infraclavicular lymph node(s)
Metastasis in internal mammary and axillary lymph node(s)
Metastasis in supraclavicular lymph node(s)
Metastasis (M)
M0 No distant metastasis
M1 Distant metastasis
1.1.2 Risk factors
Genetic factors
Breast cancer is caused by genetic abnormalities such as somatic mutations and epigenetic
changes. These genetic changes can be either sporadic or hereditary. Approximately 10 % of
breast cancers cause a highly increased inherited risk of the disease for first-degree relatives.
Hereditary breast cancers, as any other hereditary diseases, are caused by genetic mutations in
the germ line, which can be passed on from mother to daughter. (Kenemans et al., 2008) These
mutations cause susceptibility to breast cancer. Two of the most known susceptibility factors

14
are breast cancer susceptibility gene 1 and 2, BRCA1 and BRCA2 respectively (Campeau et al.,
2008; Wooster and Weber, 2003). These two genes can cause over a 60 % increase in risk of
breast cancer if mutations occur and are known as high-penetrance genes (Wooster and Weber,
2003). There are also other so called high-risk hereditary breast cancer susceptibility genes
which include tumor suppressors TP53, PTEN and STK11. Tumor suppressors, in normal
conditions, have roles in cell cycle repression and apoptosis. Breast cancer susceptibility genes
give different levels of increased risk. Genes of intermediate risk include ATM, CHEK2, PALB2
and BRIP1. (Shiovitz and Korde, 2015; Campeau et al., 2008) Breast cancer hereditary risk
genes give a predisposition to cancer, meaning and increased risk of cancerous cell growth, but
somatic mutations are necessary for cancer to evolve. It is these mutations which cause the
genes to become oncogenes and cause the predisposition. (Shiovitz and Korde, 2015) New loci
for breast cancer susceptibility are constantly researched and found, with 76 known low
penetrance loci that account for approximately 35 % of hereditary breast cancer risk (Petridis
et al., 2016; Michailidou et al., 2013). However researchers are mainly focusing on those which
have a high frequency in breast cancer patients, such as the ones mentioned above (Shiovitz
and Korde, 2015).
Most breast cancers are sporadic, i.e. the genetic alteration that causes evolvement of the tumor
is not inherited but acquired (Kenemans et al., 2008). These somatic mutations are usually
single point mutations caused by single nucleotide polymorphisms (SNPs) that cause damage
to DNA and are not corrected by the normal DNA correcting system. Sporadic breast cancer
requires multiple “hits”, meaning more than one acquired uncorrected mutation in somatic
genes, to cause the formation of cancer cells. The cell fails to go to apoptosis and so it divides,
giving daughter cells the same damaged DNA. Uncontrolled cell division is the basis of all
cancers. Cancer requires more of these so called “hits” in order to evolve further, for example
to become invasive, metastasize or develop angiogenesis. In sporadic breast cancer only few
genes are mutated frequently with PIK3CA and TP53 among them (Nik-Zainal et al., 2012).
Low penetrance or low risk genes which affect to sporadic breast cancer have been found
through genome wide association studies and the most common ones are FGFR2 and MAP3K1.
(Campeau et al., 2008)
It is important to recognize the genetic alterations each individual patient has as they are specific
to each cancer and oncologists can target these alterations when deciding on treatment for
patients diagnosed with breast cancer. By genotyping a patient cancer oncologists can recognize
the mutations it harbors and find a drug that would reverse the functions of these mutations.

15
They can then decide what treatment to pursue and even more importantly researchers can get
new knowledge about the genetics of breast cancer and develop new drugs and new treatment
methods. Oncologists and researchers work together to provide the best possible treatment for
each patient.
Environmental factors
There are many environmental factors which can increase an individual’s risk of breast cancer.
These factors include lifestyle habits and other factors that cannot be controlled, such as age.
Lifestyle habits such as smoking, exercise and use of alcohol can greatly effect ones risk of
breast cancer. Many risk factors are related to overall female estrogen exposure. After
menopause the risk is greatly increased when female estrogen hormone production changes.
The risk of getting breast cancer in Finland before the age of 75 is 10 %, meaning one in ten
females will be diagnosed with breast cancer before their 75th birthday (The Finnish Cancer
Registry, 2015). One controllable factor is the age that one chooses to reproduce; childlessness
can increase the risk of breast cancer. Menstruation and pregnancy have an effect on overall
estrogen production, which in turn effects development of breast cancer. (Abdulkareem, 2013)
1.1.3 Diagnosis and treatment
As for any cancer, early diagnosis is key to survival. Breast cancer is often not diagnosed until
symptoms occur. Breast cancer diagnosis is done by a physician by performing a breast
examination and mammography which is essentially an X-ray of the breast. An ultrasonography
may also be performed, which might give more information of the nature of the finding. If
something is found, a sample or biopsy can be taken to determine whether the finding is benign
or malignant and how to proceed. (Girish et al., 2014)
Breast cancer can be treated with surgery, which is primary, and hormone therapy targeting
ER/PR/HER2, chemotherapy or radiation therapy. For early stage breast cancers the standard
treatment is excision of the tumor with or without additional treatment. For in situ cancers the
tumor mass is always excised by surgery, usually without a combination of other treatment.
Malignant cancers are treated with a combination of treatments depending on the type of breast
cancer. (Girish et al., 2014; Le Du et al., 2013) Triple negative breast cancer can only be treated
by chemotherapy, radiation therapy and/or surgery as it expresses no receptors that can be
specifically targeted (Griffiths and Olin, 2012).

16
As important as finding the right treatment is, it is equally important to monitor the patient’s
response to the treatment. Proper monitoring helps oncologists further optimize the treatment
to be patient specific. Personalized treatment is one the main goals in cancer research today.
Also monitoring shows which treatments are ineffective so these therapies can be avoided.
The main current monitoring method is by a primary tumor biopsy. A tissue biopsy is highly
invasive, and as monitoring of the tumor must be done frequently it is not ideal. Also the
primary treatment after diagnosis is excision of the primary tumor and so a tissue biopsy cannot
be done. A new method of taking a biopsy of tumors is being researched, the so called liquid
biopsy. A liquid biopsy is for example a simple blood sample, which contains tumor DNA and
so gives a snap-shot of the primary tumor. This type of biopsy is non-invasive and is easy for
both the patient and physician. It can also be taken even though the primary tumor has been
surgically removed.
1.2 Tumor biomarkers
Biomarkers are different types of molecules, genes, proteins etc. something biological which
gives an indication of something happening in the body. Tumor biomarkers can indicate the
presence of a tumor and its characteristics and they are classified as something produced either
by the tumor or in response to the tumor. (Paoletti and Hayes, 2014; Vuong et al., 2014)
One of the most important factors in overall survival for a cancer patient is how early the disease
is detected; the earlier a tumor is detected, the better. Biomarkers make early diagnosis possible.
Overall survival is greatly affected when the disease is diagnosed while still asymptomatic. Not
only early diagnosis, but at a later stage early identification of possible relapse is essential to
conquering the disease (Reid et al., 2015; Crowley et al., 2013). Another important aspect of
success in treating breast cancer is the ability to monitor disease progression and the effect of
treatment to decrease use of toxic non-effective drugs (Dawson et al., 2013; Elshimali et al.,
2013). Personalized cancers require personalized therapies.
Tumor biomarkers are needed to measure tumor burden (Diaz and Bardelli, 2014). They can
give a more accurate prognosis and assessment of overall survival. Biomarkers also give us an
assessment of what stage the cancer is in and can in this way help evaluate how to proceed with
treatment.
The most used biomarkers currently are the BRCA1 and 2 genes along with the hormone
receptor status (ER/PR/HER2) of the tumor. New biomarkers are continually studied and

17
verified including markers such as DNA and microRNAs. Tumor DNA contains tumor specific
mutations and these mutations could be potentially used as biomarkers. (Paoletti and Hayes,
2014; Vuong et al., 2014)
In the next section one of the most recently discovered candidates for a cancer biomarker will
be discussed.
1.3. Circulating cell-free nucleic acids as markers for breast cancer
Circulating or cell-free nucleic acids (CNAs) are fragments of DNA or RNA that circulate in
the bloodstream free from confinement within cells. CNAs can form complexes with
proteolipids, be contained in apoptotic vessels or in a complex with the p53 protein or “naked”
(Schwarzenbach, 2013; Fleischhacker and Schmidt, 2007). Small amounts of extracellular
DNA can be found in the blood of all humans, including healthy individuals. The amounts differ
between individuals, with different aspects affecting to this such as disease status.
Concentrations in healthy individuals is very low due to removal by phagocytes (Elshimali et
al., 2013) but increasing amounts of CNAs have been found in cancer patients (Dawson et al.,
2013; Fleischhacker and Schmidt, 2007; Anker et al., 1999). The variability of results from
studies investigating cfDNA concentrations between cancer patients and healthy individuals
must be noted. Some studies state that they were able to discriminate between healthy
individuals and cancer patients, but could not indicate whether the patients had benign or
malignant breast lesions relying only to cfDNA concentration (Schwarzenbach, 2013). Others
on the other hand show increasing amounts in patients with advanced disease and patients with
low disease burden presenting a CNA amount of a healthy individual (Anker et al., 1999).
Diseases other than cancer have also been shown to increase CNA levels, including
inflammatory bowel disease, hepatitis and rheumatoid arthritis (Anker et al., 1999). CNA levels
have been shown to change also in states of inflammation and for example after periods of
extensive exercise (Fleischhacker and Schmidt, 2007).
All knowledge of CNAs is still considered to be hypothetical with more research needed to
know exactly how and why CNAs are released into the bloodstream in normal and pathological
conditions.
Recent discoveries have found cancer-related genetic changes also in the serum and plasma of
cancer patients which further indicates the presence of tumor-derived DNA in the blood. These
discoveries open up a new prospect in cancer diagnostics, monitoring and treatment. With a

18
liquid biopsy characteristics of the cancer could be seen by merely taking a blood sample
compared to a highly invasive tissue biopsy. A biopsy of the cancer is vital in order for correct
treatment methods to be chosen as well as for monitoring the effect of treatment. A liquid biopsy
would be ideal for monitoring treatment, as it is much less invasive and the procedure is much
simpler for the physician as well as for the patient. It is also less time consuming and
inexpensive. Another important implication is the biomarker potential of circulating cell-free
DNA, which could be accessed via liquid biopsy. (Schwarzenbach, 2013)
1.3.1 Origin of cell-free DNA in the blood
The origin of cell-free DNA (cfDNA) in the blood is not yet fully understood. It was first
discovered in 1948 but it was not until the 1970’s when it started to peak interest and was
investigated in cancer patients (Leon et al., 1977). Leon et al. (1977) showed the presence of
cell free DNA in the blood of healthy individuals and of cancer patients. The origin of the DNA
was thought to be due to normal tissue and cell injury which would cause release of DNA into
the bloodstream. This release would be increased in the pathologic condition of cancer.
Apoptosis has been confirmed as a key source of cell-free DNA in the bloodstream (Elshimali
et al., 2013). In normal conditions cell injury leads to apoptosis and the release of DNA into the
circulation whereas in pathologic conditions the release is due to either apoptosis or necrosis of
cells (Schwarzenbach, 2013; Fleischhacker and Schmidt, 2007; Jahr et al., 2001). Other sources
of cfDNA are cell lysis by necrosis, spontaneous release, blood cell lysis and break down of
pathogens (Elshimali et al., 2013). It has also been speculated whether cancer actively releases
DNA into the circulation as preparation for metastasis, but the method for this is not yet known
(Schwarzenbach, 2013; Jahr et al., 2001).
Circulating DNAs are double-stranded in various fragment sizes ranging from under 180 base
pairs to over 30 kilobases (Elshimali et al., 2013; Fleischhacker and Schmidt, 2007). This
varying size can hinder its detection. Cell-free DNA has been mainly extracted from plasma or
serum using commercial DNA extraction kits. Whether plasma or serum is the better material
for extraction has been unclear, with studies stating pros and cons for both (Elshimali et al.,
2013). cfDNA levels are shown to be generally higher in serum than in plasma, but this is agreed
to be due to possible release of DNA from hemapoietic cells during the clotting process
(Benesova et al., 2013; Schwarzenbach, 2013).

19
1.3.2 Amounts of cfDNA found in healthy individuals and cancer patients
In healthy controls the amount of cfDNA is minimal and even at non-detectable levels as was
the case with 42 out of 55 tested healthy individuals in the study by Leon et al. (1977). The
range for these 55 individuals was from 0 to 50 ng/ml. The range for cfDNA of the 173
cancerous patients serum tested was from 0 to 5000 ng/ml with a mean of 180 ng/ml. This study
demonstrates the broad range of cell free DNA in pathologic conditions and Leon et al. (1977)
point out that this may hinder the diagnostic value of a liquid biopsy with a relatively large
proportion of cancer patients showing normal amounts of cfDNA. It must be kept in mind that
the study is quite dated and methods for quantifying cfDNA are not as sensitive as today.
However, more recent studies do concur with these findings showing mean concentrations from
less than 10 ng/ml to over 1500 ng/ml (Elshimali et al., 2013), with one study showing as low
as 1 ng/ml in healthy individuals (Board et al., 2010). Nearly all of the patients in Board and
colleagues’ (2010) study had received some form of treatment and it has been shown that there
are drops in the amount of cfDNA in cancer patients after treatment such as surgery (Elshimali
et al., 2013). Leon et al. (1977) suggest that the biopsy should be taken before initiation of
treatment. The concentrations of cfDNA varies between individuals whether they are healthy
or have cancer.
As concentration of cfDNA is believed to be increased in the disease state of cancer, it must be
concluded that the increase is due to tumor DNA in the blood. The proportion of cfDNA of
tumor origin is dependent on factors such as tumor size and state of metastasis, however each
patient is an individual and not all factors are known (Schwarzenbach, 2013). Now the tide is
turning from just quantitating the cfDNA found in cancer patients’ plasma/serum to qualifying
how much of the free DNA is actually of tumor origin and characterizing the DNA in order to
identify characteristics in the primary tumor.
1.4. PIK3CA is a frequently mutated gene in sporadic breast cancer
The phosphoinositide-3-kinase catalytic alpha polypeptide gene or PIK3CA is a 34 kb sized
gene located on chromosome 3 and is composed of 20 coding exons. It encodes the
phosphatidylinositol-4.5-biphosphate-3-kinase catalytic subunit α (p110α or better known as
PIK3CA) of a regulatory kinase PI3K (phosphatidylinositol 3-kinase). PI3K is part of an
essential signaling pathway which regulates cell proliferation among other important functions
such as cell motility and morphology. (Oshiro et al., 2015; Bader et al., 2005)

20
The PIK3CA gene is known to have frequently occurring alterations that have been linked to
different types of solid cancers in humans, including breast cancer. Somatic mutations in this
gene are present in 15 % of human cancers and it is the most commonly mutated gene in patients
with breast cancer, with a frequency of up to 40 % (Oshiro et al., 2015; Schwarzenbach, 2013;
Higgins et al., 2012; Karakas et al., 2006). PIK3CA harbors three so called ‘hotspot’ mutations
which frequently occur in the oncogene in cancer patients. These mutations, H1047R, E545K
and E542K, account for up to 80 % of all PIK3CA mutations in breast cancer (Oshiro et al.,
2015; Board et al., 2010; Karakas et al., 2006; Bader et al., 2005). As it has a major role in
regulation of cell growth, PIK3CA is thought to give rise to cancerous growth when its activity
is enhanced (Board et al., 2010; Karakas et al., 2006).
It has been speculated whether PIK3CA mutations could be used as prognostic markers in
addition to monitoring tumor status. In a recent study patients with PIK3CA mutated circulating
tumor DNA (ctDNA) had worse prognosis with lower relapse-free survival (RFS) and overall
survival (OS) rates than did patients without these mutations. (Oshiro et al., 2015)
1.4.1. The H1047R mutation located on the catalytic domain of PIK3CA
One of the most common oncogenic alterations in the PIK3CA gene is a somatic missense
mutation located on exon 20 called H1047R, where the amino acid histidine has been
substituted by arginine at position 1047 (Figure 2). Exon 20 encodes the catalytic domain of
the protein. Somatic mutations in exon 20 have been reported in multiple studies before the
year 2006 with a combined frequency of 26 % in breast cancer patients (Karakas et al., 2006).
According to the COSMIC database (Catalogue of somatic mutations in cancer, Wellcome
Trust Sanger Institute, Cambridge, UK), H1047R is the most frequent mutation in sporadic
breast cancer. It is a substitution mutation where adenine is substituted with guanine causing a
missense read frame.

21
Figure. 2 The p110α subunit of PIK3CA which harbors the H1047R mutation in its catalytic domain. (Adapted
from (Kalinsky et al., 2009)
2. Aims of the study
This study constitutes to a larger biomarker study which strives to find tools for oncologists for
earlier diagnosis and to aid in planning more efficient personalized treatments. Ultimately the
purpose was to find a plausible reason for why patients with the same prognosis have such
differing outcomes with their disease and to possibly discover new knowledge about the reasons
behind the poor prognosis of triple negative breast cancer. The goal was to investigate whether
cell-free tumor DNA could be used as a biomarker in breast cancer. This was done two ways:
firstly studying whether a single point mutation could be found from cfDNA, in effect detecting
DNA which is of tumor origin and secondly examining the relationship between cfDNA
concentration and clinical variables and survival. The main aim of this study was to identify the
H1047R mutation of the PIK3CA gene from blood serum DNA of patients with early-stage
breast cancer and to find connections between cfDNA concentration and outcome of the
disease.

22
3. MATERIALS AND METHODS
3.1 Patients and samples
3.1.1 Patients
Patient samples were acquired through the Kuopio Breast Cancer Project (Mannisto et al.,
1999). Samples were taken from women with all types of breast cancer at the time of diagnosis
during the years 1990-1995 in Kuopio University Hospital. These women are still followed-up
on intensely with the most recent follow-up session done in 2015 and they have had additional
samples taken over the years. Altogether samples from 82 patients were studied in this project.
3.1.2 Serum samples
Serum is a component of blood which does not contain blood cells or coagulation factors. Serum
is obtained by centrifugation, to remove cellular components after which the remaining plasma
is allowed to clot.
Two sets of serum samples were chosen for this study. The first set of 38 samples were chosen
according to the criteria of initial diagnosis of ductal breast carcinoma with the status T1, N0.
In this case T1 means that the primary tumor is less than 2 cm in diameter and N0 that the tumor
has not spread to the lymph nodes under the arms (UICC, 2009). A complete table of the
classification system can be seen in Table 1. Out of the 38 samples, 19 had ductal carcinoma
that lead to relapse and/or death while the remaining 19 had ductal carcinoma but no relapse.
The first 19 study samples are compared to the other 19 breast cancer samples with same
clinicopathological characteristics, excluding relapse and/or death. These samples were
matched up to each other as well as possible, including criteria such as age, treatment and breast
cancer type. These samples were chosen because of the abnormality in their cancer
development; the T1, N0 status indicates a form of breast cancer with a good prognosis,
unfortunately these 19 patients had poor outcomes. From the patients with good prognosis, but
bad outcome, 9 have died of causes related to breast cancer and 8 have gone through relapse.
From the 19 patients with good prognosis and good outcome 15 are still alive today with no
relapse and 4 have died of causes not directly related to breast cancer.
The second set of 44 patient samples were chosen with the sole criteria of having triple negative
breast cancer. The triple negative form is known to be the most deadly form of breast cancer as
it has limited treatment possibilities (Griffiths and Olin, 2012). From the 44 patients with triple

23
negative breast cancer 12 have died of causes related to breast cancer and 4 have gone through
relapse. Clinicopathological data of all the patients are summarized in table 2.
A blood serum sample from a healthy individual was used as the negative control in this study.
Table 2. Clinicopathological data of the patients
All patients (N=82) T1N0 patients (N=38) TN patients (N=44)
Clinical variable N (%) N (%) N (%)
Age
≤ 52 43 (52.4) 20 (52.6) 23 (52.3)
> 52 39 (47.6) 18 (47.4) 21 (47.7)
Status
alive 32 (39.0) 15 (39.4) 17 (38.6)
alive, relapse 12 (14.6) 8 (21.1) 4 (9.1)
dead 17 (20.8) 6 (15.8) 11 (25.0)
dead, breast cancer 21 (25.6) 9 (23.7) 12 (27.3)
Histology
Ductal 69 (84.1) 38 (100) 31 (70.5)
Lobular 3 (3.8) 0 3 (6.8)
Other 10 (12.1) 0 10 (22.7)
Stage
in situ 2 (2.4) 0 2 (4.6)
I 56 (68.3) 38 (100) 18 (40.9)
II 18 (22.0) 0 18 (40.9)
III 6 (7.3) 0 6 (13.6)
Grade
1 11 (13.4) 9 (23.7) 2 (4.5)
2 29 (35.4) 22 (57.9) 7 (16.0)
3 40 (48.8) 7 (18.4) 33 (75.0)
Unknown 2 (2.4) 0 2 (4.5)
Estrogen receptor
positive 33 (40.2) 33 (86.9) 0
negative 48 (58.6) 4 (10.5) 44 (100)
Unknown 1 (1.2) 1 (2.6) 0
Progesterone receptor
positive 28 (34.2) 28 (73.7) 0
negative 53 (64.6) 9 (23.7) 44 (100)
Unknown 1 (1.2) 1 (2.6) 0

24
3.1.3 Cell lines
The cell lines used in this study were MDA-MB-453 (MDA) and SKOV-3 (SKOV). These cell
lines were previously known to carry the H1047R mutation of the PIK3CA gene (ATCC, 2014)
and were available as cell pellets stored at -80 °C. The MDA cell line DNA was used as a
positive control in this study.
3.1.5 Primary tumor samples
DNA extracted from primary tumor tissue was available from 22 samples in common with the
serum samples. The DNA was stored at – 80 °C in TE-buffer.
3.2 DNA extraction
3.2.1 Circulating nucleic acid extraction
CNAs were isolated from serum using the QIAamp Circulating Nucleic Acid kit (QIAGEN,
Hilden, Germany) according to manufacturer’s instructions.
Before extraction the CNA-kit buffers were prepared according to the manufacturer’s
instructions. All buffers were provided by the manufacturer. Also the equipment required for
extraction was set up. The equipment included a vacuum pump (600 mbar), a vacuum manifold
compatible with QIAamp Mini columns provided by the manufacturer and a connecting waste
system. All other equipment used can be viewed from the manufacturer’s manual.
Prior to extraction serum samples were thawed at room temperature and 1 ml was taken for
extraction. Each 1 ml of sample was first centrifuged at 2000 g for 10 min at room temperature
(RT). After this the extraction was done from the supernatant. This was done to rid the sample
of possible white cell debris which is associated with DNA extraction from serum
(Schwarzenbach, 2013).
Extracted DNA was eluted with 50 µl of AVE buffer and stored at -20 °C.
3.2.2 Extraction of MDA-MB-453 cell line DNA
A batch of MDA-MB-453 cells was stored at -80 °C. The amount of cells was not known and
so the amounts of reagents used were approximated.

25
On the first day 0.5 ml of lysis buffer, 50 µl of 10 % sodium dodecyl sulfate and 10 µl of
proteinase K were added to the cell pellet and mixed gently by turning the tube. The tube was
incubated overnight in 37 °C.
On the next day the DNA was extracted and precipitated. First 250 µl of phenol and 250 µl of
chloroform was added to the Eppendorf tube. The suspension was mixed by turning the tube
upside-down for approximately 15 min on a mechanical mixer. The tube was then centrifuged
for 15 min at RT to separate the phases. The topmost phase was collected and the same steps
starting the extraction protocol were carried out. Again the topmost phase was collected and the
extraction repeated, however this time with only chloroform 500 µl.
Next the DNA was precipitated by adding 1/10 of the volume (50 µl) of 3M sodium acetate and
2 volumes (1 ml) of - 20 °C absolute ethanol and then mixed by turning. The now visible DNA
strand was moved to a clean tube and washed with 500 µl of 70 % ethanol by turning the tube.
To dry the DNA the tube was centrifuged twice for approximately 2 min at RT with removing
the supernatant after the first centrifugation and then incubated with the lid open for 15 min in
a fume hood. Then the DNA precipitate was dissolved into TE-buffer. TE-buffer was added
several times and incubated at RT until the DNA had dissolved. All in all 450 µl of TE-buffer
was added with 24 h of incubation including 4 h on a shaker for the DNA to be dissolved.
3.3 Quantification of serum and MDA-MB-453 DNA
Serum DNA samples and MDA DNA were quantified using Qubit fluorometer (Thermo Fisher
Scientific Inc., Waltham, MA, USA). The samples were prepared according to the
manufacturer’s instructions. Serum DNA samples were diluted into Qubit mastermix with the
ratio of 190 µl of mastermix and 10 µl of sample DNA and MDA DNA samples with the ratio
of 199 µl of mastermix and 1 µl of sample DNA. Qubit double stranded DNA BR assay reagent
containing a fluorescent marker was added. The Qubit fluorometer determines DNA
concentration by measuring fluorescence emitted by the double stranded DNA. The Qubit
fluorometer is very sensitive minimizing the chance to detect contaminants, as it does not detect
single stranded nucleic acids, giving a high quality DNA concentration.
3.4 Competitive Allele-Specific TaqMan PCR
The TaqMan Mutation Assay uses Competitive Allele-Specific TaqMan PCR (castPCR)
technology as a tool to detect rare mutations in a pool of normal DNA. This is an assay which

26
can be applied to the detection of tumor-originated DNA from normal DNA in a liquid biopsy
sample by screening for and amplifying cancer related mutations. It makes it possible to identify
1 mutant allele in a pool of 1000 wild-type alleles, meaning a sensitivity of 0.1 %. CastPCR is
a mutation detection assay in which an allele-specific primer detects a mutant allele and an
allele-specific blocker suppresses the wild-type allele thus ensuring amplification of the target
and blocking non-specific amplification. A locus-specific TaqMan probe, containing a
fluorescent marker, binds to both mutant and wild-type DNA of the target gene. The mutation
is amplified by a mutation specific primer and a fluorescent signal is detected during a PCR
run. The blocker stops the primer from attaching to wild-type DNA ensuring amplification of
the mutant allele and no amplification of the wild-type allele. In this study the TaqMan mutation
detection assay for the H1047R mutation of the PIK3CA gene was used (ID: Hs00000831_mu).
(Thermo Fisher Scientific Inc. Waltham, MA, USA, 2015)
A reference mutation assay can be used alongside the castPCR mutation assay. The reference
genome assay detects the gene of interest by using a locus-specific primer which attaches itself
to both mutant and wild-type allele containing genes. This primer amplifies a “normal” part of
the gene and can be used to ensure the presence of the gene. The reference genome assay used
in this study was the PIK3CA_rf kit (ID: Hs00001025_rf).
An internal positive control (IPC) is used in the assays to differentiate a target negative result
from a PCR failure.
3.4.1 The castPCR protocol
After sample serum DNA was extracted, samples were run with castPCR. Samples were diluted
in nuclease-free water for each castPCR run so that all samples on the same plate in the same
PCR run were of equal concentration, with the exception of one run in which DNA was not
diluted. The sample amounts per well varied between 1 ng and 20 ng for different runs. The
manufacturer recommends 20 ng, but because of low DNA concentrations in our samples we
used less. The manufacturer states that 1 ng of sample may be used, but the sensitivity is much
lower as they guarantee a sensitivity of only 1.0 % when 2 ng of sample is used. The castPCR
protocol included preparation of a supermix to which sample and assay would be added (Table
3). The reaction volume used for one sample was 20 µl, containing 2 or 4 µl of sample and 2 µl
of either mutation assay or reference genome assay, run on a 96-well plate. Positive and
negative controls were used in all runs as well as a non-template control. Every sample was run
twice on the same plate, once with the mutation assay and once with reference genome assay.

27
Both sensitivity tests and runs with study samples were done. The manufacturer recommends
using 40 cycles in the thermo cycling program. In some runs 50 cycles were used due to low
DNA concentrations in our samples. The thermocycling program and conditions used can be
viewed in Table 4.
Table 3. Contents of the PCR supermix used in castPCR analysis
castPCRsupermix 1x (reaction volume for one sample 20 µl)
TaqMan Genotyping Master Mix, 2x 10 µl
50 X Exogenous IPC Template DNA 0,4 µl
10X Exogenous IPC Mix 2,0 µl
Nuclease free water 1,6 µl
Prepared gDNA (added separately to each well) 2-4,0 µl
Total 18 µl
Table 4.Thermocycling PCR program
Stage Temperature Time
(mm:ss)
Cycles
1 95 10:00 1
2 92 00:15 5
58 01:00
3 92 00:15 40-50
60 01:00
3.4.2 Workflow
The workflow of this project can be visualized in three separate charts, with DNA extraction
and reference genome assays in Figure 3 and castPCR assays in Figure 4. DNA was extracted
from all 82 samples and quantified. The reference genome assay was tested for its sensitivity
using a sample of wild-type DNA, which was then used as a negative control in following
mutation detection castPCR runs.

28
Figure 3. Workflow of serum DNA extraction and castPCR PIK3CA reference genome assay.
Figure 4. Workflow of castPCR, containing details of each run. Sensitivity tests with diluted frequency have
been done with mutation frequencies of 10 %, 5 %, 2.5 %, 1 %, 0.1 % and 0.01 %

29
3.5 Statistical analysis
Statistical analysis was performed with the SPSS program version 21.0 (IBM Co., Armonk,
NY, USA). Samples were distributed into groups based on cfDNA concentration including five
different types of distribution: median, two types of percentiles, extremities and high
concentration against the rest. These distributions have been clarified in Figure 5. The groups
were then compared to see whether they had significant difference according to important
clinical variables including cancer histology, stage, grade, receptor status and relapse. Chi-
square analysis and Mann-Whitney two-sample rank-test were used. The clinical variables
found significantly different (relapse and receptor status) between sample groups in chi-square
analysis were used as covariates in the Mann-Whitney analysis. The nodal status and the tumor
size classification of patients has been omitted due to patients being chosen with certain criteria
according to these variables and the distribution is therefore not random. Survival rates were
analyzed using Kaplan-Meier and Cox regression survival analyses. Multiple test correction
was not done.
Figure 5. Clarification of samples
distributed into groups according to
cfDNA concentration used in statistical
analysis.

30
4. RESULTS
4.1 Quantification of cell-free DNA from patient serum samples
Cell-free DNA was extracted from patient serum samples with the QIAamp CNA-kit
(QIAGEN, Hilden, Germany). Detectable levels of cfDNA were obtained from 56 out of 82
patient serum samples (68 %). The castPCR analysis requires a reaction volume of 20 µl which
includes a maximum of 4 µl of sample. Only those samples from which the manufacturers
recommended minimum of 1 ng of sample could be used in the following PCR assay were
further analyzed. This means that a cfDNA sample could be used only if its concentration was
higher than or equal to 0.25 ng/µl. This dropped out three additional samples making the total
amount of serum cfDNA samples that went into castPCR PIK3CA-mutation analysis 53. In
Table 5 measured DNA concentrations from all samples can be seen. The 26 samples that are
shown to have a concentration of 0 ng/µl do not necessarily have no DNA, the instrument used
to measure the concentration merely was not sensitive enough to detect such small amounts of
DNA. These samples would not have been able to be used in further analysis even if the
instrument would have been sensitive enough.

31
Table 5. A table showing the measured cfDNA concentrations from each sample in ng/µl. cfDNA
levels were measure with Qubit. PNRO = patient number, cfDNA= cell-free DNA
PNRO cfDNA ng/µl PNRO cfDNA ng/µl PNRO cfDNA ng/µl
75 0.354 720 0.238 1618 0.928
78 1.11 732 0 1629 0
106 0 735 0.536 1634 0.27
124 0 762 0.25 1653 0.286
130 1.29 839 0 1670 0
134 1.03 867 0.412 1672 0
205 0.68 910 0.48 1677 0
213 1.99 916 0 1679 0
313 0.6 938 0.574 1680 0.508
316 0.606 940 0 1685 0.426
317 0.786 945 0.594 1707 0.532
372 0 975 0 1735 0.206
389 0.97 985 0.256 1746 0
395 0.254 997 1.52 1750 0.61
416 0.244 1004 0.586 1751 1.91
435 0.774 1021 0.594 1763 0
458 1.4 1029 0 1788 0
462 0.896 1280 0.54 1798 0.276
467 1.67 1390 0 1801 0.914
558 0 1414 0 1810 0
565 0.77 1472 0.466 1814 1.41
566 0.254 1496 1.36 1822 0.426
613 0 1497 0 1857 0.464
616 2.12 1505 0.75 1863 0.266
622 0.292 1513 0.812 1868 0.928
670 0 1575 0 1904 0.594
699 1.97 1596 0
706 0.23 1602 0.388

32
4.2 Analysis of tumor-related cell-free DNA using PIK3CA mutation specific cast-
PCR
4.2.1 The reference genome assay has high sensitivity at all tested concentrations
The castPCR assay comes in two parts: the reference genome assay which amplifies a portion
of the gene in question which does not include the mutation and the PIK3CA mutation assay
which amplifies only the mutation. The first thing that was done was to test the sensitivity of
the reference genome assay with wild-type serum by making a dilution series of the sample.
The sample was diluted to concentrations of 10 ng/µl, 5 ng/µl, 2.5 ng/µl, 1.25 ng/µl and 0.625
ng/µl. After addition of 2 µl of each dilution per well the sample amounts in the assay were 20
ng, 10 ng, 5 ng, 2.5 ng and 1.25 ng respectively. In Figure 6 the amplification curves of this
castPCR run are visualized. Ct values increase as the DNA concentration decreases. One well
of 20 ng of wild-type serum sample was also run with the mutation assay and as expected this
sample was not amplified (Figure 6).
Figure 6. Amplification curves of castPCR run testing the sensitivity of the reference genome
assay. Different amounts (20 ng, 10 ng, 5 ng, 2.5 ng and 1.25 ng) of cell-free DNA extracted from
healthy patient serum were added to each well. Each curve is marked according to the amount of
sample in that well. One well was with 20 ng of healthy cfDNA was run with the mutation assay,
marked here as 775mu. The unmarked curves below the threshold constitute the IPC from samples.

33
4.2.2 MDA-MB-453 is a positive control for the H1047R mutation
The next thing that was needed was a positive control. Two available cell lines, MDA-MB-453
(MDA) and SKOV-3 (SKOV), were known to harbor the H1047R mutation that was used in
the PIK3CA mutation assay (ATCC, 2014) and a PCR run was performed with 20 ng of DNA
extracted from these two cell lines. In Figure 7 the results from the castPCR run can be
visualized. Both MDA and SKOV were amplified by the mutation assay, MDA with a Ct value
of 27.97 and SKOV 28.64. The cell line MDA was chosen to be used as a positive control for
following PCR analyses.
Figure 7. Amplification curves of castPCR run using the PIK3CA mutation assay
with 20 ng of DNA extracted from the cell lines MDA-MB-453 (MDA) and SKOV-
3 (SKOV). In the figure each amplification curve is marked according to the cell line.
4.2.3 The PIK3CA mutation assay has high sensitivity when mutation frequency is 100 %
The sensitivity of the castPCR mutation analysis was examined by making a similar dilution
series as with the wild-type serum sample. DNA extracted from MDA was diluted to 10 ng/µl,
5 ng/µl, 2.5 ng/µl, 1.25 ng/µl and 0.625 ng/µl. After addition of 2 µl of each dilution per well,

34
the sample amounts in the assay were 20 ng, 10 ng, 5 ng, 2.5 ng and 1.25 ng respectively. Figure
8 shows the results of the amplification. The amplification curve of the 5 ng sample is not seen
and is thought to be due to a possible pipetting error.
Figure 8. Amplification curves of castPCR run testing the sensitivity of the
PIK3CA mutation assay. Different amounts (20 ng, 10 ng, 5 ng, 2.5 ng and 1.25
ng) of DNA extracted from the MDA-MB-453 (MDA) cell line were added to
each well. Each curve is marked according to the amount of sample in that well.
The curves below the threshold constitute the IPC from samples as well as the
NTC sample.
4.2.4 Dilution of the mutation frequency lowers sensitivity of the PIK3CA mutation assay
The H1047R mutation frequency in the MDA cell line is assumed to be 100 %. This does not
represent the situation in real life patient cases where tumor DNA is mixed with normal DNA
and the frequency can in fact be very low. Thus the mutation frequency of DNA extracted from
the MDA cell line was diluted using wild-type DNA. This was done twice, with the

35
manufacturers recommended 20 ng of sample and with our minimum of 1 ng of sample per
assay. According to the manufacturer the PIK3CA mutation assay should be able to detect a
mutation frequency as low as 0.1 % when 20 ng of sample DNA is used. The created frequencies
were 10 %, 5 %, 1 %, 0.5 %, 0.1 % and 0.01 % for the assays with both 20 ng and 1 ng. The
results of these PCR runs can be seen in Figure 9. In both figures (9A and 9B) the dilutions with
the frequencies 0.5 % - 10 % can be seen to have amplification curves above the threshold,
meaning that the PIK3CA mutation with these frequencies have been amplified in the PCR
reaction. However, the Ct values are quite high. The manufacturer recommends using 40 cycles
in the castPCR reaction, which we have changed to 50 due to low DNA concentrations. In
Figure 9A the Ct value for the sample with a mutation frequency of 0.5 % is 40, which is
equivalent to the amount of cycles recommended by the manufacturer. If the cycle amount
would not have been increased to 50, this amplification curve would not be seen at all. When
using the sample minimum of 1 ng, all samples have Ct values that are higher than 40, meaning
that if 40 cycles would have been used in the PCR the whole amplification plot would show
negative (Figure 9B). These amplifications can however be taken to be positive due to no
amplification in the negative control. In Figure 9A the frequencies 0.1 % and 0.01 % fall
beneath the negative control curve and so cannot be taken to be valid. These respective
frequencies from the assay using 1 ng have not been amplified at all (Figure 9B). The castPCR
PIK3CA mutation assay was not found to be sensitive enough to locate and amplify the H1047R
mutation with the frequency of 0.1 % or lower when either 20 ng or 1 ng of sample was used.

36
Figure 9. Amplification curves of castPCR run to test the sensitivity of the PIK3CA mutation assay when the
mutation frequency is low. DNA extracted from the MDA-MB-453 cell line was diluted into DNA extracted
from healthy serum to frequencies of 10 %, 5 %, 1 %, 0.5 %, 0.1 % and 0.01 %. In A) 20 ng of DNA and in B)
1 ng of DNA was used. Each curve is marked by its according frequency. The unmarked curves below the
threshold constitute the IPC from samples. Positive control = POS.CTRL, negative control = NEG.CTRL.
4.2.5 Serum cell-free DNA samples are mutation negative when using PIK3CA mutation-
specific castPCR
After sensitivity testing the actual study samples were run with the castPCR PIK3CA-mutation
assay.
Triple negative serum DNA samples are negative for the H1047R mutation
Triple negative breast cancer was one criteria for which certain patient samples were chosen.
The results from castPCR analysis of these samples can be visualized in Figure 10. The amount
of sample used per well was 1 ng. Only the positive control has been amplified when all samples
show no amplification and so a negative result. In Figure 10A the amplification plot shows
curves of samples with the positive and negative controls and Figure 10B the same plot
excluding the controls. The controls have been excluded in order for sample curves to be

37
visualized more clearly and to see that there is no amplification. Figure 10B clearly visualizes
no amplification in the study samples. Triple negative serum cfDNA samples from which 5 ng
of sample could be obtained for the assay were re-run to see whether increasing the amount of
sample would have any effect on the results. This meant that when adding the maximum of 4
µl of sample per well samples which had 1.25 ng/µl or more DNA could be re-run with 5 ng.
The amplification plot of the re-run shows no amplification of samples, only the positive control
has been amplified (Figure 11). The only other curve which has just been starting to rise at the
end of the PCR program with a Ct value of 42.08 is the negative control.
Figure 10. Amplification curves of castPCR run analyzing triple negative breast cancer samples with
PIK3CAmutation assay. 1 ng of sample was used in each analysis and 40 cycles was used. A) Amplification curves
including the positive and negative controls and B) zooming in on the red circle with controls excluded (NB.
fluorescence scale differs between A and B). Positive control = POS.CTRL

38
Figure 11. Amplification curves of castPCR run analyzing triple negative breast
cancer samples with PIK3CA mutation assay. 5 ng of sample was used per assay.
Positive control = POS.CTRL, Negative control = NEG.CTRL
T1N0 serum DNA samples are negative for the H1047R mutation
In Figure 12 the amplification plots from a castPCR run with 1 ng of study samples that had the
criteria of being T1N0 can be visualized. The plots indicate one possible positive result; sample
number 1857 has begun to amplify with a Ct value of 47.86. Figure 12A shows the result
including the positive and negative controls and Figure 12B the result excluding them. The
controls have been excluded from Figure 12B to make it easier to visualize the result. All other
samples except 1857 remain unamplified beneath the threshold along with the negative control
and NTC (Figure 12B). This possible positive result must be taken under consideration due to
the fact that it has such a high Ct value. The manufacturer recommends using 40 cycles in the
castPCR assay and 50 cycles have been used here. If only 40 cycles would have been used this
result would not show in the amplification plot. The sample was re-run at a later time.

39
Figure 12. Amplification curves of castPCR run analyzing T1N0 study samples with PIK3CA mutation assay.
1 ng of sample was used for each analysis. A) Amplification curves with positive and negative controls included
and B) zooming in on red circle in A with controls excluded. Positive control = POS.CTRL, 1857 = sample number.
Nine patients found mutation positive when assessing mutation status from primary tumor
DNA
Next the mutation status of the patients’ primary tumors were evaluated. Out of the 53 serum
cfDNA samples that we were able to run with castPCR, 22 had available primary tumor tissue
DNA samples. The primary tumor samples were run with castPCR PIK3CA mutation assay
with the manufacturers recommended 20 ng of sample per assay. The amplification curves from
this castPCR run can be visualized in Figure 13. In the figure the positive control MDA can be
seen to have the lowest Ct value, after which nine, possibly 10 samples are amplified before the
negative control. This gives us nine patients who harbor the H1047R mutation of the PIK3CA
gene. When examining the 9 patients who had PIK3CA positive primary tumors, 5 have either
died of causes related to breast cancer or gone through relapse. 7 out of the 9 have triple negative
breast cancer and 3 belong to the high cfDNA concentration group (75th percentile).

40
Figure 13. Amplification curves of castPCR run analyzing primary tumor tissue samples with
PIK3CA mutation assay. 20 ng of primary tumor DNA was used per sample. Samples are marked
according to their sample number. Positive control = POS.CTRL, negative control = NEG.CTRL.
Serum DNA samples are negative for the H1047R mutation when re-run with maximum
sample concentration of cell-free DNA in castPCR analysis
After the castPCR run with primary tumor DNA samples, those patient serum cfDNA samples
that had a positive result in the primary tumor sample were re-run with the PIK3CA mutation
assay. Eight samples out of the nine positive results had serum cfDNA concentrations over 0.25
ng/µl and could be run again with highest sample amounts possible. The samples that were re-
run were 467, 1618, 1801, 75, 910, 1685, 1868 and 1904. Also the possible positive, sample
1857 from a previous castPCR PIK3CA mutation assay run was re-run on the same plate with
maximum sample amount. Maximum sample amount means addition of 4 µl to each well of the
original concentration obtained from cfDNA extraction. Samples contained amounts from 1.42-

41
6.68 ng in this run. The original cfDNA concentrations can be viewed in Table 5. As the results
show in Figure 14, none of the samples run showed a positive amplification. Even the sample
1857 which previously showed a possible positive result (Figure 12) was clearly negative here.
Figure 14A shows the amplification curves including the controls whereas Figure 14B excludes
the controls and distinctly shows no amplification of study samples.
Figure 14. Amplification curves of castPCR run analysing serum cfDNA samples of patients, who had mutation
positive primary tumor DNA, with PIK3CA mutation assay. Also includes sample 1857 from a previous run. All
samples were run with their maximum sample concentration that could be utilized. A) Amplification curves
including positive and negative controls and B) zooming in on the red circle with controls excluded (NB.
fluorescence scale differs between A and B). POS.CTRL = positive control, NEG.CTRL = negative control.
4.2.6 Association between patients’ clinicopathological characteristics and cell-free DNA
concentrations obtained from extraction
Statistical analysis was performed using cfDNA concentrations to analyze distribution
significance and survival. Distributions used in statistical analysis can be viewed in Figure 5.
cfDNA concentrations were distributed into groups by several types of distributions. The data
was then analyzed by chi-square analysis under certain clinical variables such as histology
status, tumor stage, tumor grade, receptor status and relapse. In Table 6 the cfDNA

42
concentrations have been divided by median distribution, where the median divides the data set
into low or high expression (Figure 5A). With median distribution a significant difference can
be seen only in estrogen/progesterone receptor status. The results of this analysis show that it
is more likely to belong to the high cfDNA expression group when estrogen receptor (p = 0.003)
or progesterone receptor (p = 0.004) positive (Table 6). The triple negative status also supports
this result. Being triple negative makes it more likely to express lower concentrations of cfDNA,
and not having triple negative breast cancer makes it more likely to express higher cfDNA
concentrations (p = 0.023).
Table 6. The median distribution (figure 5A) of the patients (n = 81-82) in regards to clinical variables relevant
to this study. A chi-square test shows the statistical significance of these variables according to serum DNA
concentration. High expression is cfDNA concentration above the median and low expression below the
median. The significance value is p ≤ 0.05*. ns = not significant
Distribution Median distribution of DNA
Clinical variable Low expression High expression p-value
Histology ns.
Ductal 31 35
Lobular 2 1
Other 7 3
Stage ns.
in situ 1 1
I 29 27
II 9 9
III 2 4
Grade ns.
1 5 6
2 11 18
3 24 16
Estrogen receptor 0,033*
positive 12 21
negative 29 19
Progesterone receptor 0,004*
positive 8 20
negative 33 20
Triple negative 0,023*
yes 27 17
no 14 24
Relapse ns.
no 26 21
yes 15 20

43
In Table 7 the cfDNA concentration data is divided into three percentiles: the 25th percentile,
the 50th percentile and the 75th percentile (Figure 5B). When changing the distribution this way
the tumor grade becomes significant, showing a majority of patients having a less differentiated
tumor with cfDNA concentrations in the 50th and 75th percentiles. The progesterone receptor
status is also significant, again indicating a higher cfDNA concentration when the patient is
progesterone receptor positive (p = 0.012).
Table 7. Distribution of the patients (n = 81-82) within three percentile classes (figure 5B) in regards to clinical
variables relevant to this study A Chi-square test shows the statistical significance of these variables under this
distribution according to serum cfDNA concentration. The significance value is p ≤ 0.05*. ns = not significant
Distribution Distribution of DNA in three percentiles
Clinical variable 25th 50th 75th p-value
Histology ns.
Ductal 21 27 18
Lobular 1 2 0
Other 3 6 1
Stage ns.
in situ 1 1 0
I 16 26 14
II 7 7 4
III 2 2 2
Grade 0.048*
1 2 8 1
2 7 10 12
3 16 17 7
Estrogen receptor ns. (0.078)
positive 6 17 10
negative 20 19 9
Progesterone receptor 0.012*
positive 4 13 11
negative 22 23 8
Triple negative ns.
yes 18 19 7
no 8 17 13
Relapse ns.
no 18 21 8
yes 8 15 12
Table 8 shows the results from the chi-square analysis when cfDNA concentrations are divided
into four percentile groups where each group represents 25 % of the whole dataset. Each group
is marked according to the percentage values between which its data falls when values are in
ascending order (Figure 5C). With this distribution, only the progesterone receptor status is

44
significantly different between groups, showing that with higher cfDNA concentrations it is
more likely to be progesterone receptor positive (p = 0.02; Table 8).
Table 8. Distribution of the patients (n = 81-82) within four percentile classes (figure 5C) in regards to clinical
variables relevant to this study. A chi-square test shows the statistical significance of these variables according
to serum cfDNA concentration. The significance value is p ≤ 0.05*. ns = not significant
Distribution Distribution of DNA in four percentiles
Clinical variable 0-25 25-50 50-75 75-100 p-value
Histology ns.
Ductal 21 10 17 18
Lobular 1 1 1 0
Other 3 4 2 1
Stage ns.
in situ 1 0 1 0
I 16 13 13 14
II 7 2 5 4
III 2 0 2 2
Grade ns.
1 2 3 5 1
2 7 4 6 12
3 16 8 9 7
Estrogen receptor ns.
positive 6 6 11 10
negative 20 9 10 9
Progesterone receptor 0.02*
positive 4 4 9 11
negative 22 11 12 8
Triple negative ns.
yes 18 9 10 7
no 8 6 11 13
Relapse ns.
no 18 8 13 8
yes 8 7 8 12
The next distribution that is shown here is distribution of the patient cfDNA concentrations into
extremities, omitting the middle set of values. Here the values are distributed into the 25th
percentile and the 75th percentile and excluding all middle values (Figure 5D). This distribution
was done to try to analyze cfDNA concentrations which are clearly high and low without middle
values. This distribution shows that patients with high expression of cfDNA tend to have more
relapse than patients with low cfDNA concentrations (p = 0.047). Also the receptor status is
significant. Positive estrogen receptor status (p = 0.041) and progesterone receptor status (p =
0.003) and not having triple negative cancer (p = 0.021) indicates higher cfDNA concentrations.
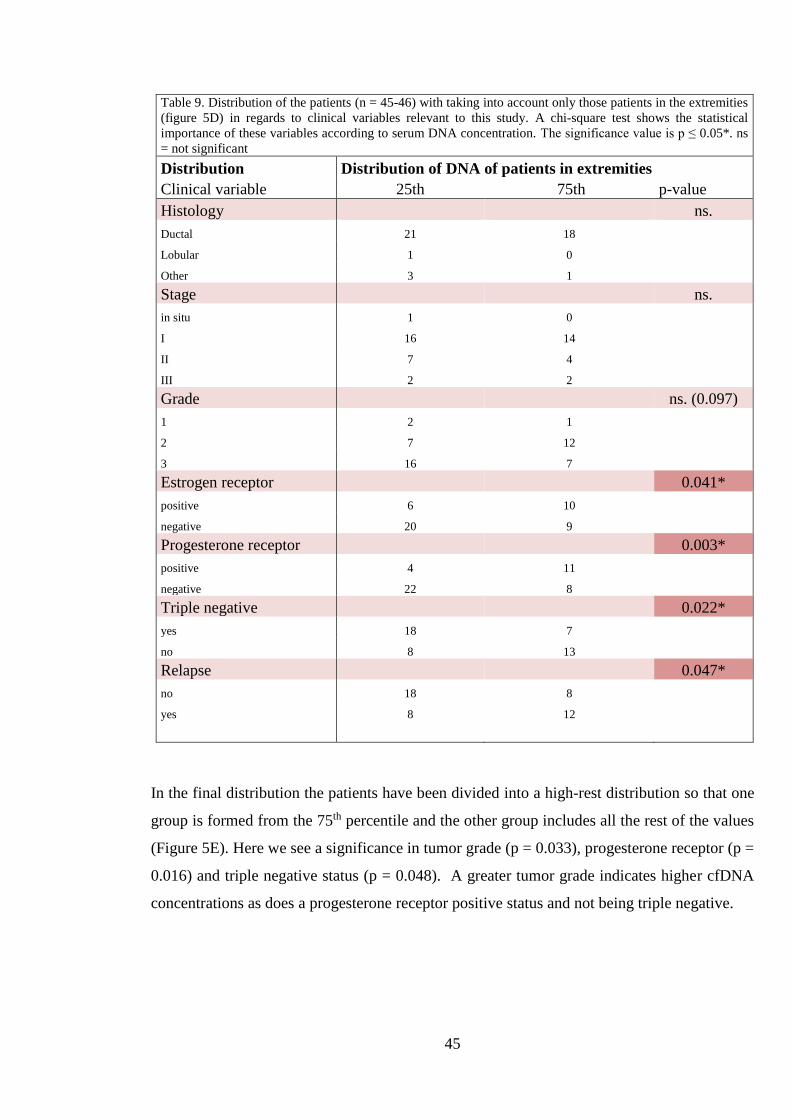
45
Table 9. Distribution of the patients (n = 45-46) with taking into account only those patients in the extremities
(figure 5D) in regards to clinical variables relevant to this study. A chi-square test shows the statistical
importance of these variables according to serum DNA concentration. The significance value is p ≤ 0.05*. ns
= not significant
Distribution Distribution of DNA of patients in extremities
Clinical variable 25th 75th p-value
Histology ns.
Ductal 21 18
Lobular 1 0
Other 3 1
Stage ns.
in situ 1 0
I 16 14
II 7 4
III 2 2
Grade ns. (0.097)
1 2 1
2 7 12
3 16 7
Estrogen receptor 0.041*
positive 6 10
negative 20 9
Progesterone receptor 0.003*
positive 4 11
negative 22 8
Triple negative 0.022*
yes 18 7
no 8 13
Relapse 0.047*
no 18 8
yes 8 12
In the final distribution the patients have been divided into a high-rest distribution so that one
group is formed from the 75th percentile and the other group includes all the rest of the values
(Figure 5E). Here we see a significance in tumor grade (p = 0.033), progesterone receptor (p =
0.016) and triple negative status (p = 0.048). A greater tumor grade indicates higher cfDNA
concentrations as does a progesterone receptor positive status and not being triple negative.

46
Table 10. High-rest distribution (figure 5E) of the patients (n = 81-82) in regards to clinical variables relevant
to this study. A chi-square test shows the statistical significance of these variables according to serum DNA
concentration. The significance value is p ≤ 0.05*. ns = not significant
Distribution High - rest distribution of DNA
Clinical variable < 75th 75th p-value
Histology ns.
Ductal 48 18
Lobular 3 0
Other 9 1
Stage ns.
in situ 2 0
I 42 14
II 14 4
III 4 2
Grade 0.033*
1 10 1
2 17 12
3 33 7
Estrogen receptor ns.
positive 23 10
negative 39 9
Progesterone receptor 0.016*
positive 17 11
negative 45 8
Triple negative 0.048*
yes 37 7
no 25 13
Relapse ns.
no 26 6
yes 9 3
The Mann-Whitney two-sample rank-sum test was performed between patient samples divided
according to five different distributions used in Chi-Square test above and tested against clinical
variables such as relapse and receptor status. Table 11 shows the significant results obtained
from the analysis. All distributions except high-rest distribution show significance when taking
into account the clinical variables estrogen receptor, progesterone receptor and triple negative
status. Patients are less likely to be triple negative and more likely to express at least one
hormone receptor when cfDNA concentrations are higher. When patients are distributed to
extremities also relapse is significant (p = 0.05) showing a greater tendency to relapse when
having high cfDNA concentrations.

47
Table 11. The p-values of the Mann-Whitney U statistical test according to the serum DNA levels showing only
those clinical variables that showed a significant result. The significance level p ≤ 0.05*. ns = not significant.
Confidence interval 0.95.
p-value
Distribution Median Three percentiles Four percentiles Extremities
Clinical variable low high 25th 50th 75th 25th 25-50 50-75 75th 25th 75th
Estrogen
receptor 0.034* 0.035* 0.026* 0.043*
positive 12 21 6 17 10 6 6 11 10 6 10
negative 29 19 20 19 9 20 9 10 9 20 9
Progesterone
receptor 0.004* 0.003* 0.002* 0.003*
positive 8 20 4 13 11 4 4 9 11 4 11
negative 33 20 22 23 8 22 11 12 8 22 8
Triple negative
status 0.016* 0.02* 0.012* 0.022*
yes 27 17 18 19 7 18 9 10 7 18 7
no 14 24 8 17 13 8 6 11 13 8 13
Relapse ns. ns. ns. 0.05*
no 26 21 18 21 8 18 8 13 8 18 8
yes 15 20 8 15 12 8 7 8 12 8 12
Patients with high cell-free DNA concentrations have a decline in survival rate and are more
likely to relapse than patients with low cell-free DNA concentrations
Survival was evaluated using the Kaplan-Meier analysis. Survival rates were analyzed in all
distribution groups of which two showed significance: when data was distributed to extremities
and when data was distributed into a high-rest distribution (distributions Figure 5D-E) Analyses
according to three distributions are shown in Figure 15, including the two mentioned above as
well as distribution into three percentile groups (Figure 5B). When distributing into extremities
the results show a significant decline of survival rate in patients with high serum DNA
concentrations compared to patients with low serum DNA concentration when taking either
relapse as an end point (p = 0.033; figure 15B) or death by breast cancer as an end-point (p =
0.05; Figure 15A). The same is seen with high-rest distribution with either relapse (p = 0.023,
Figure 15D) or death by breast cancer as an end-point (p = 0.024; Figure 15E). A similar trend
is evident with cfDNA concentration divided into three percentiles and having relapse as an
end-point, but the result is not significant (Figure 15 C). Patients with higher concentrations of
cfDNA have clear decline of overall survival to breast cancer and are more likely to suffer
relapse.

48
Figure 15. Kaplan-Meier survival analysis according to three different distributions of
cfDNA concentrations with A) follow-up survival in extremities (p = 0.05), B) relapse free
survival in extremities (p = 0.033), C) relapse-free survival in three percentile groups (ns),
D) relapse-free survival in high-rest distribution (p = 0.023) and E) follow-up survival in
high-rest distribution (p = 0.024) Significance level p ≤ 0.05.

49
Patients with high cell-free DNA concentrations have a decline in survival rate compared to
those with low cell-free DNA concentrations in multivariate survival analysis
Logistic regression analysis was done to compare survival of patients under criteria of the
covariates age, nodal status and estrogen/progesterone receptor status with death by breast
cancer used as an end-point. Regression analysis was done under three distributions, with
distribution into extremities and high-rest distribution. Survival was also evaluated with
distribution into TN and T1N0 patients. The results of the cox regression analysis can be
visualized in Figure 16. In Figure 16A the cfDNA data has been distributed into extremities,
with DNA low indicating the 25th percentile and DNA high the 75th percentile. The analysis
showed a decline in survival rate of those patients with higher concentrations of cfDNA, but
the result was not significant. In Figure 16B the analysis has been performed under high-rest
distribution. When changing the distribution this way the survival analysis becomes significant
(p = 0.041) showing a clear decline of survival of patients with high concentrations of cfDNA.
There was no significance found in survival between TN and T1N0 groups (Figure 16C).

50
Figure 16. Cox regression analysis from cfDNA
concentration including the covariates age, nodal
status, PR status and ER status where death by breast
cancer is used as an end-point. A) According to
distribution to extremities, ns. = not significant, B)
according to high-rest distribution (p = 0.041) and C)
according to distribution into TN and T1N0 groups
(ns.). Significance level p ≤ 0.05.
5. DISCUSSION
This study demonstrates the importance of exploring circulating cell-free nucleic acids and their
role in cancer. The results indicate patients with high concentrations of cfDNA to be more prone
to relapse. Also a multivariate survival analysis shows a trend of higher mortality in patients
with higher cfDNA concentrations. By examining the cfDNA status of cancer patients it could
be possible to specify which patients are more susceptible to recurrence. The examination of
51
cfDNA needs to go beyond concentration and focus on specific characteristics of possible tumor
DNA in the blood. We attempted to find ctDNA by a castPCR assay which works by amplifying
single point mutations from DNA extracted from blood serum or plasma. The method is very
sensitive in finding mutations, the problem is the ability of studying only one mutation per assay
which may not be practical in a clinical setting. Here we were not able to find the H1047R
mutation from cfDNA samples of 82 breast cancer patients.
5.1 Low tumor burden and prolonged storage of serum may account for lower
cfDNA concentration
The patient material available for use contained samples from nearly all breast cancer patients
in Kuopio university hospital during the years 1990-1995 and have been very thoroughly
followed up on. This gave us the ability to basically take our pick. The patient samples used
were all over 15 years old with some as old as 25 years, which was an advantage as well as a
disadvantage. The advantage was that the outcome of these patient cases were known and this
knowledge could be used when choosing patient samples for the study as well as giving an
initial reason for this study. Samples that were of interest were patients who had a good
prognosis at the time of their diagnosis, but the disease progressed in an opposite way from that
which was predicted. The rest of the samples were chosen for their sole characteristic of being
triple negative samples, which are interesting due to the limited treatment possibilities with this
particular type of cancer, as they have no receptors that can be targeted and are thus usually
more lethal.
The most prominent disadvantage was the storage issue. DNA integrity is greatly decreased
with prolonged storage time (Xue et al., 2009; Sozzi et al., 2005). The samples were stored in -
80 °C. One study showed that already storage over 3 years degrades DNA in plasma (Sozzi et
al., 2005). This may be one reason for the low DNA concentration obtained from extraction
from the serum samples. Also due to the age of the samples it is not necessarily known whether
they have been thawed and used previously. Thawing and refreezing has been shown to also
degrade DNA (Xue et al., 2009).
Previous studies have stated that detectable amounts of cfDNA can be reliably found only from
patients with progressive disease and here our patient samples were from the time of diagnosis
when disease burden is likely to be much smaller (Dawson et al., 2013; Schwarzenbach et al.,
2011; Board et al., 2010; Anker et al., 1999). Schwarzenbach and colleagues (2011) did find
that they were able to distinguish between healthy patients and patients with breast cancer based

52
on cfDNA concentration, but could not show what stage the disease was in. However, Hashad
and colleagues (2012) found a significant difference in cfDNA levels between patients with
benign disease and those with malignant breast lesions (p < 0.001). Other researchers were able
to detect tumor derived cfDNA also in patients with early-stage breast cancer, not only late
malignant disease (Beaver et al., 2014; Bettegowda et al., 2014; Shaw and Stebbing, 2014).
Many researchers argue that serum is less suitable than plasma as a starting material for DNA
extraction due to contamination of wild-type DNA (Schwarzenbach, 2013; Benesova et al.,
2013) and the majority of studies have used plasma. Board and colleagues (2010) observed a
higher mutation detection rate of PIK3CA mutations in plasma than in serum and hypothesized
this to be due to lysis of white blood cells resulting in a higher background of healthy DNA.
Cell-free DNA is found in varying sizes, especially when tumor derived (Schwarzenbach et al.,
2011; Fleischhacker et al., 2011; Jahr et al., 2001), Qiagen columns used for elution of DNA
might lose the very smallest fragments (Xue et al. 2009).
In this study, detectable amounts of cfDNA were obtained from 56 out of 82 patients, with
concentrations ranging from 0.23 ng/µl to 2.12 ng/µl. Qubit was not able to detect DNA from
26 patient serum samples, which most likely indicates very low concentrations instead of no
concentration.
5.2 Detecting tumor-related genetic changes in cell-free DNA
Liquid biopsies and their possible clinical applications are a constantly rising topic with the
possibilities of cfDNA and its use in cancer diagnostics at its core. There are multiple techniques
to study the genetic make-up of cfDNA and these methods are continually developed, with
many researchers comparing several methods within studies. The most common approaches are
PCR techniques manufactured to find SNPs and mutations that would identify cfDNA
originated from a tumor. Digital PCR is one of the most popular techniques researchers today
use to analyze the genetics of cfDNA mainly for its high sensitivity. Digital PCR is more
sensitive and precise than quantitative real-time PCR, but also much more expensive (Reid et
al., 2015; Beaver et al., 2014). Reid and coworkers (2014) found droplet digital PCR to be more
robust and up to 200 times more sensitive than castPCR which manufacturers give a sensitivity
of 0.1 %. In this study we used castPCR to establish which patients were mutation positive by
amplifying a target point mutation and blocking unspecific amplification. castPCR is a
relatively less used method with only 11 publications using the technique found in Pubmed
(http://www.ncbi.nlm.nih.gov/pubmed, accessed: 11.04.2016). However qPCR has much more
range and can analyze hundreds of sequences per run. Other PCR techniques used are

53
BEAMing (beads, emulsion, amplification and magnetics) and Amplication-Refractory
Mutation System (ARMS-PCR). A problem with PCR methods may be low mutation frequency
with a high background of normal DNA that could hinder detection and amplification of
specific mutations.
Next-generation sequencing (NGS) tools have been developed to find every SNP in a gene
(Dempsey, 2013). Whole exome sequencing gives every exon of a gene, with all SNPs that it
harbors, and though the method is time consuming and requires some form of manual labor or
a written program to identify wanted mutations, it is quite efficient. Developments are being
made to continuously enhance the method. (Dawson et al., 2013; Banerji et al., 2012)
Sequencing methods are also yet not as sensitive as PCR methods and require larger amounts
of starting material (Diaz and Bardelli, 2014). However, strides have already been taken to
overcome these issues and it is more likely that NGS methods will be more valuable in the
clinical setting than methods for identifying single mutations. The challenge for both may be
determining which findings are important and what their significance is. Most of the studies
examined have used multiple methods together to achieve the most accurate result, most using
some form of sequencing with a PCR technique. After initial findings using sequencing, a
mutation considered significant may then be studied using PCR techniques.
The aim for researchers is to find a practical way to use cfDNA in a clinical setting to diagnose
and monitor cancer and advancing its usage into widespread practice (Bettegowda et al., 2014;
Sausen et al., 2014).
5.2.1 Competitive Allele-specific TaqMan PCR is sensitive and specific
The castPCR method was tested for its sensitivity in many different ways, starting with the
sensitivity of the reference genome assay. The results of a standard series dilution showed that
with smaller DNA concentrations there is also less amplification (Figure 6). Also the healthy
serum sample was not amplified when using the mutation assay, as it should not have. We were
able to use this healthy serum sample as a negative control.
Next the sensitivity of the PIK3CA mutation assay was tested with the positive control for
which the assumption was held that its DNA carries a mutation frequency of 100 %. The
mutation assay was able to amplify the positive control with as low as 1.5 ng of sample (Figure
8).
The positive control was then diluted into wild-type DNA, thus diluting the mutation frequency.
The manufacturer gives a guarantee that the assay can detect a mutation frequency as low as

54
0.1 %. When 20 ng of sample was used, the curves rose nicely up to 0.5 % after which the
negative control could be seen and below this the amplification curves of samples with mutation
frequencies of 0.1 % and 0.01 % (Figure 9A). The fact that the negative control has been
amplified indicates possible inaccuracies in all samples in this run and for further use this whole
run should be redone. The current results show that the assay was not able to amplify the
PIK3CA mutation with a frequency of 0.1 % or lower. The same result was seen when 1 ng of
sample was used (Figure 9B). This shows that the castPCR PIK3CA mutation assay can detect
this particular mutation to a mutation frequency as low as 0.5 %. This further implies that in
order for results from this study to be obtained, the DNA extracted from the patient serum
samples must first contain the mutation in question and at the frequency of no less than 0.5 %.
Sample amount of 1 ng, however, should not be an issue. Probably the most crucial steps to be
considered are the preparation of the plate and reactions, where when having such small
amounts of starting material it is essential to perform these steps accurately.
5.2.2 Quality control of castPCR using specified control samples
The positive control is used as a measure of a positive result and also to determine that the PCR
reaction has worked. The negative control is used to ensure that no contamination has happened
and to recognize false positives. The negative control is also used as a boundary control,
meaning that in the event that the negative control is amplified all samples amplified after it are
to be considered as negative and should be run again. For example when testing the sensitivity
of the method, the samples with the two lowest frequencies of 0.1 % and 0. 01 % had to be
negative as the negative control has been amplified before these with a lower Ct value (Figure
11A). The negative control may be amplified for several different reasons. Most likely it is due
to unspecific amplification, which is why it is usually amplified at the very end of the run, when
the cycles start to rise and so the negative control has a very high Ct value. The fault may also
be mechanical. The negative control is very important to be able to register false positives.
Whenever there is amplification in the negative control the whole run should be redone. Also
an internal positive control (IPC) was used, which has the main role of identifying target
negatives and distinguishing them from PCR failure. The IPC in each run was positive,
indicating that negative results were not the result of PCR failure.

55
5.2.3 Patient serum DNA samples with triple negative or T1N0 breast cancer analyzed
with Competitive Allele-Specific TaqMan PCR PIK3CA mutation assay
The study samples were chosen on certain criteria which made them interesting to this study.
The first set of samples were chosen with good prognostic markers, T1N0 ductal carcinoma,
from patients who either had relapse or eventually died of the disease. The second set of samples
was chosen with the same criteria, but from patients who overcame the disease. The third set of
samples were chosen with the sole criteria of being triple negative, as it is the most aggressive
type of breast cancer with no hormonal treatment available (Griffiths and Olin, 2012).
Unfortunately due to poor results when extracting DNA from serum samples, 35 % of the
samples could not be run with castPCR mutation assay.
Study samples were run on castPCR with PIK3CA mutation assay using 1 ng of sample. No
amplification of triple negative samples could be seen when using 1 ng of sample (Figure 10).
There were only 5 triple negative samples with high enough concentration to be able to be run
again with 5 ng of sample. These samples were not amplified either (Figure 11). The results
from the triple negative castPCR runs indicate that there is no observable mutation with high
enough frequency to be amplified (Figure 10, 11).
Next the T1N0 samples were run in the same way as the triple negative samples using 1 ng of
sample in the assay. One sample (sample number 1857) had a Ct value, meaning a possible
positive result (Figure 12). None of the other samples were amplified. This one sample was re-
run later using a maximum amount of sample, but showed a negative result (Figure 14). As with
the triple negative samples, the results from the T1N0 castPCR runs show no observable
mutation in these samples.
5.2.4 castPCR run of available primary tumor DNA samples and re-run of serum samples
with mutation positive primary tumor DNA
The next idea was that possibly the patient could have the H1047R mutation, but the tumor has
not yet spread its cells and DNA into the bloodstream. We obtained primary tumor DNA from
22 of our 82 patients and ran them with the castPCR PIK3CA mutation assay with the
recommended 20 ng of sample. This analysis showed a positive result in 9 samples (Figure 14).
More of the samples were somewhat amplified, but the curve of the negative control can be
seen to be above these and so these must be taken as false positives.
Eight of the 9 samples that showed positive results in the primary tumor DNA analysis were re-
run with castPCR PIK3CA mutation assay from their serum DNA samples with the maximum

56
sample amount that could be obtained per assay. All samples showed negative results (Figure
14).
The results show that even though the primary tumor DNA sample was found to be mutation
positive the corresponding serum DNA sample was negative. This conflict in the result may
indicate that the mutation is present, but the tumor has not yet spread its DNA into the
bloodstream or that tumor DNA is present but at very small amounts. Tumor DNA could be
ample in the bloodstream, but due to low tumor DNA to normal DNA ratio the mutation is too
diluted to be observed. The sensitivity test done previously shows that even a mutation with a
frequency of 10 % is amplified very little when using 1 ng of sample (Figure 9B). All analyses
indicate a need for higher serum DNA concentrations to be used in castPCR, though according
to the sensitivity test done previously it should not be a problem. The need for higher serum
concentrations comes from the need of higher mutation frequency, which may be the real
problem here.
5.2.5. No detection of H1047R mutation with high enough frequency from cfDNA using
PIK3CA mutation specific castPCR
The blood serum samples that were taken from the patients were taken at the time of diagnosis,
which can indicate low tumor burden. Tumors are however individual for each case and the
situation at time of diagnosis could vary greatly between individuals. Breast cancer is a type of
cancer that can be detected early e.g. by mammogram but in many cases it is detected later on
when the tumor has grown so that it is palpable (www.breastcancer.org). The initial cfDNA
concentrations obtained from extraction from the serum samples indicate that the amount of
tumor DNA in the serum has been minimal (Table 5).
The small concentration of cfDNA obtained from the serum samples was the first pitfall in this
study. This does not however mean that this was the reason for negative results. The patients
with negative results may not have the H1047R mutation at all. However 9 patients were
positive for the PIK3CA H1047R mutation in their primary tumor DNA. Perhaps the tumor
DNA in the serum has a different tumor profile than the primary tumor and does not contain
the H1047R mutation. Sporadic breast cancer comes in so many different forms meaning
multiple different somatic mutations accounting to cancerous growth in patients. The current
approximated frequency for the PIK3CA H1047R mutation in patients with breast cancer is 26
%, which means that approximately 74 % of sporadic breast cancer patients do not carry this
particular mutation (Catalogue of somatic mutations in cancer, Wellcome Trust Sanger
57
Institute, Cambridge, UK). This might not have been such a large problem if there would have
been more patient samples used in this study.
Due to there being no positive results from the serum DNA PIK3CA mutation PCR analysis
the ratio of tumor to healthy DNA in the blood could not be determined.
The reason for no positive results may be a too small of a sample group. The criteria for the
patient samples chosen to be in this study limited the amount of patient samples. Also as the
samples were so old, some which could have been used have been lost in storage. 36 % of the
serum samples could not be run with castPCR as no detectable amounts of cfDNA were
observed after extraction. With a larger pool of patient samples the probability of positive
results rises. Bettegowda and colleagues (2014) found a similar fraction of patients without
detectable amounts of cfDNA (45 %) in patients with localized cancers, but they had 223
patients all together as the present study had only 82.
Based on the results from the primary tumor DNA analysis nine patients (11 %) did in fact carry
the H1047R mutation, but it could not be determined from serum DNA. There could be more
patients with the mutation in question, which could possibly be seen from primary tumor DNA,
but not all of the samples had primary tumor DNA samples available that could have been
analyzed. Also the fact that only one hot-spot mutation was analyzed limits this study and in
the future multiple mutations should be considered.
Some of the results could also be false negatives. The amount of DNA could be too small for
the PCR program to detect. On the other hand the proportion of mutation may be so minimal
that the PCR program does not detect this even though it would be present. Board and
colleagues (2010) detected PIK3CA mutations from plasma cfDNA samples from 8 patients
with known PIK3CA mutations in their primary tumor who had advanced cancer. They did not
however detect any PIK3CA mutations from 14 patient cfDNA samples also with known
PIK3CA mutations in their primary tumor with localized cancer. It must be concluded that
either there is no mutation yet present in the blood or it is not detectable in patients with early-
stage cancer. This is why the primary tumor DNA samples were studied. If the patient harbored
the H1047R mutation, it would have to show in the primary tumor sample as a positive PCR
result.
5.3 cfDNA concentration may be a viable prognostic marker in breast cancer
Even though results were not obtained from PCR analysis, we were able to move further with
cfDNA obtained from extraction and examine associations between cfDNA concentration and

58
clinical variables. Out of the 82 patients 53 had detectable amounts of cfDNA in the serum, but
all 82 samples were taken into account when doing statistical analysis.
Many significant associations can be observed especially when patient samples have been
distributed to extremities and when patients with high cfDNA concentrations have been taken
as a separate group. Patients with high serum DNA concentration have had more relapse than
patients with low serum DNA concentration (p = 0.047, Table 9). This indicates that patients
with higher concentrations of DNA in the serum have higher possibility of relapse and so a
poorer prognosis.
In both survival analyses the results clearly indicated a higher mortality rate in patients with
high concentrations of cfDNA (Figure 15, 16). Patients with higher concentrations of cfDNA
are more likely to relapse and more often succumb to breast cancer than patients with lower
concentrations. These results are supported by multiple previous studies (Takeshita et al., 2015;
Newman et al., 2014; Dawson et al., 2013). Out of the 20 patients that belong to the high -group
of the high-rest distribution, 9 have died of causes related to breast cancer and 3 have gone
through relapse. Six of the patients who died of causes related to breast cancer and all 3 patients
who have gone through relapse belong to the T1N0 group. The results demonstrate a clear
association between the severity of breast cancer and cell-free DNA concentration. Cell-free
DNA has been a prominent research target mainly for its relationship with cancer and these
results show that its use as a biomarker is justified. The challenge now is going beyond cfDNA.
5.4 Effects of disease progression and treatment must be considered when
examining cfDNA as a prognostic marker
A great advantage of this study is that the samples used were old, so the outcome of disease
was known. This study could be repeated with fresh samples from patients with breast cancer,
only then the outcome would not be known and the criteria for samples would have to be
changed. This would give many more samples to be studied. It would also be of interest to see
what the difference in extracted DNA concentration would be when using stored and fresh
samples. These patients’ diseases would have to be monitored and their disease progression
followed up on.
As noted in the experimental section, the patient serum samples were taken at the time of
diagnosis. Serum samples from these same patients taken at later time points are also in storage
and would be available for use. It would be interesting to see whether the DNA amount in the
blood has increased at all over time. Studies have shown a correlation between blood DNA
59
levels and tumor evolution (Anker et al., 1999) with increasing amounts of cfDNA
concentrations as tumor burden increases. Also from those patients whose primary tumor
samples gave positive results, it would be interesting to see if from a later time point the
mutation could also be identified from the serum sample. However studies also showed that
cfDNA concentrations decrease after cancer treatment (Elshimali et al., 2013; Leon et al., 1977)
and as patients have most likely gone through some form of treatment these later samples may
have lower cfDNA concentrations. Previous studies show that the DNA levels in blood decrease
after radiotherapy treatment by up to 90 % (Anker et al., 1999). Also patients may undergo
different types of treatment, such as hormone therapy, chemotherapy and/or surgery, all of
which could have different and unknown effects. For example excision of the primary tumor
has been shown to drop cfDNA levels to as low as that of a healthy individual (Catarino et al.,
2008).
It could also be possible to try to concentrate the serum DNA samples that are now available to
see whether a greater concentration could be obtained and then used in the castPCR PIK3CA
mutation assay for a higher sample amount. The inability to identify cfDNA in some early-stage
patients is one of the obstacles of its usage in a clinical setting (Bettegowda et al., 2014).
5.4.1 Sequencing study shows correlation between common samples
Another study done simultaneously used 22 samples that were also used in this study. In that
study tumor DNA was sequenced from DNA extracted from formalin-fixed paraffin-embedded
(FFPE) tissue samples. Out of the 22 samples only three were shown to harbor the H1047R
mutation. These three samples were also shown to be mutation positive in this study when run
using primary tumor DNA with the PIK3CA mutation assay. One sample which showed a
positive result from the primary tumor DNA run in this study did not show the H1047R
mutation when sequenced. Unfortunately more samples were not in common between these two
studies, for example it would have been very interesting to see the sequencing of sample number
1857. The objective was to first have all the T1N0 samples in common between these two
studies, but samples were dropped out of this study for various reason, for example some
samples were lost in storage. Samples were also dropped from the other study, mainly due to
the paraffin-embedded tumor not being a good representation of the tumor and so did not suffice
for extraction and sequencing. Also only tumor tissue was sequenced, giving mutation status of
the tumor.
Sequencing is however a very robust method in finding mutations from sample DNA and might
be one route to follow when further analyzing cfDNA.

60
5.4.2 Limited mutation detection range of castPCR may hinder its clinical application
The application of using castPCR which identifies one specific mutation is one thing that needs
to be considered. The method used in this study is very specific. It is able to analyze the presence
of one specific mutation from a sample in one analysis. The mutation used here is one that is
found frequently in patients with sporadic breast cancer. Breast cancer types vary widely and
each case of breast cancer is unique. The use of only one specific mutation may not be optimal
when samples are analyzed. To be able to expand the use of this method and to gain maximum
benefit, multiple mutations should be studied from each sample as it is not known which
mutations the patients harbor. Even though the H1047R mutation is the most frequent in cases
of sporadic breast cancer, it is harbored in only 9 patients in this study that we know. This means
that nearly 17 % of patients (9/53) who had their serum DNA sample run with castPCR mutation
assay were mutation positive, and when taking into account all 82 patients 11 % were mutation
positive. It would be possibly wise to take a few more mutations, others also with high
frequencies (e.g. mutations of TP53) and test them alongside the H1047R mutation. Which
mutation is found would be indifferent to the goals of this study, where identification of tumor
DNA was primary.
Evaluating total circulating DNA concentrations from patients may have clinical value.
Extracting DNA or RNA is quite a simple procedure which is not very costly. If more
knowledge could be obtained from the relationship of cancer and cfDNA, quantifying it from a
blood sample could become an easy first step for diagnosis and prognosis. However this
requires more work for there are many unanswered questions to what the connection ultimately
is and whether it is the same for all patients.
6. Conclusions
Increasing levels of circulating cell-free DNA account to a higher tendency to relapse and
higher mortality rate in patients with breast cancer. Patients with higher concentrations of
cfDNA have poorer outcomes and therefore worse initial prognosis. Outcome could be
evaluated by studying cfDNA concentration and identifying the ratio of tumor to healthy DNA.
cfDNA concentration could be used as a prognostic marker among other clinicopathological
characteristics. Identifying tumor characteristics from cfDNA is possible, but the method must
be considered for clinical use. Studying single point mutations might not be efficient in the
clinical setting. More research is required to fully be able to consider cell-free DNA as a tumor
biomarker in diagnostics, prognostics and treatment of breast cancer.

61
7. References
Internet references
www.breastcancer.org, accessed on 05.09.2015
www.cancerresearchuk.org, accessed on 05.09.2015
Catalogue of somatic mutations in cancer, http://cancer.sanger.ac.uk/cosmic, Wellcome Trust
Sanger Institute, Cambridge, UK. Accessed on 20.02.2016
The Finnish Cancer Registry, www.syoparekisteri.fi, updated 08.10.2015, accessed on
16.02.2016
National Cancer Institute, http://www.cancer.gov/publications/dictionaries/cancer-terms,
accessed on 29.02.2016
http://www.ncbi.nlm.nih.gov/pubmed, “Competitive allele-specific TaqMan PCR”, accessed:
16.10.2015
Literature references
Abdulkareem, I.H. 2013. Aetio-pathogenesis of breast cancer. Niger.Med.J. 54:371-375.
Alix-Panabieres, C., H. Schwarzenbach, and K. Pantel. 2012. Circulating tumor cells and
circulating tumor DNA. Annu.Rev.Med. 63:199-215.
Anker, P., H. Mulcahy, X.Q. Chen, and M. Stroun. 1999. Detection of circulating tumour DNA
in the blood (plasma/serum) of cancer patients. Cancer Metastasis Rev. 18:65-73.
Bader, A.G., S. Kang, L. Zhao, and P.K. Vogt. 2005. Oncogenic PI3K deregulates transcription
and translation. Nat.Rev.Cancer. 5:921-929.
Banerji, S., K. Cibulskis, C. Rangel-Escareno, K.K. Brown, S.L. Carter, A.M. Frederick, M.S.
Lawrence, A.Y. Sivachenko, C. Sougnez, L. Zou, M.L. Cortes, J.C. Fernandez-Lopez, S. Peng,
K.G. Ardlie, D. Auclair, V. Bautista-Pina, F. Duke, J. Francis, J. Jung, A. Maffuz-Aziz, R.C.
Onofrio, M. Parkin, N.H. Pho, V. Quintanar-Jurado, A.H. Ramos, R. Rebollar-Vega, S.
Rodriguez-Cuevas, S.L. Romero-Cordoba, S.E. Schumacher, N. Stransky, K.M. Thompson, L.
Uribe-Figueroa, J. Baselga, R. Beroukhim, K. Polyak, D.C. Sgroi, A.L. Richardson, G.
Jimenez-Sanchez, E.S. Lander, S.B. Gabriel, L.A. Garraway, T.R. Golub, J. Melendez-Zajgla,
A. Toker, G. Getz, A. Hidalgo-Miranda, and M. Meyerson. 2012. Sequence analysis of
mutations and translocations across breast cancer subtypes. Nature. 486:405-409.
Beaver, J.A., D. Jelovac, S. Balukrishna, R.L. Cochran, S. Croessmann, D.J. Zabransky, H.Y.
Wong, P. Valda Toro, J. Cidado, B.G. Blair, D. Chu, T. Burns, M.J. Higgins, V. Stearns, L.
Jacobs, M. Habibi, J. Lange, P.J. Hurley, J. Lauring, D.A. VanDenBerg, J. Kessler, S. Jeter,
M.L. Samuels, D. Maar, L. Cope, A. Cimino-Mathews, P. Argani, A.C. Wolff, and B.H. Park.
2014. Detection of cancer DNA in plasma of patients with early-stage breast cancer.
Clin.Cancer Res. 20:2643-2650.

62
Benesova, L., B. Belsanova, S. Suchanek, M. Kopeckova, P. Minarikova, L. Lipska, M. Levy,
V. Visokai, M. Zavoral, and M. Minarik. 2013. Mutation-based detection and monitoring of
cell-free tumor DNA in peripheral blood of cancer patients. Anal.Biochem. 433:227-234.
Bettegowda, C., M. Sausen, R.J. Leary, I. Kinde, Y. Wang, N. Agrawal, B.R. Bartlett, H. Wang,
B. Luber, R.M. Alani, E.S. Antonarakis, N.S. Azad, A. Bardelli, H. Brem, J.L. Cameron, C.C.
Lee, L.A. Fecher, G.L. Gallia, P. Gibbs, D. Le, R.L. Giuntoli, M. Goggins, M.D. Hogarty, M.
Holdhoff, S.M. Hong, Y. Jiao, H.H. Juhl, J.J. Kim, G. Siravegna, D.A. Laheru, C. Lauricella,
M. Lim, E.J. Lipson, S.K. Marie, G.J. Netto, K.S. Oliner, A. Olivi, L. Olsson, G.J. Riggins, A.
Sartore-Bianchi, K. Schmidt, l. Shih, S.M. Oba-Shinjo, S. Siena, D. Theodorescu, J. Tie, T.T.
Harkins, S. Veronese, T.L. Wang, J.D. Weingart, C.L. Wolfgang, L.D. Wood, D. Xing, R.H.
Hruban, J. Wu, P.J. Allen, C.M. Schmidt, M.A. Choti, V.E. Velculescu, K.W. Kinzler, B.
Vogelstein, N. Papadopoulos, and L.A. Diaz Jr. 2014. Detection of circulating tumor DNA in
early- and late-stage human malignancies. Sci.Transl.Med. 6:224ra24.
Board, R.E., A.M. Wardley, J.M. Dixon, A.C. Armstrong, S. Howell, L. Renshaw, E. Donald,
A. Greystoke, M. Ranson, A. Hughes, and C. Dive. 2010. Detection of PIK3CA mutations in
circulating free DNA in patients with breast cancer. Breast Cancer Res.Treat. 120:461-467.
Campeau, P.M., W.D. Foulkes, and M.D. Tischkowitz. 2008. Hereditary breast cancer: new
genetic developments, new therapeutic avenues. Hum.Genet. 124:31-42.
Catarino, R., M.M. Ferreira, H. Rodrigues, A. Coelho, A. Nogal, A. Sousa, and R. Medeiros.
2008. Quantification of free circulating tumor DNA as a diagnostic marker for breast cancer.
DNA Cell Biol. 27:415-421.
Crowley, E., F. Di Nicolantonio, F. Loupakis, and A. Bardelli. 2013. Liquid biopsy: monitoring
cancer-genetics in the blood. Nat.Rev.Clin.Oncol. 10:472-484.
Dawson, S.J., D.W. Tsui, M. Murtaza, H. Biggs, O.M. Rueda, S.F. Chin, M.J. Dunning, D.
Gale, T. Forshew, B. Mahler-Araujo, S. Rajan, S. Humphray, J. Becq, D. Halsall, M. Wallis,
D. Bentley, C. Caldas, and N. Rosenfeld. 2013. Analysis of circulating tumor DNA to monitor
metastatic breast cancer. N.Engl.J.Med. 368:1199-1209.
Dempsey, P.W. 2013. All in a blood draw: breast cancer monitoring in the age of genetic
medicine. MLO Med.Lab.Obs. 45:14-15.
Diaz, L.A.,Jr, and A. Bardelli. 2014. Liquid biopsies: genotyping circulating tumor DNA.
J.Clin.Oncol. 32:579-586.
Elshimali, Y.I., H. Khaddour, M. Sarkissyan, Y. Wu, and J.V. Vadgama. 2013. The clinical
utilization of circulating cell free DNA (CCFDNA) in blood of cancer patients. Int.J.Mol.Sci.
14:18925-18958.
Ferlay, J., I. Soerjomataram, R. Dikshit, S. Eser, C. Mathers, M. Rebelo, D.M. Parkin, D.
Forman, and F. Bray. 2015. Cancer incidence and mortality worldwide: sources, methods and
major patterns in GLOBOCAN 2012. Int.J.Cancer. 136:E359-86.
Fleischhacker, M., and B. Schmidt. 2007. Circulating nucleic acids (CNAs) and cancer--a
survey. Biochim.Biophys.Acta. 1775:181-232.

63
Fleischhacker, M., B. Schmidt, S. Weickmann, D.M. Fersching, G.S. Leszinski, B. Siegele,
O.J. Stotzer, D. Nagel, and S. Holdenrieder. 2011. Methods for isolation of cell-free plasma
DNA strongly affect DNA yield. Clin.Chim.Acta. 412:2085-2088.
Girish, C., P. Vijayalakshmi, R. Mentham, C. Babu Rao, and S. Nama. 2014. A REVIEW ON
BREAST CANCER. International Journal of Pharmacy and Biological Sciences. 4:47-52.
Griffiths, C.L., and J.L. Olin. 2012. Triple negative breast cancer: a brief review of its
characteristics and treatment options. J.Pharm.Pract. 25:319-323.
Higgins, M.J., D. Jelovac, E. Barnathan, B. Blair, S. Slater, P. Powers, J. Zorzi, S.C. Jeter, G.R.
Oliver, J. Fetting, L. Emens, C. Riley, V. Stearns, F. Diehl, P. Angenendt, P. Huang, L. Cope,
P. Argani, K.M. Murphy, K.E. Bachman, J. Greshock, A.C. Wolff, and B.H. Park. 2012.
Detection of tumor PIK3CA status in metastatic breast cancer using peripheral blood.
Clin.Cancer Res. 18:3462-3469.
Jahr, S., H. Hentze, S. Englisch, D. Hardt, F.O. Fackelmayer, R.D. Hesch, and R. Knippers.
2001. DNA fragments in the blood plasma of cancer patients: quantitations and evidence for
their origin from apoptotic and necrotic cells. Cancer Res. 61:1659-1665.
Kalinsky, K., L.M. Jacks, A. Heguy, S. Patil, M. Drobnjak, U.K. Bhanot, C.V. Hedvat, T.A.
Traina, D. Solit, W. Gerald, and M.E. Moynahan. 2009. PIK3CA mutation associates with
improved outcome in breast cancer. Clin.Cancer Res. 15:5049-5059.
Karakas, B., K.E. Bachman, and B.H. Park. 2006. Mutation of the PIK3CA oncogene in human
cancers. Br.J.Cancer. 94:455-459.
Kenemans, P., R.A. Verstraeten, and R.H. Verheijen. 2008. Oncogenic pathways in hereditary
and sporadic breast cancer. Maturitas. 61:141-150.
Le Du, F., N.T. Ueno, and A.M. Gonzalez-Angulo. 2013. Breast Cancer Biomarkers: Utility in
Clinical Practice. Curr.Breast Cancer.Rep. 5:10.1007/s12609-013-0125-9.
Leon, S.A., B. Shapiro, D.M. Sklaroff, and M.J. Yaros. 1977. Free DNA in the serum of cancer
patients and the effect of therapy. Cancer Res. 37:646-650.
Mannisto, S., P. Pietinen, M. Virtanen, V. Kataja, and M. Uusitupa. 1999. Diet and the risk of
breast cancer in a case-control study: does the threat of disease have an influence on recall bias?
J.Clin.Epidemiol. 52:429-439.
Michailidou, K., P. Hall, A. Gonzalez-Neira, M. Ghoussaini, J. Dennis, R.L. Milne, M.K.
Schmidt, J. Chang-Claude, S.E. Bojesen, M.K. Bolla, Q. Wang, E. Dicks, A. Lee, C. Turnbull,
N. Rahman, Breast and Ovarian Cancer Susceptibility Collaboration, O. Fletcher, J. Peto, L.
Gibson, I. Dos Santos Silva, H. Nevanlinna, T.A. Muranen, K. Aittomaki, C. Blomqvist, K.
Czene, A. Irwanto, J. Liu, Q. Waisfisz, H. Meijers-Heijboer, M. Adank, Hereditary Breast and
Ovarian Cancer Research Group Netherlands (HEBON), R.B. van der Luijt, R. Hein, N.
Dahmen, L. Beckman, A. Meindl, R.K. Schmutzler, B. Muller-Myhsok, P. Lichtner, J.L.
Hopper, M.C. Southey, E. Makalic, D.F. Schmidt, A.G. Uitterlinden, A. Hofman, D.J. Hunter,
S.J. Chanock, D. Vincent, F. Bacot, D.C. Tessier, S. Canisius, L.F. Wessels, C.A. Haiman, M.
Shah, R. Luben, J. Brown, C. Luccarini, N. Schoof, K. Humphreys, J. Li, B.G. Nordestgaard,
64
S.F. Nielsen, H. Flyger, F.J. Couch, X. Wang, C. Vachon, K.N. Stevens, D. Lambrechts, M.
Moisse, R. Paridaens, M.R. Christiaens, A. Rudolph, S. Nickels, D. Flesch-Janys, N. Johnson,
Z. Aitken, K. Aaltonen, T. Heikkinen, A. Broeks, L.J. Veer, C.E. van der Schoot, P. Guenel, T.
Truong, P. Laurent-Puig, F. Menegaux, F. Marme, A. Schneeweiss, C. Sohn, B. Burwinkel,
M.P. Zamora, J.I. Perez, G. Pita, M.R. Alonso, A. Cox, I.W. Brock, S.S. Cross, M.W. Reed,
E.J. Sawyer, I. Tomlinson, M.J. Kerin, N. Miller, B.E. Henderson, F. Schumacher, L. Le
Marchand, I.L. Andrulis, J.A. Knight, G. Glendon, A.M. Mulligan, kConFab Investigators,
Australian Ovarian Cancer Study Group, A. Lindblom, S. Margolin, M.J. Hooning, A.
Hollestelle, A.M. van den Ouweland, A. Jager, Q.M. Bui, J. Stone, G.S. Dite, C. Apicella, H.
Tsimiklis, G.G. Giles, G. Severi, L. Baglietto, P.A. Fasching, L. Haeberle, A.B. Ekici, M.W.
Beckmann, H. Brenner, H. Muller, V. Arndt, C. Stegmaier, A. Swerdlow, A. Ashworth, N. Orr,
M. Jones, J. Figueroa, J. Lissowska, L. Brinton, M.S. Goldberg, F. Labreche, M. Dumont, R.
Winqvist, K. Pylkas, A. Jukkola-Vuorinen, M. Grip, H. Brauch, U. Hamann, T. Bruning,
GENICA (Gene Environment Interaction and Breast Cancer in Germany) Network, P. Radice,
P. Peterlongo, S. Manoukian, B. Bonanni, P. Devilee, R.A. Tollenaar, C. Seynaeve, C.J. van
Asperen, A. Jakubowska, J. Lubinski, K. Jaworska, K. Durda, A. Mannermaa, V. Kataja, V.M.
Kosma, J.M. Hartikainen, N.V. Bogdanova, N.N. Antonenkova, T. Dork, V.N. Kristensen, H.
Anton-Culver, S. Slager, A.E. Toland, S. Edge, F. Fostira, D. Kang, K.Y. Yoo, D.Y. Noh, K.
Matsuo, H. Ito, H. Iwata, A. Sueta, A.H. Wu, C.C. Tseng, D. Van Den Berg, D.O. Stram, X.O.
Shu, W. Lu, Y.T. Gao, H. Cai, S.H. Teo, C.H. Yip, S.Y. Phuah, B.K. Cornes, M. Hartman, H.
Miao, W.Y. Lim, J.H. Sng, K. Muir, A. Lophatananon, S. Stewart-Brown, P. Siriwanarangsan,
C.Y. Shen, C.N. Hsiung, P.E. Wu, S.L. Ding, S. Sangrajrang, V. Gaborieau, P. Brennan, J.
McKay, W.J. Blot, L.B. Signorello, Q. Cai, W. Zheng, S. Deming-Halverson, M. Shrubsole, J.
Long, J. Simard, M. Garcia-Closas, P.D. Pharoah, G. Chenevix-Trench, A.M. Dunning, J.
Benitez, and D.F. Easton. 2013. Large-scale genotyping identifies 41 new loci associated with
breast cancer risk. Nat.Genet. 45:353-61, 361e1-2.
Newman, A.M., S.V. Bratman, J. To, J.F. Wynne, N.C. Eclov, L.A. Modlin, C.L. Liu, J.W.
Neal, H.A. Wakelee, R.E. Merritt, J.B. Shrager, B.W. Loo Jr, A.A. Alizadeh, and M. Diehn.
2014. An ultrasensitive method for quantitating circulating tumor DNA with broad patient
coverage. Nat.Med. 20:548-554.
Nik-Zainal, S., P. Van Loo, D.C. Wedge, L.B. Alexandrov, C.D. Greenman, K.W. Lau, K.
Raine, D. Jones, J. Marshall, M. Ramakrishna, A. Shlien, S.L. Cooke, J. Hinton, A. Menzies,
L.A. Stebbings, C. Leroy, M. Jia, R. Rance, L.J. Mudie, S.J. Gamble, P.J. Stephens, S.
McLaren, P.S. Tarpey, E. Papaemmanuil, H.R. Davies, I. Varela, D.J. McBride, G.R. Bignell,
K. Leung, A.P. Butler, J.W. Teague, S. Martin, G. Jonsson, O. Mariani, S. Boyault, P. Miron,
A. Fatima, A. Langerod, S.A. Aparicio, A. Tutt, A.M. Sieuwerts, A. Borg, G. Thomas, A.V.
Salomon, A.L. Richardson, A.L. Borresen-Dale, P.A. Futreal, M.R. Stratton, P.J. Campbell,
and Breast Cancer Working Group of the International Cancer Genome Consortium. 2012. The
life history of 21 breast cancers. Cell. 149:994-1007.
Oshiro, C., N. Kagara, Y. Naoi, M. Shimoda, A. Shimomura, N. Maruyama, K. Shimazu, S.J.
Kim, and S. Noguchi. 2015. PIK3CA mutations in serum DNA are predictive of recurrence in
primary breast cancer patients. Breast Cancer Res.Treat. 150:299-307.
Paoletti, C., and D.F. Hayes. 2014. Molecular testing in breast cancer. Annu.Rev.Med. 65:95-
110.

65
Petridis, C., M.N. Brook, V. Shah, K. Kohut, P. Gorman, M. Caneppele, D. Levi, E. Papouli,
N. Orr, A. Cox, S.S. Cross, I. Dos-Santos-Silva, J. Peto, A. Swerdlow, M.J. Schoemaker, M.K.
Bolla, Q. Wang, J. Dennis, K. Michailidou, J. Benitez, A. Gonzalez-Neira, D.C. Tessier, D.
Vincent, J. Li, J. Figueroa, V. Kristensen, A.L. Borresen-Dale, P. Soucy, J. Simard, R.L. Milne,
G.G. Giles, S. Margolin, A. Lindblom, T. Bruning, H. Brauch, M.C. Southey, J.L. Hopper, T.
Dork, N.V. Bogdanova, M. Kabisch, U. Hamann, R.K. Schmutzler, A. Meindl, H. Brenner, V.
Arndt, R. Winqvist, K. Pylkas, P.A. Fasching, M.W. Beckmann, J. Lubinski, A. Jakubowska,
A.M. Mulligan, I.L. Andrulis, R.A. Tollenaar, P. Devilee, L. Le Marchand, C.A. Haiman, A.
Mannermaa, V.M. Kosma, P. Radice, P. Peterlongo, F. Marme, B. Burwinkel, C.H. van
Deurzen, A. Hollestelle, N. Miller, M.J. Kerin, D. Lambrechts, G. Floris, J. Wesseling, H.
Flyger, S.E. Bojesen, S. Yao, C.B. Ambrosone, G. Chenevix-Trench, T. Truong, P. Guenel, A.
Rudolph, J. Chang-Claude, H. Nevanlinna, C. Blomqvist, K. Czene, J.S. Brand, J.E. Olson, F.J.
Couch, A.M. Dunning, P. Hall, D.F. Easton, P.D. Pharoah, S.E. Pinder, M.K. Schmidt, I.
Tomlinson, R. Roylance, M. Garcia-Closas, and E.J. Sawyer. 2016. Genetic predisposition to
ductal carcinoma in situ of the breast. Breast Cancer Res. 18:22-016-0675-7.
Reid, A.L., J.B. Freeman, M. Millward, M. Ziman, and E.S. Gray. 2015. Detection of BRAF-
V600E and V600K in melanoma circulating tumour cells by droplet digital PCR. Clin.Biochem.
48:999-1002.
Sausen, M., S. Parpart, and L.A. Diaz Jr. 2014. Circulating tumor DNA moves further into the
spotlight. Genome Med. 6:35.
Schwarzenbach, H. 2013. Circulating nucleic acids as biomarkers in breast cancer. Breast
Cancer Res. 15:211.
Schwarzenbach, H., D.S. Hoon, and K. Pantel. 2011. Cell-free nucleic acids as biomarkers in
cancer patients. Nat.Rev.Cancer. 11:426-437.
Shaw, J.A., and J. Stebbing. 2014. Circulating free DNA in the management of breast cancer.
Ann.Transl.Med. 2:3-5839.2013.06.06.
Shiovitz, S., and L.A. Korde. 2015. Genetics of breast cancer: a topic in evolution. Ann.Oncol.
Sozzi, G., L. Roz, D. Conte, L. Mariani, F. Andriani, P. Verderio, and U. Pastorino. 2005.
Effects of prolonged storage of whole plasma or isolated plasma DNA on the results of
circulating DNA quantification assays. J.Natl.Cancer Inst. 97:1848-1850.
Takeshita, T., Y. Yamamoto, M. Yamamoto-Ibusuki, T. Inao, A. Sueta, S. Fujiwara, Y. Omoto,
and H. Iwase. 2015. Prognostic role of PIK3CA mutations of cell-free DNA in early-stage triple
negative breast cancer. Cancer.Sci. 106:1582-1589.
UICC, International Union Against Cancer, editors: Sobin, L.H., Gospodarowicz, M.K. and
Wittekind, C. 2009. TNM Classification of Malignant Tumours. Seventh Edition
Vuong, D., P.T. Simpson, B. Green, M.C. Cummings, and S.R. Lakhani. 2014. Molecular
classification of breast cancer. Virchows Arch. 465:1-14.
Wooster, R., and B.L. Weber. 2003. Breast and ovarian cancer. N.Engl.J.Med. 348:2339-2347.

66
Xue, X., M.D. Teare, I. Holen, Y.M. Zhu, and P.J. Woll. 2009. Optimizing the yield and utility
of circulating cell-free DNA from plasma and serum. Clin.Chim.Acta. 404:100-104.