“license to fail”: goal definition, leader group prototypicality, and perceptions of leadership...
TRANSCRIPT

Available online at www.sciencedirect.com
www.elsevier.com/locate/obhdp
Organizational Behavior and Human Decision Processes 105 (2008) 14–35
‘‘License to Fail’’: Goal definition, leader group prototypicality,and perceptions of leadership effectiveness after leader failure q
Steffen R. Giessner *, Daan van Knippenberg
RSM Erasmus University, Erasmus University Rotterdam, Room T8-44, P.O. Box 1738, 3000 DR Rotterdam, The Netherlands
Received 21 December 2005Available online 31 May 2007
Accepted by John Schaubroeck
Abstract
Leaders who fail to achieve group or organizational goals risk losing follower endorsement. We propose a model in which leadercharacteristics (leader group prototypicality—the leader’s representativeness of group identity) and goal definition (a maximal goalthat ideally would be reached vs. a minimal goal that ought to be reached) interact to affect leadership perceptions after failure.Group prototypical (vs. non-prototypical) leaders are proposed to receive more trust in leadership and, therefore, to be evaluatedas more effective by their followers after failing to achieve a maximal goal, but not after failing to achieve a minimal goal. This modelwas supported in a series of four studies including experimental, field, and scenario paradigms. In addition, we showed that thismodel holds only after failure and not after success, and more for followers who identify strongly (vs. weakly) with their group.� 2007 Elsevier Inc. All rights reserved.
Keywords: Leader group prototypicality; Leader performance; Minimal and maximal goals; Follower endorsement; Trust in leadership
Introduction
Failures to reach organizational, group, or team goalsare often attributed to leaders (Lord, Binning, Rush, &Thomas, 1978; Meindl & Ehrlich, 1987; Meindl, Ehrlich,& Dukerich, 1985; Phillips & Lord, 1981). When such neg-ative events are attributed to the leader, follower endorse-ment of the leader is likely to decrease. Accordingly, thebasis for the leader to influence and mobilize followers,and thus the basis for leadership effectiveness (Chemers,2001; Yukl, 2001), is also likely to suffer after a failureto achieve goals. But do failing leaders always lose the
0749-5978/$ - see front matter � 2007 Elsevier Inc. All rights reserved.
doi:10.1016/j.obhdp.2007.04.002
q The research reported in this article was supported by a fellowshipfrom the Erasmus Research Institute of Management, ErasmusUniversity Rotterdam, The Netherlands, awarded to the first author.We thank John Schaubroeck and three anonymous reviewers forhelpful comments on an earlier version of this manuscript.
* Corresponding author. Fax: +31 0 10 4089015.E-mail address: [email protected] (S.R. Giessner).
endorsement of followers or are there conditions underwhich they might have a ‘‘license to fail’’ and suffer noill consequences after failure? This question is highly rele-vant to our understanding of leadership effectiveness,because leaders will sooner or later inevitably find them-selves in a situation where they are associated with a fail-ure to achieve group or organizational goals, and leaders’ability to maintain follower endorsement despite suchassociations with failure would seem critical to their con-tinued effectiveness as a leader.
To answer this question, we build on the social iden-tity analysis of leadership (Hogg, 2001; Hogg & vanKnippenberg, 2003; van Knippenberg & Hogg, 2003)and on research on goal definitions (Brendl & Higgins,1996). The social identity analysis of leadership hasexplicitly focused on factors that may give leadersgreater credit in the eyes of their followers, which wepropose may protect them against lower endorsementafter failure to achieve goals important to the group.It has so far focused on leaders’ ability to mobilize

S.R. Giessner, D. van Knippenberg / Organizational Behavior and Human Decision Processes 105 (2008) 14–35 15
and motivate followers (van Knippenberg & Hogg,2003; van Knippenberg, van Knippenberg, De Cremer,& Hogg, 2004) and has not considered situations inwhich leaders are associated with failure. To extendthe social identity analysis to the realm of leader failure,we integrate insights from research on goal definition(Brendl & Higgins, 1996). Leader failure implies thenon-achievement of a goal and followers’ perceptionsof the specific goal on which the leader fails will influ-ence how followers’ evaluate the degree of failure. Thus,we provide an integrated framework to explain follow-ers’ leadership evaluations after leader failure.
Performance of leaders and leadership endorsement
Given the impact leaders have on groups and organi-zations, it is not surprising that leadership research hasfocused on the effects of performance information onthe evaluation and endorsement of the leader (Awamleh& Gardner, 1999; Ensari & Murphy, 2003; Haslam,2001; Lord et al., 1978; Meindl et al., 1985; Shamir,1992). Research by Lord and colleagues indicates thatinformation about team performance influences follow-ers’ leadership perceptions (Lord et al., 1978; Phillips &Lord, 1981; Rush, Thomas, & Lord, 1977). People seemto infer the presence of ‘‘good’’ or ‘‘bad’’ leadershipfrom performance information. Elaborating on this,Meindl and colleagues (Meindl & Ehrlich, 1987; Meindlet al., 1985) developed the ‘‘romance of leadership’’ con-cept to explain why followers often attribute perfor-mance information directly to the leader. They arguethat people have a romanticized, heroic view of leader-ship in which leaders are accorded more influence overevents than would be justified. This leads to attributionsof organizational performance to the leader. Thus, bothorganizational success and organizational failure areoften attributed to the leader, and leaders associatedwith failure risk losing followers’ endorsement.
However, research on leadership evaluations after per-formance information has focused on responses to leader-ship by what were essentially uninvolved observers. Thatis, participants in these studies were not placed in a posi-tion in which they were asked to evaluate their own (pre-sumed) leader. Yet, leaders do not only lead groups, theyare also members of the groups they lead (Hollander,1964). Thus, leadership processes are enacted in the con-text of a shared group membership, where leaders, asgroup members, ask followers, as group members, toexert themselves on behalf of the collective. Characteris-tics of the leader as a group member, therefore, play akey role in leadership endorsement (Hogg, 2001; vanKnippenberg & Hogg, 2003). Hence, to understandresponses to leaders associated with failure to reach per-formance goals, it is important to take into account theshared group membership of leader and followers—a per-spective we take in the current research.
A social identity approach to leader endorsement
One influential approach to understand the effects ofshared group membership on perceptions, evaluations,and behavior is the social identity approach which isgrounded in Social Identity Theory (Hogg & Abrams,1988; Tajfel & Turner, 1986) and Self-CategorizationTheory (Turner, Hogg, Oakes, Reicher, & Wetherell,1987). From the social identity perspective it is arguedthat people define themselves not only on the basis oftheir individual characteristics and interpersonal rela-tions (i.e., personal identity or individual self), but alsoin terms of characteristics of the groups to which theybelong (i.e., social identity or collective self). While thesocial identity approach originally was developed as ananalysis of intergroup relations, in recent years it hasbeen applied to study a variety of issues in organiza-tional behavior (for overviews, see Haslam, 2001;Haslam, van Knippenberg, Platow, & Ellemers, 2003;Hogg & Terry, 2000).
This approach has also been applied to the study ofleadership processes in groups (Hogg, 2001; Hogg &van Knippenberg, 2003; van Knippenberg & Hogg,2003). The concept of group prototypes (i.e., fuzzy setsof characteristics that in a given context define thegroup; cf. Rosch, 1978) takes a central role within thisperspective. The group prototype can be defined as anideal representation of the group’s identity (i.e., the mostprototypical group member is not necessarily the aver-age group member) that describes and prescribes groupmembership appropriate attributes and behavior in aspecific context. If group membership is salient, follow-ers’ responses to the leader will depend on how similarthe leader is to the prototype of the group or organiza-tion—leader’s group prototypicality (Hogg, 2001).
This conceptualization of prototypicality differs fromthe one used in Leader Categorization Theory (Lord,Foti, & Phillips, 1982; Lord & Maher, 1991), in whichit is understood as a context-specific category defininggeneral schemas of effective leaders. In other words, pro-totypicality is understood as an effective leadership ste-reotype for a specific context (e.g., military, business,etc.). In contrast, group prototypicality as defined bythe social identity approach is a more dynamic concep-tualization which is defined on the salient group level(Hogg, 2001; Turner et al., 1987). Former research hasshown that effective leader schemas are used as referencepoints of leadership evaluations when group member-ship salience is low, whereas group prototypes are usedwhen group membership salience is high (Hains, Hogg,& Duck, 1997; Lord & Hall, 2003). Thus, the underlyingprocesses of leader evaluations are the same (i.e., leaderfit to an abstracted prototype as comparison standard),but the reference points differ. We use the term proto-typical leader as defined in the social identity approachthroughout this paper.

16 S.R. Giessner, D. van Knippenberg / Organizational Behavior and Human Decision Processes 105 (2008) 14–35
Prototypical as compared to less prototypical leadersare seen as exemplifying the shared group or organiza-tional identity, and as representing what defines thegroup and distinguishes it from other groups (e.g., aUS president seen as a ‘‘real American’’ and the embodi-ment of American values). As a consequence, prototyp-ical leaders have more potential to influence theirfollowers, are perceived as more effective leaders (Hainset al., 1997; Hogg, Hains, & Mason, 1998; Platow & vanKnippenberg, 2001; Platow, van Knippenberg, Haslam,van Knippenberg, & Spears, 2006), and are seen as morecharismatic (Platow, Haslam, Foddy, & Grace, 2003;van Knippenberg & van Knippenberg, 2005). Further-more, prototypical leaders are more trusted than lessprototypical leaders, because they are perceived as hav-ing the group’s interest at heart. The social identity anal-ysis suggests that the greater trust in leadership given toa prototypical (vs. non-prototypical) leader is the centralmechanism through which prototypical leaders receivestronger follower endorsement than less prototypicalleaders (Platow & van Knippenberg, 2001; vanKnippenberg & Hogg, 2003; van Knippenberg & vanKnippenberg, 2005).
A social identity model of leadership endorsement after
leader failure
The current research builds on this social identityframework. We argue that leaders who are more trustedto have the group’s best interest at heart should alsoreceive more leeway for their behaviors (Platow & vanKnippenberg, 2001; van Knippenberg & van Knippen-berg, 2005). That is, less desirable behaviors should beevaluated less critically for such leaders. Therefore, lea-der failure, as an instance of a less desirable behavior,should influence leadership evaluations of a leaderwho is trusted to a lesser extent than evaluations of aleader who is less trusted. This argument is also in linewith Hollander’s (1964) theory of idiosyncrasy credit.He argues that leaders need an accumulation of positiveimpressions in order to gain leeway for deviatingactions. However, whereas Hollander hypothesizes thatcredits can only be ‘‘earned’’ through group-orientedbehaviors, a social identity analysis of leadership showsthat leader prototypicality can directly affect idiosyn-crasy credit1. In line with this, it has been shown thatfollower endorsement of prototypical (vs. less prototyp-ical) leaders is less contingent on leader behaviors thatindicate the leader’s group-orientedness, such asingroup-favoring allocation decisions (Platow & vanKnippenberg, 2001) or self-sacrificing behavior on
1 We treat the term trust in leadership and idiosyncrasy credit asinterchangable. Both terms implicate a kind of trust and leeway givento the leader.
behalf of the group (van Knippenberg & van Knippen-berg, 2005).
The evidence for the greater effectiveness of prototyp-ical leaders is quite robust and derives from studies usingdifferent paradigms, different operationalizations of pro-totypicality, different measures of leadership effective-ness, and experimental as well as field settings (foroverviews, see Hogg & van Knippenberg, 2003; vanKnippenberg & Hogg, 2003; van Knippenberg et al.,2004).
As a consequence, we hypothesize that a prototypicalleader should receive more follower endorsement (i.e.,more positive evaluations of leadership effectiveness)than a non-prototypical leader after failing to reach agoal. This is because a prototypical (vs. non-prototypi-cal) leader receives greater trust in leadership which, inturn, should protect prototypical leaders from the nega-tive evaluations that non-prototypical leaders are likelyto receive. Thus, especially in case of failure to reachperformance goals, prototypical leaders should be per-ceived as more effective than non-prototypical leaders.
Goal definition, leader prototypicality, and perceptions of
leadership effectiveness
Leadership evaluations after leader failure are likelyto not only be contingent on factors that affect trust inleadership such as leader prototypicality (i.e., a formof recognition-based processing—processing related tothe perception of the leader; cf. Ensari & Murphy,2003; Lord & Maher, 1991). Another key issue shouldbe the nature of the goal that the leader failed to achieve(i.e., a form of inference-based processing—processingrelated to the outcomes of an event; cf. Ensari & Mur-phy, 2003; Lord & Maher, 1991). Generally, failure toachieve a goal is a negative event. However, not all goalfailures are likely to be perceived equally negatively(Brendl & Higgins, 1996). If we can identify a factor thataffects the extent to which failure in goal achievement isperceived as more or less negative, we may identify animportant factor associated with attenuated responsesto leader failure.
One approach to understand how followers evaluatea leader after failure is to understand how individualsevaluate others on the basis of the goals pursued. In acomprehensive overview, Brendl and Higgins (1996)summarized principles determining the valence of events(i.e., the emotional value associated with an event). Theyargue that it is useful to differentiate between two typesof goal definition influencing valence judgments: mini-mal goals and maximal goals (see also Kessler,Neumann, Mummendey, Schubert, & Waldzus, 2006;Schubert, Mummendey, Waldzus, & Kessler, 2005).Both minimal and maximal goals are specific goals(e.g., ‘‘I want to do 20 push-ups’’) which serve moreabstract goals (e.g., ‘‘I want to exercise’’). Whereas the

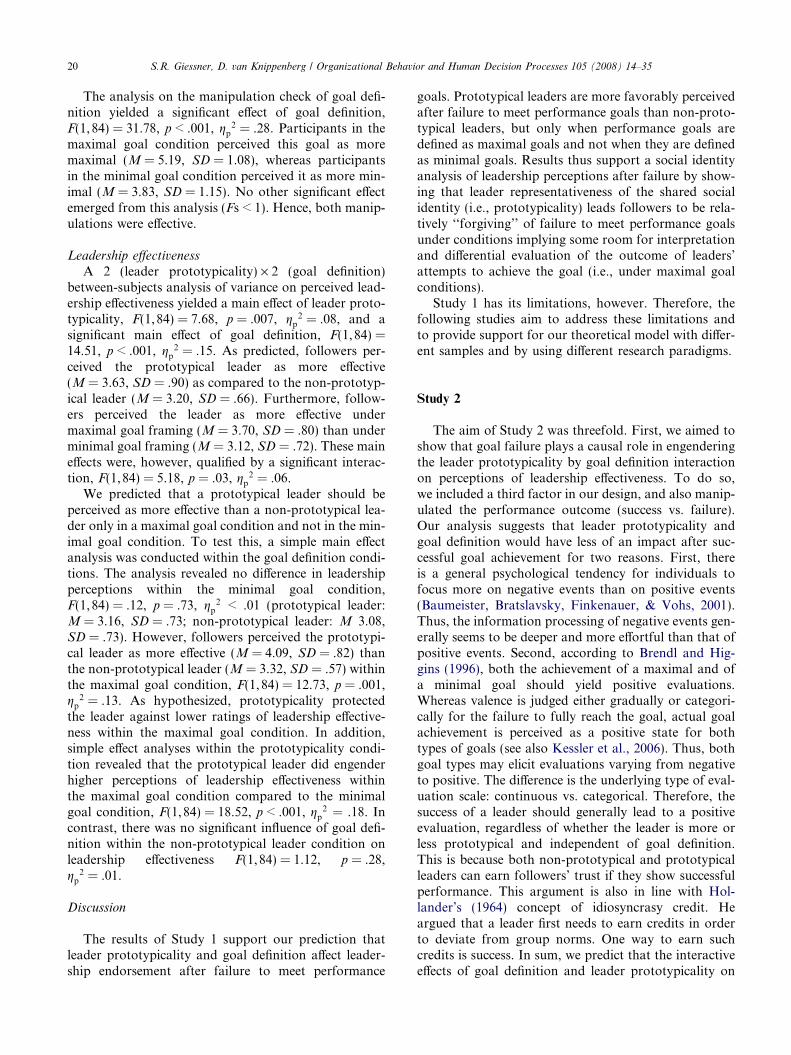
Leader group prototypicality
Trust in leadership
Evaluations of leadership effectiveness
Goal definition
Fig. 1. Social identity-goal definition model of leadership effectivenessevaluations after leader failure.
S.R. Giessner, D. van Knippenberg / Organizational Behavior and Human Decision Processes 105 (2008) 14–35 17
abstract goals give meaning to en event, specific goals setthe reference point to evaluate the valence of an event inrelation to the more abstract goal.
Maximal goals can be defined as ‘‘ideal’’ goals whichsupport abstract goals. The closer an event (i.e., out-come of a task) is to a maximal goal the less negatively(or more positively) it is evaluated. Therefore, thevalence of events is determined gradually (Brendl &Higgins, 1996; Kessler et al., 2006). In other words, devi-ations from this reference point (i.e., maximal goal) aregradually evaluated from negative or less positive topositive. For instance, a leader’s goal could be to acquirenew business value of ideally 200 million dollars. Thisgoal could imply that reaching such a high level of busi-ness value would mean that the company would becomea market leader. Not reaching this goal does not neces-sarily represent a negative outcome. In this sense, thegoal is a maximal goal, and a negative deviation fromthe goal would leave some leeway for the evaluation ofthe leader’s performance. In contrast, a minimal goalcan be regarded as ‘‘the lowest goal whose end state willstill produce satisfaction’’ (Brendl & Higgins, 1996,p. 104; see also Rotter, 1954/1982a, 1970/1982b). Assuch, it is as a reference point or standard which deter-mines valence of a task outcome in an absolute, either orfashion (Kessler et al., 2006; Schubert et al., 2005; seealso Rotter, 1954/1982a). If such a reference point isreached, it is positive or non-negative, if it is notreached, the evaluation is automatically negative. Thus,any failure to reach this reference point leads to a ‘‘cat-egorical’’ negative evaluation (Kessler et al., 2006; Schu-bert et al., 2005). For example, the leader of a companymay have the goal to acquire new business value of at
least 200 million dollars. This amount of business valuemay represent the amount of money which is necessaryto guarantee that the company has no financial prob-lems for the next business year. If the leader does notmanage to reach this financial goal, it does not matterwhether the leader managed to get 180 or 150 milliondollars, or whether the followers trust the leader ornot. If the leader fails to reach this goal, the conse-quences are negative for the company.
We argue that goal definition as a minimal goal vs. amaximal goal has implications for followers’ evaluationof a leader’s goal failure. Goal definition as a minimalgoal vs. as a maximal goal influences how goal failureis judged. Whereas maximal goals allow leeway for theinterpretation of goal failure (i.e., because evaluationsare on a continuous scale), minimal goals do not leavesuch room for interpretation (i.e., because evaluationsare categorical). We propose that prototypical (vs.non-prototypical) leaders receive more trust in leader-ship which provides them with leeway for goal devia-tions. However, only a maximal goal definitionprovides the opportunity for gradual evaluations ofleaders after failure. A minimal goal does not. There-
fore, leader prototypicality and the greater trust in moreprototypical leaders should have less influence on lead-ership perceptions after failure to meet a minimal goal.In contrast, a maximal goal is an ideal goal, and failureto reach a maximal goal is more likely to be evaluatedgradually and should leave more leeway for interpreta-tion. Therefore, leader characteristics such as leader pro-totypicality and the associated greater trust inprototypical leaders are more likely to influence leader-ship perceptions after failure to reach a maximal goalthan after failure to reach a minimal goal.
In sum, building on a social identity perspective (vanKnippenberg & Hogg, 2003) and on principles of judg-ing the valence of goal-related events (Brendl & Higgins,1996; Kessler et al., 2006), we predict that leader proto-typicality and goal definition interact in affecting leaderevaluations after leader failure. We hypothesize thatprototypical leaders receive more trust in leadershipwhich, in turn, gives the leader more leeway in failing(i.e., in terms of more positive evaluations). However,this trust in leadership can only have its positive impacton leader evaluations under maximal goal conditions,because failures on such goals allow for a gradual eval-uation. In contrast, under minimal goal conditions, afailure to reach a goal is evaluated as categorically neg-ative. Thus, independent of the trust given to a proto-typical (vs. non-prototypical) leader, leader evaluationsafter failure on a minimal goal should be categoricallynegative. Our hypotheses are summarized in an overallmodel in Fig. 1.
Overview of the current research
To develop and test this model, we conducted fourstudies in which leader prototypicality and goal definitionwere manipulated (Studies 1, 2, 4) or measured (Study 3).In all studies participants held in a follower role and hadto evaluate a failing leader. The main dependent variableconsisted of evaluations of leadership effectiveness. Study1 tested in an experimental laboratory context the hypoth-esis that leader prototypicality and goal definition interactin the prediction of leadership effectiveness evaluationsafter failure. Studies 2, 3, and 4 tested the hypothesis thatthese effects are explained by the higher trust given to theprototypical (vs. non-prototypical) leader. Additionally,Study 2 applied a scenario experimental set-up to showthat the interactive effects of leader prototypicality and

18 S.R. Giessner, D. van Knippenberg / Organizational Behavior and Human Decision Processes 105 (2008) 14–35
goal definition are unique to task failure (vs. success) sit-uations. Study 3 tested our model in a field study applyinga critical incidents technique with a heterogeneous sampleof employees. Finally, Study 4 tested the underlyingassumption that the interactive effects of leader prototyp-icality and goal definition should matter more to employ-ees who identify more strongly with their organization. Bycombining three different methodologies to test andextend our analysis, we aimed to bolster the confidencein the conclusions based on the current set of studies.
2 Group prototypicality was manipulated as being representative ofthe group in terms of a perceptual test. The conceptualization ofprototypicality implies that group prototypicality covaries with sim-ilarity to the group, but the concept of prototypicality captures more—it refers to an ideal-type more than to the ‘‘average’’ group member.This manipulation has been successfully applied in former socialidentity research on leadership (van Knippenberg & van Knippenberg,2005) which also showed that findings from the experimental paradigmcould be replicated in two surveys of leadership in organizations.Furthermore, an established measure of leader group prototypicality(i.e., the manipulation check) confirmed our intended manipulation.Study 3 provides another test of the social identity framework bymeasuring leader group prototypicality with an established scale andusing this scale to test our model. In addition, Studies 2 and 4manipulate leader prototypicality through direct statements of theleader’s representativeness of the team. The results across all studieswere consistent with, and are most parsimoniously explained in termsof, a social identity framework.
Study 1
In a first test of our hypotheses, we conducted a com-puter-mediated experiment. This set-up allowed us tomanipulate leader prototypicality and goal definition,and to give bogus feedback about leader failure to achievethe performance goal. Thus, we could ensure that perfor-mance was identical in all conditions, and establish cau-sality in the relationship between prototypicality, goaldefinition, and perceptions of leadership effectiveness.While participants were led to believe that they engagedas a group in a computer-mediated task supervised by aleader, in effect this meant that the presence of a leaderwas simulated via the computer set-up and participantsproceeded through the experiment individually.Although this set-up may seem somewhat artificial in nat-ure, previous leadership studies using similar set-ups haveshown that procedures like these create situations that arereal to participants (cf. experimental vs. mundane realism;Locke, 1986; Mook, 1983) and that yield findings that areconsistently replicated in surveys in organizations (DeCremer & van Knippenberg, 2002, 2004; De Cremer,van Knippenberg, van Knippenberg, Mullenders, &Stinglhamber, 2005; van Knippenberg & van Knippen-berg, 2005). Furthermore, previous research in the socialidentity tradition has shown that in such minimal settingsgroup memberships can actually elicit strong effects oncognition, emotions, and behavior (see Brewer, 1979;Hewstone, Rubin, & Willis, 2002; Tajfel, 1982).
Methods
Participants and design
Ninety-six undergraduate business administrationstudents (33 females, 63 males) participated in thisstudy. The age of the participants varied between 18and 29 years (M = 20.39, SD = 2.10), and the majoritywas employed. The study used a two-factor between-subjects design manipulating leader prototypicality(prototypical vs. non-prototypical) and goal definition(maximal vs. minimal). All participants were ran-domly assigned to one of the conditions. Participantsreceived 10 euro (approximately 12 USD) for theirparticipation.
Procedure
Participants arrived at the laboratory and wereplaced in separate computer cubicles. All instructionswere given via the computer itself. The study was intro-duced as a team game study. It was explained that theparticipants would have to work in virtual teams of fourplayers connected through a network system. The gamewas described as being adapted from an assessment cen-tre and it was said that the game would have differentattributes like a team structure (i.e., leader and follow-ers) and an incentive for good team performance. Next,participants had to fill out a short questionnaire consist-ing of 12 items which later was used for the prototypical-ity manipulation. This procedure was adapted from vanKnippenberg and van Knippenberg (2005). The ques-tionnaire was said to measure perception styles. It wasostensibly used to decide on the person who would beassigned the leadership position. Subsequently theincentive of the game was explained in more detail. Itwas said that if the team was better than the averageof all participating teams, they would take part in a pricedraw of 100 euro (i.e., 25 euro each).
Afterwards participants received feedback about theperception style test. This feedback served as the leader
prototypicality manipulation (adapted from van Knip-penberg & van Knippenberg, 2005). Half of the partici-pants were informed that the person who had most incommon with the other team members and who wasmost representative for the team would be chosen tobe the team leader (prototypical leader condition). Theother half was informed that the member who had theleast in common with the others and who was least rep-resentative for the team would be chosen as team leader(non-prototypical leader condition).2 In both conditionsit was always another team member than the participantthat became the team leader. Subsequently, we mea-sured perceived leader prototypicality (see measuressection).

3 We report gp2 in our studies which refers to the partial g2 values as
reported in SPSS 14.
S.R. Giessner, D. van Knippenberg / Organizational Behavior and Human Decision Processes 105 (2008) 14–35 19
In order to heighten participants’ sense of team inter-action, an e-mail system was introduced which wouldostensibly be used during the team game. In this partof the experiment, participants could test this systemby writing one e-mail to the other participants and byreading the e-mails of the other participants. The e-mailsof the other participants were all pre-programmed (i.e.,expressing motivation to start with the game)—in real-ity, participants were working individually. After writ-ing one e-mail and having read all other e-mails, theparticipants could continue the experiment.
Next, it was said that the team leader meanwhile hadstarted a negotiation task in which the leader could earnpoints for the group. It was explained that because theleader had the most responsibility for the team, the lea-der would be responsible for getting the amount of start-ing points. These points would be an important basis forthe team game which would follow. The more points theleader would get, the easier it would be for the team tofulfill the following tasks. Included within this informa-tion was our goal definition manipulation. Half of theparticipants were informed that the leader ‘‘should ide-ally get about’’ 200 points in the negotiation task inorder to have a good starting position for the team(maximal goal condition). The other participants wereinformed that the leader ‘‘must at least get’’ 200 pointsin the negotiation task in order to have a good startingposition for the team (minimal goal condition). Thus,goal definition was manipulated with a simple wordframing procedure. The goal itself was kept constantin both conditions.
After receiving this information, all participants hadto wait for about 30 seconds until they received the feed-back that the leader had acquired only 145 point at theend of the negotiation game. Subsequently, participantshad to answer our dependent variables and manipula-tion checks. Finally, the study stopped and all partici-pants were thoroughly debriefed about the study.Furthermore, all participants took part in a price drawof four times 25 euro (as promised at the start of thestudy).
Measures
If not otherwise said, all items used a 7-point scaleranging from 1 (totally disagree) to 7 (totally agree). Par-ticipants had to answer a 3-item scale measuring per-ceived leader prototypicality (e.g., ‘‘This team leaderrepresents what is characteristic about the team’’)adapted from Platow and van Knippenberg (2001)directly after the leader prototypicality manipulation.The scale was reliable, a = .95, and the average scoreserved as a manipulation check of leader prototypicality.
All other measures followed after the manipulation ofthe goal definition. First, participants had to fill out anadapted 6-item scale (adapted from van Knippenberg& van Knippenberg, 2005) measuring perceived leader-
ship effectiveness (‘‘This team leader is a good leader’’;‘‘This team leader is very effective’’; ‘‘This team leaderleads the team in a way which motivates the team mem-bers’’; ‘‘I like working together with this leader’’; ‘‘Howsuccessful was your team leader?’’; ‘‘How successful willyour leader be in future tasks?’’; responses to the lasttwo items ranged from 1 = not successful to 7 = very
successful). A principal component analysis over all sixitems yielded only one factor explaining 66 percent ofthe variance. The internal consistency of the six itemswas very high, a = .89. We used the average score ofthese six items as a measure of perceived leadershipeffectiveness.
Next, participants had to indicate whether the leaderhad reached the goal or not (i.e., a dichotomous choice).This item served as a check of whether the participantsread the information regarding goal failure. Afterwards,participants had to answer a 5-item scale measuring per-ceived goal definition. Participants were asked to thinkabout the goal which was set for the leader and indicatewhich of two competing statements best described thegoal of the leader (i.e., on 7-point scales). The competingstatements of the five items are listed in the Appendix A.The scale was sufficiently reliable, a = .70, and an aver-age score served as a manipulation check of goal defini-tion. Finally, participants had to answer demographicquestions regarding their gender, age and employmentstatus.
Results3
Eight participants had to be excluded from the anal-ysis, because they indicated that they thought that theleader reached the goal rather than failed to reach thegoal. There was no indication that participants in onecell were more likely to fail on this control item. Hence,the following analyses included the remaining 88participants.
Leader prototypicality and goal definition
Separate 2 (leader prototypicality) · 2 (goal defini-tion) between-subjects analysis of variance on themanipulation check measures of leader prototypicalityand goal definition were conducted. The analysis onthe manipulation check of leader prototypicality yieldeda significant effect of leader prototypicality, F(1,84) =201.84, p < .001, gp
2 = .71. The prototypical leader wasindeed perceived as more prototypical (M = 5.07,SD = .82) than the non-prototypical leader (M = 2.28,SD = 1.01). No other significant effects emerged fromthis analysis (Fs < 1).
20 S.R. Giessner, D. van Knippenberg / Organizational Behavior and Human Decision Processes 105 (2008) 14–35
The analysis on the manipulation check of goal defi-nition yielded a significant effect of goal definition,F(1,84) = 31.78, p < .001, gp
2 = .28. Participants in themaximal goal condition perceived this goal as moremaximal (M = 5.19, SD = 1.08), whereas participantsin the minimal goal condition perceived it as more min-imal (M = 3.83, SD = 1.15). No other significant effectemerged from this analysis (Fs < 1). Hence, both manip-ulations were effective.
Leadership effectiveness
A 2 (leader prototypicality) · 2 (goal definition)between-subjects analysis of variance on perceived lead-ership effectiveness yielded a main effect of leader proto-typicality, F(1,84) = 7.68, p = .007, gp
2 = .08, and asignificant main effect of goal definition, F(1,84) =14.51, p < .001, gp
2 = .15. As predicted, followers per-ceived the prototypical leader as more effective(M = 3.63, SD = .90) as compared to the non-prototyp-ical leader (M = 3.20, SD = .66). Furthermore, follow-ers perceived the leader as more effective undermaximal goal framing (M = 3.70, SD = .80) than underminimal goal framing (M = 3.12, SD = .72). These maineffects were, however, qualified by a significant interac-tion, F(1,84) = 5.18, p = .03, gp
2 = .06.We predicted that a prototypical leader should be
perceived as more effective than a non-prototypical lea-der only in a maximal goal condition and not in the min-imal goal condition. To test this, a simple main effectanalysis was conducted within the goal definition condi-tions. The analysis revealed no difference in leadershipperceptions within the minimal goal condition,F(1,84) = .12, p = .73, gp
2 < .01 (prototypical leader:M = 3.16, SD = .73; non-prototypical leader: M 3.08,SD = .73). However, followers perceived the prototypi-cal leader as more effective (M = 4.09, SD = .82) thanthe non-prototypical leader (M = 3.32, SD = .57) withinthe maximal goal condition, F(1, 84) = 12.73, p = .001,gp
2 = .13. As hypothesized, prototypicality protectedthe leader against lower ratings of leadership effective-ness within the maximal goal condition. In addition,simple effect analyses within the prototypicality condi-tion revealed that the prototypical leader did engenderhigher perceptions of leadership effectiveness withinthe maximal goal condition compared to the minimalgoal condition, F(1,84) = 18.52, p < .001, gp
2 = .18. Incontrast, there was no significant influence of goal defi-nition within the non-prototypical leader condition onleadership effectiveness F(1,84) = 1.12, p = .28,gp
2 = .01.
Discussion
The results of Study 1 support our prediction thatleader prototypicality and goal definition affect leader-ship endorsement after failure to meet performance
goals. Prototypical leaders are more favorably perceivedafter failure to meet performance goals than non-proto-typical leaders, but only when performance goals aredefined as maximal goals and not when they are definedas minimal goals. Results thus support a social identityanalysis of leadership perceptions after failure by show-ing that leader representativeness of the shared socialidentity (i.e., prototypicality) leads followers to be rela-tively ‘‘forgiving’’ of failure to meet performance goalsunder conditions implying some room for interpretationand differential evaluation of the outcome of leaders’attempts to achieve the goal (i.e., under maximal goalconditions).
Study 1 has its limitations, however. Therefore, thefollowing studies aim to address these limitations andto provide support for our theoretical model with differ-ent samples and by using different research paradigms.
Study 2
The aim of Study 2 was threefold. First, we aimed toshow that goal failure plays a causal role in engenderingthe leader prototypicality by goal definition interactionon perceptions of leadership effectiveness. To do so,we included a third factor in our design, and also manip-ulated the performance outcome (success vs. failure).Our analysis suggests that leader prototypicality andgoal definition would have less of an impact after suc-cessful goal achievement for two reasons. First, thereis a general psychological tendency for individuals tofocus more on negative events than on positive events(Baumeister, Bratslavsky, Finkenauer, & Vohs, 2001).Thus, the information processing of negative events gen-erally seems to be deeper and more effortful than that ofpositive events. Second, according to Brendl and Hig-gins (1996), both the achievement of a maximal and ofa minimal goal should yield positive evaluations.Whereas valence is judged either gradually or categori-cally for the failure to fully reach the goal, actual goalachievement is perceived as a positive state for bothtypes of goals (see also Kessler et al., 2006). Thus, bothgoal types may elicit evaluations varying from negativeto positive. The difference is the underlying type of eval-uation scale: continuous vs. categorical. Therefore, thesuccess of a leader should generally lead to a positiveevaluation, regardless of whether the leader is more orless prototypical and independent of goal definition.This is because both non-prototypical and prototypicalleaders can earn followers’ trust if they show successfulperformance. This argument is also in line with Hol-lander’s (1964) concept of idiosyncrasy credit. Heargued that a leader first needs to earn credits in orderto deviate from group norms. One way to earn suchcredits is success. In sum, we predict that the interactiveeffects of goal definition and leader prototypicality on
S.R. Giessner, D. van Knippenberg / Organizational Behavior and Human Decision Processes 105 (2008) 14–35 21
perceptions of leadership effectiveness should only holdafter failure to reach performance goals, but not aftersuccessful goal achievement. Thus our model shouldhold only after failure but not after success.
Furthermore, we have not yet tested our full model.We hypothesized that prototypical (vs. non-prototypi-cal) leaders receive more trust in leadership from follow-ers, because they are believed to have the group’sinterest at heart (Hogg & van Knippenberg, 2003;Platow & van Knippenberg, 2001; van Knippenberg &Hogg, 2003; van Knippenberg & van Knippenberg,2005). This trust in leadership gives the leader leewayin the maximal goal condition, because gradual evalua-tions are possible. However, trust in leadership shouldnot predict leadership evaluations under a minimal goaldefinition, because this goal definition does not allowgradual evaluations. In this sense, we predict a moder-ated mediation (see Fig. 1) and we aim to test this inthe following studies.
Finally, Study 2 was designed to replicate the findingsof Study 1 using an experimental paradigm with moremundane realism. In Study 2, vignettes were used tomanipulate prototypicality (prototypical vs. non-proto-typical leader), goal definition (maximal vs. minimalgoal), and performance of the leader on behalf of thegroup (success vs. failure). Using such a methodologyhas advantages and disadvantages. The strongest advan-tage is that it is possible to describe a more realistic andnaturalistic situation. We chose a situation which busi-ness and economics students can easily imagine andwhich has been successfully applied in an earlier leader-ship study in which it yielded results that were replicatedin two surveys of leadership in organizations (van Knip-penberg & van Knippenberg, 2005). Furthermore, weknow from related leadership research (De Cremer &van Knippenberg, 2002, 2004; De Cremer et al., 2005)that scenario experiments on leadership consistentlyyielded the same results as laboratory experiments andfield surveys.
Methods
Participants and design
One-hundred and fifty-one undergraduate businessadministration students (103 females, 48 males) tookpart in the study. The sample was aged between 17and 25 years (M = 18.76, SD = 1.22), and the majoritywas employed. A 2 (leader prototypicality) · 2 (goal def-inition) · 2 (leader performance) between-subjectsdesign was used. Participants were randomly assignedto one of the eight conditions.
Procedure and measures
The study was conducted as part of a series of studies.Each participant received 10 euro for participation in allstudies. The other studies were not related to the current
study and the instructions for participants clearly statedthis. Participants came to the laboratory and wereplaced in separate cubicles. All manipulations and ques-tions were provided through a computer. The study wasannounced as a study about leadership.
After a short introduction, participants read adescription of a team leader of an internationally-ori-ented consulting agency with high reputation whichactually was the manipulation of leader prototypicality
(adapted from van Knippenberg & van Knippenberg,2005). The non-prototypical leader was described asan ‘‘outsider’’ who had interests and attitudes thatdeviated from the general group norm, and who wasnot representative of the team. The prototypical leaderwas described as representative of the group’s norms,as having attitudes and interests which were in linewith the group norm and as being highly representativeof the team. Following the prototypicality manipula-tion, three items adapted from Platow and van Knip-penberg (2001) measuring leader prototypicality werepresented (e.g., ‘‘This team leader represents what ischaracteristic about the team’’). If not mentioned dif-ferently, all answers were rated on 7-point scales rang-ing from 1 (totally disagree) to 7 (totally agree). Theaverage of the scale (a = .96) served as a manipulationcheck of prototypicality. Next, participants had toanswer a 3-item scale measuring trust in leadership(‘‘I absolutely trust my team leader.’’; ‘‘I believe thatI would give this team leader a lot of leeway.’’; ‘‘I thinkthat my team leader will do the right things.’’) that hadgood reliability (a = .82).
Afterwards, the participants were confronted with thesecond part of the scenario which included the manipu-
lation of goal definition and the manipulation of leader
performance. It was described that the team leader hadthe responsibility to achieve certain goals in securingnew business value. In the maximal goal condition, itwas stated that the team leader ‘‘should ideally’’ acquirenew business value of 200 million euro this year. In theminimal goal condition, the term ‘‘should ideally’’ wasreplaced by ‘‘must at least’’. Subsequently, participantswere informed that the leader acquired new business vol-ume of either about 210 million euro (i.e., success) or145 million euro (i.e., failure).
After the participants had read the second part of thescenario, two questions were included which had twopurposes. First, they served as a manipulation check ofthe performance manipulation. Second, the first itemreinforced the manipulation of goal definition. Partici-pants had first to answer how much money (i.e., in mil-lion euro) the team leader either should ideally or must at
least acquire. The correct answer was ‘‘200’’. The secondquestion assessed how much the leader had actuallyacquired. The correct answer for this question dependedon the performance condition (i.e., success: 210 vs.failure: 145).

Table 1Means and standard deviations of leadership effectiveness as a functionof performance, leader prototypicality, and goal definition (Study 2)
Performance Leader prototypicality Goal definition
Maximal Minimal
Success PrototypicalM 5.87 5.82SD .67 .52
Non-prototypicalM 5.15 4.89SD .59 .82
Failure PrototypicalM 4.12 3.18SD 1.12 .79
Non-prototypicalM 2.61 2.93SD .49 .82
Note. Leadership effectiveness was measured on a 7-point scale rangingfrom 1 (low leadership effectiveness) to 7 (high leadershipeffectiveness).
22 S.R. Giessner, D. van Knippenberg / Organizational Behavior and Human Decision Processes 105 (2008) 14–35
Following this, perceived leadership effectiveness wasmeasured with the same 6-item scale used in Study 1. Aprincipal component analysis over the six items yieldedonly one factor explaining 80 percent of the variance.The internal consistency of the 6-item scale was veryhigh (a = .95). The mean of this scale was used for theanalyses. Next, we asked some demographic questions:gender, age, and employment status. Finally, partici-pants were debriefed and thanked.
Results
Thirteen participants had to be excluded from thesample, because they failed to answer the manipulationcheck of our performance manipulation correctly.Hence, 138 participants were included in the followinganalyses.
Leader prototypicality and trust in leadership
As intended, the prototypical leader was perceived asmore prototypical of the team (M = 5.83, SD = .69)than the non-prototypical leader (M = 2.06, SD = .79),t(136) = 29.95, p < .001, gp
2 = .87. Hence, our prototyp-icality manipulation was successful. In addition, the pro-totypical leader received more trust (M = 5.28, SD =1.05) than the non-prototypical leader (M = 3.84,SD = .74), t(136) = 9.34, p < .001, gp
2 = .39. No othereffects were significant.
Leadership effectivenessA 2 (leader prototypicality) · 2 (goal definition) · 2
(leader performance) between-subjects analysis of vari-ance on perceptions of leadership effectiveness yielded amain effect of leader prototypicality, F(1,130) = 42.60,p < .001, = .25, a main effect of leader performance,F(1,130) = 289.04, p < .001, = .69, and a non-significantmain effect of goal definition, F(1, 130) = 3.24, p = .07,gp
2 = .02. The prototypical leader received higher leader-ship effectiveness ratings (M = 4.65, SD = 1.41) than thenon-prototypical leader (M = 3.97, SD = 1.33) and a suc-cessful leader received higher ratings of leadership effec-tiveness (M = 5.43, SD = .76) than a failing leader(M = 3.25, SD = 1.01). Furthermore, the two-way inter-action of leader prototypicality and goal definition wassignificant, F(1, 130) = 4.04, p < .05, gp
2 = .03. Thesemain effects and the two-way interaction were, however,qualified by the expected three-way interaction,F(1,130) = 7.95, p = .006, gp
2 = .06.We predicted a leader prototypicality by goal defini-
tion interaction on perceptions of leadership effective-ness within the failure condition but not within thesuccess condition. Simple interaction analyses were con-ducted within the conditions of leader performance. Ascan be seen in Table 1, there was no simple interactioneffect within the success condition, F(1, 130) = .32,p = .57, gp
2 < .01. However, there was a significant sim-
ple main effect of leader prototypicality within the suc-cess condition, F(1, 130) = 19.77, p < .001, gp
2 = .13.The prototypical leader received higher ratings of effec-tiveness (M = 5.85, SD = .59) than the non-prototypicalleader (M = 5.04, SD = .70).
Within the failure condition, we found a simple maineffect of prototypicality, F(1, 130) = 22.91, p < .001,gp
2 = .15. The prototypical leader was perceived as moreeffective than the non-prototypical leader (M = 3.64,SD = 1.07 vs. M = 2.77, SD = .69). Furthermore, wefound the expected simple interaction effect,F(1,130) = 11.82, p = .001, gp
2 = .08 (Table 1). The pat-tern of this simple interaction supports our model andreplicates the results of Study 1. The prototypical leaderwas perceived as more effective than the non-prototypi-cal leader, but only within the maximal goal condition,F(1,130) = 32.85, p < .001, gp
2 = .20. When the goalwas defined as minimal, leader prototypicality did notinfluence perceptions of leadership effectiveness,F(1,130) = .94, p = .34, gp
2 < .01. In addition, therewas no difference in perceptions between the maximaland minimal goal conditions for the non-prototypicalleader, F(1,130) = 1.33, p = .25, gp
2 = .01. However,for the prototypical leader, perceptions differed signifi-cantly between the goal conditions, F(1, 130) = 15.01,p < .001, gp
2 = .10.
Analyses of conditional indirect effects
Different methodologies have recently been suggestedto test moderated mediation (e.g., Baron & Kenny, 1986;Edwards & Lambert, in press; Morgan-Lopez & MacK-innon, 2006; Muller, Judd, & Yzerbyt, 2005). There areconflicting definitions of what exactly is understoodunder moderated mediation and recent advancementssuggest to test for precise models of moderated media-tion rather than general models (Edwards & Lambert,
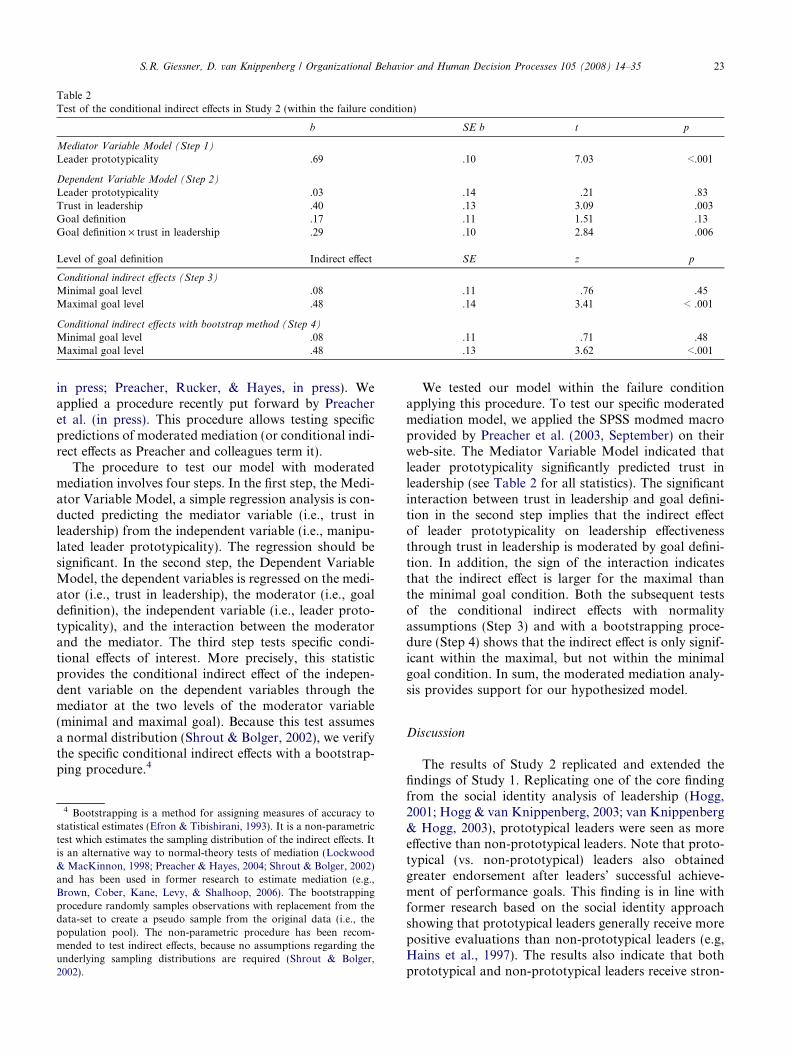
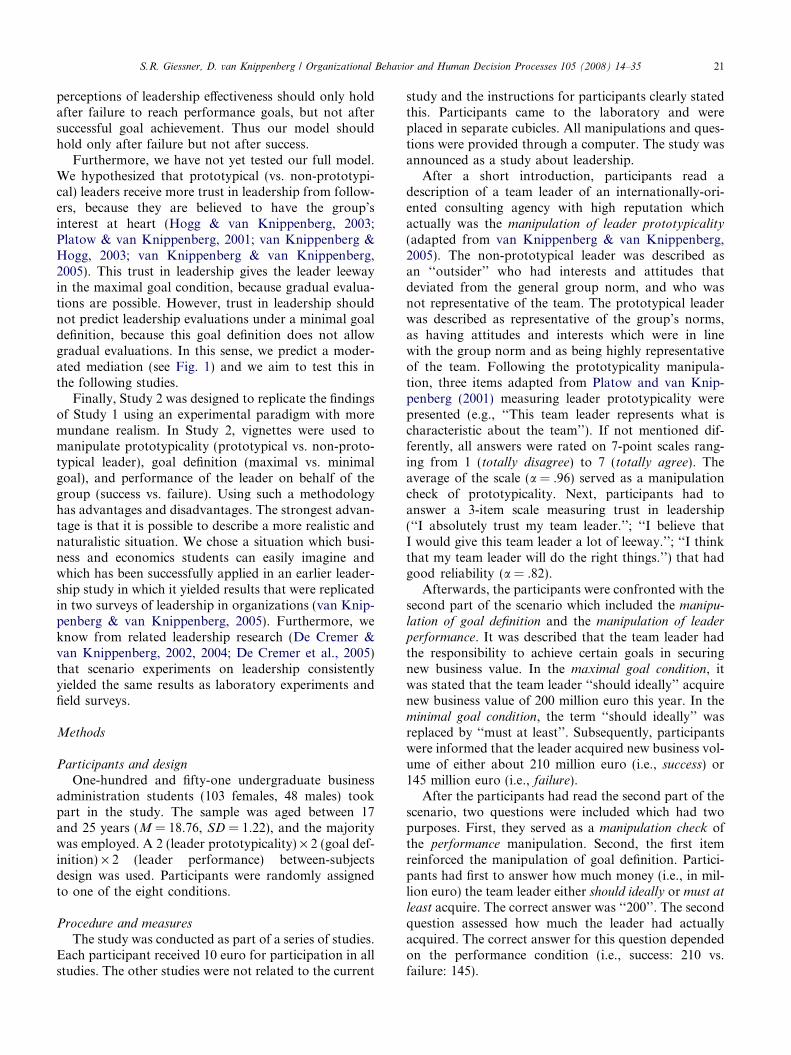
Table 2Test of the conditional indirect effects in Study 2 (within the failure condition)
b SE b t p
Mediator Variable Model (Step 1)
Leader prototypicality .69 .10 7.03 <.001
Dependent Variable Model (Step 2)
Leader prototypicality .03 .14 .21 .83Trust in leadership .40 .13 3.09 .003Goal definition .17 .11 1.51 .13Goal definition · trust in leadership .29 .10 2.84 .006
Level of goal definition Indirect effect SE z p
Conditional indirect effects (Step 3)
Minimal goal level .08 .11 .76 .45Maximal goal level .48 .14 3.41 < .001
Conditional indirect effects with bootstrap method (Step 4)
Minimal goal level .08 .11 .71 .48Maximal goal level .48 .13 3.62 <.001
S.R. Giessner, D. van Knippenberg / Organizational Behavior and Human Decision Processes 105 (2008) 14–35 23
in press; Preacher, Rucker, & Hayes, in press). Weapplied a procedure recently put forward by Preacheret al. (in press). This procedure allows testing specificpredictions of moderated mediation (or conditional indi-rect effects as Preacher and colleagues term it).
The procedure to test our model with moderatedmediation involves four steps. In the first step, the Medi-ator Variable Model, a simple regression analysis is con-ducted predicting the mediator variable (i.e., trust inleadership) from the independent variable (i.e., manipu-lated leader prototypicality). The regression should besignificant. In the second step, the Dependent VariableModel, the dependent variables is regressed on the medi-ator (i.e., trust in leadership), the moderator (i.e., goaldefinition), the independent variable (i.e., leader proto-typicality), and the interaction between the moderatorand the mediator. The third step tests specific condi-tional effects of interest. More precisely, this statisticprovides the conditional indirect effect of the indepen-dent variable on the dependent variables through themediator at the two levels of the moderator variable(minimal and maximal goal). Because this test assumesa normal distribution (Shrout & Bolger, 2002), we verifythe specific conditional indirect effects with a bootstrap-ping procedure.4
4 Bootstrapping is a method for assigning measures of accuracy tostatistical estimates (Efron & Tibishirani, 1993). It is a non-parametrictest which estimates the sampling distribution of the indirect effects. Itis an alternative way to normal-theory tests of mediation (Lockwood& MacKinnon, 1998; Preacher & Hayes, 2004; Shrout & Bolger, 2002)and has been used in former research to estimate mediation (e.g.,Brown, Cober, Kane, Levy, & Shalhoop, 2006). The bootstrappingprocedure randomly samples observations with replacement from thedata-set to create a pseudo sample from the original data (i.e., thepopulation pool). The non-parametric procedure has been recom-mended to test indirect effects, because no assumptions regarding theunderlying sampling distributions are required (Shrout & Bolger,2002).
We tested our model within the failure conditionapplying this procedure. To test our specific moderatedmediation model, we applied the SPSS modmed macroprovided by Preacher et al. (2003, September) on theirweb-site. The Mediator Variable Model indicated thatleader prototypicality significantly predicted trust inleadership (see Table 2 for all statistics). The significantinteraction between trust in leadership and goal defini-tion in the second step implies that the indirect effectof leader prototypicality on leadership effectivenessthrough trust in leadership is moderated by goal defini-tion. In addition, the sign of the interaction indicatesthat the indirect effect is larger for the maximal thanthe minimal goal condition. Both the subsequent testsof the conditional indirect effects with normalityassumptions (Step 3) and with a bootstrapping proce-dure (Step 4) shows that the indirect effect is only signif-icant within the maximal, but not within the minimalgoal condition. In sum, the moderated mediation analy-sis provides support for our hypothesized model.
Discussion
The results of Study 2 replicated and extended thefindings of Study 1. Replicating one of the core findingfrom the social identity analysis of leadership (Hogg,2001; Hogg & van Knippenberg, 2003; van Knippenberg& Hogg, 2003), prototypical leaders were seen as moreeffective than non-prototypical leaders. Note that proto-typical (vs. non-prototypical) leaders also obtainedgreater endorsement after leaders’ successful achieve-ment of performance goals. This finding is in line withformer research based on the social identity approachshowing that prototypical leaders generally receive morepositive evaluations than non-prototypical leaders (e.g,Hains et al., 1997). The results also indicate that bothprototypical and non-prototypical leaders receive stron-

24 S.R. Giessner, D. van Knippenberg / Organizational Behavior and Human Decision Processes 105 (2008) 14–35
ger leadership endorsement after leader success thanleader failure. Thus, success has positive consequencesfor the endorsement of prototypical as well as non-pro-totypical leaders. Consequently, non-prototypical lead-ers seem to be able to increase follower endorsementvia successful performance. The important finding is,however, that leader prototypicality and goal definitiondid not interact in the prediction of leadership evalua-tions after leader success. Thus, as hypothesized, ourmodel only applies to leadership failure and not to lead-ership success.
Study 2 also replicated the basic finding that leadersare perceived more positively when they are associatedwith success rather than failure (Lord et al., 1978;Meindl et al., 1985). Replicating Study 1’s findings, thegreater endorsement of prototypical as compared tonon-prototypical leaders after failure only obtainedunder maximal goal conditions and not under minimalgoal conditions. Extending Study 1, we also showed thatthe greater endorsement of prototypical leaders afterfailure to achieve a maximal goal was mediated by fol-lowers’ trust in leadership as hypothesized in our model.Finally, Study 2 also showed that the interactive effect ofleader prototypicality and goal definition on leadershipperceptions is tied to leader failure.
An important caveat for Study 2 of course is that itconcerned a hypothetical situation. Its findings shouldtherefore be seen in conjunction with the findings ofStudy 1 and earlier findings showing the validity of sce-nario methodology in leadership research (cf. van Knip-penberg & van Knippenberg, 2005). Ultimately,however, an empirical question is in how far theseresults transfer to field contexts. In addition, we pre-dicted that trust in leadership is the central mediatingprocess through which the prototypical leader earnsmore positive evaluations after failing on a maximalgoal. This prediction derives directly from the socialidentity perspective on leadership (van Knippenberg &Hogg, 2003). However, this does not mean that we haveexcluded the possibility that other processes might influ-ence these effects.
Study 3
The goal of Study 3 was, therefore, threefold. First,we aimed to replicate our main findings in the field.We conducted a web-based field study employing a crit-ical incident technique. Participants were asked to thinkof their present or past leader and of a task in which thisleader failed. All independent and dependent variableswere assessed via a questionnaire.
Second, we explored possible additional mediatingprocesses. One explanation of the difference in leader-ship evaluations might be different degrees of attributionof responsibility for the failure. For instance, Ensari and
Murphy (2003) found in their study that participantsattributed more responsibility to leaders who fit a ste-reotypical leader schema compared to leaders who fitthis schema to a lesser extent. However, this effect wasonly present after successful performance or in a collec-tivist culture. This effect disappeared for participants ofan individualistic culture who read a scenario of perfor-mance failure related to the leader. We therefore expectthat attribution of responsibility should not necessarilymediate the effects on leadership effectiveness after lea-der failure. Thus, our analysis does not assume that pro-totypical leaders are held less responsible for a failure toreach goals. Rather, it hinges on the prediction that(under maximal goal condition) their failure to reach agoal will be viewed in a more favorable light. However,to explicitly exclude the role of attribution of responsi-bility as an explanatory mechanism, we included a mea-sure of attribution in Study 3 (and 4).
Finally, we extended our measure of trust in leader-ship. Based on our social identity framework, we arguedthat followers perceive the prototypical leader as havingthe group’s interest at heart. In other words, the leadershould be perceived as being committed to the group.We measured trust in leadership as the variable reflect-ing this perception (cf. Dirks & Ferrin, 2002; van Knip-penberg & van Knippenberg, 2005). However, our trustmeasure was quite general. Therefore, we included addi-tional items directly measuring perceived leader commit-ment to the group. This extended measure shouldprovide further validation of our theoretical argument.
Methods
Participants and design
Sixty people took part in this study (27 female, 29male, 4 missing values). The sample was quite heteroge-neous in terms of job (e.g., teacher, social worker, senioranalyst, physician), branch (e.g., school, hospital, bank,government), country of residence (38 from the U.S.,others are from Sweden, U.K., Australia, Germany,Greece, India, China, Netherlands, Canada, Lebanon),and years of employment (ranging from 0.5 to 18 years).The sample was aged between 18 and 57 years(M = 30.56, SD = 12.54).
Procedure and measuresThe study was conducted as an online study
announced as a leadership survey on different researchweb-sites (i.e., web-sites providing links to variousonline surveys and experiments). We performed the sur-vey by following recent recommendations for the con-duct of internet research (Birnbaum, 2004; Krautet al., 2004). The web-site was programmed to meet allcommon browser recommendations in order to avoidcommon technical selection biases. Further, we usedcookies for each participant which made it almost
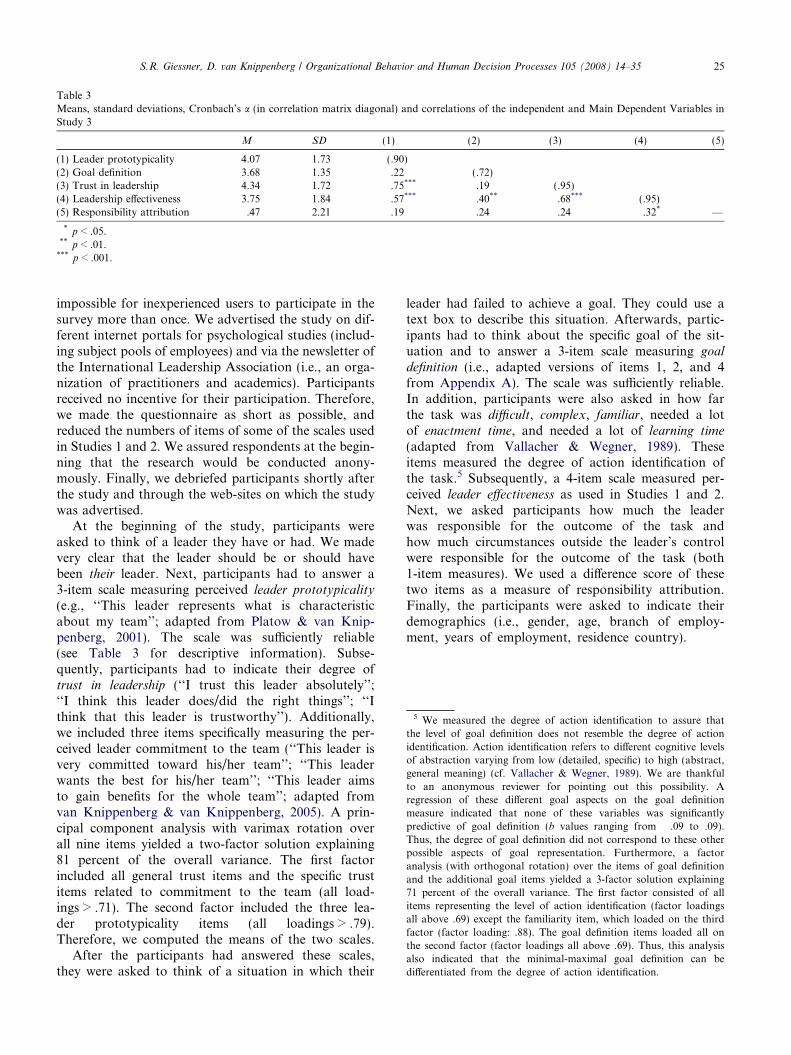
Table 3Means, standard deviations, Cronbach’s a (in correlation matrix diagonal) and correlations of the independent and Main Dependent Variables inStudy 3
M SD (1) (2) (3) (4) (5)
(1) Leader prototypicality 4.07 1.73 (.90)(2) Goal definition 3.68 1.35 .22 (.72)(3) Trust in leadership 4.34 1.72 .75*** .19 (.95)(4) Leadership effectiveness 3.75 1.84 .57*** .40** .68*** (.95)(5) Responsibility attribution .47 2.21 �.19 �.24 �.24 �.32* —
* p < .05.** p < .01.
*** p < .001.
5 We measured the degree of action identification to assure thatthe level of goal definition does not resemble the degree of actionidentification. Action identification refers to different cognitive levelsof abstraction varying from low (detailed, specific) to high (abstract,general meaning) (cf. Vallacher & Wegner, 1989). We are thankfulto an anonymous reviewer for pointing out this possibility. Aregression of these different goal aspects on the goal definitionmeasure indicated that none of these variables was significantlypredictive of goal definition (b values ranging from �.09 to .09).Thus, the degree of goal definition did not correspond to these otherpossible aspects of goal representation. Furthermore, a factoranalysis (with orthogonal rotation) over the items of goal definitionand the additional goal items yielded a 3-factor solution explaining71 percent of the overall variance. The first factor consisted of allitems representing the level of action identification (factor loadingsall above .69) except the familiarity item, which loaded on the thirdfactor (factor loading: .88). The goal definition items loaded all onthe second factor (factor loadings all above .69). Thus, this analysisalso indicated that the minimal-maximal goal definition can bedifferentiated from the degree of action identification.
S.R. Giessner, D. van Knippenberg / Organizational Behavior and Human Decision Processes 105 (2008) 14–35 25
impossible for inexperienced users to participate in thesurvey more than once. We advertised the study on dif-ferent internet portals for psychological studies (includ-ing subject pools of employees) and via the newsletter ofthe International Leadership Association (i.e., an orga-nization of practitioners and academics). Participantsreceived no incentive for their participation. Therefore,we made the questionnaire as short as possible, andreduced the numbers of items of some of the scales usedin Studies 1 and 2. We assured respondents at the begin-ning that the research would be conducted anony-mously. Finally, we debriefed participants shortly afterthe study and through the web-sites on which the studywas advertised.
At the beginning of the study, participants wereasked to think of a leader they have or had. We madevery clear that the leader should be or should havebeen their leader. Next, participants had to answer a3-item scale measuring perceived leader prototypicality
(e.g., ‘‘This leader represents what is characteristicabout my team’’; adapted from Platow & van Knip-penberg, 2001). The scale was sufficiently reliable(see Table 3 for descriptive information). Subse-quently, participants had to indicate their degree oftrust in leadership (‘‘I trust this leader absolutely’’;‘‘I think this leader does/did the right things’’; ‘‘Ithink that this leader is trustworthy’’). Additionally,we included three items specifically measuring the per-ceived leader commitment to the team (‘‘This leader isvery committed toward his/her team’’; ‘‘This leaderwants the best for his/her team’’; ‘‘This leader aimsto gain benefits for the whole team’’; adapted fromvan Knippenberg & van Knippenberg, 2005). A prin-cipal component analysis with varimax rotation overall nine items yielded a two-factor solution explaining81 percent of the overall variance. The first factorincluded all general trust items and the specific trustitems related to commitment to the team (all load-ings > .71). The second factor included the three lea-der prototypicality items (all loadings > .79).Therefore, we computed the means of the two scales.
After the participants had answered these scales,they were asked to think of a situation in which their
leader had failed to achieve a goal. They could use atext box to describe this situation. Afterwards, partic-ipants had to think about the specific goal of the sit-uation and to answer a 3-item scale measuring goal
definition (i.e., adapted versions of items 1, 2, and 4from Appendix A). The scale was sufficiently reliable.In addition, participants were also asked in how farthe task was difficult, complex, familiar, needed a lotof enactment time, and needed a lot of learning time
(adapted from Vallacher & Wegner, 1989). Theseitems measured the degree of action identification ofthe task.5 Subsequently, a 4-item scale measured per-ceived leader effectiveness as used in Studies 1 and 2.Next, we asked participants how much the leaderwas responsible for the outcome of the task andhow much circumstances outside the leader’s controlwere responsible for the outcome of the task (both1-item measures). We used a difference score of thesetwo items as a measure of responsibility attribution.Finally, the participants were asked to indicate theirdemographics (i.e., gender, age, branch of employ-ment, years of employment, residence country).

1
2
3
4
5
6
7
Low leader groupprototypicality
High leader groupprototypicality
More minimal goaldefinition
More maximal goaldefinition
Fig. 2. Simple slopes analysis of Study 3. Leadership effectiveness isthe dependent variable.
26 S.R. Giessner, D. van Knippenberg / Organizational Behavior and Human Decision Processes 105 (2008) 14–35
Results
Trust in leadership
We conducted a hierarchical regression analysis. Inthe first step, we regressed trust in leadership on leaderprototypicality and goal definition. In the second step,we added the leader prototypicality by goal definitioninteraction to the equation. Whereas the first step ofthe regression explained a significant portion of the var-iance in trust, F(2,57) = 39.00, p < .001, R2change = .58,the second step did not significantly explain additionalvariance, F(1, 56) = 0.26, p = .62, R2change < .01. Thevariance in the first step was significantly explained byleadership prototypicality, b = .75, SE b = .09,t(57) = 8.56, p < .001, and not by goal definition,b = .03, SE b = .11, t(57) = 0.25, p = .80. Thus, as pre-dicted, the more prototypical the leader was perceivedto be, the higher trust in leadership was.
Responsibility attribution
A hierarchical regression analysis predicting responsi-bility attribution by goal definition and leader prototyp-icality in the first step and the interaction in the secondstep yielded no significant relationships. Thus, responsi-bility attribution was not influenced by perceptions ofleader prototypicality and perceptions of goal definitionwhen the leader failed.
Leadership effectiveness
We predicted an interactive effect of leader prototyp-icality and goal definition on leadership effectiveness.Therefore, we conducted a hierarchical regression anal-ysis in which we regressed leadership effectiveness onleader prototypicality and goal definition and, in a sec-ond step, added the interaction (see Table 4). The firststep explained a significant amount of variance. Moreimportantly, the second step explained an additionalsignificant proportion of the variance in leadership effec-tiveness. Following Aiken and West (1991), we deter-mined the regression slopes for more minimal andmore maximal goals separately (see Fig. 2). As pre-dicted, leader prototypicality yielded a stronger positiverelationship to leadership effectiveness evaluations
Table 4Summary of regression analysis for leader prototypicality and goal definitio
Variable b
Step 1Leader prototypicality .54Goal definition .39
Step 2Leader prototypicality .55Goal definition .37Leader prototypicality · goal definition .16
Note. The explained variance of Step 1 was R2 = .40. Step 2 explained an ad
under a more maximal goal definition, b = .77, SEb = .15, t(56) = 5.09, p < .001, than under a more mini-mal goal definition, b = .33, SE b = .14, t(57) = 2.34,p = .02.
Analyses of conditional indirect effects
As in the previous study, we tested moderated medi-ation with a test of conditional indirect effects as sug-gested by Preacher et al. (in press). Again, we testedour specific model involving a conditional indirect effect(see Fig. 1) with the four step procedure. Thus, in a firststep, we predicted trust in leadership from leader proto-typicality (Mediator Variable Model). In a second step,we predicted leadership effectiveness from leader proto-typicality, trust in leadership, goal definition, and thegoal definition by trust in leadership interaction. In thethird step, we tested the conditional indirect effect ofthe independent variable on the dependent variablesthrough the mediator at the mean and at one standarddeviation above and below the mean of the moderator.Because this test assumes a normal distribution (Shrout& Bolger, 2002), we verified the specific conditional indi-rect effects with a bootstrapping procedure.
The Mediator Variable Model indicated that leaderprototypicality significantly predicted trust in leader-ship (see Table 5 for all statistics). The significant
n predicting leadership effectiveness
SE b b t p
.11 .50 4.80 <.001
.14 .29 2.74 .008
.11 .52 5.11 <.001
.14 .27 2.68 .01
.07 .22 2.22 .03
ditional variance of R2change = .05.

Table 5Test of the conditional indirect effects in Study 3
b SE b t p
Mediator Variable Model (Step 1)
Leader prototypicality .75 .85 8.90 <.001
Dependent Variable Model (Step 2)
Leader prototypicality .05 .15 .36 .72Trust in leadership .64 .14 4.36 <.001Goal definition .38 .12 3.05 .004Goal definition · trust in leadership .12 .07 1.98 .05
Level of goal definition Indirect effect SE z p
Conditional indirect effects (Step 3)
�1 SD .35 .13 2.69 .007Mean .48 .12 3.89 <.001+1 SD .62 .16 3.98 <.001
Conditional indirect effects with bootstrap method (Step 4)
�1 SD .34 .14 2.41 .02Mean .48 .13 3.80 <.001+1 SD .62 .14 4.40 <.001
S.R. Giessner, D. van Knippenberg / Organizational Behavior and Human Decision Processes 105 (2008) 14–35 27
interaction between trust in leadership and goal defini-tion in the second step implies that the indirect effectof leader prototypicality on leadership effectivenessthrough trust in leadership is moderated by goal def-inition. In addition, the sign of the interaction indi-cates that the indirect effect is larger for themaximal than the minimal goal condition. Subsequenttests of the conditional indirect effects with normalityassumptions (Step 3) as well as with a bootstrappingprocedure (Step 4) show that the indirect effect isstronger under more maximal goal perceptions(+1 SD) than under minimal goal perceptions (�1SD). In sum, the moderated mediation analysis pro-vides support for our hypothesized model.
Discussion
Participants in this study had to think of their pres-ent (or past) leader and of a task in which the leaderfailed. Thus, all evaluations of the leader and the goalwere based on real situations in organizations. Study 3replicated the results of Studies 1 and 2 in a field con-text. Therefore, these results support our social iden-tity framework in predicting leadership evaluationsafter leader failure. The results also indicate thatresponsibility attributions towards the leader do notexplain the effects of the independent variables on per-ceptions of leadership effectiveness. Finally, we showedthat our trust in leadership measure also reflects per-ceived commitment towards the team. This finding isin line with our social identity framework, whichassumes that greater trust in more prototypical leadersin part reflects trust in the leader’s group-orientedness(van Knippenberg & Hogg, 2003; van Knippenberg &van Knippenberg, 2005).
Study 4
In Study 4, we aim to provide further support forour social identity framework. Based on our theoreti-cal framework, we would also predict that the hypoth-esized processes play a stronger role the strongerfollowers identify with their team. Therefore, the maingoal of this study was to contrast a condition inwhich followers identify strongly with their team toa condition in which followers identify weakly withtheir team. We predict that our hypothesized modelshould yield stronger effects in the condition in whichparticipants identify strongly with their team, becauseunder such conditions perceptions of leader prototyp-icality should be more influential for leadership evalu-ations (Hogg, 2001; Hogg & van Knippenberg, 2003;van Knippenberg & Hogg, 2003). To test this predic-tion, we adapted the paradigm used in Study 2 andmanipulated participants’ degree of team identifica-tion. We only focused on leader failure, as we havepreviously shown that our analysis applies to leaderfailure and not to leader success. In addition, weagain measured perceived leader responsibility of thetask failure.
Methods
Participants and design
Ninety-five undergraduate business administrationstudents (29 females, 66 males) took part in the study.The sample was aged between 18 and 28 years(M = 20.93, SD = 2.23). A 2 (identification) · 2 (leaderprototypicality) · 2 (goal definition) between-subjectsdesign was used. Participants were randomly assignedto one of the eight conditions.

6 Separate 2 (identification) · 2 (leader prototypicality) · 2 (goaldefinition) between-subjects ANOVAs on perceived goal difficulty,complexity, and familiarity yielded neither significant main effects norsignificant interaction effects (all Fs < 1.81). Hence, the minimal andmaximal goals were perceived to a similar degree as difficult, complex,and familiar.
28 S.R. Giessner, D. van Knippenberg / Organizational Behavior and Human Decision Processes 105 (2008) 14–35
Procedure and measures
The study was conducted as part of a series of studies.Each participant received 10 euro for participation in allstudies. The other studies were not related to the currentstudy and instructions provided participants with a clearstatement of this. Participants were placed in separatecubicles. All manipulations and questions were providedthrough a computer. The study was announced as astudy about leadership.
All participants were asked to imagine that they workin an international consultancy company with a verygood reputation, and that they work in a team withother employees. In the identification manipulation,participants had to imagine different degrees of psycho-logical linkage to their team (adapted from van Knip-penberg, Martin, & Tyler, 2006). Identification is to animportant extent based on perceived similarity and one-ness between self and group (Ashforth & Mael, 1989;Tajfel & Turner, 1986; Turner et al., 1987). In the high
identification condition, we told participants that theother team members were former students coming fromthe same university as the participant, were very similarto them, and were having similar attitudes. Further-more, participants had to imagine a very good matchbetween themselves and the consultancy company ingeneral (i.e., in terms of feeling good to work there).In the low identification condition, the other team mem-bers were described as people with whom they had noconnection, were different from them, and were havingdifferent attitudes. Participants had to envision a verylow match between themselves and the consultancycompany in general. Hereafter, we measured the per-ceived degree of team identification with three items(e.g., ‘‘I identify with my team’’; a = 98). If not men-tioned differently, all answers were rated on 7-pointscales ranging from 1 (totally disagree) to 7 (totally
agree).Subsequently, the manipulation of leader prototypi-
cality followed (adapted from van Knippenberg & vanKnippenberg, 2005). The description of a prototypicaland non-prototypical leader was exactly the same as inStudy 2. Following the prototypicality manipulation,we included two items to measure perceived leader pro-totypicality (adapted from Platow & van Knippenberg,2001). The average of the items (a = .97) served as ourmanipulation check. Next, participants had to answera 3-item scale measuring trust in leadership (‘‘I com-pletely trust my leader’’; ‘‘My leader considers thegroup’s interest in the first place’’; ‘‘My leader onlywants the best for the team’’; a = .83).
Afterwards, the third part of the scenario includedthe manipulation of goal definition. This manipulationwas exactly the same as in Study 2. All participantsreceived the information that the leader failed in the task(i.e., he acquired new business volume of 145 millioneuro). Hereafter, two questions were included which
had two purposes (see also Study 2). First, they servedto check whether participants picked upon the perfor-mance information. Second, the first item reinforcedthe manipulation of goal definition. Participants hadto first answer how much money (i.e., in million euro)the team leader either should ideally or must at leastacquire. The correct answer was ‘‘200’’. The secondquestion asked about how much the leader had actuallyacquired. The correct answer for this question was‘‘145’’.
Next, perceived leadership effectiveness was measuredwith the same 6-item scale as used in the Studies 1 and 2.The answer on the item asking about the leader’s futuresuccess was not recorded, because of a program error ofour software. A principal component analysis over theremaining five items yielded only one factor explaining79 percent of the variance. The internal consistency ofthe 5-item scale was very high (a = .93). The mean ofthis scale was used for the analyses. Afterwards, weincluded two questions asking directly how much (a)the leader and (b) external factors outside the leader’scontrol were responsible for the performance result. Adifference score served as a measure of perceived leader
responsibility for the failure. The score ranged from 6(=leader is fully responsible) to �6 (factors outside theleader’s control are responsible). After that, we includedsome additional questions about the level of action iden-tification (see also Study 3). More precisely, participantshad to rate single items on (1) how difficult they per-ceived the goal, (2) how complex they perceived the goal,and (3) how familiar they were with the goal.6 Finally,we asked demographic questions: gender, age, andemployment status.
Results
Manipulation checks
We conducted separate 2 (identification) · 2 (leaderprototypicality) · 2 (goal definition) between-subjectsANOVAs on the team identification and leader proto-typicality measures. The identification manipulationhad a main effect on team identification, F(1,87) =548.10, p < .001, gp
2 = .86. Participants in the high iden-tification condition indicated stronger team identifica-tion (M = 5.96, SD = .95) than participants in the lowidentification condition (M = 1.71, SD = .79). Theanalysis yielded no other effects on team identification.The leader prototypicality manipulation had asignificant effect on the leader prototypicality measure,
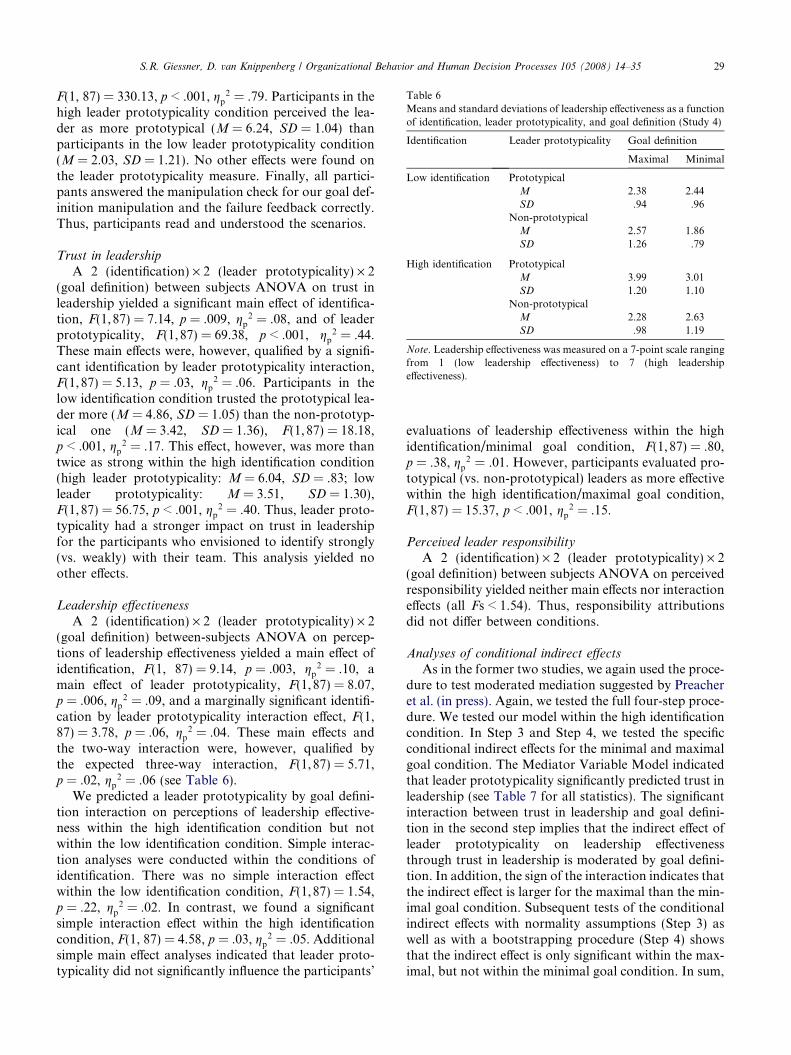
Table 6Means and standard deviations of leadership effectiveness as a functionof identification, leader prototypicality, and goal definition (Study 4)
Identification Leader prototypicality Goal definition
Maximal Minimal
Low identification PrototypicalM 2.38 2.44SD .94 .96
Non-prototypicalM 2.57 1.86SD 1.26 .79
High identification PrototypicalM 3.99 3.01SD 1.20 1.10
Non-prototypicalM 2.28 2.63SD .98 1.19
Note. Leadership effectiveness was measured on a 7-point scale rangingfrom 1 (low leadership effectiveness) to 7 (high leadershipeffectiveness).
S.R. Giessner, D. van Knippenberg / Organizational Behavior and Human Decision Processes 105 (2008) 14–35 29
F(1, 87) = 330.13, p < .001, gp2 = .79. Participants in the
high leader prototypicality condition perceived the lea-der as more prototypical (M = 6.24, SD = 1.04) thanparticipants in the low leader prototypicality condition(M = 2.03, SD = 1.21). No other effects were found onthe leader prototypicality measure. Finally, all partici-pants answered the manipulation check for our goal def-inition manipulation and the failure feedback correctly.Thus, participants read and understood the scenarios.
Trust in leadership
A 2 (identification) · 2 (leader prototypicality) · 2(goal definition) between subjects ANOVA on trust inleadership yielded a significant main effect of identifica-tion, F(1,87) = 7.14, p = .009, gp
2 = .08, and of leaderprototypicality, F(1, 87) = 69.38, p < .001, gp
2 = .44.These main effects were, however, qualified by a signifi-cant identification by leader prototypicality interaction,F(1, 87) = 5.13, p = .03, gp
2 = .06. Participants in thelow identification condition trusted the prototypical lea-der more (M = 4.86, SD = 1.05) than the non-prototyp-ical one (M = 3.42, SD = 1.36), F(1, 87) = 18.18,p < .001, gp
2 = .17. This effect, however, was more thantwice as strong within the high identification condition(high leader prototypicality: M = 6.04, SD = .83; lowleader prototypicality: M = 3.51, SD = 1.30),F(1, 87) = 56.75, p < .001, gp
2 = .40. Thus, leader proto-typicality had a stronger impact on trust in leadershipfor the participants who envisioned to identify strongly(vs. weakly) with their team. This analysis yielded noother effects.
Leadership effectiveness
A 2 (identification) · 2 (leader prototypicality) · 2(goal definition) between-subjects ANOVA on percep-tions of leadership effectiveness yielded a main effect ofidentification, F(1, 87) = 9.14, p = .003, gp
2 = .10, amain effect of leader prototypicality, F(1, 87) = 8.07,p = .006, gp
2 = .09, and a marginally significant identifi-cation by leader prototypicality interaction effect, F(1,87) = 3.78, p = .06, gp
2 = .04. These main effects andthe two-way interaction were, however, qualified bythe expected three-way interaction, F(1, 87) = 5.71,p = .02, gp
2 = .06 (see Table 6).We predicted a leader prototypicality by goal defini-
tion interaction on perceptions of leadership effective-ness within the high identification condition but notwithin the low identification condition. Simple interac-tion analyses were conducted within the conditions ofidentification. There was no simple interaction effectwithin the low identification condition, F(1,87) = 1.54,p = .22, gp
2 = .02. In contrast, we found a significantsimple interaction effect within the high identificationcondition, F(1, 87) = 4.58, p = .03, gp
2 = .05. Additionalsimple main effect analyses indicated that leader proto-typicality did not significantly influence the participants’
evaluations of leadership effectiveness within the highidentification/minimal goal condition, F(1, 87) = .80,p = .38, gp
2 = .01. However, participants evaluated pro-totypical (vs. non-prototypical) leaders as more effectivewithin the high identification/maximal goal condition,F(1,87) = 15.37, p < .001, gp
2 = .15.
Perceived leader responsibility
A 2 (identification) · 2 (leader prototypicality) · 2(goal definition) between subjects ANOVA on perceivedresponsibility yielded neither main effects nor interactioneffects (all Fs < 1.54). Thus, responsibility attributionsdid not differ between conditions.
Analyses of conditional indirect effects
As in the former two studies, we again used the proce-dure to test moderated mediation suggested by Preacheret al. (in press). Again, we tested the full four-step proce-dure. We tested our model within the high identificationcondition. In Step 3 and Step 4, we tested the specificconditional indirect effects for the minimal and maximalgoal condition. The Mediator Variable Model indicatedthat leader prototypicality significantly predicted trust inleadership (see Table 7 for all statistics). The significantinteraction between trust in leadership and goal defini-tion in the second step implies that the indirect effect ofleader prototypicality on leadership effectivenessthrough trust in leadership is moderated by goal defini-tion. In addition, the sign of the interaction indicates thatthe indirect effect is larger for the maximal than the min-imal goal condition. Subsequent tests of the conditionalindirect effects with normality assumptions (Step 3) aswell as with a bootstrapping procedure (Step 4) showsthat the indirect effect is only significant within the max-imal, but not within the minimal goal condition. In sum,

Table 7Test of the conditional indirect effects in Study 3 (within the high identification condition)
b SE b t p
Mediator Variable Model (Step 1)
Leader prototypicality 1.26 .16 8.04 <.001
Dependent Variable Model (Step 2)
Leader prototypicality .21 .24 .88 .39Trust in leadership .23 .14 1.57 .12Goal definition .13 .15 .87 .39Goal definition · trust in leadership .27 .09 2.90 .006
Level of goal definition Indirect effect SE z p
Conditional indirect effects (Step 3)
Minimal goal level �.05 .22 �.24 .81Maximal goal level .63 .23 2.75 .006
Conditional indirect effects with bootstrap method (Step 4)
Minimal goal level �.05 .27 �.17 .86Maximal goal level .64 .22 2.92 .003
30 S.R. Giessner, D. van Knippenberg / Organizational Behavior and Human Decision Processes 105 (2008) 14–35
the moderated mediation analysis once more providessupport for our model.
Discussion
The results of Study 4 corroborate the results ofthe other studies. In addition they show that as pre-dicted team identification moderated the interactiveeffect of leader prototypicality and goal definition.Only when participants imagined themselves in therole of a strongly identifying team member did infor-mation about leader prototypicality and goal defini-tion interact to influence perceptions of leadershipeffectiveness. An obvious caveat of this study is therole playing scenario paradigm. Nevertheless, theresults confirm the results found in the field (Study3) and in the laboratory (Study 1). Thus, togetherwith the other studies, Study 4 bolsters the confidencein our theoretical framework and our specific model.In addition, we could again show that responsibilityattributions did not have a mediating influence onperceptions of leadership effectiveness.
General discussion
Most leaders inevitably have to deal with failures toachieve group or organizational goals. In view of theevidence that people tend to attribute such failures toleadership (Lord et al., 1978; Meindl et al., 1985), animportant question from the perspective of leadershipeffectiveness is which factors may moderate the impactof the failure to achieve goals on leaders’ basis for effec-tive leadership (i.e., followers’ leadership endorsement).We argue that under certain conditions a failing leadermay still be endorsed. Based on a social identity frame-
work (Hogg, 2001; Hogg & van Knippenberg, 2003; vanKnippenberg & Hogg, 2003), we hypothesize that fol-lower perceptions are influenced by perceptions of lea-der prototypicality (i.e., in how far the leader isperceived as embodying the group’s identity). A moreprototypical leader receives more trust in leadership,because he or she is perceived as having the group’sinterest at heart (van Knippenberg & Hogg, 2003; vanKnippenberg & van Knippenberg, 2005). This, in turn,gives the leader leeway, in a sense a ‘‘license to fail’’,and results in relatively positive leadership evaluationsafter failure. However, a straightforward applicationof the social identity analysis as advanced in previouswork (e.g., Hogg, 2001; Hogg & van Knippenberg,2003; van Knippenberg & Hogg, 2003) would not besufficient to explain leader endorsement after failure.Rather, recognition-based processing (i.e., processingrelated to the perception of the leader) as well as infer-ence-based processing (i.e., processing related to the out-comes of an event) influence leadership perceptions(Ensari & Murphy, 2003; Lord & Maher, 1991). Wetherefore argue that goal definition should influence inhow far followers provide their leader with leeway tofail. Building on principles determining the valence ofevents (Brendl & Higgins, 1996; Kessler et al., 2006),we predict that goals can differ in their framing as min-imal or maximal, which would affect the perception ofdeviations from goal achievement. Whereas failure toachieve a maximal goal is evaluated on a continuousscale and therefore leaves leeway for differential evalua-tions after failure, minimal goal achievement is evalu-ated in an either-or-fashion and thus leaves no leewayfor different evaluations after failure (cf. Kessler et al.,2006; Schubert et al., 2005). Consequently, we arguethat the greater trust in prototypical (vs. non-prototyp-ical) leaders only results in relatively positive evaluations
S.R. Giessner, D. van Knippenberg / Organizational Behavior and Human Decision Processes 105 (2008) 14–35 31
of leadership after failure if the goal definition is maxi-mal (vs. minimal). The current research supports thismodel in a series of four studies using different para-digms and populations of participants.
Implications for the social identity analysis of leadership
Consistent with the social identity analysis of leader-ship, the current findings suggest that leader prototypi-cality may color responses to leader failure to achieveperformance goals, and that this effect of prototypicalityderives from followers’ greater trust in prototypicalleaders (Hogg & van Knippenberg, 2003; van Knippen-berg & Hogg, 2003). However, so far, the social identityanalysis of leadership has been mainly an analysis ofsocial influence processes based on group membership(i.e., leader prototypicality) or leader behavior. Anunderstanding of how followers evaluate leaders afterperformance feedback also requires consideration ofthe actual performance goal. We argue that leader pro-totypicality would lead followers to view leader failureto reach performance goals in a relatively favorablelight. Goal definitions (in terms of minimal vs. maximalgoals) feed into the subjective room for interpretation offailure to achieve a goal, and should therefore moderatethe influence of leader prototypicality via trust in leader-ship. By thus integrating insights from goal definitiontheory (Brendl & Higgins, 1996; Kessler et al., 2006) intothe social identity analysis of leadership, we are able tomore fully and firmly extend the social identity analysisto leadership endorsement after failure.
A central variable in our model is trust in leadership.The social identity analysis of leadership also identifies anumber of other factors that either feed into trust inleadership or that render followers more sensitive to lea-der prototypicality (cf. van Knippenberg & Hogg, 2003).On the basis of the current analysis, we would expectthat these factors may also affect the influence of goalachievement on leadership endorsement. More specifi-cally, the social identity analysis points to leadergroup-oriented behavior—leader behavior that suggestthat the leader is committed to the group and acts withthe group’s best interest in mind—as a source of trust inleadership (Hogg & van Knippenberg, 2003; van Knip-penberg & Hogg, 2003). van Knippenberg and vanKnippenberg (2005) for instance showed that leaderself-sacrifice on behalf of the group or organizationincreased followers’ trust in the leader’s group-oriented-ness, and rendered non-prototypical leaders as effectiveas prototypical leaders in eliciting positive perceptionsof leadership and engendering follower performance.Accordingly, we may predict that leader group-orientedbehaviors such as leader self-sacrifice, group-favoringdecisions (Platow & van Knippenberg, 2001), or appealsto the collective interest (Platow et al., 2006) increasetrust in leadership and thus render follower responses
to leader failure to achieve performance goals relativelymore favorable. Recently, van Knippenberg, van Knip-penberg, and De Cremer (2005) have shown that leaderprocedural fairness (De Cremer et al., 2005; De Cremer& van Knippenberg, 2002) may similarly increase trustin leadership (cf. Brockner, Siegel, Daly, Tyler, & Mar-tin, 1997) and render non-prototypical leaders as effec-tive in eliciting follower cooperative behavior asprototypical leaders. Thus, we may predict that leaderprocedural fairness may also protect leaders to a certainextent against negative reactions after failure to reachgroup or organizational goals.
An interesting direction for future research mightbe to look into changes of trust in leadership as aresult of performance information. We argue that aprototypical leader elicits more trust in leadership oridiosyncrasy credit than a non-prototypical leader.The prototypical leader might, however, lose thesecredits if he or she fails. In contrast, a non-prototyp-ical leader might not have that many credits to loseanyway. In other words, we used a rather fixed con-ceptualization of trust in leadership in this research,but we would assume that this variable is dynamicover time.
Regulatory foci and prior leader performance as
precursors to goal definition
The present findings show that goal definition interms of minimal vs. maximal goals (Brendl & Higgins,1996; Kessler et al., 2006) moderates the impact of lea-der prototypicality via trust in leadership on perceptionsof leadership effectiveness. An implication of this findingis that factors that affect followers’ subjective goal defi-nition (i.e., followers’ subjective perception of perfor-mance goals) may inform leadership endorsement afterleader failure to reach performance goals. Research onminimal vs. maximal goal definition suggests two suchfactors.
Research by Idson, Liberman, and Higgins (2000)suggests that the differentiation between minimal andmaximal goals may be related to different regulatory sys-tems. Regulatory Focus Theory differentiates two dis-tinct regulatory systems: a promotion focus concernedwith nurturance and a prevention focus concerned withsecurity (Higgins, 1997, 1998). Promotion focus con-cerns involve individuals’ self-regulation in relation totheir hopes and aspirations (i.e., ideals). Success andfailure under a promotion focus are experienced as thepresence of positive outcomes (i.e., gains) and theabsence of positive outcomes (i.e., non-gains). Preven-tion focus concerns involve individuals’ self-regulationin relation to their duties and obligations (i.e., oughts).Success and failure under a prevention focus are experi-enced as the presence of negative outcomes (i.e., loss)and the absence of negative outcomes (i.e., non-loss).

32 S.R. Giessner, D. van Knippenberg / Organizational Behavior and Human Decision Processes 105 (2008) 14–35
Individuals can chronically and situationally differ inself-regulatory focus. Furthermore, individuals with apromotion focus may be more likely to perceive per-sonal goals as maximal, whereas individuals with a pre-vention focus may be more likely to perceive personalgoals as minimal (Brendl & Higgins, 1996; Idson et al.,2000).
Whereas Regulatory Focus Theory explains individ-ual motivations and feelings about personal goals, ourresearch concentrates on perceived goals for a leader
(i.e., another individual). In this sense our research can-not be equated with research on Regulatory Focus The-ory. However, recent research showed that self-regulation operates on a group level if individuals cate-gorize themselves as group members (Sassenberg, Kess-ler, & Mummendey, 2003). In other words, events thatare relevant for the group become relevant for individ-ual’s self-regulation. The leader’s performance mostoften is relevant for followers, because they depend onthe leader. Therefore, we may speculate that individualregulatory foci of followers might influence how leaders’performance on goals is perceived. In other words, situ-ational or individual differences associated with the acti-vation of promotion focus concerns vs. prevention focusconcerns might affect not only the personal goal defini-tion in terms of maximal vs. minimal goals, but alsohow followers perceive goal definitions of leaders.
A bit more speculatively, we may also predict thatprior performance affects subjective goal definition (cf.Brendl & Higgins, 1996). Leaders’ performance on goalachievement typically is not a one-shot event, but mayalso be judged in the light of prior achievements of theleader. Thus, previous success or failure of the leadermight influence followers’ leadership perceptions afterfailure. One may speculate that a history of failure ren-ders it more likely that future performance goals will beseen as minimal goals—after repeated failure, there maybe little patience with failure to achieve performancegoals and a clear desire for success in goal achievement.Vice versa, a history of success may render a perceptionof future goals as maximal goals more likely. Thus, priorperformance of the leader may affect follower subjectivegoal definition, and therefore affect leadership percep-tions after failure. Again, the proof of the pudding isin the eating, and future research will have to provethe merits of these propositions.
Caveats and limitations
Of course, the present study is not without its weak-nesses and limitations. Each paradigm we used has cer-tain weaknesses in terms of causality, generalization,manipulation, or measurement. For instance, partici-pants were placed in a minimal social environment inStudy 1 or had to imagine a leader in Study 2 and 4.Although we used a critical incident technique so that
participants had to evaluate real cases of leader failurein Study 3, the paradigm might be influenced byhindsight biases. However, the strength lies in the over-all consistent effects in all four studies. Our model pro-vides a parsimonious explanation of the results in allstudies.
Another issue to consider is that while our studiesprovide insight into the factors affecting responses toleader failure to achieve group or organizational goals,this does not mean that more favorable responses aremore desirable (or less desirable) from the perspectiveof the group or organization. More favorable responsesmay be assumed to be more desirable from the perspec-tive of the leader, or put differently, from the perspectiveof leadership effectiveness, which is typically defined asthe leaders’ ability to influence and mobilize followers(Chemers, 2001; Yukl, 2001). From the perspective ofthe group or organization, however, responses to leaderfailure seem to be a double-edged sword. On the onehand, continuing endorsement of failing and incompe-tent leaders would seem highly undesirable, and rela-tively favorable responses to leaders associated withfailure to achieve performance goals may be a bad thingfrom the perspective of the organization. On the otherhand, the very issue raised by Lord, Meindl, and others(e.g., Lord et al., 1978; Meindl et al., 1985) was that peo-ple may over-attribute performance outcomes to leader-ship, and from that perspective some constraint injudging leaders negatively after failure to reach perfor-mance goals would seem in order. Moreover, from theperspective of group and organizational learning andinnovation it would seem important that there is someroom for errors, mistakes, and failure to reach perfor-mance goals, and a tendency to pass harsh judgmenton leaders associated with failure might be a negativething. Thus, the present findings should be seen as per-taining to leaders’ basis for leadership effectiveness,and should be treated more carefully when it comes toconclusions regarding the more desirable outcomes forgroups and organizations.
Implications for leadership practice
Although we should be careful not to build too big aclaim about the implications of the current findings forpractice, they do point at some issues that might be con-sidered from a more applied point of view. First,although responding relatively favorably or unfavorablyto leaders associated with failure to realize group ororganizational goals is not categorically good or bad,we should be aware of the fact that leader prototypical-ity and goal definition, and probably also (other) factorsthat influence trust in leadership, sensitivity to prototyp-icality, or goal definition, color responses to leadershipafter failure. Thus, for decisions about leadership (e.g.,promotion decisions) that are contingent on leader per-

S.R. Giessner, D. van Knippenberg / Organizational Behavior and Human Decision Processes 105 (2008) 14–35 33
formance, organizations should not only be aware of thegeneral ‘‘romance of leadership’’ (Meindl et al., 1985)but also of more specific factors moderating thisromance.
Prototypicality is not merely a ‘‘given’’. Leaders mayalso actively manage the extent to which they conveyan image of prototypicality (Reicher & Hopkins,2003; van Knippenberg & Hogg, 2003), and the presentfindings suggest that effective ‘‘prototypicality manage-ment’’ may inoculate the leader’s basis for leadershipeffectiveness to a certain extent against the negativeconsequences of failure to realize group and organiza-tional goals. In a similar vein, to the extent that leaderscan actively manage goal definitions, framing goals asmaximal goals may provide leaders with somewhat ofa safety net in case of failure to reach goals. As yet,most evidence for leaders’ ability to actively managesuch perceptions is qualitative (Reicher & Hopkins,2003), and further research addressing these issues
Appendix A
Competing statements of the Minimal/Maximal Scale
Minimal goal
1 I think that this goal was only about reaching or notreaching and nothing in between
2 I think that this goal must be at least reached by theleader. Hence, everything below this goal is a clearfailure
3 I believe that this goal was termed: ‘‘The leader mustat least get 200 points’’!
4 I think that not reaching the goal was not an optionfor the leader
5 The leader should never and under no circumstancesfail this goal
may also yield important implications for leadershippractice.
To conclude
Associations of leaders with success or failure toachieve group or organizational goals arguably areone of the more important influences on leadershipperceptions, and consequently on leaders’ basis toinfluence and mobilize followers. From that perspec-tive, it is somewhat surprising that research to dateseems to have hardly moved beyond the ‘‘main effect’’of performance feedback described by Lord, Meindl,and others (for an exception see Ensari & Murphy,2003). The present study hopes to have given thisarea of research new impetus by pointing at the valueof an analysis of responses to leader goal achievementin terms of social identity and goal definitionprocesses.
Maximal goal
I think that this goal was about reaching it and adeviation of not reaching it can be tolerated
I think that this goal is more an ideal goal for the leader.Hence, not reaching this goal is not necessarily a clearfailure
I believe that this goal was termed: ‘‘The leader shouldideally get about 200 points’’!
I think that not reaching the goal was still possible forthe leader
The leader could fail this goal, although he should try toavoid if possible
References
Aiken, L. S., & West, S. G. (1991). Multiple regression: Testing and
interpreting interactions. Newbury Park, CA: Sage.Ashforth, B. E., & Mael, F. A. (1989). Social identity theory
and the organization. Academy of Management Review, 14,20–39.
Awamleh, R., & Gardner, W. L. (1999). Perceptions of leadercharisma and effectiveness: The effects of vision content, delivery,and organizational performance. Leadership Quarterly, 10,345–373.
Baron, R. M., & Kenny, D. A. (1986). The moderator-mediatorvariable distinction in social psychological research: Conceptual,strategic, and statistical considerations. Journal of Personality and
Social Psychology, 51, 1173–1182.
Baumeister, R. F., Bratslavsky, E., Finkenauer, C., & Vohs, K. D.(2001). Bad is stronger than good. Review of General Psychology, 5,323–370.
Birnbaum, M. H. (2004). Human research and data collection via theInternet. Annual Review of Psychology, 55, 803–832.
Brendl, C. M., & Higgins, E. T. (1996). Principles of judging valence:What makes events positive or negative? In M. P. Zanna (Ed.).Advances in experimental social psychology (Vol. 28, pp. 95–160).San Diego, CA: Academic Press.
Brewer, M. B. (1979). In-group bias in the minimal intergroupsituation: A cognitive-motivational analysis. Psychological Bulletin,
86, 307–324.Brockner, J., Siegel, P. A., Daly, J. P., Tyler, T. R., & Martin, C.
(1997). When trust matters: The moderating effect of outcomefavorability. Administrative Science Quarterly, 42, 558–583.
34 S.R. Giessner, D. van Knippenberg / Organizational Behavior and Human Decision Processes 105 (2008) 14–35
Brown, D. J., Cober, R. T., Kane, K., Levy, P. E., & Shalhoop, J.(2006). Proactive personality and the successful job search: A fieldinvestigation with college graduates. Journal of Applied Psychology,
91, 717–726.Chemers, M. M. (2001). Leadership effectiveness: An integrative
review. In M. A. Hogg & R. S. Tindale (Eds.), Blackwell handbook
of social psychology: Group processes (pp. 376–399). Oxford, UK:Blackwell.
De Cremer, D., & van Knippenberg, D. (2002). How do leaderspromote cooperation? The effects of charisma and proceduralfairness. Journal of Applied Psychology, 87, 858–866.
De Cremer, D., & van Knippenberg, D. (2004). Leader self-sacrificeand leadership effectiveness: The moderating role of leader self-confidence. Organizational Behavior and Human Decision Processes,
95, 140–155.De Cremer, D., van Knippenberg, B., van Knippenberg, D., Mul-
lenders, D., & Stinglhamber, F. (2005). Rewarding leadership andfair procedures as determinants of self-esteem. Journal of Applied
Psychology, 90, 3–12.Dirks, K. T., & Ferrin, D. L. (2002). Trust in leadership: Meta-analytic
findings and implications for research and practice. Journal of
Applied Psychology, 87, 611–628.Edwards, J.R., & Lambert, L.S. (in press). Methods for integrating
moderation and mediation: A general analytical framework usingmoderated path analysis. Psychological Methods.
Efron, B., & Tibishirani, R. J. (1993). An introduction to the bootstrap.Boca Raton, FL: Chapman & Hall.
Ensari, N., & Murphy, S. E. (2003). Cross-cultural variations inleadership perceptions and attribution of charisma to the leader.Organizational Behavior and Human Decision Processes, 92,52–66.
Hains, S. C., Hogg, M. A., & Duck, J. M. (1997). Self-categorization andleadership: Effects of group prototypicality and leader stereotypi-cality. Personality and Social Psychology Bulletin, 23, 1087–1100.
Haslam, S. A. (2001). Psychology in organisations: The social identity
approach. London: Sage.Haslam, S. A., van Knippenberg, D., Platow, M. J., & Ellemers, N.
(Eds.). (2003). Social identity at work: Developing theory for
organizational practice. New York: Psychology Press.Hewstone, M., Rubin, M., & Willis, H. (2002). Intergroup bias. Annual
Review of Psychology, 53, 575–604.Higgins, E. T. (1997). Beyond pleasure and pain. American Psychol-
ogist, 52, 1280–1300.Higgins, E. T. (1998). Promotion and prevention: Regulatory focus as
a motivational principle. In M. P. Zanna (Ed.). Advances in
experimental social psychology (Vol. 30, pp. 1–46). New York:Academic Press.
Hogg, M. A. (2001). A social identity theory of leadership. Personality
and Social Psychology Review, 5, 184–200.Hogg, M. A., & Abrams, D. (1988). Social identifications: A social
psychology of intergroup relations and group processes. London:Routledge.
Hogg, M. A., Hains, S. C., & Mason, I. (1998). Identification andleadership in small groups: Salience, frame of reference, and leaderstereotypicality effects on leader evaluations. Journal of Personality
and Social Psychology, 75, 1248–1263.Hogg, M. A., & Terry, D. J. (2000). Social identity and self-
categorization processes in organizational contexts. Academy of
Management Review, 25, 121–140.Hogg, M. A., & van Knippenberg, D. (2003). Social identity and
leadership processes in groups. In M. P. Zanna (Ed.). Advances in
experimental social psychology (Vol. 35, pp. 1–52). San Diego, CA:Academic Press.
Hollander, E. P. (1964). Leaders, groups, and influence. New York:Oxford University Press.
Idson, L. C., Liberman, N., & Higgins, E. T. (2000). Distinguishinggains from nonlosses and losses from nongains: A regulatory focus
perspective on hedonic intensity. Journal of Experimental Social
Psychology, 36, 252–274.Kessler, T., Neumann, J., Mummendey, A., Schubert, T., & Waldzus,
S. (2006). Minimum goal representation as determinant of explicit
rejection and exclusion of deviants. submitted for publication.Kraut, R., Olson, J., Banaji, M., Bruckman, A., Cohen, J., & Couper,
M. (2004). Psychological research online: Report of board ofscientific affairs’ advisory group on the conduct of research on theinternet. American Psychologist, 59, 105–117.
Locke, E. A. (Ed.). (1986). Generalizing from laboratory to field
settings: Research findings from industrial-organizational psychol-
ogy, organizational behavior, and human resources management.Lexington, MA: Heath-Lexington Books.
Lockwood, C.M., & MacKinnon, D.P. (1998). Bootstrapping thestandard error of the mediated effect. Proceedings of the 23rd
annual meeting of SAS Users Group International (pp. 997–1002).Cary, NC: SAS Institute, Inc.
Lord, R. G., Binning, J. F., Rush, M. C., & Thomas, J. C. (1978). Theeffect of performance cues and leader behavior on questionnaireratings of leadership behavior. Organizational Behavior and Human
Performance, 21, 27–39.Lord, R. G., Foti, R. J., & Phillips, J. S. (1982). A theory of leadership
categorization. In J. G. Hunt, U. Sekaran, & C. Schriesheim (Eds.),Leadership: Beyond establishment views. Carbondale: SouthernIllinois University Press.
Lord, R. G., & Hall, R. (2003). Identity, leadership categorization andleadership schema. In D. van Knippenberg & M. A. Hogg (Eds.),Leadership and power: Identity processes in groups and organizations
(pp. 48–64). London: Sage.Lord, R. G., & Maher, K. (1991). Leadership and information
processing: Linking perceptions and performance. Boston, MA:Unwin Hyman.
Meindl, J. R., & Ehrlich, S. B. (1987). The romance of leadership andthe evaluation of organizational performance. Academy of Man-
agement Journal, 30, 91–109.Meindl, J. R., Ehrlich, S. B., & Dukerich, J. M. (1985). The romance of
leadership. Administrative Science Quarterly, 30, 78–102.Mook, D. G. (1983). In defense of external invalidity. American
Psychologist, 38, 379–387.Morgan-Lopez, A. A., & MacKinnon, D. P. (2006). Demonstration
and evaluation of a method to assess mediated moderation.Behavior Research Methods, 38, 77–87.
Muller, D., Judd, C. M., & Yzerbyt, V. Y. (2005). When moderation ismediated and meditation is moderated. Journal of Personality and
Social Psychology, 89, 852–863.Phillips, J. S., & Lord, R. G. (1981). Causal attributions and
perceptions of leadership. Organizational Behavior and Human
Behavior, 28, 143–163.Platow, M. J., Haslam, S. A., Foddy, M., & Grace, D. M. (2003).
Leadership as the outcome of self-categorization processes. In D.van Knippenberg & M. A. Hogg (Eds.), Leadership and power:
Identity processes in groups and organizations (pp. 34–47). London:Sage.
Platow, M. J., & van Knippenberg, D. (2001). A social identityanalysis of leadership endorsement: The effects of leader ingroupprototypicality and distributive intergroup fairness. Personality and
Social Psychology Bulletin, 27, 1508–1519.Platow, M. J., van Knippenberg, D., Haslam, S. A., van Knippenberg,
B., & Spears, R. (2006). A special gift we bestow on you for beingrepresentative of us: Considering leader charisma from a self-categorization perspective. British Journal of Social Psychology, 45,303–320.
Preacher, K.J., Curran, P.J., & Bauer. D.J. (2003, September). Probing
interactions in multiple linear regression, latent curve analysis, and
hierarchical linear modeling: Interactive calculation tools for estab-
lishing simple intercepts, simple slopes, and regions of significance
[Computer software]. Available from <http:/quantpsy.org/>.

S.R. Giessner, D. van Knippenberg / Organizational Behavior and Human Decision Processes 105 (2008) 14–35 35
Preacher, K.J., Rucker, D.D., & Hayes, A.F. (in press). Addressingmoderated mediation hypotheses: Theory, methods, and prescrip-tions. Multivariate Behavioral Research.
Preacher, K. J., & Hayes, A. F. (2004). SPSS and SAS procedures forestimating indirect effects in simple mediation models. Behavior
Research Methods, Instruments, & Computers, 36, 717–731.Reicher, S., & Hopkins, N. (2003). On the science of the art of
leadership. In D. van Knippenberg & M. A. Hogg (Eds.),Leadership and power: Identity processes in groups and organizations
(pp. 197–209). London: Sage.Rosch, E. (1978). Principles of categorization. In E. Rosch & B. B.
Lloyd (Eds.), Cognition and categorization (pp. 27–48). Hillsdale,NJ: Erlbaum.
Rotter, J. B. (1982a). Social learning and clinical psychology: Basicconcepts. In J. B. Rotter (Ed.), The development and applications of
social learning theory (pp. 49–143). New York: CBS Educationaland Professional Publishing, Original work published in 1954.
Rotter, J. B. (1982b). Some implications of a social learning theory forthe practice of psychotherapy. In J. B. Rotter (Ed.), The develop-
ment and applications of social learning theory (pp. 237–262). NewYork: CBS Educational and Professional Publishing, Originalwork published in 1970.
Rush, M. C., Thomas, J. C., & Lord, R. G. (1977). Implicit leadershiptheory: A potential threat to the internal validity of leader behaviorquestionnaires. Organizational Behavior and Human Performance,
20, 93–110.Sassenberg, K., Kessler, T., & Mummendey, A. (2003). Less nega-
tive = more positive? Social discrimination as avoidance orapproach. Journal of Experimental Social Psychology, 39, 48–58.
Schubert, T.W., Mummendey, A., Waldzus, S., & Kessler, T. (2005).Minimal goals and the exclusion of goal violators: The good, the not
so good, and the ugly. Submitted for publication.Shamir, B. (1992). Attribution of influence and charisma to the leader:
The romance of leadership revisited. Journal of Applied Social
Psychology, 22, 386–407.
Shrout, P. E., & Bolger, N. (2002). Mediation in experimental andnonexperimental studies: New procedures and recommendations.Psychological Methods, 7, 422–445.
Tajfel, H. (1982). Social psychology of intergroup relations. Annual
Review of Psychology, 33, 1–39.Tajfel, H., & Turner, J. C. (1986). The social identity theory of intergroup
behaviour. In S. Worchel & W. G. Austin (Eds.), Psychology of
intergroup relations (pp. 7–24). Chicago: Nelson-Hall.Turner, J. C., Hogg, M. A., Oakes, P. J., Reicher, S. D., & Wetherell,
M. S. (1987). Rediscovering the social group: A self-categorization
theory. Oxford, UK: Blackwell.Vallacher, R. R., & Wegner, D. M. (1989). Levels of personal agency:
Individual variation in action identification. Journal of Personality
and Social Psychology, 57, 660–671.van Knippenberg, D., van Knippenberg, B., & De Cremer, D. (2005,
May). Extending the social identity model of leadership: The
interactive effects of leader prototypicality and leader procedural
fairness. Paper presented at the European Congress of Work andOrganizational Psychology, Istanbul, Turkey.
van Knippenberg, D., & Hogg, M. A. (2003). A social identity modelof leadership effectiveness in organizations. In B. M. Staw & R. M.Kramer (Eds.). Research in organizational behavior (Vol. 25,pp. 243–295). Amsterdam: Elsevier.
van Knippenberg, B., Martin, L., & Tyler, T. (2006). Process-orientation vs. outcome-orientation during organizational change:the role of organizational identification. Journal of Organizational
Behavior, 27, 685–704.van Knippenberg, B., & van Knippenberg, D. (2005). Leader self-
sacrifice and leadership effectiveness: The moderating role of leaderprototypicality. Journal of Applied Psychology, 90, 25–37.
van Knippenberg, D., van Knippenberg, B., De Cremer, D., & Hogg,M. A. (2004). Leadership, self, and identity: A review and researchagenda. The Leadership Quarterly, 15, 825–856.
Yukl, G. (2001). Leadership in organizations (5th ed.). New York:Prentice Hall.