license to fail? how leader group prototypicality moderates - repub
TRANSCRIPT
The Leadership Quarterly 20 (2009) 434–451
Contents lists available at ScienceDirect
The Leadership Quarterly
j ourna l homepage: www.e lsev ie r.com/ locate / l eaqua
License to fail? How leader group prototypicality moderates the effects ofleader performance on perceptions of leadership effectiveness☆
Steffen R. Giessner a,⁎, Daan van Knippenberg a, Ed Sleebos b
a RSM Erasmus University, Erasmus University Rotterdam, The Netherlandsb Department of Public Administration and Organization Sciences, VU University Amsterdam, The Netherlands
a r t i c l e i n f o
☆ The first study reported in this article was condepartment of the Phillips-University Marburg, Geman⁎ Corresponding author. Erasmus Research Institutel.: +31 10 4081572; fax: +31 10 4089015.
E-mail addresses: [email protected] (S.R. Giessner)
1048-9843/$ – see front matter © 2009 Elsevier Inc.doi:10.1016/j.leaqua.2009.03.012
a b s t r a c t
Keywords:
Leadership often serves as an explanatory category for performance outcomes (i.e., failure andsuccess). This process can strengthen or weaken leadership effectiveness, because contingenton their performance leaders may gain or lose follower endorsement — the basis of leadership.Drawing on the social identity analysis of leadership, we hypothesized that leader groupprototypicality and performance information interact to predict followers' perceptions ofleadership effectiveness. Because group prototypical leaders are more trusted by theirfollowers, we hypothesized that group prototypical leaders are evaluated as more effectiveafter failure information than non-prototypical leaders. In contrast, we predicted that bothprototypical and non-prototypical leaders should receive similar evaluations of leadershipeffectiveness after success. We found support for our predictions in a scenario experiment, across-sectional field study, and a laboratory experiment.© 2009 Elsevier Inc. All rights reserved.
Leader prototypicalityLeader performanceLeadership effectivenessTrust in leadership
1. Introduction
The impact people in leadership positions have on society is undoubtedly great. The actions of leaders may determine to a largeextent the performance of organizations, sports teams, and political parties, and they may even change the course of history. Thishas made the study of leadership an important research topic in social psychology and organizational behavior for decades(Chemers, 2001; Haslam, 2001; House & Aditya,1997; Reicher & Hopkins, 2001). Because of the central positionwithin their group,leaders are often directly associatedwith the performance of their team or organization (Lord, Binning, Rush, & Thomas,1978; Lord& Maher, 1991; Meindl & Ehrlich, 1987; Meindl, Ehrlich, & Dukerich, 1985; Phillips & Lord, 1981). Consequently, followers'perceptions of leadership effectiveness are influenced by such performance information. Followers will perceive the leader asmoreeffective after success information and as less effective after failure information. However, anecdotal evidence suggests thatsometimes a leader's effectiveness evaluation is less contingent on the actual performance of the leader. Indeed some leaders evenseem to receive as much follower endorsement after failure as after success. This raises the question as to which factors affect thedegree to which followers' evaluations of leadership effectiveness are contingent on actual performance information.
It is important to understand the precursors of follower evaluations and endorsement after leader performance information,because the effectiveness of a leader depends on the degree towhich the leader is able to influence andmotivate followers (Chemers,2001; Yukl, 2001). Whereas former research related to the “romance of leadership” suggests that followers' leadership effectivenessevaluations are directly influenced by performance information (Lord et al., 1978; Meindl et al., 1985), we extend this theoreticalperspective in the present research by incorporating principles of the social identity analysis of leadership (Haslam, 2001;Hogg, 2001;Hogg & van Knippenberg, 2003; Turner, 1991). We argue that followers' effectiveness evaluations are influenced by performance
ucted during the EAESP Summer School 2002 at Marburg, Germany. We thank the social psychologyy, and the EAESP for the support in conducting Study 1, and Carien de Vries for collecting the data in Study 2.e of Management, Room T8-44; Burg. Oudlaan 50, P.O. Box 1738, 3000 DR Rotterdam, The Netherlands.
, [email protected] (D. van Knippenberg), [email protected] (E. Sleebos).
d
T
All rights reserved.
435S.R. Giessner et al. / The Leadership Quarterly 20 (2009) 434–451
information aswell as characteristics of the leader in terms of teammembership. More specifically, we focus on themoderating effectof leader group prototypicality (i.e., leader's representativeness of the group identity) on the relationship between leader performanceinformation and perceptions of leader effectiveness, proposing that leader group prototypicality prevents negative evaluationsafter failure. In addition, we show that an underlying process for this effect is the greater trust in leadership given to a prototypical(vs. non-prototypical) group leader. Thus, we (1) extend the “romance of leadership” perspective (i.e., followers' evaluations ofleadership effectiveness after performance feedback) by highlighting the role of the shared group membership of leaders andfollowers, and (2) we extend the social identity analysis of leadership by including leader performance as an important influence onleadership effectiveness evaluations. In addition, we provide empirical evidence for the mediating effect of trust in leadership inenabling a group prototypical (vs. non-prototypical) leader to receive relatively high follower effectiveness evaluations after failure.
2. Performance information and leadership endorsement
The question of how followers' evaluations of leadership effectiveness are influenced by performance information has receivedstrong research interest in social psychology and organizational behavior (Awamleh & Gardner, 1999; Ensari & Murphy, 2003; Lord&Maher,1991;Meindl et al.,1985; Lord et al., 1978; Shamir,1992). Research by Lord and colleagues demonstrates that performanceinformation related to the leader's team influenced leadership perceptions (Lord et al., 1978; Lord, Foti, & DeVader, 1984; Phillips &Lord,1981; Rush, Thomas, & Lord,1977). They showed in a series of experimental studies that leaders of well-performing teams areevaluated as better on behaviors like initiation of structure and consideration than leaders of low-performing teams. Subsequently,Meindl and colleagues (Meindl & Ehrlich, 1987; Meindl et al., 1985) put forward the “romance of leadership” theory to explain thisattribution process. They argued that people have a romanticized, heroic view of leadership. This, in turn, leads to a kind of figure-ground perception of the leader compared to other possible causal factors of an event. Consequently, the leaders are accordedmoreinfluence on events than is justified and, thus, leadership serves as an explanatory category for performance of the team andorganization— both organizational success and failures are often attributed to the leader. Such attributions subsequently influencefollowers' leadership evaluations and leadership endorsement.
Although this line of research increases our understanding of how and why follower evaluations of leadership effectiveness areaffected byperformance feedback, it lacks one important aspect. It fails to take into account the role of the shared groupmembership ofthe leader and followers. Participants in these studies were never asked to evaluate their own leaders, but evaluated a leader asessentially uninvolved observers. Lord and colleagues showed their participants videos of interacting groups (Lord et al.,1978; Phillips& Lord,1981) or provided descriptions of a leader (Rush et al., 1977). In a similar vein, Meindl and colleagues (Meindl & Ehrlich,1987;Meindl et al., 1985) provided descriptions of organizational performance and examined attributions to the leaders of theseorganizations, or they analyzedmedia attention to the leaderwhen companieswere performingpoorly orwell. Yet leaders donot onlylead groups, they are also members of the groups they lead (Hollander, 1964). To put it differently, leadership processes take place inthe context of a shared groupmembership,where leaders, as groupmembers, ask followers, as groupmembers, to exert themselves onbehalf of the collective. Thus, follower evaluations and endorsement of a leader also depend on characteristics of the leader as a groupmember (Haslam, 2001; Hogg, 2001; Hogg & van Knippenberg, 2003; Reicher & Hopkins, 2003; van Knippenberg & Hogg, 2003).
2.1. Social identity analysis of leadership
One influential approach to understanding the influence of shared group membership on perceptions, evaluations, andbehavior is the social identity approach (Tajfel & Turner, 1986; Turner, Hogg, Oakes, Reicher, & Wetherell, 1987). The importantassumption of this approach is that individuals perceive the social world in terms of social categories. The perceived membershipin social categories can contribute to the self-definition of the individuals. People define themselves not only on the basis of theirindividual characteristics and their interpersonal relations (i.e., personal identity or personal self), but also in terms ofcharacteristics of an ingroup to which they belong (i.e., social identity or collective self) in comparison to an outgroup. Hence,group membership can shape people's cognitions, feelings, and behavior.
Recently, the social identity approach has been used to explain leadership processes (Duck & Fielding, 1999; Haslam & Platow,2001; Hogg, 2001; Hogg & van Knippenberg, 2003; Pierro, Cicero, Bonaiuto, van Knippenberg, & Kruglanski, 2005; Platow, Haslam,Foddy, & Grace, 2003; Reicher & Hopkins, 2003; van Knippenberg & Hogg, 2003). Moreover, Haslam, Platow, Turner, Reynolds,McGarty, & Oakes (2001; see also Haslam & Platow, 2001) have shown that such a perspective has relevance for the “romance ofleadership”. They showed in an experimental study that leaders who behaviorally affirm the social identity of the group (i.e., showbehavior that is in linewith the norms and values of the group) receive less negative attributions after an organizational crisis thanleaders who were identity-negating (i.e., show behavior that deviates from the group's values and norms). Thus, followers'negative attribution of organizational failure is moderated by the degree to which leaders show identity-affirming behavior.
The social identity analysis of leadership, however, makes not only predictions in terms of how a leader should behave, but alsoin terms of how a leader is generally perceived (i.e., characteristics and attributes) by the groupmembers. A central variable in thisrespect is the concept of leader group prototypicality. Group prototypicality refers to the extent to which the leader is seen toembody the group identity — the group prototype (i.e., group prototypes are fuzzy sets of characteristics that in a given contextdefine the group in comparison to relevant other groups; Hogg, 2001; Turner et al., 1987). The group prototype describes andprescribes group membership appropriate attributes in a specific context. When group membership is salient, followers'perception of the leader are contingent on the leader's group prototypicality, and followers' evaluations of the leader are affectedby how similar (in terms of characteristics and attributes) the leader is to the prototype of the group. Leaders that are perceived to
436 S.R. Giessner et al. / The Leadership Quarterly 20 (2009) 434–451
be more group prototypical are perceived to be more effective and receive stronger leadership endorsement (Hogg, 2001; Hogg &van Knippenberg, 2003; van Knippenberg & Hogg, 2003).
Note that this conceptualization of prototypicality has similarities and differences with the concept of prototypicality used inleader categorization theory (Lord et al., 1984; Lord & Maher, 1991) or more recent approaches to implicit leadership theories(Epitropaki & Martin, 2004; House, Hanges, Ruiz-Quantilla, Dorfan, Javadin & Dickson, 1999; Offermann, Kennedy, & Wirtz,1994) in which leader prototypes are understood as context-specific cognitive structures or schemas reflecting the traits andbehaviors of effective leaders. These schemas capture individuals' ideal-types of leadership that perceivers (e.g., followers) mayuse as a standard of comparison or ‘benchmark’ to determine their responses to and evaluations of a given leader — the more aleader matches the prototype of an effective leader, the more favorable leadership perceptions are. Just like in the social identityanalyses, such prototypes are seen as mental representations of a category (i.e., the abstract category of effective leaders) andindeed both the social identity analysis of leadership and leader categorization theory have roots in the categorization-theorytradition (Lord & Hall, 2003; van Knippenberg & Hogg, 2003; cf. Rosch, 1978). However, the important difference is that leadercategorization theory and theories of implicit leader schemas pertain to prototypes of abstract leadership categories that mayvary depending on organizational contexts (e.g., military, business, etc.). The social identity analysis concerns the prototype ofthe group in which both leader and followers are members — the team, work group, or organization. It is also important to notethat the social identity analysis and the leadership categorization tradition complement rather than contradict each other. Theunderlying process of leader evaluation is the same (i.e., leader fit to an abstract prototype as comparison standard), but thereference points differ. Research has shown that group prototypes become more important for leader evaluations with highergroup membership salience, whereas implicit leader schemas become more important reference points of leadershipevaluations with lower group membership salience (Hains, Hogg, & Duck, 1997; Hogg, Hains, & Mason, 1998; Platow & vanKnippenberg, 2001; Lord & Hall, 2003). In our research, we rely on the concept of leader group prototypicality as defined in thesocial identity perspective.
A group prototypical as compared with a less prototypical leader is seen to better represent what defines the group anddistinguishes it from other groups. Therefore, group prototypical leaders (vs. less group prototypical leaders) have more potentialto influence their followers, are perceived as more effective leaders (Hains et al., 1997; Hogg, Hains, & Mason, 1998; Platow & vanKnippenberg, 2001; Pierro et al., 2005; Platow, van Knippenberg, Haslam, van Knippenberg, & Spears, 2006), are trustedmore andseen as more charismatic (Platow et al., 2003; van Knippenberg & van Knippenberg, 2005). These findings derive from studiesusing different paradigms, different operationalizations of group prototypicality, different measures of perceived leadershipeffectiveness, and experimental as well as field settings (for overviews see Haslam, 2001; Hogg & van Knippenberg, 2003; vanKnippenberg & Hogg, 2003; van Knippenberg, van Knippenberg, De Cremer, & Hogg, 2004).
2.2. Trust in leadership and leader group prototypicality
Recently, it has been argued that the greater trust in leadership given to a prototypical leader compared to a non-prototypicalleader is an important mechanism through which group prototypical leaders receive more follower endorsement (Platow & vanKnippenberg, 2001; van Knippenberg & Hogg, 2003; van Knippenberg & van Knippenberg, 2005). Rousseau, Sitkin, Burt, &Camerer (1998) defined trust as “a psychological state comprising the intention to accept vulnerability based upon positiveexpectations of the intentions or behavior of another” (p. 395). Dirks and Ferrin (2002) differentiated between a relationship-based perspective and a character-based perspective in their review and meta-analysis on trust in leadership. Here, we take acharacter-based perspective and propose that trust in leadership is affected by leader characteristics in terms of groupprototypicality, because individuals are biased in favor of their own group (Brewer, 1979; Tajfel, 1982) and such biases extend toindividuals that are seen to embody the group identity. Indeed, recent research shows that trust in leadership varies depending onthe leader's degree of group prototypicality (van Knippenberg & van Knippenberg, 2005). Furthermore, the meta-analysis by Dirksand Ferrin (2002) indicates that trust in leadership has a significant impact on followers' attitudes toward the leader and theorganization. In addition, trust in leadership should be an important aspect for followers because the leader typically has morepower over resources and makes more important decisions on behalf of the team than other team members.
Leaderswho are trusted to have the group's best interest at heart should also receivemore leeway in their behaviors (Platow& vanKnippenberg, 2001; van Knippenberg & van Knippenberg, 2005). In other words, trust in leadership should also be reflected in theallowance ofmore leeway for the leader's behavior or performance. This argument builds on classical research that shows that leaderswho are respected and legitimate receivemore normative leewaywithin their groups (e.g., Sherif & Sherif, 1964). Similarly, Hollander(1964) argued that leaderswho are highly normative are allowed to behave idiosyncratically and non-normatively. However, whereasHollander assumed that these credits can only be “earned” through social exchange relationships between followers and leaders(1964; see also Hollander & Offerman, 1990), the social identity analysis of leadership suggests that more group prototypical leaderspossess more idiosyncratic credits by virtue of being representative of — embodying — the collective identity (van Knippenberg &Hogg, 2003). In linewith this, it has been shown that follower endorsement of group prototypical leaders (vs. less prototypical) is lesscontingent on the leaders' group-oriented behavior, such as self-sacrificing behavior (van Knippenberg & vanKnippenberg, 2005) andingroup-favoring allocation decisions (Platow & van Knippenberg, 2001). In contrast, a non-prototypical leader has to show moregroup-oriented behavior to receive follower endorsement (cf. Choi & Mai-Dalton, 1998; De Cremer, 2002; Haslam & Platow, 2001;Haslam et al., 2001; Platow, Hoar, Reid, Harley, & Morrison, 1997; Platow, Reid, & Andrew, 1998).
In sum, we argue in line with the social identity analysis of leadership that group prototypical leaders receive more trust inleadership than non-prototypical leaders. Trust in leadership impliesmore leeway for the leader's actions (Haslam, 2001; Hogg & van
437S.R. Giessner et al. / The Leadership Quarterly 20 (2009) 434–451
Knippenberg, 2003; van Knippenberg & Hogg, 2003). Therefore, a followers' endorsement of prototypical (vs. non-prototypical)leaders becomes less contingent on their behaviors.
2.3. Leader group prototypicality and performance
Applying a social identity analysis of leadership to understand followers' leadership effectiveness evaluations after performanceinformation, we propose that leader group prototypicality moderates the influence of performance information on leadershipevaluations. We expect that the greater trust given to prototypical compared to non-prototypical leaders provides the prototypicalleadermore leeway to deviate. Accordingly, in the case of failure to reach a performance goal, a prototypical leader should be perceivedas more effective than a non-prototypical leader. In contrast, a non-prototypical leader needs to gain followers' trust. Successfulperformance on the part of the leader should provide the basis for this. Therefore, we predict an interaction of leader groupprototypicality and leader performance on follower evaluations of leadership effectiveness. We hypothesize that the difference infollowerevaluationsof leadership effectiveness betweenaprototypical andanon-prototypical leader is stronger (i.e., higher evaluationsof leadership effectiveness for group prototypical leader vs. non-prototypical leader) after leader failure than after leader success(effectiveness hypothesis). Furthermore, the greater trust in leadership given to a prototypical leader compared to a non-prototypicalleader is hypothesized to mediate the effects of prototypicality on effectiveness evaluation after failure (mediation hypothesis).
Our research extends former research in three importantways. First, we extend ideas based on the “romance of leadership” theory.We argue that perceptions based on groupmembership (i.e., leader group prototypicality)moderate the degree towhich perceptionsof leadership effectiveness are affected by performance information. Second, this also extends the social identity analysis byintroducing responses to leader performance as an important influence on leadership effectiveness, and by empirically testing theunderlying mechanism involved in this influence. We hypothesize that trust in leadership functions as a mediator of leader groupprototypicality on followers' evaluations of leadership effectiveness after failure.
3. The current research
Each research methodology has its own strengths and weaknesses. To provide a robust basis for our conclusion we tested ourhypotheses across three studies using different methodologies. These combined experimental research, to establish causality with ahigh degree of internal validity, with field research, to establish generalizability to leadership in an organizational context (cf. Dipboye,1990). In Study 1wemanipulated leader groupprototypicality (prototypical vs. non-prototypical) and leader performance (success vs.failure). Study 1 was conducted within a natural group context using a scenario approach. The scenario technique allowed us toconduct an experimental studyoutside the laboratorywith natural groups.We tested both of our hypotheses in this study. Study 2wasa cross-sectional field studywith employees of a Dutch police organization. Because the original purpose of this studywas based on adifferent theoretical issue than this paper, we were only able to test the effectiveness hypothesis in this data-set. Finally, Study 3 wasconducted as a laboratory experiment using more arbitrary group memberships. As in Study 1, we manipulated leader groupprototypicalityand leaderperformance. This studyallowedus to simulate a realistic group interaction insteadofhypothetical scenariosas used in the first study. Additionally, in Study 3 we also looked at possible changes in perceived leader group prototypicality as afunction of performance feedback, exploring the possibility that leader success or failure may affect the extent to which the leader isperceived to be group prototypical.
3.1. Study 1
In the first study, vignettes were used to manipulate prototypicality and performance of the leader on behalf of the group in thecontext of leadership of an existing (political) group, the German Green Party (i.e., Bündnis 90/Die Grünen) in the city of Marburg,Germany.We had two reasons for choosing this specific group. First, wewanted to focus on a natural groupwhere groupmembershipwas important to itsmembers. Second, amorepragmatic reason,was that the studywas conducted inMarburg,Germany, a city knownfor its strong sympathy for the German Green Party (28.1% elected the Green Party for the European elections in 2004; Mayer, 2004).
3.1.1. Method
3.1.1.1. Participants and design. One hundred and fifty-three participants, comprising 87 followers of the German Green Party, 60non-followers, and 6 participants who did not indicate their affiliation took part in this study. These 66 participants were excludedfrom the sample because we were only interested in the sample of followers. The follower sample was aged between 19 and75 years (M=30.27, SD=11.15); 39weremale, 44were female (4 participants did not indicate their gender). All participants wereGerman. The study used a two factorial between-subjects design manipulating leader group prototypicality (prototypical vs. non-prototypical) and leader performance (success vs. failure). Participants were randomly assigned to one of the four conditions of theleader prototypicality by leader performance design.
3.1.1.2. Procedure and measures. The questionnaire was titled “Questionnaire concerning the Green Future”. They were handedout in the city streets, at the University of Marburg, Germany, and during a Green Party meeting in Marburg. We told potentialparticipants that this study is about perceptions of the Green Party during the election campaign and asked them whether theywould have ten minutes time to fill out a short questionnaire on this topic.
438 S.R. Giessner et al. / The Leadership Quarterly 20 (2009) 434–451
In a short introduction, participants were informed that the questionnaire was about possible influences on perceptions of theGreen Party. To gather information about this, participants were requested to try to imagine the presented scenario to the best oftheir ability. After the introduction, the participants were directly asked to indicate which party they supported (i.e., Green Party,Social Democrats, Communist Party, Liberal Party, Christian-Democrats, or other parties). Participants' political choice was used todifferentiate between followers (supporters of the Green party) and non-followers (all other participants). If not otherwiseindicated, all answers were rated on scales ranging from 1 (= totally disagree) to 7 (= totally agree).
On the next page, a short fictional vignette of a leader1 of the Green Party in Marburg was introduced as our manipulation ofleader group prototypicality. The descriptions of the prototypical and non-prototypical Green Party leaders were developed inconsultationwith supporters of the Green Party and based on the election program of the Green Party Marburg. It can be assumedthat such election programs represent, on the one hand, the core issues of the Green Party and, on the other hand, are created in away to differentiate their own party from other parties. Therefore, it should represent what is group prototypical for the party. Weused central versus peripheral issues described in this election program to create the scenarios of group prototypical versus non-prototypical leaders (i.e., the interests of the leader were based on this).
The prototypical leaderwas described as having studied Political Sciences, having actively participated in peace movements andAmnesty International during his study, and having a political interest in the immediate abandonment of nuclear power resources,the development of public transport, and the reduction of waste emission. The description of the non-prototypical leader wasconstructed in contrast to the prototypical leader. Care was taken that the non-prototypical leader could still be perceived as apossible ingroup member (i.e., supporters of the party were interviewed). The non-prototypical leader was described as havingstudied Engineering, having participated in two sport societies during his study, and having political interest in tax reduction ofmiddle class employees, intensifying business relations to the states of the former Eastern block, and maintenance of theemployees' wage continuation in the case of illness. Although the chairman used in the study was a fictitious person, participantswere asked to imagine that this person existed in real life, andwas the chairman of the Green Party in Marburg since the beginningof the year 2001.
Following the prototypicality manipulation, two items adapted from Platow and van Knippenberg (2001) measuring perceivedleader group prototypicalitywere presented (“Overall, I would say that the chairman of the Green Party, Mr. Steinmann, representswhat is characteristic about the Green Party“; “Overall, I would say that the chairman of the Green Party, Mr. Steinmann, stands forwhat members of the party have in common”). The average of these items served as a manipulation check of prototypicality. Thenext two items in the questionnaire measured trust in leadership (“I absolutely trust Mr. Steinmann.“; “I think that I would giveMr. Steinmann as the chairman of our Green Party a lot of leeway.“). The average of these two items was used in further analyses.Wemeasured trust in leadership before the leader performance manipulation because we predicted that trust in leadership wouldserve as a buffer in the case of leader failure. This point of measurement also ensured that we were able to test the causal link ashypothesized.
On the next page, participants continued with the second part of the scenario — the manipulation of leader performance. It wasdescribed that a major chemical company planned to build a factory in the district where the party was elected. The leader of theGreen Party and other political leaders were involved in a negotiation about the use of financial state subsidies, which could beinvested in either an ecological construction of the factory or in a new highway connection to the planned chemical factory. Themain interest of the Green Party was the ecological construction of the factory and it was described that the decision ofthe negotiation could have an impact on the next election. Participants randomly received a description of the outcome of thenegotiation that was in favor of the ecological construction (i.e., success condition) or in favor of the highway connection (i.e.,failure condition).
Following the performance manipulation, we included nine items adapted from different studies (Platow et al., 1997; Haslamet al., 2001) to measure perceived leadership effectiveness (e.g., “If an election will take place, I would vote for Mr. Steinmann tobecome the chairman.”; “I think that Reiner Steinmann acted completely like a leader.”; “In general, Reiner Steinmann is a goodleader for the Green Party.”). A principal component analysis conducted with these items revealed only one strong general factorthat explained 63% of the variance. Therefore, we created a measure of leadership effectiveness by averaging the nine items (seeTable 1 for means, standard deviations, and correlations of all measures).
Subsequently, participants were asked to indicate whether the leader performance was successful or not successful. This itemserved as a manipulation check of our performance manipulation. All participants indicated the intended outcome. Finally,participants were asked to answer some demographic questions.
3.1.2. Results2
3.1.2.1. Leader group prototypicality. In order to test whether the manipulation of prototypicality had the expected effect onperceived prototypicality, an independent samples t-test was performed. The analysis yielded a significant effect of the leadergroup prototypicality manipulation, t(83)=7.05, pb .001. The prototypical leader was perceived as more prototypical (M=4.18,SD=1.14) than the non-prototypical leader (M=3.17, SD=1.01), as was intended by the manipulation.
1 We chose a male leader for this study, because the actual leader of the Green Party in Marburg was a male leader at the time we conducted this study. Wehowever, do not assume any gender effect of the leader for our study.
2 Differences in the degrees of freedom are explained by missing values in the questionnaire. The results of the analyses do not substantially change whenleaving the cases with missing values out of the analysis.
,
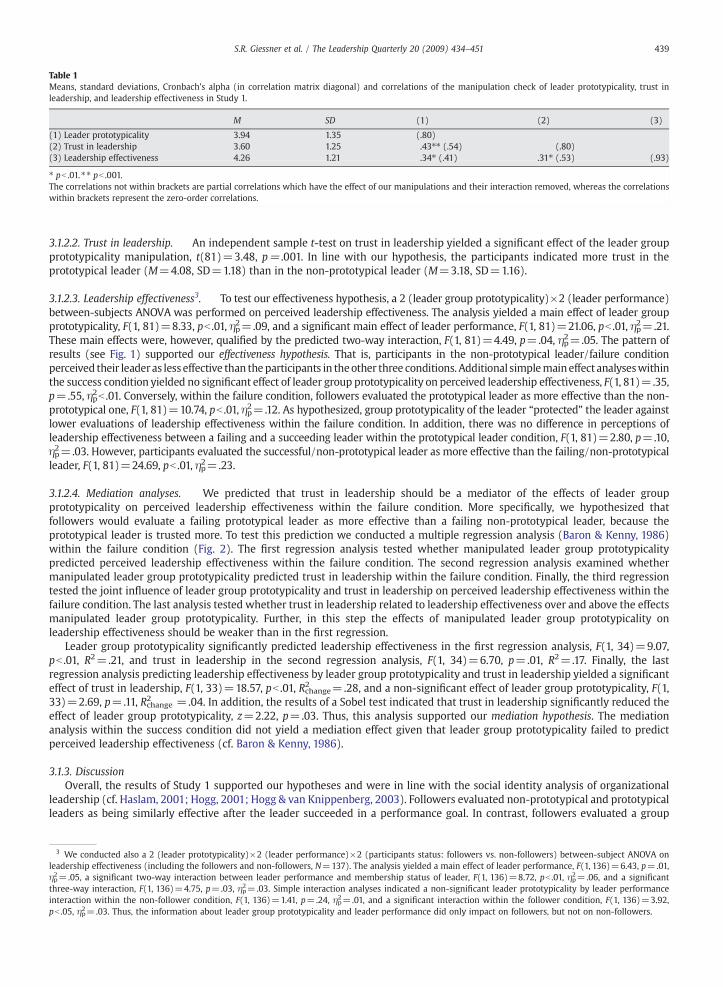
Table 1Means, standard deviations, Cronbach's alpha (in correlation matrix diagonal) and correlations of the manipulation check of leader prototypicality, trust inleadership, and leadership effectiveness in Study 1.
M SD (1) (2) (3)
(1) Leader prototypicality 3.94 1.35 (.80)(2) Trust in leadership 3.60 1.25 .43⁎⁎ (.54) (.80)(3) Leadership effectiveness 4.26 1.21 .34⁎ (.41) .31⁎ (.53) (.93
⁎ pb .01.⁎⁎ pb .001.The correlations not within brackets are partial correlations which have the effect of our manipulations and their interaction removed, whereas the correlationwithin brackets represent the zero-order correlations.
3 We conducted also a 2 (leader prototypicality)×2 (leader performance)×2 (participants status: followers vs. non-followers) between-subject ANOVA onleadership effectiveness (including the followers and non-followers, N=137). The analysis yielded a main effect of leader performance, F(1, 136)=6.43, p=.01ηp2=.05, a significant two-way interaction between leader performance and membership status of leader, F(1, 136)=8.72, pb .01, ηp2=.06, and a significanthree-way interaction, F(1, 136)=4.75, p=.03, ηp2=.03. Simple interaction analyses indicated a non-significant leader prototypicality by leader performanceinteraction within the non-follower condition, F(1, 136)=1.41, p=.24, ηp2=.01, and a significant interaction within the follower condition, F(1, 136)=3.92pb .05, ηp2=.03. Thus, the information about leader group prototypicality and leader performance did only impact on followers, but not on non-followers.
439S.R. Giessner et al. / The Leadership Quarterly 20 (2009) 434–451
)
s
3.1.2.2. Trust in leadership. An independent sample t-test on trust in leadership yielded a significant effect of the leader groupprototypicality manipulation, t(81)=3.48, p= .001. In line with our hypothesis, the participants indicated more trust in theprototypical leader (M=4.08, SD=1.18) than in the non-prototypical leader (M=3.18, SD=1.16).
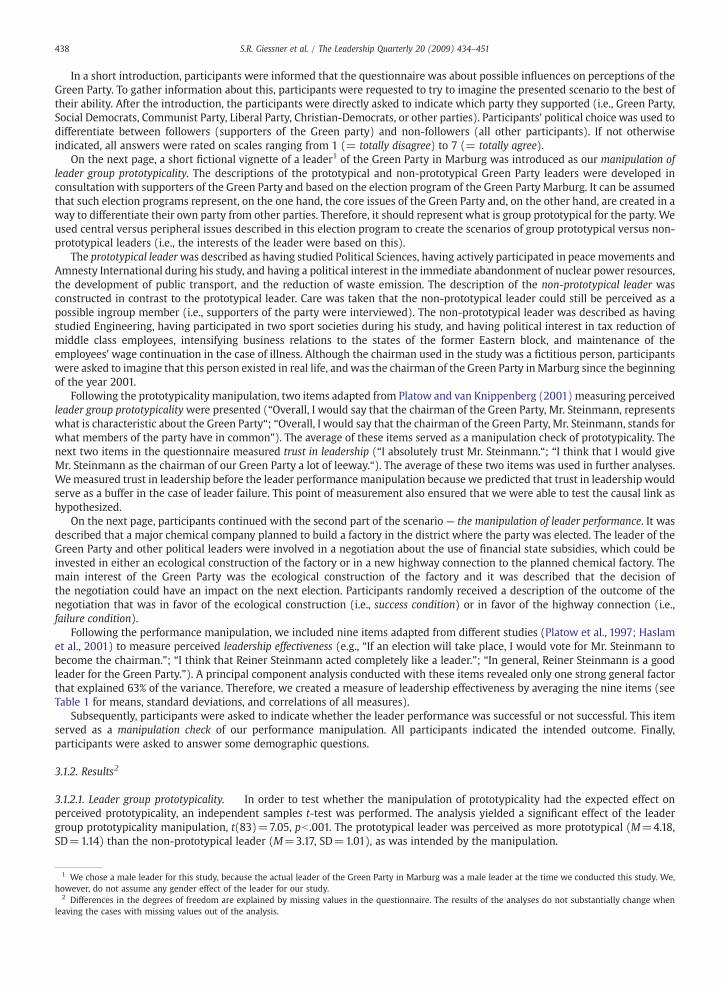
3.1.2.3. Leadership effectiveness3. To test our effectiveness hypothesis, a 2 (leader group prototypicality)×2 (leader performance)between-subjects ANOVA was performed on perceived leadership effectiveness. The analysis yielded a main effect of leader groupprototypicality, F(1, 81)=8.33, pb .01, ηp2=.09, and a significant main effect of leader performance, F(1, 81)=21.06, pb .01, ηp2=.21.These main effects were, however, qualified by the predicted two-way interaction, F(1, 81)=4.49, p=.04, ηp2=.05. The pattern ofresults (see Fig. 1) supported our effectiveness hypothesis. That is, participants in the non-prototypical leader/failure conditionperceived their leaderas less effective than theparticipants in theother three conditions. Additional simplemaineffect analyseswithinthe success condition yielded no significant effect of leader group prototypicality on perceived leadership effectiveness, F(1, 81)=.35,p=.55, ηp2b .01. Conversely, within the failure condition, followers evaluated the prototypical leader as more effective than the non-prototypical one, F(1, 81)=10.74, pb .01, ηp2=.12. As hypothesized, group prototypicality of the leader “protected” the leader againstlower evaluations of leadership effectiveness within the failure condition. In addition, there was no difference in perceptions ofleadership effectiveness between a failing and a succeeding leader within the prototypical leader condition, F(1, 81)=2.80, p=.10,ηp2=.03. However, participants evaluated the successful/non-prototypical leader as more effective than the failing/non-prototypicalleader, F(1, 81)=24.69, pb .01, ηp2=.23.
3.1.2.4. Mediation analyses. We predicted that trust in leadership should be a mediator of the effects of leader groupprototypicality on perceived leadership effectiveness within the failure condition. More specifically, we hypothesized thatfollowers would evaluate a failing prototypical leader as more effective than a failing non-prototypical leader, because theprototypical leader is trusted more. To test this prediction we conducted a multiple regression analysis (Baron & Kenny, 1986)within the failure condition (Fig. 2). The first regression analysis tested whether manipulated leader group prototypicalitypredicted perceived leadership effectiveness within the failure condition. The second regression analysis examined whethermanipulated leader group prototypicality predicted trust in leadership within the failure condition. Finally, the third regressiontested the joint influence of leader group prototypicality and trust in leadership on perceived leadership effectiveness within thefailure condition. The last analysis tested whether trust in leadership related to leadership effectiveness over and above the effectsmanipulated leader group prototypicality. Further, in this step the effects of manipulated leader group prototypicality onleadership effectiveness should be weaker than in the first regression.
Leader group prototypicality significantly predicted leadership effectiveness in the first regression analysis, F(1, 34)=9.07,pb .01, R2=.21, and trust in leadership in the second regression analysis, F(1, 34)=6.70, p=.01, R2=.17. Finally, the lastregression analysis predicting leadership effectiveness by leader group prototypicality and trust in leadership yielded a significanteffect of trust in leadership, F(1, 33)=18.57, pb .01, R2change=.28, and a non-significant effect of leader group prototypicality, F(1,33)=2.69, p=.11, R2change =.04. In addition, the results of a Sobel test indicated that trust in leadership significantly reduced theeffect of leader group prototypicality, z=2.22, p=.03. Thus, this analysis supported our mediation hypothesis. The mediationanalysis within the success condition did not yield a mediation effect given that leader group prototypicality failed to predictperceived leadership effectiveness (cf. Baron & Kenny, 1986).
3.1.3. DiscussionOverall, the results of Study 1 supported our hypotheses and were in line with the social identity analysis of organizational
leadership (cf. Haslam, 2001; Hogg, 2001; Hogg & van Knippenberg, 2003). Followers evaluated non-prototypical and prototypicalleaders as being similarly effective after the leader succeeded in a performance goal. In contrast, followers evaluated a group
,t
,
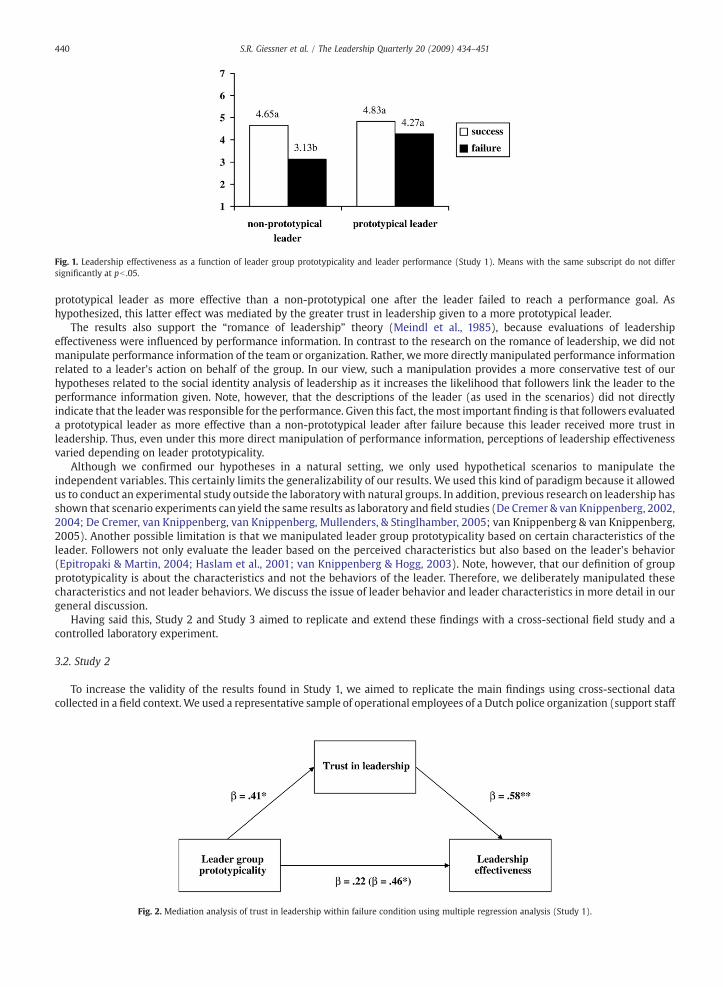
Fig. 1. Leadership effectiveness as a function of leader group prototypicality and leader performance (Study 1). Means with the same subscript do not differsignificantly at pb .05.
440 S.R. Giessner et al. / The Leadership Quarterly 20 (2009) 434–451
prototypical leader as more effective than a non-prototypical one after the leader failed to reach a performance goal. Ashypothesized, this latter effect was mediated by the greater trust in leadership given to a more prototypical leader.
The results also support the “romance of leadership” theory (Meindl et al., 1985), because evaluations of leadershipeffectiveness were influenced by performance information. In contrast to the research on the romance of leadership, we did notmanipulate performance information of the team or organization. Rather, wemore directly manipulated performance informationrelated to a leader's action on behalf of the group. In our view, such a manipulation provides a more conservative test of ourhypotheses related to the social identity analysis of leadership as it increases the likelihood that followers link the leader to theperformance information given. Note, however, that the descriptions of the leader (as used in the scenarios) did not directlyindicate that the leaderwas responsible for the performance. Given this fact, themost important finding is that followers evaluateda prototypical leader as more effective than a non-prototypical leader after failure because this leader received more trust inleadership. Thus, even under this more direct manipulation of performance information, perceptions of leadership effectivenessvaried depending on leader prototypicality.
Although we confirmed our hypotheses in a natural setting, we only used hypothetical scenarios to manipulate theindependent variables. This certainly limits the generalizability of our results. We used this kind of paradigm because it allowedus to conduct an experimental study outside the laboratory with natural groups. In addition, previous research on leadership hasshown that scenario experiments can yield the same results as laboratory and field studies (De Cremer & van Knippenberg, 2002,2004; De Cremer, van Knippenberg, van Knippenberg, Mullenders, & Stinglhamber, 2005; van Knippenberg & van Knippenberg,2005). Another possible limitation is that we manipulated leader group prototypicality based on certain characteristics of theleader. Followers not only evaluate the leader based on the perceived characteristics but also based on the leader's behavior(Epitropaki & Martin, 2004; Haslam et al., 2001; van Knippenberg & Hogg, 2003). Note, however, that our definition of groupprototypicality is about the characteristics and not the behaviors of the leader. Therefore, we deliberately manipulated thesecharacteristics and not leader behaviors. We discuss the issue of leader behavior and leader characteristics in more detail in ourgeneral discussion.
Having said this, Study 2 and Study 3 aimed to replicate and extend these findings with a cross-sectional field study and acontrolled laboratory experiment.
3.2. Study 2
To increase the validity of the results found in Study 1, we aimed to replicate the main findings using cross-sectional datacollected in a field context.We used a representative sample of operational employees of a Dutch police organization (support staff
Fig. 2. Mediation analysis of trust in leadership within failure condition using multiple regression analysis (Study 1).
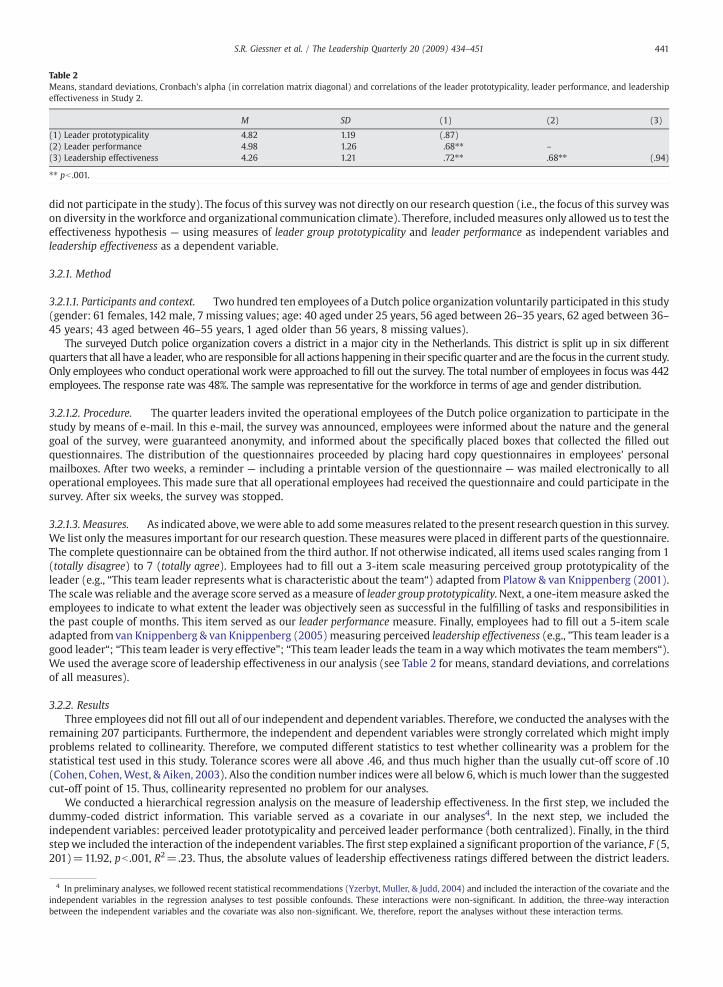
Table 2Means, standard deviations, Cronbach's alpha (in correlation matrix diagonal) and correlations of the leader prototypicality, leader performance, and leadershipeffectiveness in Study 2.
M SD (1) (2) (3)
(1) Leader prototypicality 4.82 1.19 (.87)(2) Leader performance 4.98 1.26 .68⁎⁎ –
(3) Leadership effectiveness 4.26 1.21 .72⁎⁎ .68⁎⁎ (.94)
⁎⁎ pb .001.
441S.R. Giessner et al. / The Leadership Quarterly 20 (2009) 434–451
did not participate in the study). The focus of this survey was not directly on our research question (i.e., the focus of this survey wason diversity in theworkforce and organizational communication climate). Therefore, includedmeasures only allowed us to test theeffectiveness hypothesis — using measures of leader group prototypicality and leader performance as independent variables andleadership effectiveness as a dependent variable.
3.2.1. Method
3.2.1.1. Participants and context. Two hundred ten employees of a Dutch police organization voluntarily participated in this study(gender: 61 females, 142 male, 7 missing values; age: 40 aged under 25 years, 56 aged between 26–35 years, 62 aged between 36–45 years; 43 aged between 46–55 years, 1 aged older than 56 years, 8 missing values).
The surveyed Dutch police organization covers a district in a major city in the Netherlands. This district is split up in six differentquarters that all have a leader,who are responsible for all actions happening in their specific quarter and are the focus in the current study.Only employees who conduct operational work were approached to fill out the survey. The total number of employees in focus was 442employees. The response rate was 48%. The sample was representative for the workforce in terms of age and gender distribution.
3.2.1.2. Procedure. The quarter leaders invited the operational employees of the Dutch police organization to participate in thestudy by means of e-mail. In this e-mail, the survey was announced, employees were informed about the nature and the generalgoal of the survey, were guaranteed anonymity, and informed about the specifically placed boxes that collected the filled outquestionnaires. The distribution of the questionnaires proceeded by placing hard copy questionnaires in employees' personalmailboxes. After two weeks, a reminder — including a printable version of the questionnaire — was mailed electronically to alloperational employees. This made sure that all operational employees had received the questionnaire and could participate in thesurvey. After six weeks, the survey was stopped.
3.2.1.3. Measures. As indicated above, wewere able to add somemeasures related to the present research question in this survey.We list only the measures important for our research question. These measures were placed in different parts of the questionnaire.The complete questionnaire can be obtained from the third author. If not otherwise indicated, all items used scales ranging from 1(totally disagree) to 7 (totally agree). Employees had to fill out a 3-item scale measuring perceived group prototypicality of theleader (e.g., “This team leader represents what is characteristic about the team“) adapted from Platow & van Knippenberg (2001).The scalewas reliable and the average score served as ameasure of leader group prototypicality. Next, a one-itemmeasure asked theemployees to indicate to what extent the leader was objectively seen as successful in the fulfilling of tasks and responsibilities inthe past couple of months. This item served as our leader performance measure. Finally, employees had to fill out a 5-item scaleadapted fromvan Knippenberg & van Knippenberg (2005)measuring perceived leadership effectiveness (e.g., ”This team leader is agood leader“; “This team leader is very effective”; “This team leader leads the team in away whichmotivates the teammembers“).We used the average score of leadership effectiveness in our analysis (see Table 2 for means, standard deviations, and correlationsof all measures).
3.2.2. ResultsThree employees did not fill out all of our independent and dependent variables. Therefore, we conducted the analyses with the
remaining 207 participants. Furthermore, the independent and dependent variables were strongly correlated which might implyproblems related to collinearity. Therefore, we computed different statistics to test whether collinearity was a problem for thestatistical test used in this study. Tolerance scores were all above .46, and thus much higher than the usually cut-off score of .10(Cohen, Cohen,West, & Aiken, 2003). Also the condition number indices were all below 6, which is much lower than the suggestedcut-off point of 15. Thus, collinearity represented no problem for our analyses.
We conducted a hierarchical regression analysis on the measure of leadership effectiveness. In the first step, we included thedummy-coded district information. This variable served as a covariate in our analyses4. In the next step, we included theindependent variables: perceived leader prototypicality and perceived leader performance (both centralized). Finally, in the thirdstepwe included the interaction of the independent variables. The first step explained a significant proportion of the variance, F (5,201)=11.92, pb .001, R2=.23. Thus, the absolute values of leadership effectiveness ratings differed between the district leaders.
4 In preliminary analyses, we followed recent statistical recommendations (Yzerbyt, Muller, & Judd, 2004) and included the interaction of the covariate and theindependent variables in the regression analyses to test possible confounds. These interactions were non-significant. In addition, the three-way interactionbetween the independent variables and the covariate was also non-significant. We, therefore, report the analyses without these interaction terms.
442 S.R. Giessner et al. / The Leadership Quarterly 20 (2009) 434–451
The second step explained an additional significant proportion of the variance, F (2, 199)=168.79, pb .001, R2=.49. Both leaderprototypicality, b=.38, SE b=.06, t(198)=6.88, pb .001, and leader performance, b=.44, SEb=.05, t(198)=8.40, pb .001, weresignificantly related to leadership effectiveness perceptions. Thus, the more prototypical the leader was perceived, the moreeffective the leader was evaluated; and the more employees perceived the leader to be successful, the more they evaluated theleader as effective. Finally, the third step also explained a significant additional proportion of the variance, F (1,198)=4.15, p=.04,R2=.06, b=− .05, SEb=.02. Following Aiken & West (1991), we determined the regression slopes for more successful and lesssuccessful leader performance separately (i.e., one standard deviation above and below the mean value of leader performance). Aspredicted, leader prototypicality yielded a stronger positive relationship to leadership effectiveness evaluations under a lesssuccessful performance perception (β=.41, pb .001) than under a more successful performance perception (β=.29, pb .001).Thus, this finding is in line with our effectiveness hypothesis.
3.2.3. DiscussionStudy 2 confirmed our effectiveness hypothesis in a cross-sectional field study. Leader group prototypicality and leadership
effectiveness had a stronger positive relationship the less successful the leader was perceived to be during the last couple ofmonths. Thus, the results of Study 2 replicated the findings of Study 1 in a cross-sectional field study.
The studyhas, however, severalweaknesses,which shouldbementioned. First, the correlationsbetween the variables are relativelystrong (seeTable 2). Thismight indicate problems related tomono-methodbias in our study. The commonmethod variance created bythemono-method bias is likely to increase correlations between the variables in focus (Podsakoff, MacKenzie, Lee & Podsakoff, 2003).Therefore, the relatively high correlations between the constructs should be interpreted in the lightof this bias.However, our focuswasthe interaction of leader group prototypicality and leader performance on the measure of leadership effectiveness. The highcorrelations between the variablesmake it less likely tofind such an interaction effect (McClelland& Judd,1993) and commonmethodvariance cannot explain or artificially create interactions (Evans, 1985).
A second limitation was the measurement in this study. Because the focus of this study was originally not directly linked to ourresearchquestion,wehad to relyonaone itemmeasure of leaderperformance. In addition, this studydoesnot includeameasure of trustin leadership. Therefore, we could not test for ourmediation hypothesis. Finally, cross-sectional surveys do not allow conclusions aboutcausality. We conducted another study, to provide another test of causality and to address the mono-method/mono-source problem.
3.3. Study 3
The goal of Study 3 was threefold. First, we aimed to replicate our results in a controlled laboratory context. Therefore,participants were led to believe that they engaged as a four-person group in a computer-mediated task supervised by a leader. Ineffect this meant that the presence of a leader was simulated via the computer set-up, and participants proceeded through theexperiment individually. The study design allowed us to give bogus feedback about the leader's group prototypicality and theleader's performance. Second, we wanted to provide further evidence for our mediation hypothesis. Thus, we aimed to replicatethe findings of Study 1 within a different paradigm. Finally, we also looked at how far the performance information changesfollower perceptions regarding leadership group prototypicality, to explore whether leaders may gain or lose group prototypicalityin the eyes of their followers as a function of their association with success or failure.
3.3.1. Method
3.3.1.1. Participants and design. Ninety-eight economics and business administration students (26 females, 72 males; 57employed, 41 unemployed) participated in this study. All students were Dutch and were studying at an undergraduate level. Theage of the participants varied between 17 and 27 years (M=18.80, SD=1.35). The study used a two factorial between-subjectsdesign manipulating leader group prototypicality (prototypical vs. non-prototypical) and leader performance (success vs. failure).All participants were randomly assigned to one of the conditions. The study was the first study of a set of studies, all of which wereunrelated to the current study. Participants received 10 euro for their participation in all studies.
3.3.1.2. Procedure. Participants arrived at the lab and were placed in separate computer cubicles. All instructions were givenvia computer. The study was introduced as a team game study and participants were informed that they would have to work invirtual teams of four players connected through a network system. Actually, all participants worked individually and allcomputer interaction was pre-programmed. Participants received the information that the game they were going to play hadbeen adapted from an assessment centre and had different realistic attributes of a natural team context, like a team structure(i.e., leader and followers) and an incentive for good team performance. Next, participants had to fill out a short questionnaireconsisting of 12 items, which were later used for the prototypicality manipulation (adapted from van Knippenberg & vanKnippenberg, 2005). Participants were led to believe that the questionnaire measured perception styles, and it would ostensiblybe used to decide which of the team players would be assigned the leader position. Subsequently, participants received theinformation that if their team performed better than the average of all participating teams, they would take part in a 100 europrice draw.
Afterwards participants received bogus feedback about the perception style test, which served as the leader prototypicalitymanipulation. Half of the participants received the information that the person who had most in common with the other teammembers and whowasmost representative for the teamwould be chosen (prototypical leader). The other half was informed that the
443S.R. Giessner et al. / The Leadership Quarterly 20 (2009) 434–451
memberwhowas least similar to the others, andwhowas least representative for the team,would be chosen (non-prototypical leader).In all conditions the participants were placed in the follower role. Subsequently, we measured perceived group prototypicality of theleader (see measures section).
In order to heightenparticipants' sense of team interaction, an e-mail systemwas introduced, whichwas said to be used during theteam game. In this part of the experiment, participants could test this system by writing one e-mail to the other participants and byreading the pre-arranged e-mails of the other (bogus) teammembers. After writing one e-mail and having read all other e-mails, theparticipants could continue the experiment.
Next, it was said that the group would start with an amount of 200 points and the leader had already decided to take part in anegotiation task inwhich the leader could earn 50 additional points. Participants had to wait some seconds and then got feedback onthe performance of the leader. Half of the participants were informed that the leader had succeeded in the negotiation task (successcondition). The other half of the participants were informed that the leader failed to secure additional points in the negotiation task(failure condition). Subsequently, dependent variables andmanipulation checks followed.Afterfinishing, participantswere thoroughlydebriefed and all participants took part in a prize draw of four times 25 euro (as was formerly promised).
3.3.1.3. Measures. If not otherwise indicated, all items used scales ranging from 1 (totally disagree) to 7 (totally agree). Participantsindicated on a 3-item scale measuring perceived group prototypicality of the leader (e.g., “This team leader represents what ischaracteristic about the team.“) adapted fromPlatow&vanKnippenberg (2001) directly after the leader prototypicalitymanipulation.The scale was reliable, and the average score served as a manipulation check of leader group prototypicality. Furthermore, participantshad to answer the same two trust items as used in Study 1. The items were averaged to one measure of trust in leadership.
All other measures followed after the performance manipulation. First, participants were requested to fill out a 6-item scaleadapted fromvan Knippenberg and van Knippenberg (2005) measuring perceived leadership effectiveness (e.g., “This team leaderis a good leader”; “This team leader is very effective”). We used the average score of these items as a measure of perceivedleadership effectiveness. Furthermore, we again measured perceived leader group prototypicality using the same items as beforethe performance manipulations (see Table 3 for means, standard deviations, and correlations of all measures).
Next, participants indicatedwhether their team leader had succeeded or failed in the negotiation task (i.e., a dichotomous choice).This item served as manipulation check of performance. All participants indicated the intended outcome on the performancemanipulation check. Hence, this manipulation was successful. Finally, participants filled out demographic questions regarding theirgender, age, and employment status. Preliminary analyses indicated that these factors did not influence our research results.
3.3.2. Pilot studyThe measures of perceived leader group prototypicality, trust in leadership, and perceived leadership effectiveness may raise
questions about potential overlap. For theoretical reasons, we measured prototypicality and trust before and leadershipeffectiveness after the performancemanipulation in Study 3. This means that Study 3 is less suited to explore the dimensionality ofthese measures. Therefore, to guarantee that these measures do indeed tap related but different constructs, we conducted a pilotstudy with undergraduate Dutch business administration students (N=159; 113 male; age M=19.58, SD=1.67). Here, we justpresented a short description of a leader followed by exactly the same items used in this study. The study was part of a set ofunrelated studies. A principal component analysis with varimax rotation over all 11 items yielded a three-factor solutionexplaining 82.45% of the variance. The factor structure resembled the items we used to measure the different constructs. The firstfactor represented perceived leadership effectiveness including all 6 items (factor loadings varying from .72 to .91; cross loadingsb .29). The second factor represented trust in leadership (factor loadings varying from .90 to .93; cross loadings b .34). The lastfactor represented leader group prototypicality (factor loadings varying from .80 to .83; cross loadings b .37).
3.3.3. Results
3.3.3.1. Leader group prototypicality. In order to test whether the manipulation of prototypicality had the expected effect onperceived prototypicality, an independent samples t-test was performed. The analysis yielded a significant effect of the leadergroup prototypicality manipulation, t(96)=10.30, pb .001. The prototypical leader was perceived as more prototypical (M=4.82,SD=.86) than the non-prototypical leader (M=2.75, SD=1.10), as was intended by the manipulation.
Table 3Means, standard deviations, Cronbach's alpha (in correlation matrix diagonal) and correlations of the manipulation checks of leader prototypicality(at measurement point 1 and 2), trust in leadership, and leadership effectiveness and in Study 3.
M SD (1) (2) (3) (4)
(1) Leader prototypicality (measurement point 1) 3.77 1.43 (.89)(2) Trust in leadership 4.63 1.04 − .03 (.22) (.66)(3) Leadership effectiveness 4.39 1.21 − .05 (.06) .27⁎⁎ (.25) (.89)(4) Leader prototypicality (measurement point 2) 4.26 1.21 .53⁎⁎⁎ (.72) .12 (.33) .31⁎⁎ (.45) (.94
⁎ pb .05 ⁎⁎ pb .01 ⁎⁎⁎ pb .001.The correlations not within brackets are partial correlations which have the effect of our manipulations and their interaction removed, whereas the correlationwithin brackets represent the zero-order correlations.
)
s
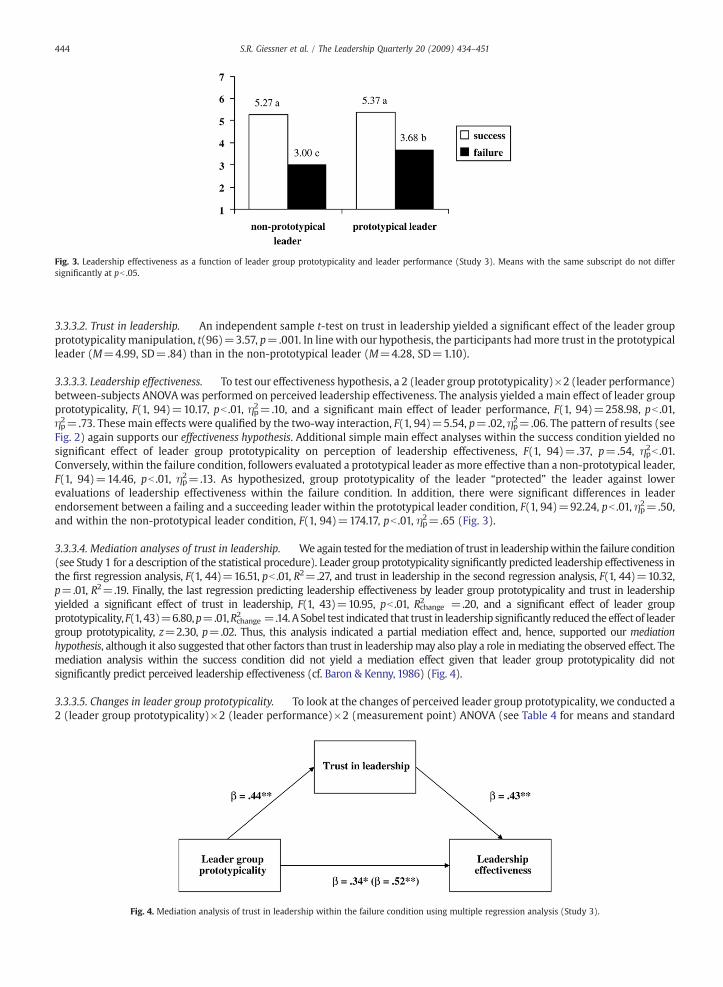
Fig. 3. Leadership effectiveness as a function of leader group prototypicality and leader performance (Study 3). Means with the same subscript do not differsignificantly at pb .05.
444 S.R. Giessner et al. / The Leadership Quarterly 20 (2009) 434–451
3.3.3.2. Trust in leadership. An independent sample t-test on trust in leadership yielded a significant effect of the leader groupprototypicality manipulation, t(96)=3.57, p=.001. In linewith our hypothesis, the participants hadmore trust in the prototypicalleader (M=4.99, SD=.84) than in the non-prototypical leader (M=4.28, SD=1.10).
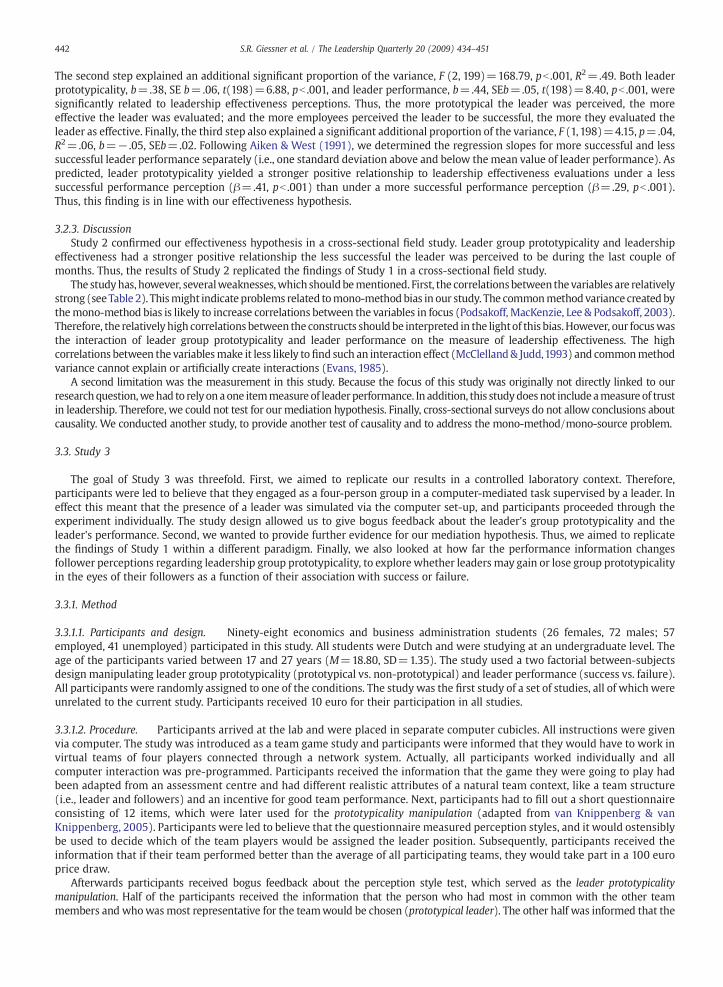
3.3.3.3. Leadership effectiveness. To test our effectiveness hypothesis, a 2 (leader group prototypicality)×2 (leader performance)between-subjects ANOVAwas performed on perceived leadership effectiveness. The analysis yielded a main effect of leader groupprototypicality, F(1, 94)=10.17, pb .01, ηp2=.10, and a significant main effect of leader performance, F(1, 94)=258.98, pb .01,ηp2=.73. These main effects were qualified by the two-way interaction, F(1, 94)=5.54, p=.02, ηp2=.06. The pattern of results (seeFig. 2) again supports our effectiveness hypothesis. Additional simple main effect analyses within the success condition yielded nosignificant effect of leader group prototypicality on perception of leadership effectiveness, F(1, 94)=.37, p=.54, ηp2b .01.Conversely, within the failure condition, followers evaluated a prototypical leader as more effective than a non-prototypical leader,F(1, 94)=14.46, pb .01, ηp2=.13. As hypothesized, group prototypicality of the leader “protected” the leader against lowerevaluations of leadership effectiveness within the failure condition. In addition, there were significant differences in leaderendorsement between a failing and a succeeding leader within the prototypical leader condition, F(1, 94)=92.24, pb .01, ηp2=.50,and within the non-prototypical leader condition, F(1, 94)=174.17, pb .01, ηp2=.65 (Fig. 3).
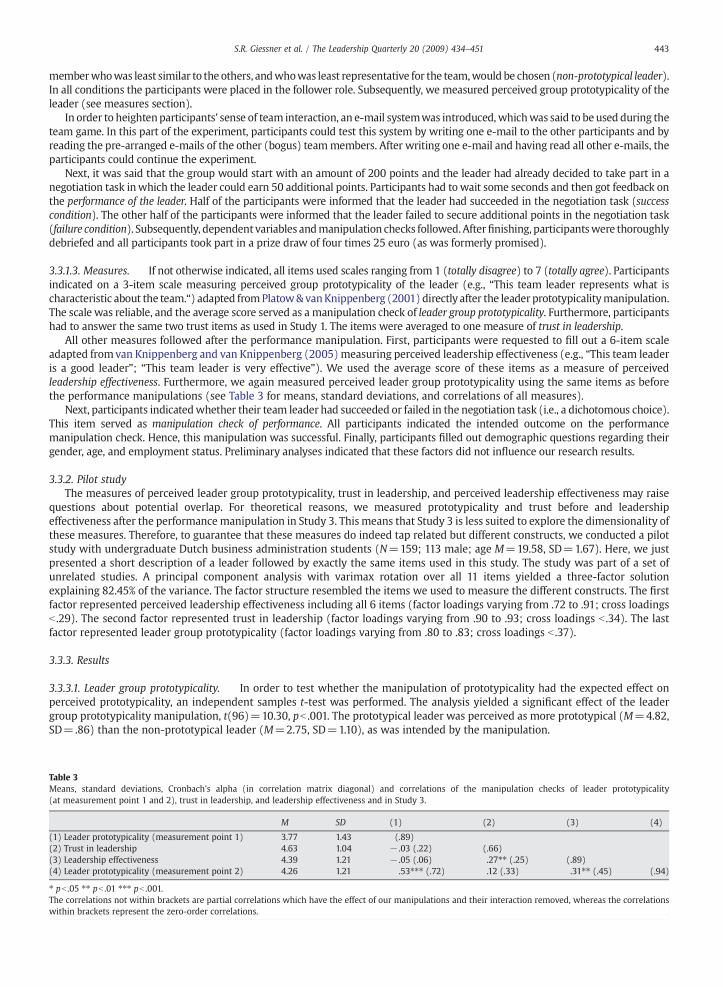
3.3.3.4. Mediation analyses of trust in leadership. Weagain tested for themediation of trust in leadershipwithin the failure condition(see Study 1 for a description of the statistical procedure). Leader group prototypicality significantly predicted leadership effectiveness inthe first regression analysis, F(1, 44)=16.51, pb .01, R2=.27, and trust in leadership in the second regression analysis, F(1, 44)=10.32,p=.01, R2=.19. Finally, the last regression predicting leadership effectiveness by leader group prototypicality and trust in leadershipyielded a significant effect of trust in leadership, F(1, 43)=10.95, pb .01, R2change =.20, and a significant effect of leader groupprototypicality,F(1, 43)=6.80,p=.01,R2change =.14. A Sobel test indicated that trust in leadership significantly reduced the effect of leadergroup prototypicality, z=2.30, p=.02. Thus, this analysis indicated a partial mediation effect and, hence, supported our mediationhypothesis, although it also suggested that other factors than trust in leadershipmay also play a role inmediating the observed effect. Themediation analysis within the success condition did not yield a mediation effect given that leader group prototypicality did notsignificantly predict perceived leadership effectiveness (cf. Baron & Kenny, 1986) (Fig. 4).
3.3.3.5. Changes in leader group prototypicality. To look at the changes of perceived leader group prototypicality, we conducted a2 (leader group prototypicality)×2 (leader performance)×2 (measurement point) ANOVA (see Table 4 for means and standard
Fig. 4. Mediation analysis of trust in leadership within the failure condition using multiple regression analysis (Study 3).
Table 4Means and standard deviations of leader group prototypicality (measured) as a function of leader performance, leader prototypicality, and measurement poin(Study 3).
Performance Leader prototypicality Measurement point
Before performance manipulation After performance manipulation
Success PrototypicalM 4.78 5.00SD .61 .70Non-prototypicalM 2.64 3.30SD .90 1.27
Failure PrototypicalM 4.86 4.57SD 1.10 .84Non-prototypicalM 2.88 2.43
(continued on next page
445S.R. Giessner et al. / The Leadership Quarterly 20 (2009) 434–451
t
)
deviations). The last factor was within subjects. The analysis yielded a significant main effect of leader group prototypicality, F(1,94)=127.39, pb .001, ηp2=.58. Group prototypical leaders were generally perceived as more prototypical (M=4.81, SD=.83)compared to non-prototypical group leaders (M=2.84, SD=1.16). In addition, the analysis yielded a significant measurementpoint by performance interaction, F(1, 94)=19.21, pb .001, ηp2=.17. Simple effect analyses indicated that success increasedperceived leader group prototypicality, F(1, 94)=13.20, pb .001, ηp2=.12 (before: M=3.71, SD=1.32; after: M=4.19, SD=1.30),whereas failure decreased perceived leader group prototypicality, F(1, 94)=6.76, p=.011, ηp2=.07 (before: M=3.83, SD=1.56;after: M=3.46, SD=1.41).
The analysis also revealed a marginal significant three-way interaction, F(1, 94)=3.12, p=.08, ηp2=.03. Consequently, weconducted additional simple interaction analyses within the performance conditions. The analysis yielded a marginal significantmeasurement point by leader group prototypicality interactionwithin the success condition, F(1, 50)=3.36, p=.07, ηp2=.06, but notin the failure condition, F(1, 44)=.38, p=.54, ηp2=.01. Further simple effect analyses within the success/leader prototypicalityconditions indicated that non-prototypical group leaders received stronger perceptions of prototypicality after the success feedback, F(1, 50)=13.46, pb .001, ηp2=.21, whereas the level for group prototypical leaders did not change significantly, F(1, 50)=1.16, p=.29,ηp2=.02. However, it should be noted that group prototypical leaders were still perceived as more prototypical than non-prototypicalleader after both a success and a failure feedback (see Table 4).
3.3.4. DiscussionThe results of Study 3 replicated the findings of Study 1 and 2 under controlled laboratory conditions. Leader group
prototypicality and performance information interacted again in the prediction of followers' evaluations of leadershipeffectiveness. Whereas followers evaluated prototypical and non-prototypical leaders as being similarly effective after successinformation, they evaluated a prototypical leader as being more effective than a non-prototypical leader after failure (effectivenesshypothesis). Again, this latter effect was (albeit partly) explained by the greater trust in leadership given to the prototypical leader.Furthermore, we found a strong main effect of the performance manipulation replicating earlier studies on performanceinformation and leader evaluations (Lord et al., 1978; Meindl et al., 1985; Phillips & Lord, 1981; Rush et al., 1977).
In addition to the former two studies, we found evidence for changes in perceived leader prototypicality after performancefeedback. Both a non-prototypical and a prototypical leader gained or lost in perceived group prototypicality after performanceinformation. This indicates the dynamic aspects of group prototypicality (cf. Oakes, Haslam, & Turner, 1998). The findings alsosuggest that non-prototypical leaders might gain more in prototypicality perceptions after success than prototypical leaders.However, these effects have to be interpreted with caution for two reasons: (1) the effects were only marginally significant, and(2) the effects of the prototypical leader might be influenced by a ceiling effect (i.e., they could not gain as much in prototypicalityas the non-prototypical leaders). Nevertheless, the important message is that non-prototypical group leaders can increase theirstanding within the team (in terms of group prototypicality) through successful performance.
Similar to Study 1, the performance informationwas related to a leader's task on behalf of the group. Compared to studies on theromance of leadership, such a manipulation would implicate a much stronger attribution of success and failure to the leader. Theresults, however, indicate that characteristics of the leader as a group member (i.e., leader group prototypicality) influenceeffectiveness evaluations of the leader after failure information — which is in line with the social identity analysis of leadership.
Compared to the results of Study 1, this study also yielded some differences, which deserve attention. First, a prototypical leaderwas still less endorsed after task failure than after task success. This might mainly reflect a stronger importance of the taskperformance in the laboratory study than in the scenario study because the performance information in the scenario study wasonly an imaginary situation compared to a real incentive provided in the laboratory study. However, the important (and predicted)finding is the interaction of leader group prototypicality and performance information on leadership effectiveness. Second, trust inleadership explained only partially the effects of leader group prototypicality on leadership effectiveness within the failure
446 S.R. Giessner et al. / The Leadership Quarterly 20 (2009) 434–451
condition. On the one hand, this implies that trust in leadership is the mediating variable (supporting our mediation hypothesis).On the other hand, this suggests that other variables may mediate these effects as well.
The laboratory may seem a somewhat artificial setting to study the role of leader group prototypicality, given the lack ofinteraction between leader and followers and the ad hoc nature of the group and the leadership relation. The key point here,however, is that the effects of leader group prototypicality are contingent first and foremost on follower self-categorization as amember of the group and on follower perceptions that the leader is prototypical of the group. Theoretically, neither this self-definition nor this leadership perception is dependent on interaction with the leader or on interaction within the group (cf. Tajfel,1978; Tajfel & Turner, 1986; Turner, 1985). Indeed, there is an abundance of evidence that even in such ‘minimal group’ laboratorysettings, individuals do see themselves as amember of their group (i.e., identify with the group) and respond to others on the basisof their group membership (for more elaborate discussions of the use of these kind of minimal group set-ups to study socialidentity processes, see Brewer, 1979; Hewstone, Rubin, & Willis, 2002; Tajfel, 1982). The study of leader group prototypicality isrooted in this research tradition of studying social identity processes in minimal group situations (e.g., Hains et al., 1997; Platow &van Knippenberg, 2001; van Knippenberg, van Knippenberg, & van Dijk, 2000). Testifying to the generalizability of such laboratoryfindings to the field, laboratory experiments of leader group prototypicality have consistently yielded results that are replicated inand commensurate with findings from field studies (Fielding & Hogg,1997; Hains et al., 1997; Hogg et al., 1998; van Knippenberg &van Knippenberg, 2005; for reviews, see van Knippenberg & Hogg, 2003; van Knippenberg et al., 2004).
The above notwithstanding, an obvious and important question is whether the relationships studied in the present researchmay not only be observed in a laboratory setting but also in an organizational setting. To address exactly that question, the presentresearch combined different research methodologies to provide both evidence from controlled experiments that can speak toissues of causality and evidence from the field that can speak to issues of generalizability. Both on theoretical grounds, that suggestthat the interaction between leader and follower is not a precondition for the proposed relationships to be obtained, and on thebasis of research using comparable experimental set-ups in combination with field surveys (De Cremer & van Knippenberg, 2002,2004; De Cremer et al., 2005; van Knippenberg & van Knippenberg, 2005), we expected that the lab and the field would yieldsimilar results. This was exactly what we found.
4. General discussion
Leaders have a central position within the group and, therefore, often have to deal with performance outcomes of their group.Most of the empirical evidence suggests that people often use the leadership of a group as an explanatory category for suchperformance information (Lord et al., 1978; Meindl et al., 1985; Phillips & Lord, 1981). Thus, a leader often gains endorsement offollowers after success and loses follower endorsement after failure. The latter effect may, however, jeopardize the leader's abilityto be effective because followers' endorsement forms the basis for effective leadership (cf. Hollander, 1964). This raises thequestion of whether there are possible moderators of such an effect.
The present research investigated how perceptions of leader group prototypicality and leader performance influence followers'leadership effectiveness evaluations. Based on prior research on the romance of leadership theory (Meindl & Ehrlich, 1987; Meindlet al., 1985; see also Lord et al., 1978; Lord & Maher, 1991) and the social identity analysis of leadership (Haslam & Platow, 2001;Hogg, 2001; Hogg & van Knippenberg, 2003; van Knippenberg &Hogg, 2003; Reicher &Hopkins, 2003), it was predicted that groupprototypical leaders, who embody the group identity, would receive higher evaluations of leadership effectiveness than non-prototypical leaders, but only under failure conditions. In addition, we predicted that trust in leadership mediates the effect ofleader prototypicality on leadership effectiveness within the failure condition. The results of Study 1 supported both of ourhypotheses in an experimental field study using a scenario approach. Study 2 provided support for the effectiveness hypothesis in across-sectional field setting. Because of practical restrictions in this study, we could not provide a measure of trust in leadership totest our mediation hypothesis. Finally, Study 3 replicated and extended the findings in a controlled laboratory study. As in Study 1and 2, a group prototypical (vs. non-prototypical) leader received higher evaluations of leadership effectiveness when failing in agoal (compared to succeeding in a goal). In addition, leader success increased perception of leader group prototypicality and leaderfailure decreased perceptions of leader group prototypicality over time.
Our research brings together research on leadership effectiveness evaluations after performance feedback and leader groupprototypicality. The synthesis of these perspectives enriches our knowledge about the romance of leadership and the processesunderlying leader group prototypicality in the prediction of leadership effectiveness. In the following, we discuss the implicationsof our findings for research on the romance of leadership and the social identity analysis of leadership, the limitations of our study,the perspectives for future research and practical implications.
4.1. Leader group prototypicality and responses to performance outcomes
The current findings have important implications for the romance of leadership theory (Meindl & Ehrlich, 1987; Meindl et al.,1985). Consistent with the social identity analysis of leadership (Haslam, 2001; van Knippenberg & Hogg, 2003) leaderprototypicality influenced the associations of leaders with performance information. To be more precise, a group prototypicalleader received higher evaluations of leadership effectiveness after failing to reach a goal than a non-prototypical one. Thisindicates that perceptions of the leader as a group member matter for leadership evaluations after performance feedback. Haslamand colleagues (2001) showed that group-affirming (vs. group-negating) behavior of the leader moderates the degree to which acrisis (representing failure information) influences leadership evaluations. Our research indicates that not only the behavior of the
447S.R. Giessner et al. / The Leadership Quarterly 20 (2009) 434–451
leader, but also the perception of the leader's group prototypicality influences the relationship between performance informationand followers' perception of leadership effectiveness. We replicated our findings within three different research paradigms, in fieldand laboratory settings, and with three different sample populations. Group prototypical leaders as opposed to non-prototypicalleaders received more positive evaluations of leadership effectiveness after failure. In other words, a prototypical leader had some“license to fail”, whereas a non-prototypical leader did not have such credit.
The present research also provides evidence for an underlying mechanism of the “license to fail” for group prototypical leaders.The findings of Study 1 and 3 indicate that the more trust in leadership given to a prototypical (vs. non-prototypical) group leadermediates the effects of leadership effectiveness after failure information. Although this mediating mechanism has been suggestedby recent research on the social identity analysis of leadership (Platow & van Knippenberg, 2001; van Knippenberg & Hogg, 2003;van Knippenberg & van Knippenberg, 2005), it had not yet been tested. Interestingly, this finding is also in line with Hollander's(1964) theory of idiosyncrasy credit — which can be understood as a kind of trust in leadership. However, whereas Hollanderassumed that idiosyncrasy can only be earned through behavior of the leader or exchange relationships between leader andfollowers, the social identity extends this view by predicting and showing in this research that perceptions of the leader in terms ofgroup prototypicality can be the basis of trust in leadership perceptions.
Nevertheless, the findings of Study 3 do indicate that trust in leadership might not be the only mediating mechanism.Different kinds of processes might underlie the effects of leader group prototypicality on leadership effectiveness perception.One such mediating process might be the greater depersonalized attraction a prototypical (vs. non-prototypical) group memberreceives from other group members (Hogg, Cooper-Shaw, & Holzworth, 1993). To be more precise, theoretical and empiricalwork by Hogg and colleagues showed that within a salient intergroup context (i.e., identificationwith the group is strong), likingof group members is determined by their degree of group prototypicality. Such feelings of liking may not necessarily involveperceptions of trust and may therefore act as an independent mediating process (cf. Hogg & van Knippenberg, 2003).
Our research focused mainly on follower perceptions of leadership effectiveness after performance information because weaimed to extend the theoretical perspective of the romance of leadership theory. Nevertheless, the findings of Study 3 indicatethat not only perceived leadership effectiveness is influenced by perceived group prototypicality of a leader and performanceinformation. Rather, perceived leader group prototypicality itself is shown to change after performance information. Groupprototypes are influenced by the social context (Turner et al., 1987). Although there is some debate among social identityscholars in how far group prototypes are responsive to contextual changes (Oakes et al., 1998) or provide stability and aretherefore slower to change (Abrams &Hogg, 2001; Hogg, 2003), there is agreement that group prototypes are dynamic in nature.But the aim of our research was not primarily to show these dynamic aspects of leader prototypicality perceptions. Therefore,Study 1 used a rather fixed conceptualization of leader prototypicality. In contrast, Study 2 then measured perceived leaderprototypicality and, thus, did not fix prototypicality perception. Finally, wemeasured changes in perceived group prototypicalityin Study 3. The results indicate that performance information indeed influences leader prototypicality perceptions. Thus, successand failure of a leader can either increase or decrease perceived leader prototypicality. However, it is worth mentioning that theprototypical leader was still perceived as more prototypical than the non-prototypical leader after failure. Thus, this mayindicate that, one the one hand, prototypicality is dynamic and influenced by social context changes, and, on the other hand, alsohas some stability.
Our research focused on one performance goal only. Often leaders and their groups have more than one performance goal and,therefore, receive feedback about their performance in relation tomore than one goal. Thus, leaders or their groupsmay repeatedlyfail or succeed on different goals. Given the findings of Study 3, we may predict that such repeated performance feedback caninfluence followers' perceptions of leader group prototypicality and/or trust in leadership over time. Thus, a prototypical leaderwho repeatedly fails might be perceived as non-prototypical at one point in time. In a similar vein, a less prototypical leader mightbe able to improve followers' perception of group prototypicality through repeated success. Study 3 shows the first evidence ofsuch changes in leader group prototypicality perceptions due to performance information. Onemight question how far the “licenseto fail” has real world applicability because of these influences of performance on leader group prototypicality. Notice, however,that a failing prototypical leader was still perceived as more prototypical than the succeeding non-prototypical leader. Thus, weassume that either several experiences of failure or success are required to change prototypicality perceptions, or that verydramatic performance feedback is required. In addition, our research indicates that followers still endorse a failing groupprototypical leader, and this finding was also established in the field. Knowing that group prototypical leaders keep their ‘license tofail’ after initial failure is already a very important message from a practical point of view. We discuss the possible consequences ofit below.
4.2. Practical implications
One premature conclusion from our research might be to assume that group prototypical leaders are better leaders. From theperspective of the leader, being group prototypical can be an advantage, since a prototypical group leader (compared to a non-prototypical one) maintains more follower endorsement after performance failure. As a result, the leader can deal more easilywith throwbacks and has less pressure to be a successful leader. Also from an organizational perspective, this can be good news.Research by Lord, Meindl, and others (Lord et al., 1978; Lord &Maher,1991; Meindl et al., 1985) point to the fact that performanceoutcomes are often over-attributed to leaders, although they might not be responsible for these outcomes. It would not be in theinterest of an organization to lose a good leader because of this over-attribution of performance outcomes. Leader groupprototypicality is able to constrain this effect. In a similar vein, sometimes the performance of a leader might only pay off in the
448 S.R. Giessner et al. / The Leadership Quarterly 20 (2009) 434–451
long run and not in the short term. To withdraw the trust in the leader, and therefore the basis to be an effective leader, too early,can be a danger for the organization.
However, these positive viewpoints from the perspective of the organization imply, at the same time, a more negative or “dark”side. There is a danger that a group prototypical leader is endorsed even when the leader is the cause of failure. Even when theleader's performance or behaviors jeopardize the whole group or organization, followers might still endorse and trust the leaderwith potentially detrimental consequences for the group. Therefore, the moderating effect of leader group prototypicality onresponses to leader performance should be seen as something that may have positive as well as negative consequences for groupsand organizations. Thus, in conclusion, it is important to recognize this double-edged sword of the interactive effects of leaderperformance and leader group prototypicality on leadership effectiveness.
For management practice, our results may also be relevant in terms of leader promotion decisions. Our research indicates thatperceptions of leaders are not only influenced by the actual performance but also by their group prototypicality. Promotiondecisions might be biased in this sense. The evaluations of group prototypical (vs. less prototypical) leaders might be lessinfluenced by their prior performance, which, for the reasons outlined above, might be both a good thing and a bad thing.
Finally, the results of Study 3 indicate that leaders can increase their perceived leader prototypicality, which in turnwouldmakethem more effective (in terms of influence over followers). More precisely, non-prototypical leaders should show successfulperformance, because this increases perceptions of group prototypicality. Thus, the ability of newly appointed non-prototypicalleaders tomobilize their followers might be increased if the leader initially receives assignments which are likely to end in success.In this way the leader might be able to build up trust in leadership.
4.3. Leader group prototypicality, leader schemas, and leader behavior
Based on a social identity analysis of leadership, we developed a theoretical account for leader evaluations after performanceinformation. We acknowledge that other processes might also play an important role in the prediction of leader perceptions.Most closely related seem to be research on theories of implicit leadership and leader categorization theory (Epitropaki &Martin, 2004; House et al., 1999; Lord & Emrich, 2001; Offermann et al., 1994). As we already discussed in our introduction,empirical research indicates that group prototypes become more important for the leader evaluation when group membershipsalience is high, whereas implicit leader schemas become more important reference points of leadership evaluations whengroupmembership salience is low (Hains et al., 1997; Lord & Hall, 2003). In practice, the salience level of groupmembership willrarely be so high that individual schema processes are not important at all (and vice versa). Thus, we would predict that leaderevaluations are often based on judgments of group prototypicality as well as on judgments based on general implicit leaderschemas.
Our research focused on leader group prototypicality as a moderator of the relationship between performance information andperceptions of leadership effectiveness. Based on the social identity perspective on leadership (Hogg & van Knippenberg, 2003;van Knippenberg & Hogg, 2003), we defined leader group prototypicality as a cognitive structure, which reflects the essentialcharacteristics of a group (in terms of norms, ideals, history, etc.). In this way, leader prototypicality does not equal leadershipbehaviors. However, we know from former research that leadership behaviors also form an important part of followers' leadershipperceptions. Former research, for instance, indicated that a leader who shows behaviors that affirm the social identity of the groupare alsomore supported than a leaderwho does not affirm the identity (Haslam et al., 2001). Thus, leader behaviorsmight have thesame effects as leader prototypicality in terms of representing the ideal characteristics of the group (cf. van Knippenberg & Hogg,2003). In addition, it might be interesting to test whether the moderating effect of leader group prototypicality still holds if wecontrol for more general leadership behaviors. Former research by Ensari and Murphy (2003) indicated that after controlling foreffects of general leadership impressions (cf. Maurer & Lord, 1991), leader schemas sill explained variance in the prediction ofleader charisma. Based on this finding, we would also assume that leader group prototypicality explains additional variance tomore general leadership behavior. Support for this reasoning may be found in studies showing interactive effects of leader groupprototypicality and leader behavior (Platow & van Knippenberg, 2001; Platow et al., 2006; van Knippenberg & van Knippenberg,2005).
A group prototypical leader might be able to showmore unconventional behaviors than non-prototypical behaviors becausesuch leaders receive more trust in leadership. Indeed, former research based on a social identity perspective on leadershipshowed that follower endorsement of prototypical (vs. less prototypical) leaders is less contingent on leader behaviors thatindicates the leader's group-orientation, such as self-sacrificing behavior on behalf of the group (van Knippenberg & vanKnippenberg, 2005), or ingroup-favoring allocation decisions (Platow & van Knippenberg, 2001). In other words, prototypicalleaders can show behaviors that deviate from the norm. These findings are interesting in relation to research on charismatictheories of leadership. Conger & Kanungo (1987) argued that successful leaders act in more unconventional ways (cf. behaviorthat deviates from the group norms). Based on our research, we predict that group prototypical leaders might be able to showsuch unconventional behaviors. Indeed van Knippenberg and Hogg (2003) argue that there is some overlap betweencharismatic and transformational leadership theories and the social identity analysis of leadership. Leader groupprototypicality can be seen as a factor that feeds into attributions of charisma. Recent empirical evidence indeed indicatesthat more prototypical leaders are perceived as more charismatic (Platow et al., 2006; van Knippenberg & van Knippenberg,2005). In sum, the social identity analysis of leadership might also help to better understand the processes underlyingcharismatic and transformational leadership perceptions (see van Knippenberg & Hogg, 2003, for an extensive discussion ofthis point).
449S.R. Giessner et al. / The Leadership Quarterly 20 (2009) 434–451
4.4. Limitations and directions for future research
Of course, the present study is not without its weaknesses and limitations. Our research focused on followers' perceptions ofleadership effectiveness. Our goal was to understand how followers evaluate leaders after performance feedback informationbecause the followers' endorsement of a leader is important for a leader's ability to influence andmotivate the followers (Chemers,2001; Yukl, 2001) and, thus, to also increase performance levels of groups (van Knippenberg & Hogg, 2003). We do not claim,however, that other processes and variables might be as well influenced by performance information and/ or perceived leadergroup prototypicality. The findings of Study 3 indicate that leader group prototypicality is influenced by performance information.Other variables like changes in trust in leadership, or perceived charisma of the leader could be influenced by the performanceinformation and leader group prototypicality. Changes in trust in leadership might be interesting in this regard. Given the findingsof Study 3 relating to changes in leader prototypicality perceptions, we may assume that trust in leadership will also be influencedby performance information. This process might additionally underlie the effects on perceived leadership effectiveness.
In our research, we used three different paradigms to test our predictions. Each paradigm has certain weaknesses in terms ofcausality, generalization, or manipulation. We relied on (laboratory) experimental methodologies in Study 1 and 3. The clearadvantage of this approach is that it allows for conclusions regarding causality with high internal validity. However, such anapproach is not sufficient to provide external validity. Therefore, we conducted a survey in a field setting in a Study 2. This cross-sectional study provides data with stronger external, but weaker internal validity. Thus, each paradigm can be criticizedindividually. However, similar to previous leadership studies combining laboratory experiments, scenario experiments, andsurveys of leadership in the field (De Cremer et al., 2005; De Cremer & van Knippenberg, 2002, 2004; van Knippenberg & vanKnippenberg, 2005; also see Dipboye, 1990; Locke, 1986), we could replicate our experimental findings in a field setting. Thus, thestrength of our research lies in the overall consistent effects across all three studies. Our theoretical account of these effectsprovides a parsimonious explanation of the findings in all studies.
However, we also want to point out some exceptions to our findings, which were not replicated across all three studies andtherefore might require further research to establish their reliability. First, we were not able to test the mediating role of trust inleadership in our field study. Our findings and conclusions on trust in leadership are solely based on experimental researchparadigms. These settings have more demand characteristics than field settings (Judd, Smith, & Kidder, 1991). Thus, we cannot yetgeneralize the experimental findings regarding trust in leadership to the field. In addition, our measure of trust in leadershipconsisted only of two items andmight be questioned in terms of its validity. Note, however, that the pilot study of Study 3 indicatedthat the measure differed from leadership effectiveness evaluations and leader prototypicality perceptions. Nevertheless, futureresearch should test this effect in the field with a more reliable measure. Second, the findings of Study 3 indicated that perceptionsof leader prototypicality were influenced by performance information. Thus, although we treated these two variables asindependent in our research, this finding suggests that these two variables might be correlated in the field. Indeed, the findings inStudy 2 support this assumption. Although it was not the main focus of our research, we think that it is an important avenue tostudy the longitudinal effects of performance information on prototypicality and trust perceptions.
We applied a social identity analysis of leadership to predict that leader group prototypicality has a moderating effect on therelation between performance information and followers' evaluations of leadership effectiveness. Adapting such a perspective, wewould also predict a stronger moderating effect the more followers define themselves in terms of their group membership (i.e.,group identification). Group identification has been shown to be a key moderator of the effects of group prototypicality onevaluation of groupmembers, and, therefore, also group leaders (Hains et al., 1997; Hogg, 2001; Platow et al., 2003). Consequently,we argue that the moderating effect of group prototypicality will be more pronounced if followers have a strong degree of groupidentification. In our studies, participants were either direct followers of the leader's party (Study 1), followers of a district leader(Study 2), or followers of an ostensible team leader (Study 3). Thus, we assumed that our participants had some general degree ofidentificationwith their team. Actually, the results of the non-followers in Study 1 (see footnote 3) give some indirect evidence forthis assumption because only our follower sample supported our hypotheses but not the non-follower sample. Nevertheless, whilethis is a prediction that is in line with a social identity analysis of leadership, it still requires direct empirical evidence.
Finally, it is also important to note that in a natural context the group prototypicality of a leader is not just a “given” as it hasbeen in our studies. Rather, leaders actively manage their “image of prototypicality” (Haslam, 2001; Reicher & Hopkins, 2003; vanKnippenberg & Hogg, 2003). A leader defines the group and its surrounding social context through behaviors and decisions. Thus,leaders define the “identity” of the group, and can be, therefore, described as ‘entrepreneurs of identity’ (Reicher & Hopkins, 2003).Research by Reicher and Hopkins provide empirical evidence of such processes in the context of political leadership. Thus, leadersmay actively influence their image of being group prototypical. By doing so, leaders can create some “license to fail” in forthcomingtasks if they create an image of being very prototypical for their team or organization. Recently, Lord and Hall (2005) argued thatleaders develop their leadership skills over time. They reasoned that mainly leaders in a later developmental stage in terms ofleadership skills (i.e., intermediate level and deep structure level) will focus on a collective identity level. Therefore, especiallythese leadersmight be able to be such entrepreneurs of identity. So far, most of this research consists of qualitative case studies andit would be interesting to test these ideas under more controlled laboratory conditions in the future.
4.5. To conclude
The performance of leaders often influences the attributions of leader abilities. As a result, the leaders' basis to influence andmobilize followers will be threatened or strengthened by such performance information. Knowing what factors underlie and
450 S.R. Giessner et al. / The Leadership Quarterly 20 (2009) 434–451
influence this attribution process might help leaders, followers, and organizations to better understand and respond toperformance information. The present study hopes to give this area of research new impetus by pointing to the value of an analysisof responses to leader goal achievement in terms of social identity processes.
References
Abrams, D., & Hogg, M. A. (2001). Collective identity: Group membership and self-conception. In M. A. Hogg & R.S. Tindale (Eds.), Blackwell handbook of socialpsychology: Group processes (pp. 425−460). Oxford, UK: Blackwell.
Aiken, L. S., & West, S. G. (1991). Multiple regression: Testing and interpreting interactions. Newbury Park, CA: Sage.Awamleh, R., & Gardner, W. L. (1999). Perceptions of leader charisma and effectiveness: The effects of vision content, delivery, and organizational performance.
Leadership Quarterly, 10, 345−373.Baron, R. M., & Kenny, D. A. (1986). The moderator–mediator variable distinction in social psychological research: Conceptual, strategic, and statistical
considerations. Journal of Personality and Social Psychology, 51, 1173−1182.Brewer, M. B. (1979). In-group bias in the minimal intergroup situation: A cognitive–motivational analysis. Psychological Bulletin, 86, 307−324.Chemers, M. M. (2001). Leadership effectiveness: An integrative review. In M. A. Hogg & R.S. Tindale (Eds.), Blackwell handbook of social psychology: Group processes
(pp. 376−399). Oxford, UK: Blackwell.Choi, Y., & Mai-Dalton, R. R. (1998). On the leadership function of self-sacrifice. Leadership Quarterly, 9, 475−501.Cohen, J., Cohen, P., West, S. G., & Aiken, L. S. (2003). Applied multiple regression/correlation analysis fort he behavioral sciences, (3rd ed) Mawah, New Jersey:
Lawrence Erlbaum Associates.Conger, J. A., & Kanungo, R. N. (1987). Towards a behavioral theory of charismatic leadership in organizational settings. Academy of Management Review, 12,
637−647.De Cremer, D. (2002). Charismatic leadership and cooperation in social dilemmas: A matter of transforming motives? Journal of Applied Social Psychology, 32,
997−1016.De Cremer, D., van Knippenberg, B., van Knippenberg, D., Mullenders, D., & Stinglhamber, F. (2005). Rewarding leadership and fair procedures as determinants of
self-esteem. Journal of Applied Psychology, 90, 3−12.De Cremer, D., & van Knippenberg, D. (2002). How do leaders promote cooperation? The effects of charisma and procedural fairness. Journal of Applied Psychology,
87, 858−866.De Cremer, D., & van Knippenberg, D. (2004). Leader self-sacrifice and leadership effectiveness: The moderating role of leader self-confidence. Organizational
Behavior and Human Decision Processes, 95, 140−155.Dipboye, R. L. (1990). Laboratory vs. field research in industrial and organizational psychology. In C. L. Cooper & I.T. Robertson (Eds.), International review of
industrial and organizational psychology, Vol. 5. (pp. 1−34)Chichester, United Kingdom: Wiley.Dirks, K. T., & Ferrin, D. L. (2002). Trust in leadership: Meta-analytic findings and implications for research and practice. Journal of Applied Psychology, 87, 611−628.Duck, J. M., & Fielding, K. S. (1999). Leaders and subgroups: One of us or one of them? Group Processes and Intergroup Relations, 2, 203−230.Ensari, N., & Murphy, S. E. (2003). Cross-cultural variations in leadership perceptions and attribution of charisma to the leader. Organizational Behavior and Human
Decision Processes, 92, 52−66.Epitropaki, O., & Martin, R. (2004). Implicit leadership theories in applied settings: Factor structure, generalizability, and stability over time. Journal of Applied
Psychology, 89, 293−310.Evans, M. G. (1985). A Monte Carlo study of the effects of correlated method variance in moderated multiple regression analysis. Organizational Behavior and
Human Decision Processes, 36, 305−323.Fielding, K. S., & Hogg, M. A. (1997). Social identity, self-categorization, and leadership: A field study of small interactive groups. Group Dynamics: Theory, Research,
and Practice, 1, 39−51.Hains, S. C., Hogg, M. A., & Duck, J. M. (1997). Self-categorization and leadership: Effects of group prototypicality and leader stereotypicality. Personality and Social
Psychology Bulletin, 23, 1087−1100.Haslam, S. A. (2001). Psychology in organizations: The social identity approach. London: Sage.Haslam, S. A., & Platow, M. J. (2001). The link between leadership and followership: How affirming social identity translates vision into action. Personality and Social
Psychology Bulletin, 27, 1469−1479.Haslam, S. A., Platow, M. J., Turner, J. C., Reynolds, K. J., McGarty, C., Oakes, P., et al. (2001). Social identity and the romance of leadership: The importance of being
seen to be ‘doing it for us'. Group Processes and Intergroup Relations, 4, 191−205.Hewstone, M., Rubin, M., & Willis, H. (2002). Intergroup bias. Annual Review of Psychology, 53, 575−604.Hogg, M. A. (2001). A social identity theory of leadership. Personality and Social Psychology Review, 5, 184−200.Hogg, M. A. (2003). Social identity. In M. R. Leary & J.P. Tangney (Eds.), Handbook of self and identity (pp. 462−479). New York: Guilford.Hogg, M. A., Cooper-Shaw, L., & Holzworth, D. W. (1993). Group prototypicality and depersonalized attraction in small interactive groups. Personality and Social
Psychology Bulletin, 19, 452−465.Hogg, M. A., Hains, S. C., & Mason, I. (1998). Identification and leadership in small groups: Salience, frame of reference, and leader stereotypicality effects on leader
evaluations. Journal of Personality and Social Psychology, 75, 1248−1263.Hogg, M. A., & van Knippenberg, D. (2003). Social identity and leadership processes in groups. In M. P. Zanna (Ed.), Advances in experimental social psychology,
Vol. 35. (pp. 1−52)San Diego, CA: Academic Press.Hollander, E. P. (1964). Leaders, groups, and influence. New York: Oxford University Press.Hollander, E. P., & Offerman, L. R. (1990). Power and leadership in organizations. American Psychologist, 45, 179−189.House, R. J., & Aditya, R. N. (1997). The social scientific study of leadership: Quo vadis? Journal of Management, 23, 409−473.House, R. J., Hanges, P. J., Ruiz-Quantilla, S. A., Dorfan, P. W., Javadin, M., Dickson, M., et al. (1999). Cultural influences on leadership and organizations: Project
GLOBE. In W. H. Mobley (Ed.), Advances in global leadership, vol. 1. (pp. 171−233)Stamford, CT: JAI Press.Judd, C. M., Smith, E. R., & Kidder, L. H. (1991). Research methods in social relations, (6th ed) Orlando, FL: Holt, Rinehart and Winston.Locke, E. A. (Ed.). (1986). Generalizing from laboratory to field settings: Research findings from industrial–organizational psychology, organizational behavior, and
human resources management Lexington, MA: Heath-Lexington Books.Lord, R. G., Binning, J. F., Rush, M. C., & Thomas, J. C. (1978). The effect of performance cues and leader behavior on questionnaire ratings of leadership behavior.
Organizational Behavior and Human Performance, 21, 27−39.Lord, R. G., & Emrich, C. G. (2001). Thinking outside the box by looking inside the box: Extending the cognitive revolution in leadership research. Leadership
Quarterly, 11, 551−579.Lord, R. G., Foti, R. J., & DeVader, C. L. (1984). A test of leadership categorization theory: Internal structure, information processing, and leadership perceptions.
Organizational Behavior and Human Performance, 34, 343−378.Lord, R. G., & Hall, R. (2003). Identity, leadership categorization and leadership schema. In D. van Knippenberg & M.A. Hogg (Eds.), Leadership and power: Identity
processes in groups and organizations (pp. 48−64). London: Sage.Lord, R. G., & Hall, R. (2005). Identity, deep structure and the development of leadership skill. Leadership Quarterly, 16, 591−615.Lord, R. G., & Maher, K. (1991). Leadership and Information Processing: Linking Perceptions and Performance. Boston, MA: Unwin Hyman.Maurer, T. J., & Lord, R. G. (1991). An exploration of cognitive demands in group interaction as a moderator of information processing variables in perceptions of
leadership. Journal of Applied Social Psychology, 21, 821−839.

451S.R. Giessner et al. / The Leadership Quarterly 20 (2009) 434–451
Mayer, M. (2004). Europawahl - Grüne holen in Marburg 28,1 Prozent [European elections - Greens get 28,1 per cent]. Oberhessische Presse. Retrieved November10, 2004, from http://www.op-marburg.de/op/home.news.lokal/article.op.jsp?-marburg.de/op/home.news.lokal/article.op.jsp?id=20040613.436141
McClelland, G. H., & Judd, C. M. (1993). Statistical difficulties of detecting interactions and moderator effects. Psychological Bulletin, 114, 376−390.Meindl, J. R., & Ehrlich, S. B. (1987). The romance of leadership and the evaluation of organizational performance. Academy of Management Journal, 30, 91−109.Meindl, J. R., Ehrlich, S. B., & Dukerich, J. M. (1985). The romance of leadership. Administrative Science Quarterly, 30, 78−102.Oakes, P., Haslam, A., & Turner, J. C. (1998). The role of prototypicality in group influence and cohesion: Contextual variation in the graded structure of social
categories. In S. Worchel, J. F. Morales, D. Páez, & J. -C. Deschamps (Eds.), Social identity: International perspectives (pp. 75−92). London: Sage.Offermann, L. R., Kennedy, J. K., Jr., & Wirtz, P. W. (1994). Implicit leadership theories: Content, structure and generalizability. Leadership Quarterly, 5, 43−58.Phillips, J. S., & Lord, R. G. (1981). Causal attributions and perceptions of leadership. Organizational Behavior and Human Behavior, 28, 143−163.Pierro, A., Cicero, L., Bonaiuto, M., van Knippenberg, D., & Kruglanski, A. W. (2005). Leader group prototypicality and leadership effectiveness: The moderating role
of need for cognitive closure. The Leadership Quarterly, 16, 503−516.Platow, M. J., Haslam, S. A., Foddy, M., & Grace, D. M. (2003). Leadership as the outcome of self-categorization processes. In D. van Knippenberg & M.A. Hogg (Eds.),
Leadership and power: Identity processes in groups and organizations (pp. 34−47). London: Sage.Platow, M. J., Hoar, S., Reid, S. A., Harley, K., & Morrison, D. (1997). Endorsement of distributively fair and unfair leaders in interpersonal and intergroup situations.
European Journal of Social Psychology, 27, 465−494.Platow, M. J., Reid, S. A., & Andrew, S. (1998). Leadership endorsement: The role of distributive and procedural behavior in interpersonal and intergroup contexts.
Group Processes and Intergroup Relations, 1, 35−47.Platow, M. J., & van Knippenberg, D. (2001). A social identity analysis of leadership endorsement: The effects of leader ingroup prototypicality and distributive
intergroup fairness. Personality and Social Psychology Bulletin, 27, 1508−1519.Platow, M. J., van Knippenberg, D., Haslam, S. A., van Knippenberg, B., & Spears, R. (2006). A special gift we bestow on you for being representative of us:
Considering leader charisma from a self-categorization perspective. British Journal of Social Psychology, 45, 303−320.Podsakoff, P. M., MacKenzie, S. B., Lee, J., & Podsakoff, N. P. (2003). Common method biases in behavioral research: A critical review of the literature and
recommended remedies. Journal of Applied Psychology, 88, 879−903.Reicher, S., & Hopkins, N. (2001). Self and Nation. London: Sage.Reicher, S., & Hopkins, N. (2003). On the science and art of leadership. In D. van Knippenberg & M.A. Hogg (Eds.), Leadership and power: Identity processes in groups
and organizations (pp. 197−209). London: Sage.Rosch, E. (1978). Principles of categorization. In E. Rosch & B.B. Lloyd (Eds.), Cognition and categorization (pp. 27−48). Hillsdale, NJ: Erlbaum.Rousseau, D. M., Sitkin, S. B., Burt, R. S., & Camerer, C. (1998). Not so different after all: A cross-discipline view of trust. Academy of Management Review, 23,
393−404.Rush, M. C., Thomas, J. C., & Lord, R. G. (1977). Implicit leadership theory: A potential threat to the internal validity of leader behavior questionnaires. Organizational
Behavior and Human Performance, 20, 93−110.Shamir, B. (1992). Attribution of influence and charisma to the leader: The romance of leadership revisited. Journal of Applied Social Psychology, 22, 386−407.Sherif, M., & Sherif, C. W. (1964). Reference groups. New York: Harper & Row.Tajfel, H. (1978). Differentiation Between Social Groups: Studies in the Social Psychology of Intergroup Relations. New York: Academic Press.Tajfel, H. (1982). Social psychology of intergroup relations. Annual Review of Psychology, 33, 1−39.Tajfel, H., & Turner, J. C. (1986). The social identity theory of intergroup behaviour. In S. Worchel &W.G. Austin (Eds.), Psychology of intergroup relations (pp. 7−24).
Chicago: Nelson-Hall.Turner, J. C. (1985). Social categorization and the self-concept: A social cognitive theory of group behaviour. In E. J. Lawler (Ed.), Advances in group processes, Vol.2.
(pp. 77−122)Greenwich, CT: JAI Press.Turner, J. C. (1991). Social influence. Milton Keynes, England: Open University Press.Turner, J. C., Hogg, M. A., Oakes, P. J., Reicher, S. D., &Wetherell, M. S. (1987). Rediscovering the social group: A self-categorization theory. Oxford, U.K.: Basil Blackwell.van Knippenberg, B., & van Knippenberg (2005). Leader self-sacrifice and leadership effectiveness: The moderating role of leader prototypicality. Journal of Applied
Psychology, 90, 25−37.van Knippenberg, D., & Hogg, M. A. (2003). A social identity model of leadership effectiveness in organizations. In B. M. Staw & R.M. Kramer (Eds.), Research in
organizational behavior, Vol. 25. (pp. 243−295)Amsterdam: Elsevier.van Knippenberg, D., van Knippenberg, B., De Cremer, D., & Hogg, M. A. (2004). Leadership, self, and identity: A review and research agenda. Leadership Quarterly,
15, 825−856.van Knippenberg, D., van Knippenberg, B., & van Dijk, E. (2000). Who takes the lead in risky decision making? Effects of group members' individual riskiness and
prototypicality. Organizational Behavior and Human Decision Processes, 83, 213−234.Yukl, G. (2001). Leadership in organizations, (5th ed.) New York: Prentice Hall.Yzerbyt, V. Y., Muller, D., & Judd, C. M. (2004). Adjusting researchers' approach to adjustment: On the use of covariates when testing interactions. Journal of
Experimental Social Psychology, 40, 424−431.