leveraging energy management and information systems … · leveraging energy management and...
TRANSCRIPT

Leveraging Energy Management and Information Systems (EMIS) for MBCx
Hannah Kramer, PELawrence Berkeley National Lab Affiliate

AIA Quality Assurance
The Building Commissioning Association is a Registered Provider with The American Institute of Architects Continuing Education Systems (AIA/CES). Credit(s) earned on completion of this program will be reported to AIA/CES for AIA members. Certificates of the Completion for both AIA members and non-AIA members are available upon request.
This program is registered with AIA/CES for continuing professional education. As such, it does not include content that may be deemed or construed to be an approval or endorsement by the AIA of any material of construction or any method or manner of handling, using, distributing, or dealing in any material or product.
Questions related to specific materials, methods, and services will be addressed at the conclusion of this presentation.
2

Learning Objectives
3
1. Distinguish different types of energy management and information systems (EMIS) technologies
2. Share available data on the cost and benefits of using EMIS technologies with owners and facility managers
3. Implement the monitoring and verification capabilities within an EMIS
4. Use publically-available resources to streamline planning, installation, and use of EMIS systems in MBCx projects

Motivation to use EMISFeatures and Capabilities of EMISUsing Your EMIS for M&V and MBCxDOE’s Smart Energy Analytics CampaignQ&A
Agenda
4

• Data is everywhere and getting cheaper• Need granular data to manage energy• Continuously monitor and automate analysis
Motivation to use Energy Management and Information Systems (EMIS)
5

EMIS and Monitoring-based Cx (MBCx)
6
MBCx Process: • Perform EBCx to meet owners operating requirements• Use a data-driven, automated approach to track and respond to
building performance issues resulting in a continuously commissioned facility
Meter-Level EMIS
Benchmarking and Monthly Utility Bill Analysis
Energy Information System
Advanced EIS
System-Level EMIS
Building Automation System
Fault Detection and Diagnostics
Automated System Optimization

Lots of data = high value?Which data? What kind of EMIS?How do I set it up?How often analyzed?What should I look for? Who has the time?What’s the cost-benefit?
Barriers to Using EMIS
7

Unlock hidden savings potential with ongoing and automated data analysis – research shows significant energy savings using EIS
Use data analysis to stay on top of O&M issues before they become bigger problems
Keep tabs on savings so it persists - easier with the data, M&V and energy management process in place
3 Key Benefits from Implementing EMIS and MBCx
8

Energy Management and Information Systems (EMIS)
9
Meter-Level EMIS
Benchmarking and Monthly Utility Bill Analysis
Energy Information System
Advanced EIS
System-Level EMIS
Building Automation System
Fault Detection and Diagnostics
Automated System Optimization
The boundaries can be fuzzy; some tools cross categories, e.g., energy information systems with FDD capabilities

Fault Detection and Diagnostics (FDD) & Automated System Optimization (ASO)
10
AHU, VAV terminal box, RTU, chiller,
existing BAS points
External sensors
Ethernet LAN
Web assess via browser
Expert rulesPhysical or statistical models
FDD tools
Proprietary optimization algorithms
HVAC, BAS control set-points
Ethernet LAN
Web assess via browser
HVAC, other BAS points
ASO tools
FDD – a tool to automatically identify HVAC system or equipment level faults, and sometimes root causes
ASO – a tool to dynamically change HVAC BAS settings to optimize energy use and/or comfort
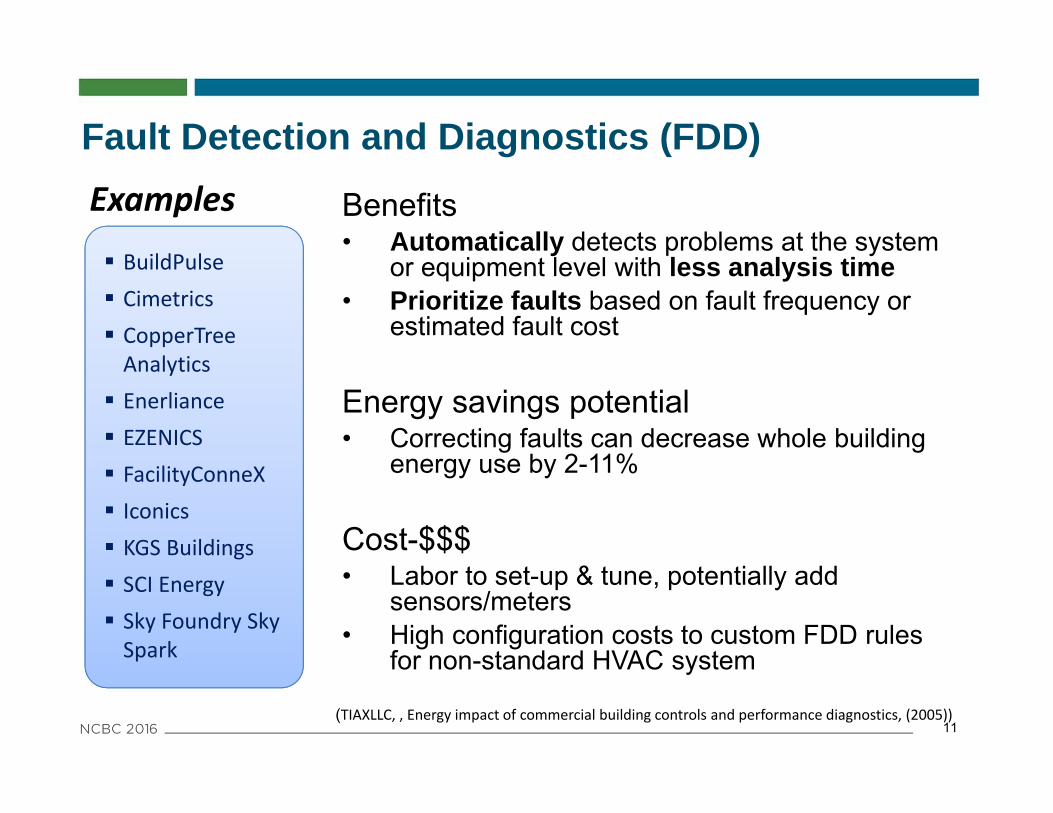
Benefits• Automatically detects problems at the system
or equipment level with less analysis time• Prioritize faults based on fault frequency or
estimated fault cost
Energy savings potential• Correcting faults can decrease whole building
energy use by 2-11%
Cost-$$$• Labor to set-up & tune, potentially add
sensors/meters• High configuration costs to custom FDD rules
for non-standard HVAC system
Fault Detection and Diagnostics (FDD)
11
Examples
BuildPulse Cimetrics CopperTreeAnalytics Enerliance EZENICS FacilityConneX Iconics KGS Buildings SCI Energy Sky Foundry Sky Spark
(TIAXLLC, , Energy impact of commercial building controls and performance diagnostics, (2005))

Meter-level Energy Information Systems
12
Customer Energy
Dashboard
Engagement Tools
EIS Advanced EIS
Building Characteristics
Weather Data
Interval Meter Data
• Baseline model
• Track savings
Verify Savings
• Disaggregate end uses
• Identify measures
Load Analytics
• Flag high energy compared to predicted
Persistence
Track and Benchmark

Energy Information Systems (EIS)
13
EIS, a bar graph tracking energy consumption pattern
Graphic Source: Lucid Design Group

Advanced EIS: Track Energy Savings
14
Graphic Source: Cascade Energy

Median energy savings relative to EIS installation year• 17% for individual sites ($56k)• 8% for portfolios ($1.3M)
90% said they couldn’t achieve this savings without EIS
Correlation between 4 factors and highest % savings• Extent of efficiency projects undertaken • EUI prior to EIS installation• Depth of metering installed with EIS• Total years EIS installed
Range in cost among offerings• Median upfront cost: $1400/building; $0.01/sq ft; $230/pt• Median ongoing cost: $400/year per bldg; $0.01/sq ft; $200/pt
LBNL Study on Costs and Benefits of EIS1Granderson, J, Lin, G, Piette, MA. Energy information systems (EIS): Technology costs, benefits, and best practice uses. Lawrence Berkeley National Laboratory, November 2013. LBNL‐6476E
15

LBNL EIS Research Results
16
“Costs and Energy-Saving Benefits of EIS”, webinar Granderson, J., G. Lin. November 2013. http://eis.lbl.gov/pubs/costs-benefits-eis-11-2013.pdf

Benefits• Review load profiles on a regular basis• Track savings in real time, alarm when energy
exceeds expectations• Take weather and occupancy changes into
account
Energy savings potential• Median decrease in energy: 8-17%
Costs - $ to $$• 3rd party software (SaaS or installed on-site)• Service contractor (Software + service
package)
Energy Information Systems (EIS) and Advanced EIS
17
Examples Buildling iQ Energent Energy ICT EnerNOC eSight Energy Gridium ICONICS Lucid BuildingOS MACH Energy Noveda Technologies Schneider Electric Switch Automation SENSEI
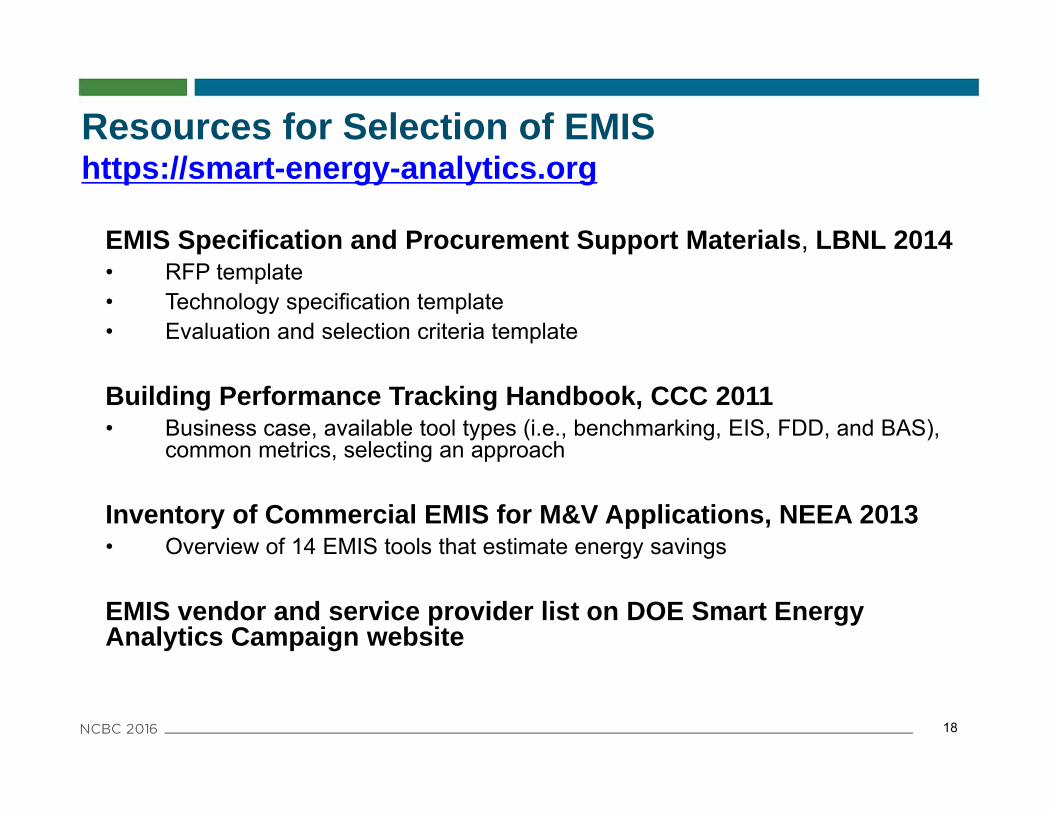
Resources for Selection of EMIShttps://smart-energy-analytics.org
18
EMIS Specification and Procurement Support Materials, LBNL 2014• RFP template• Technology specification template• Evaluation and selection criteria template
Building Performance Tracking Handbook, CCC 2011• Business case, available tool types (i.e., benchmarking, EIS, FDD, and BAS),
common metrics, selecting an approach
Inventory of Commercial EMIS for M&V Applications, NEEA 2013 • Overview of 14 EMIS tools that estimate energy savings
EMIS vendor and service provider list on DOE Smart Energy Analytics Campaign website

Using EMIS for M&V
19Source: LBNL Energy Information Handbook, 2011

Guidelines:• IPMVP Option C• ASHRAE Guideline 14
Utility billing analysis• Rule of thumb: at least 10% whole building savings• 1 year baseline; 1 year post
Interval data analysis (hourly)• Can detect lower levels of savings • Typically 1 year baseline and at least 6 months post
Whole Building M&VGuidelines and Rules of Thumb
20

Compared to billing analysis• Requires less time to verify savings• Improved accuracy
Compared to engineering calculations• Uses measured data to quantify savings• Allows for “find and fix” • Captures O&M and behavioral savings• Can reduce calculation and verification costs
Use ongoing M&V to track performance and increase persistence of savings
Why Whole Building M&V with interval data?
21

Baselines automatically created
• interval meter data • weather data • sometimes other variables
User enters the date of implementation, savings automatically calculated
How do I know if the tool accurately predicts energy use?
Using EMIS for Automated M&V
22

Developed a testing procedure to quantify baseline model uncertainty
Tested interval baseline models from industry, EMIS vendors, and academic communities
• 4 open, 6 proprietary models• Tested using interval data from over 400 buildings• 12 month, 9 month, 6 month, 3 month training periods
Mix of approaches but all models included independent variables:
• time of day• day of week• outside air temperature
LBNL M&V 2.0 Research
23

Results: Percent Error (NMBE)
24
−25.0
−22.5
−20.0
−17.5
−15.0
−12.5
−10.0
−7.5
−5.0
−2.5
0.0
2.5
5.0
7.5
10.0
12.5
15.0
M1 M2 M3 M4 M5 M6 M7 M8 M9 M10model
NMBE (N=441) 12 month training
−25.0
−22.5
−20.0
−17.5
−15.0
−12.5
−10.0
−7.5
−5.0
−2.5
0.0
2.5
5.0
7.5
10.0
12.5
15.0
M1 M2 M3 M4 M5 M6 M7 M8 M9 M10model
NM
BE (%
)
NMBE (N=470) 9 month training
−25.0
−22.5
−20.0
−17.5
−15.0
−12.5
−10.0
−7.5
−5.0
−2.5
0.0
2.5
5.0
7.5
10.0
12.5
15.0
M1 M2 M3 M4 M5 M6 M7 M8 M9 M10model
NMBE (N=530) 6 month training
−25.0
−22.5
−20.0
−17.5
−15.0
−12.5
−10.0
−7.5
−5.0
−2.5
0.0
2.5
5.0
7.5
10.0
12.5
15.0
M1 M2 M3 M4 M5 M6 M7 M8 M9 M10model
NM
BE (%
)
NMBE (N=537) 3 month training
90th %ile
75th %ile
Mean
25th %ile
10th %ile

Differences between models are mostly small
Across the group of models, for 12-month training 12-mo prediction
Average median percent error ~-1.2%Range of median errors is ~-3% to 0.4%
Errors in predicting energy use are low for many buildings and many models (open and proprietary)
This is the performance from the fully automated case, with no ‘non-routine’ adjustments from an engineer
What Do These Results Tell Us?
25

Using EMIS for MBCx
26

Developing a Performance Monitoring Approach
27
Set organizational goals
Establish roles & responsibilities
Understand existing systems, data, staff expertise
Define monitoring & analysis activities
Identify required sensing, metering
Select a tool(s)
See Primer on Organizational Use of EMIS for more information :
http://betterbuildingssolutioncenter.energy.gov/sites/default/files/attachments/A_Primer_on_Organizational_Use_of_EMIS_V1.1.pdf

Demonstrate success Start small using existing data streams or whole building data
Help get value out of EMIS Support development of action plans using the EMIS analysis
Review cost-benefit information Show how others are utilizing EMIS to their benefitTrack energy savings using EMIS
What can Cx providers do to help building owners become more accepting of EMIS systems?
28
29
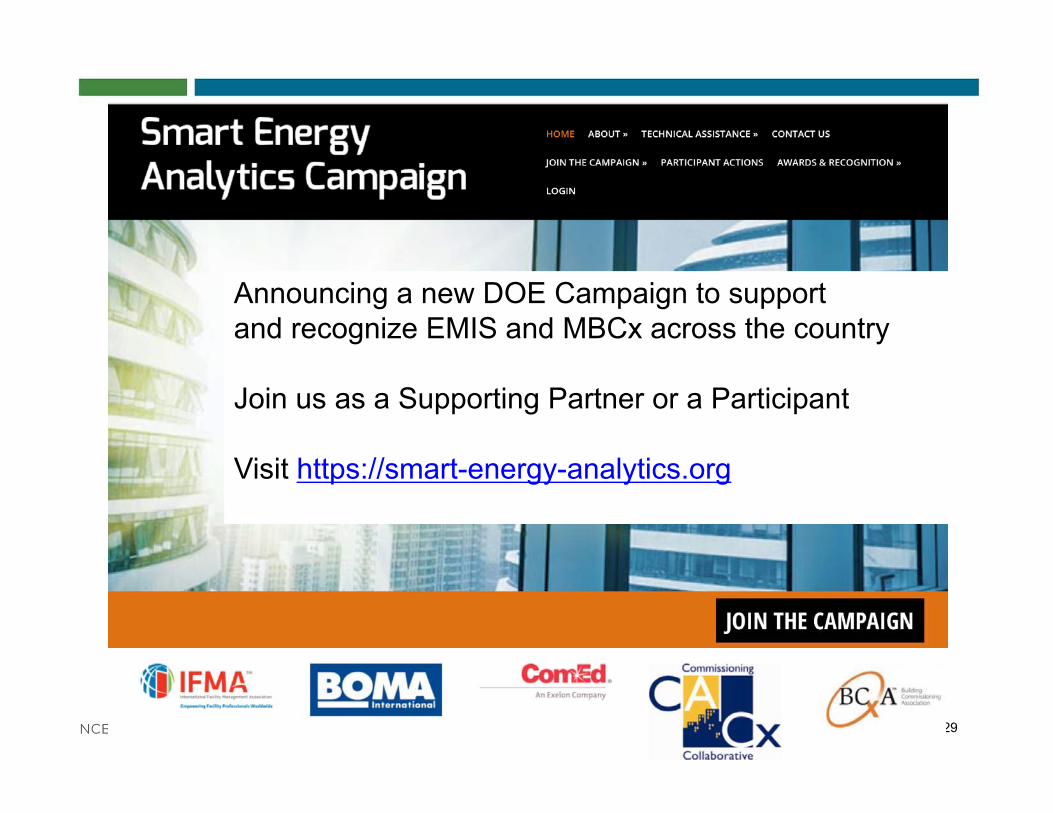
Announcing a new DOE Campaign to support and recognize EMIS and MBCx across the country
Join us as a Supporting Partner or a Participant
Visit https://smart-energy-analytics.org

Goal: Facilitate adoption of analytics software and ongoing monitoring to help owners and managers find and fix building performance issues
Participants that pledge to implement EMIS to save energy will receive technical assistance and recognition
Areas of technical assistance for participants:How to justify EMISHow to set up, configureHow to make best use of data
DOE Smart Energy Analytics Campaign
30

Develop an MBCx plan and implement an ongoing MBCx process
10
Minimum RequirementsEMIS installations may be new, existing, or enhanced and include one of the following:
Any energy management process is eligible(RCx, MBCx, SEM, Ongoing Cx, etc.)
EIS with submetering of major end uses and embedded M&V
FDD or ASO software with BAS data for all HVAC systems
Use an EMIS to analyze data and identify energy‐saving opportunities
Implement at least one of these energy‐savings opportunities during Campaign
EIS with whole building hourly meter data
OR
FDD or ASO software with BAS data stream for one system (e.g. chilled water)
Best PracticeAchieve minimum requirements
AND
Participant Campaign Pledge

32
PLED
GE
SHARE:Pledge to:1) Install EMIS or use existing EMIS2) Analyze energy use3) Implement measures
ACTIONS
SHARE:1) Measures implemented2) EMIS and Process implemented3) Annual energy use
AWAR
DS
SHARE:1) Actions2) Energy savings 3) Costs
Participant Process
33
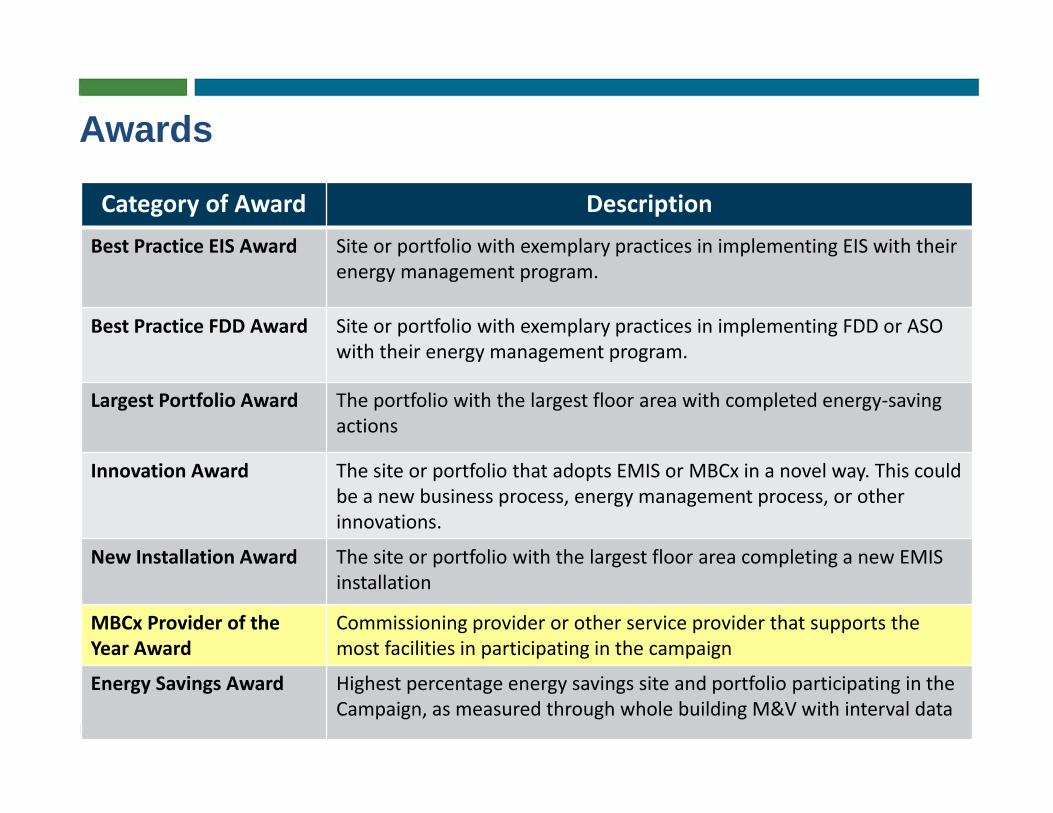
Category of Award DescriptionBest Practice EIS Award Site or portfolio with exemplary practices in implementing EIS with their
energy management program.
Best Practice FDD Award Site or portfolio with exemplary practices in implementing FDD or ASO with their energy management program.
Largest Portfolio Award The portfolio with the largest floor area with completed energy‐saving actions
Innovation Award The site or portfolio that adopts EMIS or MBCx in a novel way. This could be a new business process, energy management process, or other innovations.
New Installation Award The site or portfolio with the largest floor area completing a new EMIS installation
MBCx Provider of the Year Award
Commissioning provider or other service provider that supports the most facilities in participating in the campaign
Energy Savings Award Highest percentage energy savings site and portfolio participating in the Campaign, as measured through whole building M&V with interval data
Awards

Join as a Participant
• Owners, facility managers, energy managers, operators
Join as a Supporting Partner
• Cx providers, service providers, trade organizations, utilities, EMIS and metering vendors
https://smart-energy-analytics.org
DOE Smart Energy Analytics Campaign
34

Hannah Kramer, P.E.Smart Energy Analytics Campaign LeadLawrence Berkeley National Laboratory