lessons learned about reward program effectiveness
TRANSCRIPT
Lessons Learned About Reward Program Effectiveness
2© 2009 Hay Group. All Rights Reserved
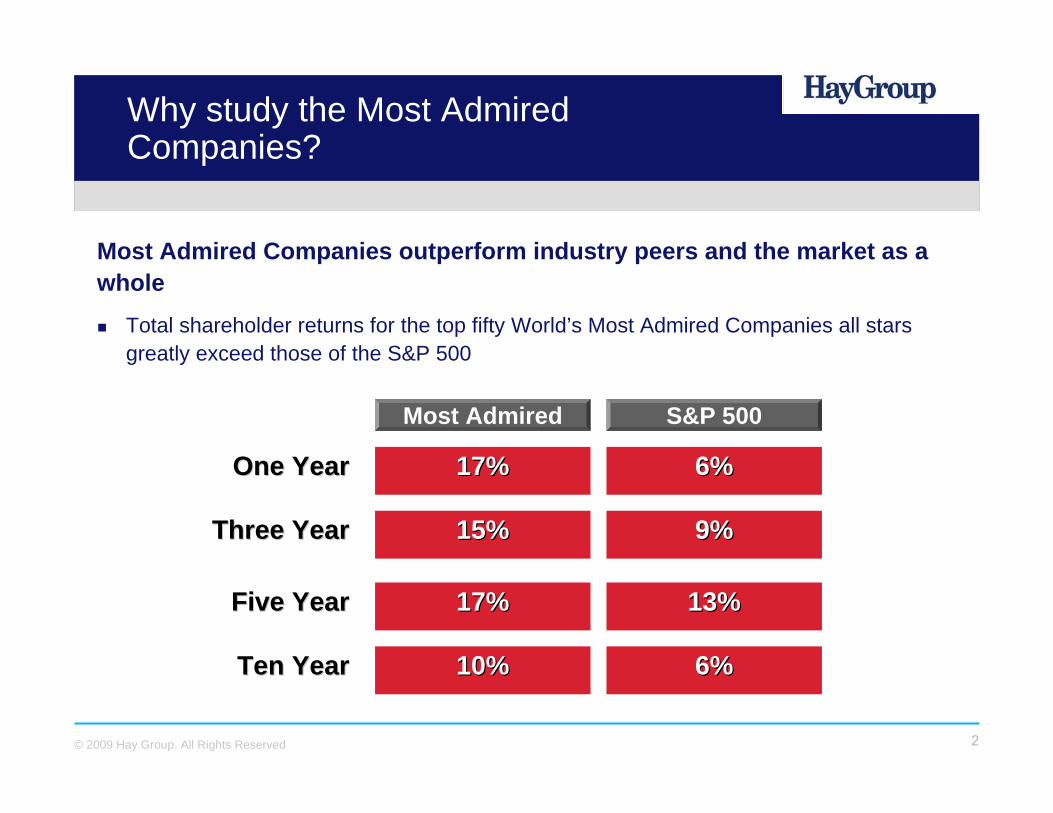
Why study the Most Admired Companies?
Most Admired Companies outperform industry peers and the market as a whole
Total shareholder returns for the top fifty World’s Most Admired Companies all stars greatly exceed those of the S&P 500
Most Admired
17%17%
S&P 500
6%6%
15%15% 9%9%
17%17% 13%13%
10%10% 6%6%
One YearOne Year
Three YearThree Year
Five YearFive Year
Ten YearTen Year
3© 2009 Hay Group. All Rights Reserved
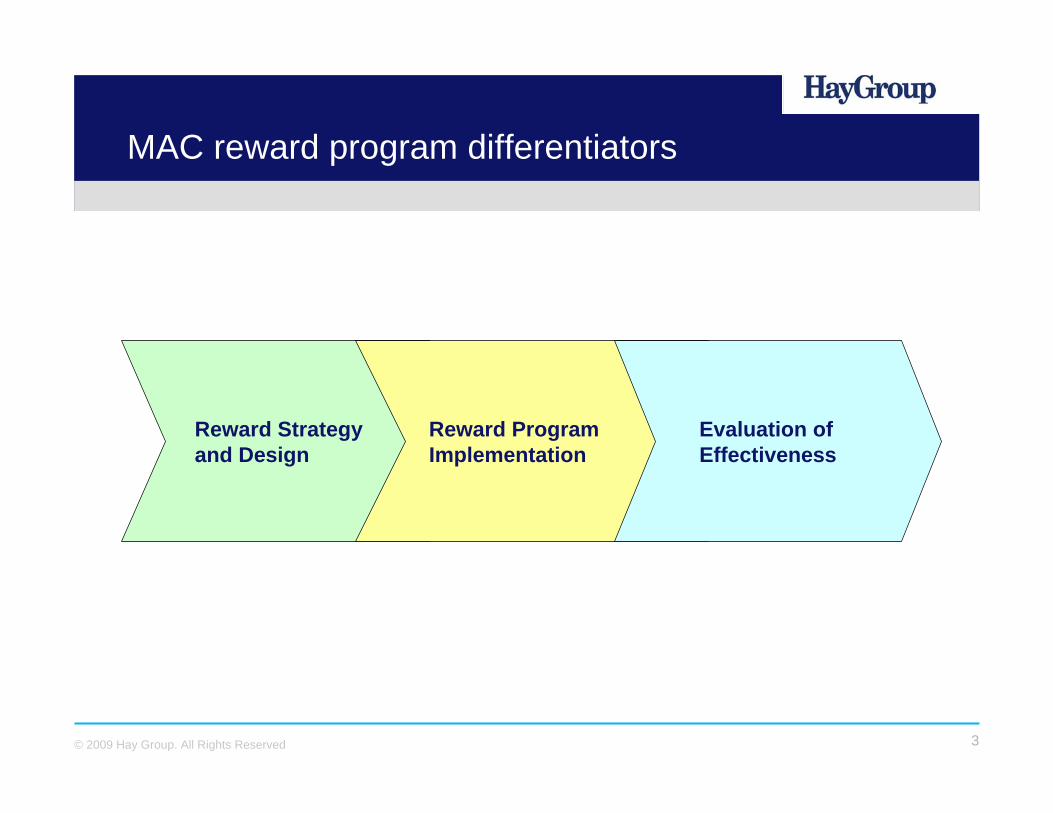
MAC reward program differentiators
Reward Strategyand Design
Reward ProgramImplementation
Evaluation of Effectiveness
Tracy KofskiGeneral Mills
David NessMedtronic
Marc WallaceHay Group
John MulliganTarget Corp.
Adam Kahle Hay Group

Total Rewards
6© 2009 Hay Group. All Rights Reserved
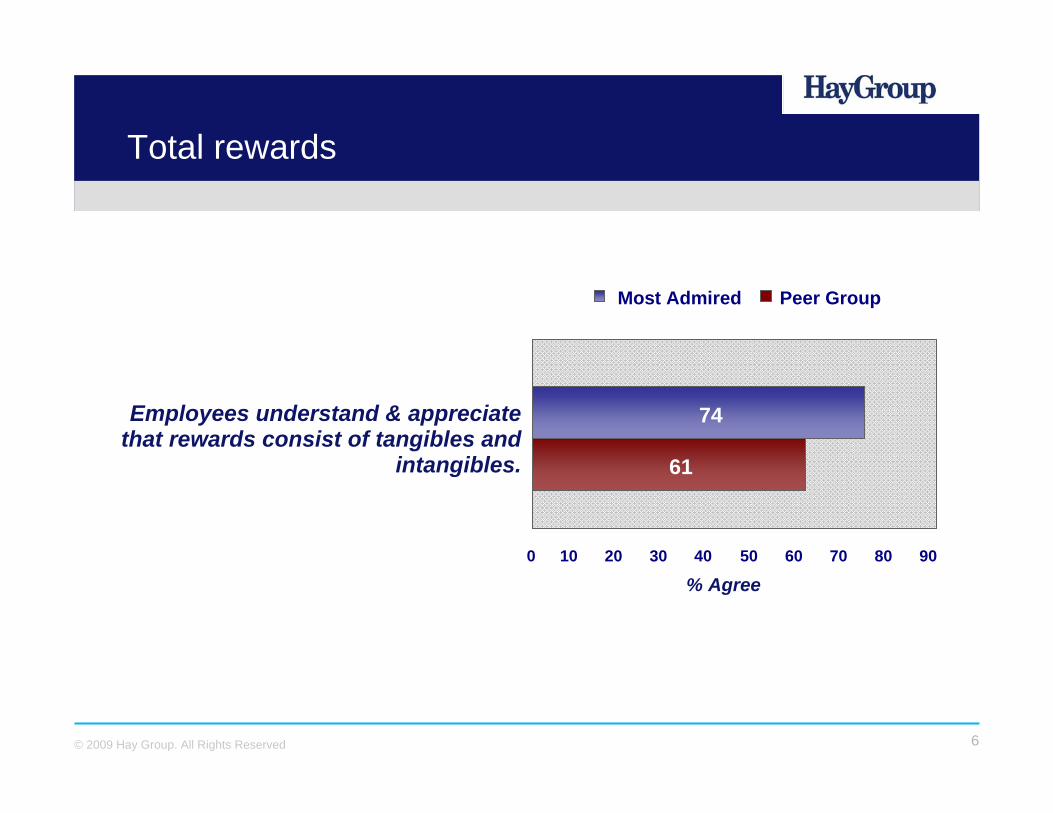
Total rewards
% Agree0 10 20 30 40 50 60 70 80 90
Employees understand & appreciate that rewards consist of tangibles and
intangibles. 61
74
Peer GroupMost Admired
Total Rewards
Global/local nature of reward programs
9© 2009 Hay Group. All Rights Reserved
55
70
74
83
81
93
0 10 20 30 40 50 60 70 80 90 100
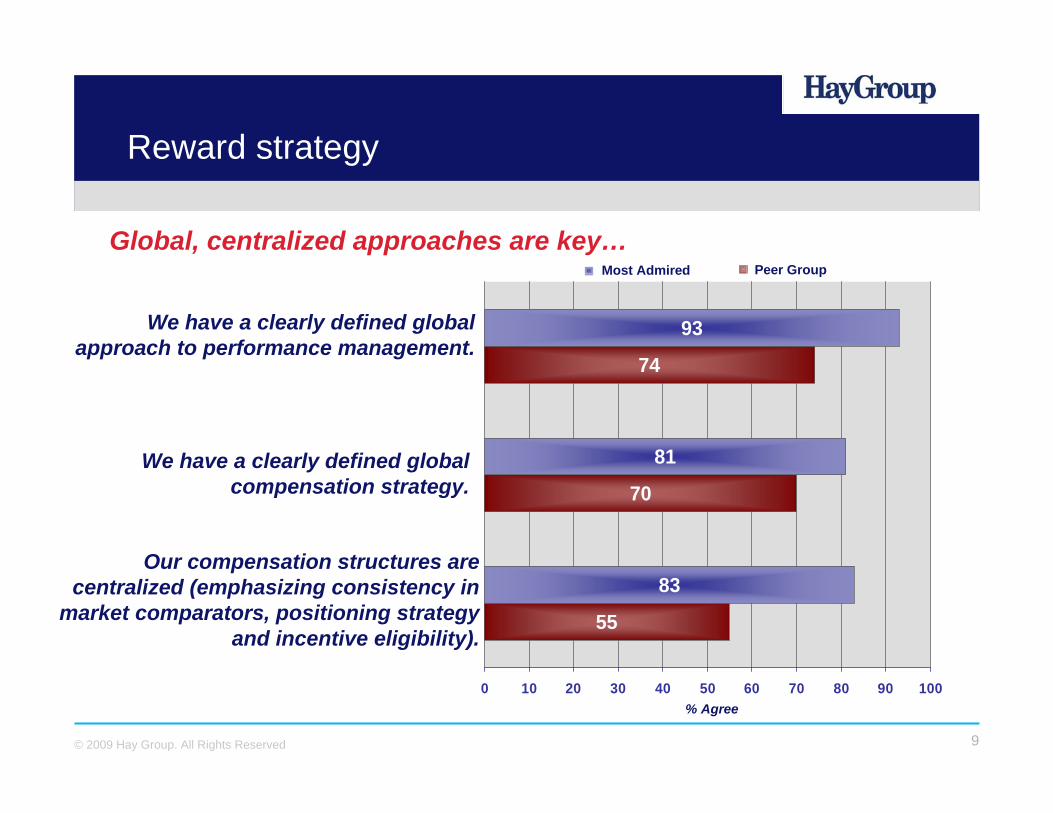
Reward strategy
Global, centralized approaches are key…
We have a clearly defined global approach to performance management.
We have a clearly defined global compensation strategy.
Peer GroupMost Admired
% Agree
Our compensation structures are centralized (emphasizing consistency in
market comparators, positioning strategy and incentive eligibility).

Global/local nature of reward programs

Pay Levels
12© 2009 Hay Group. All Rights Reserved
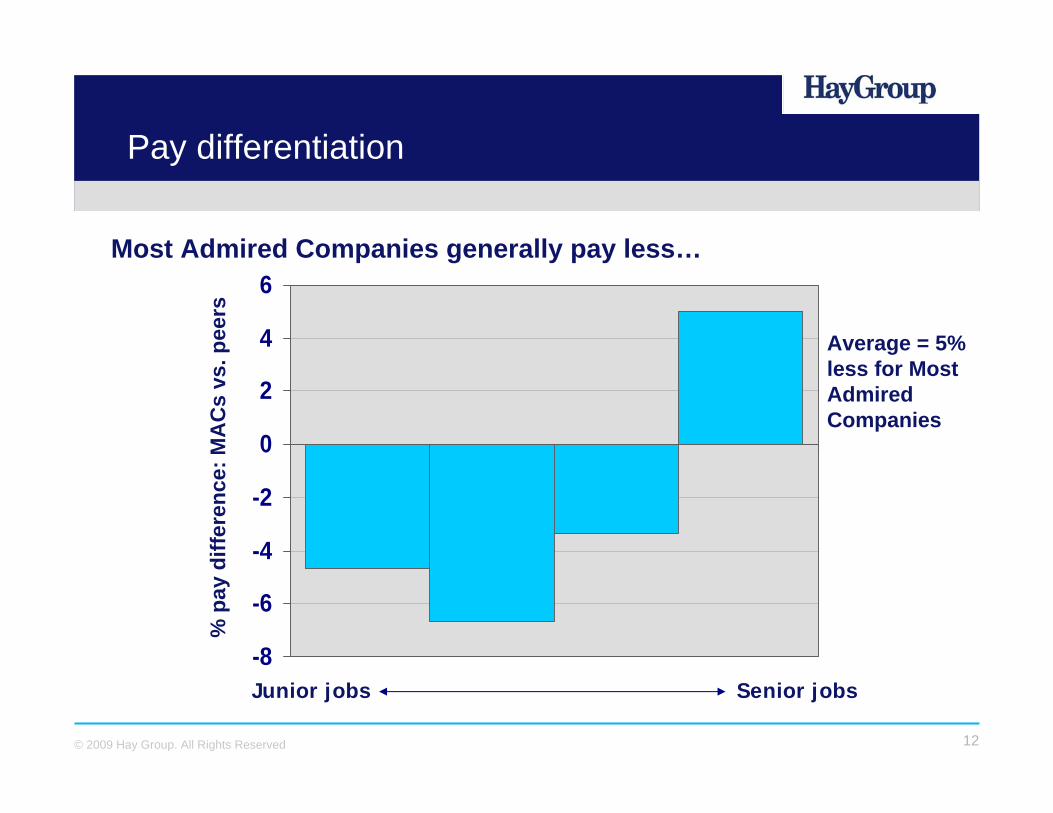
Pay differentiation
-8
-6
-4
-2
0
2
4
6
Average = 5% less for Most Admired Companies
Junior jobs Senior jobs
% p
ay d
iffer
ence
: MA
Cs
vs. p
eers
Most Admired Companies generally pay less…
13© 2009 Hay Group. All Rights Reserved
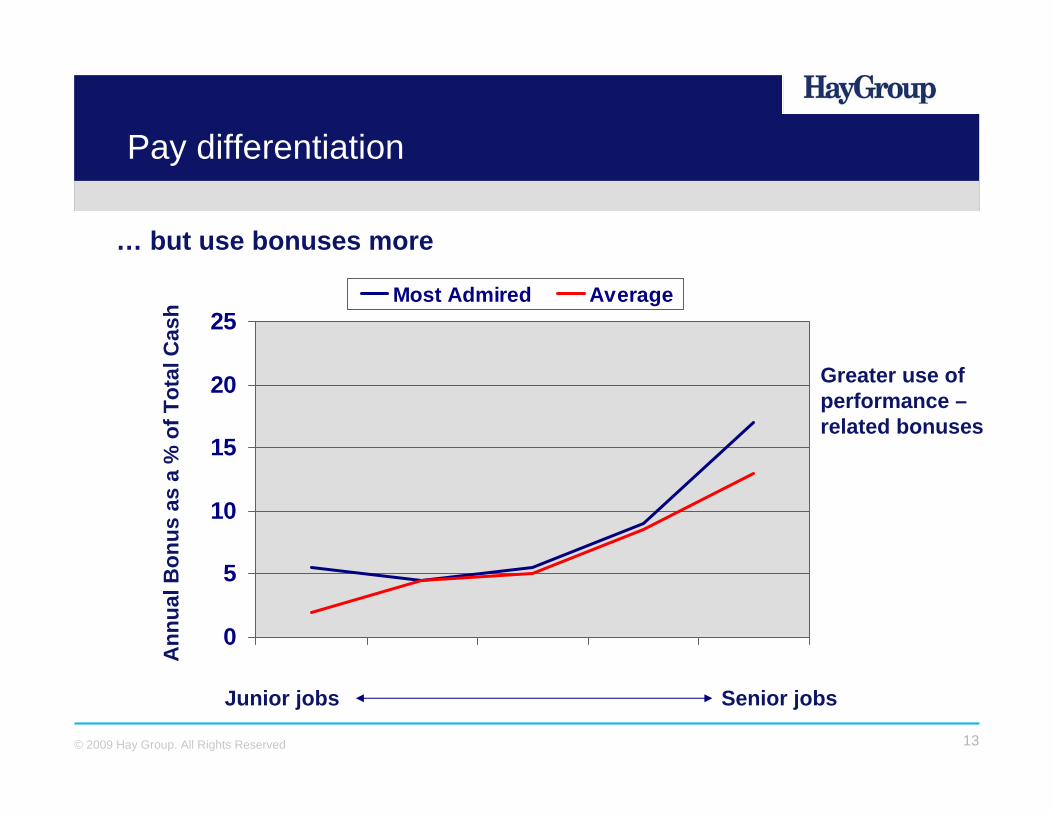
Pay differentiation
Greater use of performance –related bonuses
0
5
10
15
20
25Most Admired Average
Junior jobs Senior jobs
Ann
ual B
onus
as
a %
of T
otal
Cas
h
… but use bonuses more
14© 2009 Hay Group. All Rights Reserved
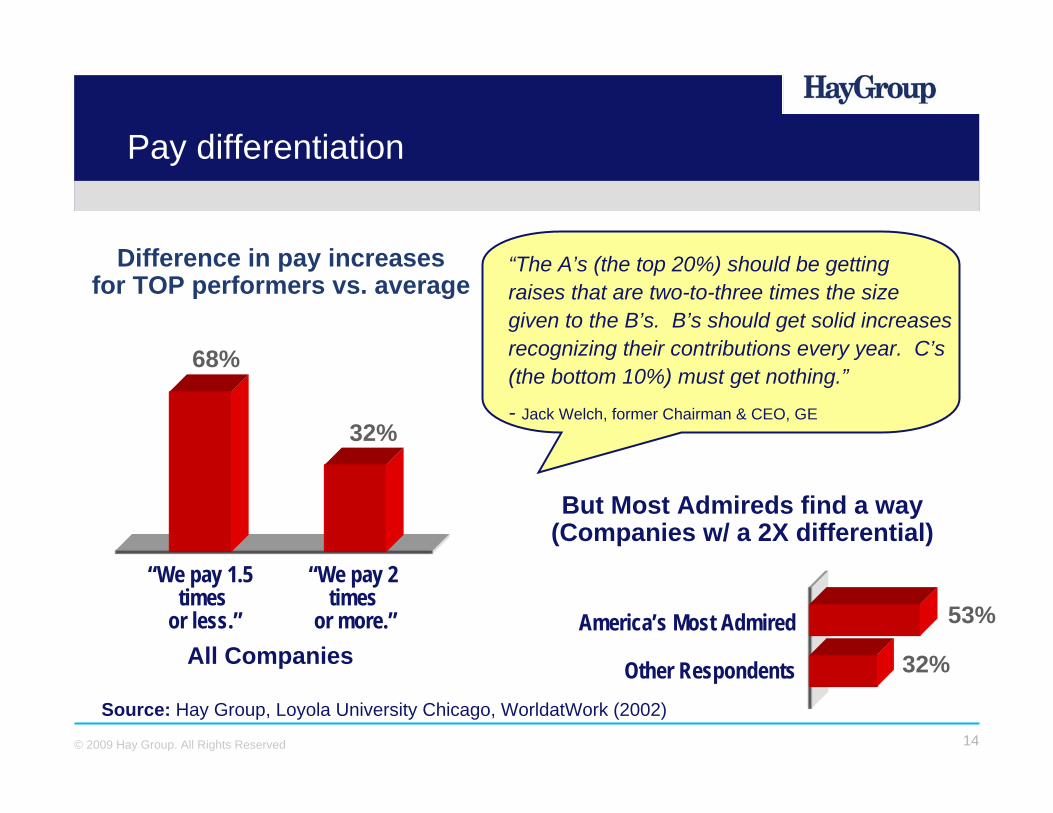
Pay differentiation
Difference in pay increases for TOP performers vs. average
32%
“We pay 1.5times
or less.”
68%
“We pay 2 times
or more.”
But Most Admireds find a way (Companies w/ a 2X differential)
53%
32%
America’s Most Admired
Other Respondents
“The A’s (the top 20%) should be getting raises that are two-to-three times the size given to the B’s. B’s should get solid increases recognizing their contributions every year. C’s (the bottom 10%) must get nothing.”
- Jack Welch, former Chairman & CEO, GE
All Companies
Source: Hay Group, Loyola University Chicago, WorldatWork (2002)
Pay Levels

Reward communications and implementation
17© 2009 Hay Group. All Rights Reserved
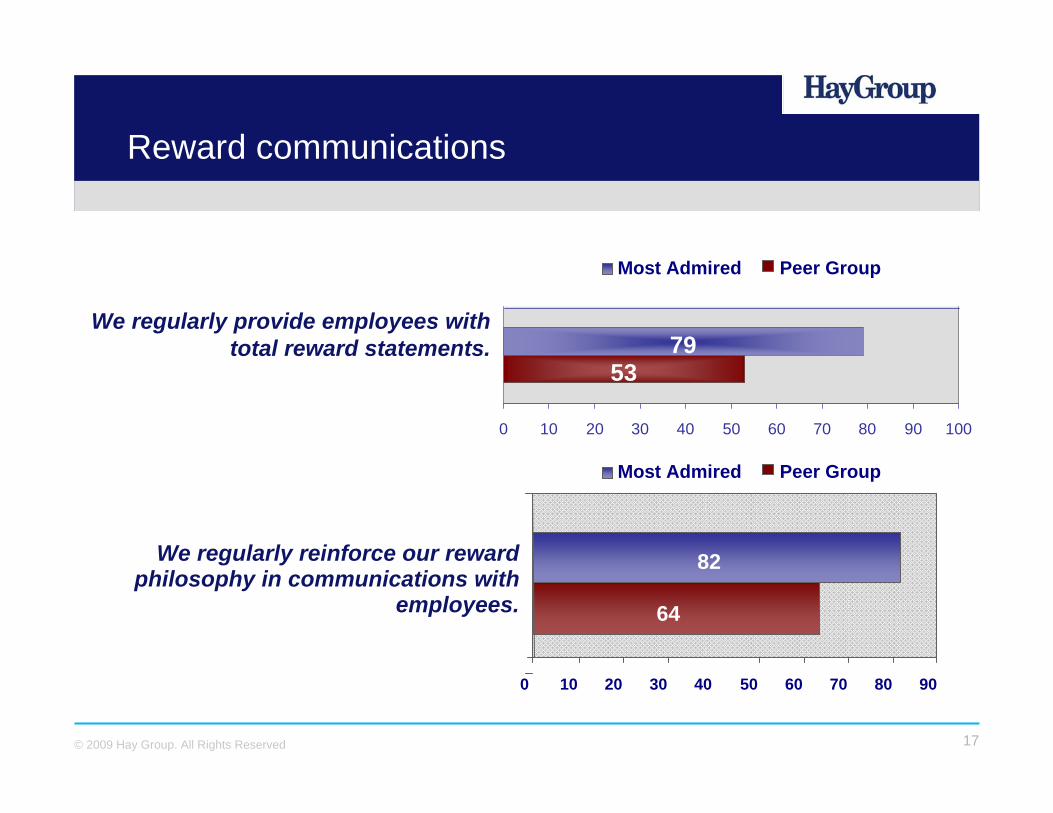
Reward communications
Peer GroupMost Admired
We regularly provide employees with total reward statements.
64
82
0 10 20 30 40 50 60 70 80 90
We regularly reinforce our reward philosophy in communications with
employees.
5379
0 10 20 30 40 50 60 70 80 90 100
Peer GroupMost Admired
18© 2009 Hay Group. All Rights Reserved
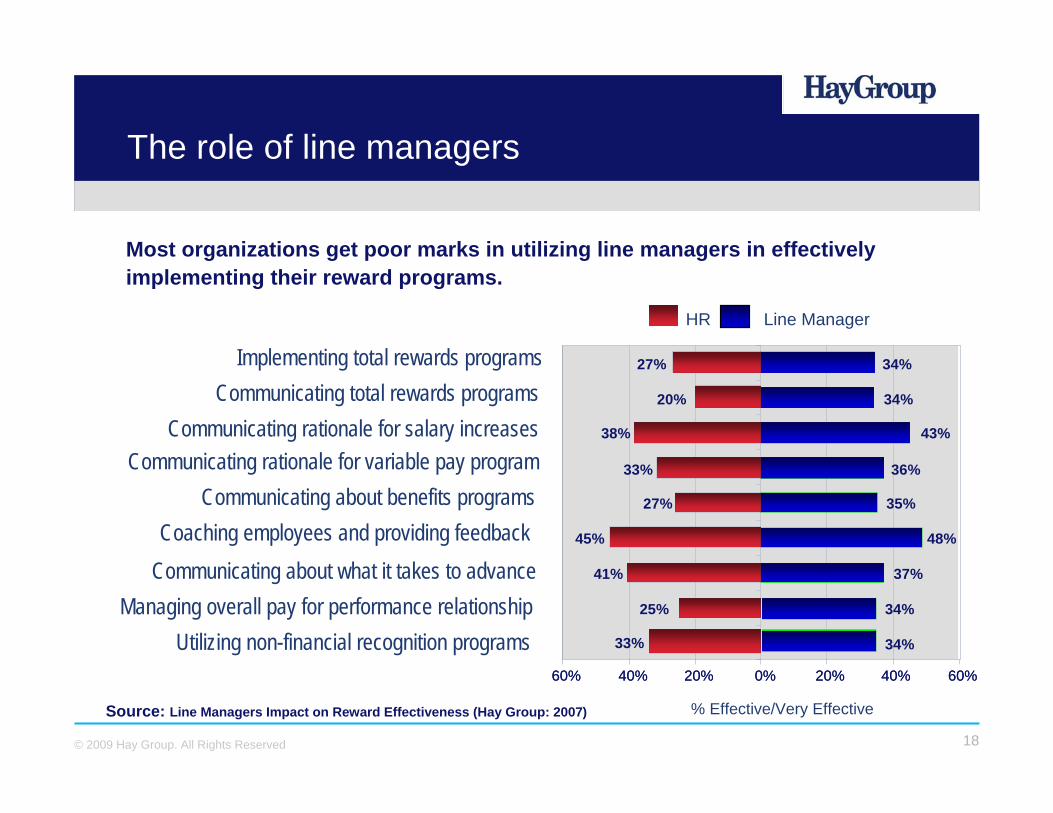
The role of line managers
Most organizations get poor marks in utilizing line managers in effectively implementing their reward programs.
34%
34%
37%
48%
35%
36%
43%
34%
34%
38%
20%
27%
33%
25%
41%
45%
27%
33%
60% 40% 20% 0% 20% 40% 60%
Managing overall pay for performance relationshipCommunicating about what it takes to advance
Utilizing non-financial recognition programs
Implementing total rewards programsCommunicating total rewards programs
Communicating rationale for variable pay program
Coaching employees and providing feedback
Communicating rationale for salary increases
Communicating about benefits programs
HR Line Manager
% Effective/Very Effective
34%
34%
37%
48%
35%
36%
43%
34%
34%
38%
20%
27%
33%
25%
41%
45%
27%
33%
60% 40% 20% 0% 20% 40% 60%
Source: Line Managers Impact on Reward Effectiveness (Hay Group: 2007)
Reward communications and implementation
Measuring effectiveness of reward programs
21© 2009 Hay Group. All Rights Reserved
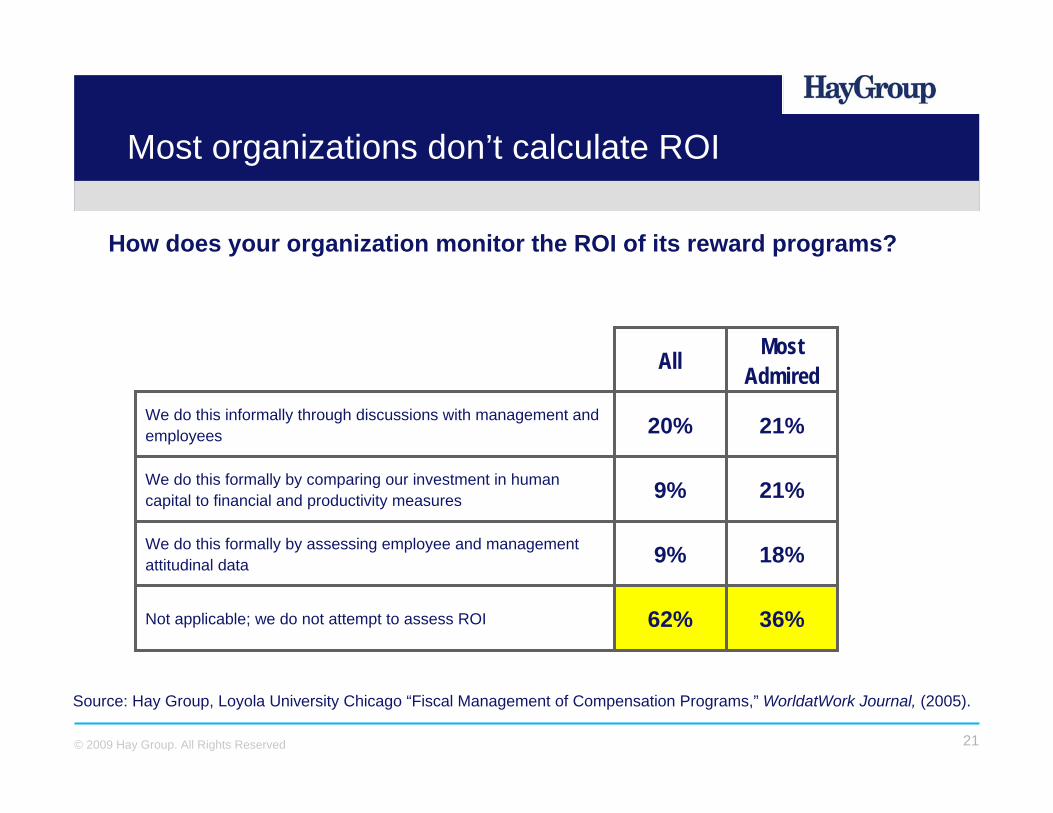
Most organizations don’t calculate ROI
Most AdmiredAll
36%62%Not applicable; we do not attempt to assess ROI
18%9%We do this formally by assessing employee and management attitudinal data
21%9%We do this formally by comparing our investment in human capital to financial and productivity measures
21%20%We do this informally through discussions with management and employees
How does your organization monitor the ROI of its reward programs?
Source: Hay Group, Loyola University Chicago “Fiscal Management of Compensation Programs,” WorldatWork Journal, (2005).
22© 2009 Hay Group. All Rights Reserved
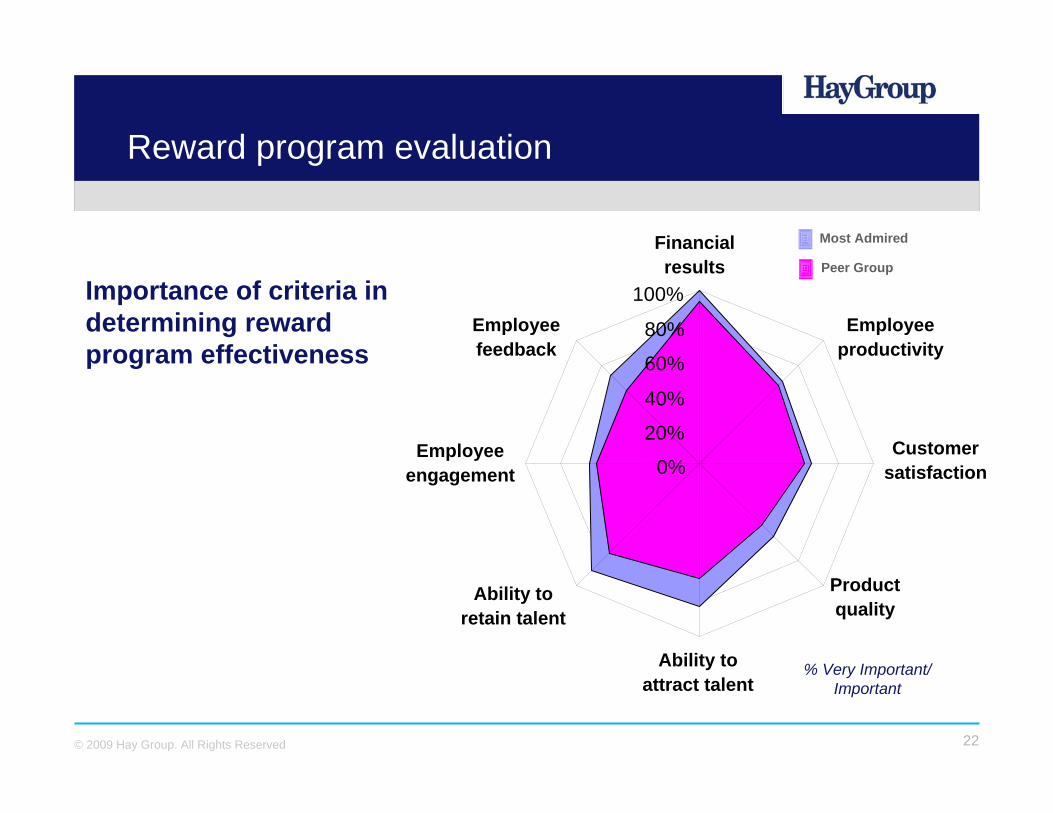
Reward program evaluation
0%
20%
40%
60%
80%
100%
Financial results
Employee productivity
Customer satisfaction
Product quality
Ability to attract talent
Ability to retain talent
Employee engagement
Employee feedback
Importance of criteria in determining reward program effectiveness
Peer Group
Most Admired
% Very Important/ Important

Measuring effectiveness of reward programs
Economic Uncertainty
25© 2009 Hay Group. All Rights Reserved
In response to the recent economic downturn, Hay Group conducted a global study to determine howorganizations are changing their reward programs, work rules, and staffing levels.We will highlight key findings.
26© 2009 Hay Group. All Rights Reserved
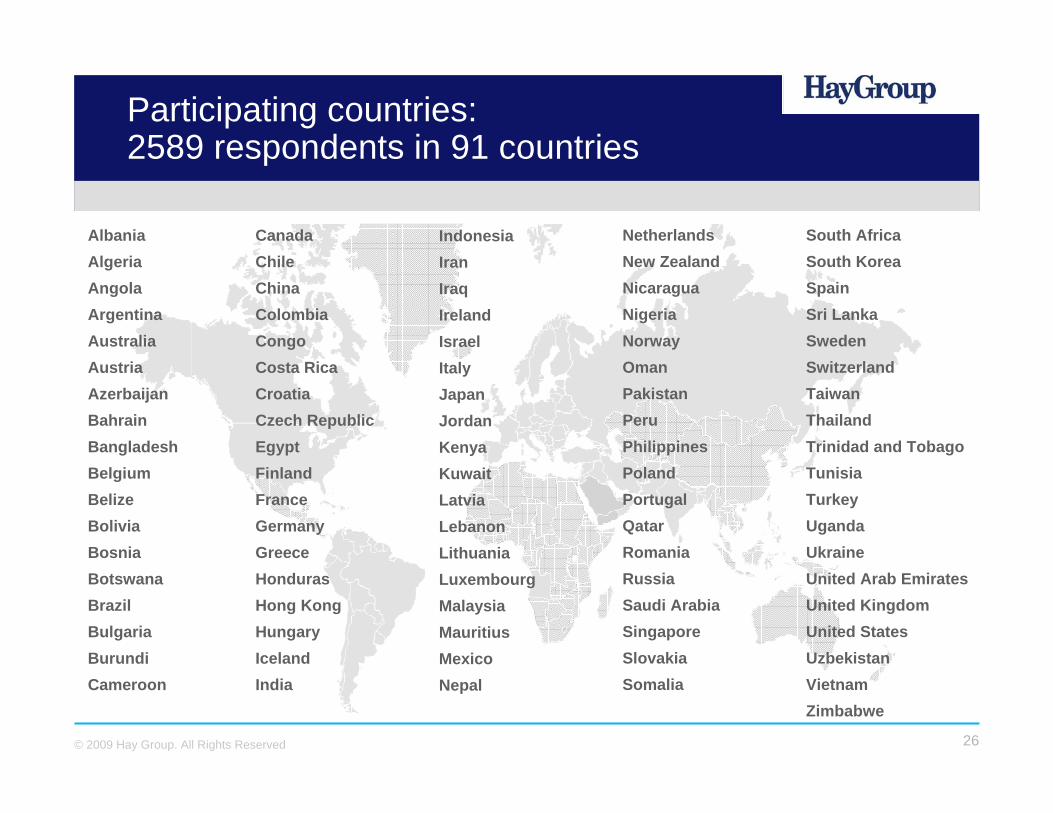
Participating countries:2589 respondents in 91 countries
AlbaniaAlgeriaAngolaArgentinaAustraliaAustriaAzerbaijanBahrainBangladeshBelgiumBelizeBoliviaBosniaBotswanaBrazilBulgariaBurundiCameroon
CanadaChileChinaColombiaCongoCosta RicaCroatiaCzech RepublicEgyptFinlandFranceGermanyGreeceHondurasHong KongHungaryIcelandIndia
IndonesiaIranIraqIrelandIsraelItalyJapanJordanKenyaKuwaitLatviaLebanonLithuaniaLuxembourgMalaysiaMauritiusMexicoNepal
NetherlandsNew ZealandNicaraguaNigeriaNorwayOmanPakistanPeruPhilippinesPolandPortugalQatarRomaniaRussiaSaudi ArabiaSingaporeSlovakiaSomalia
South AfricaSouth KoreaSpainSri LankaSwedenSwitzerlandTaiwanThailandTrinidad and TobagoTunisiaTurkeyUgandaUkraineUnited Arab EmiratesUnited KingdomUnited StatesUzbekistanVietnamZimbabwe
27© 2009 Hay Group. All Rights Reserved
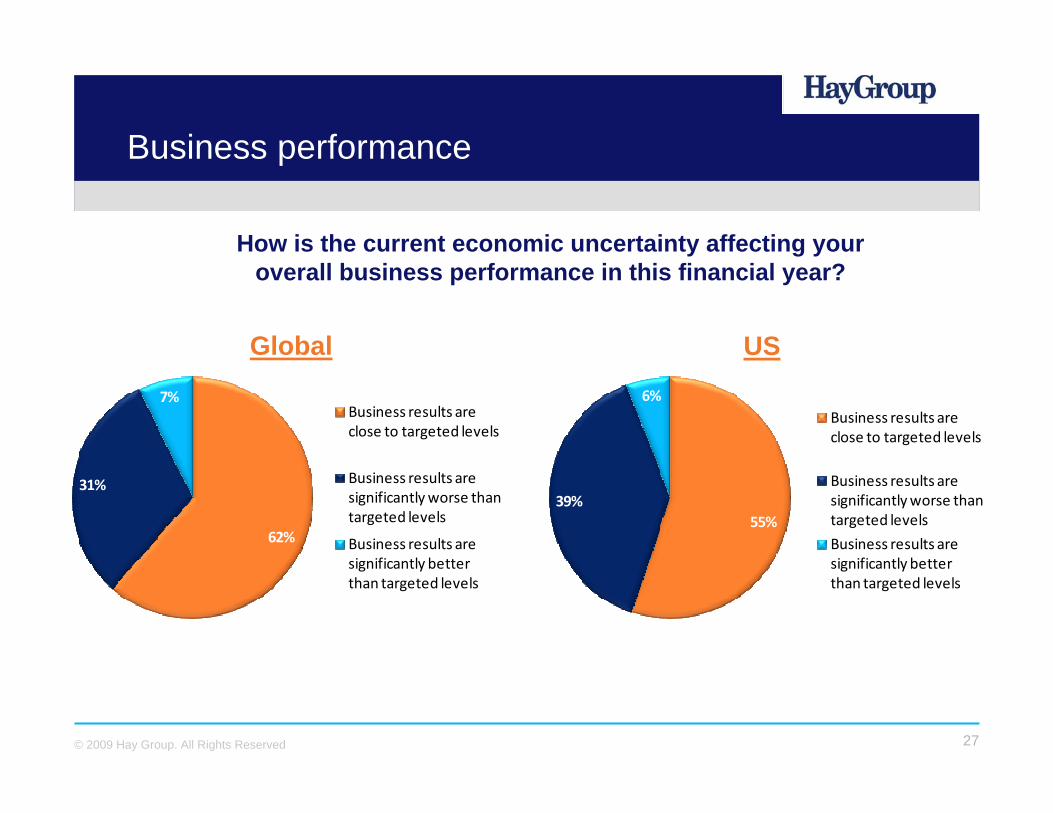
62%
31%
7%Business results are close to targeted levels
Business results are significantly worse than targeted levels
Business results are significantly better than targeted levels
55%39%
6%Business results are close to targeted levels
Business results are significantly worse than targeted levels
Business results are significantly better than targeted levels
Business performance
How is the current economic uncertainty affecting your overall business performance in this financial year?
Global US
28© 2009 Hay Group. All Rights Reserved
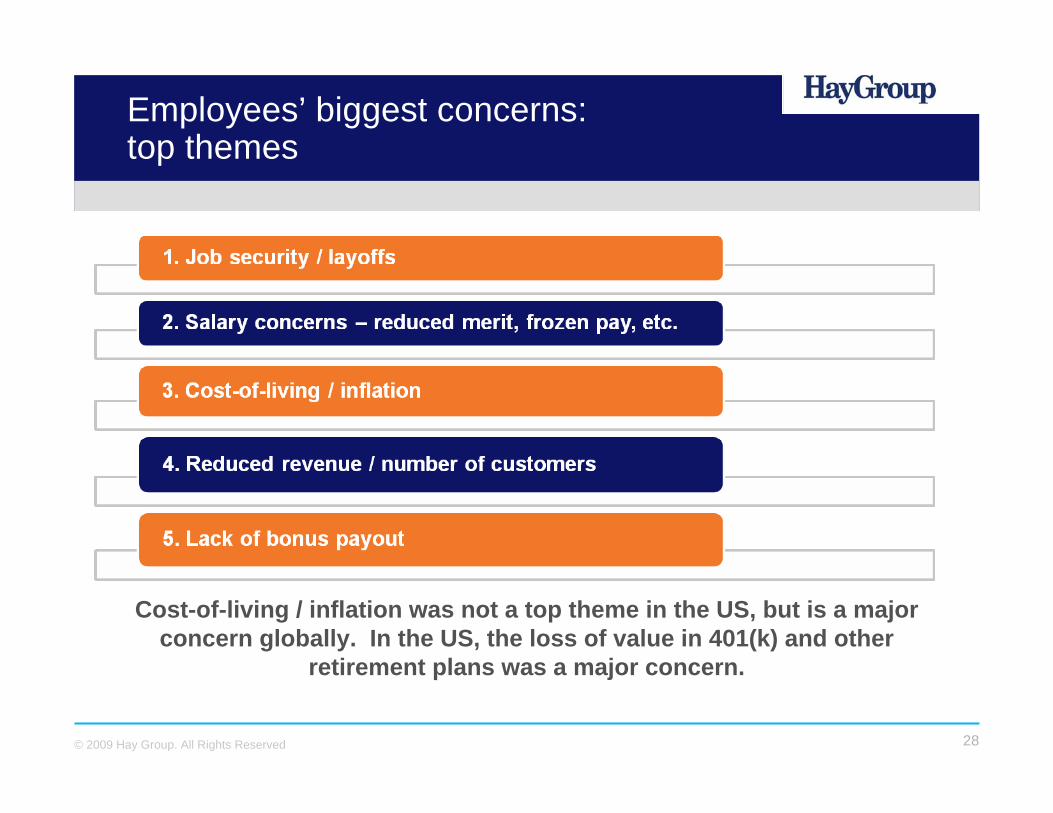
Cost-of-living / inflation was not a top theme in the US, but is a majorconcern globally. In the US, the loss of value in 401(k) and other
retirement plans was a major concern.
Employees’ biggest concerns: top themes
29© 2009 Hay Group. All Rights Reserved
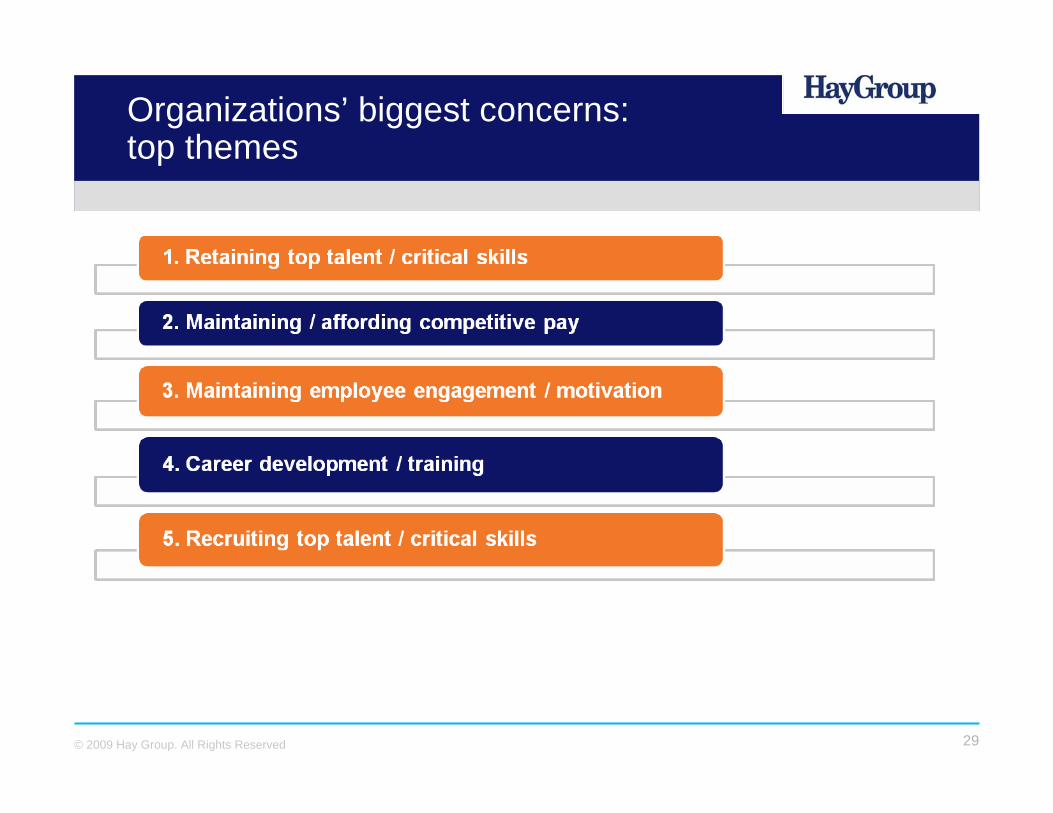
Organizations’ biggest concerns: top themes
30© 2009 Hay Group. All Rights Reserved
Often the automatic response to a downturn is to cut HR budgets. Businesses that avoid making rash decisions and manage their talent are the ones that come out on top.
31© 2009 Hay Group. All Rights Reserved
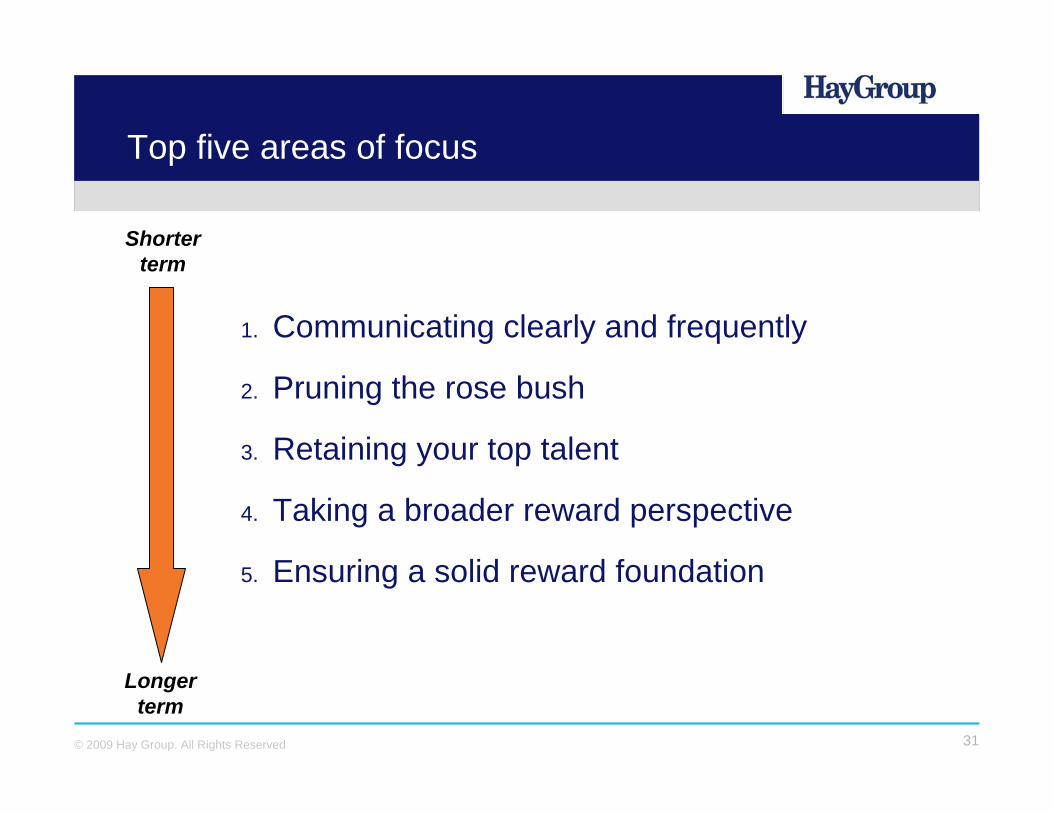
Shorter term
Longer term
Top five areas of focus
1. Communicating clearly and frequently
2. Pruning the rose bush
3. Retaining your top talent
4. Taking a broader reward perspective
5. Ensuring a solid reward foundation

Economic Uncertainty
Thank You!
www.haygroup.com