lesson plan - national education collaboration trust
TRANSCRIPT

‘Pure mathematics is, in its way, the poetry of logical ideas.’
-Albert Einstein
MATHEMATICSLESSON PLAN
GRADE 12 TERM 3

MESSAGE FROM NECT
NATIONAL EDUCATION COLLABORATION TRUST (NECT)Dear Teachers
This learning programme and training is provided by the National Education Collaboration Trust (NECT) on behalf of the Department of Basic Education (DBE). We hope that this programme provides you with additional skills, methodologies and content knowledge that you can use to teach your learners more effectively.
WHAT IS NECT?
In 2012 our government launched the National Development Plan (NDP) as a way to eliminate poverty and reduce inequality by the year 2030. Improving education is an important goal in the NDP which states that 90% of learners will pass Maths, Science and languages with at least 50% by 2030. This is a very ambitious goal for the DBE to achieve on its own, so the NECT was established in 2015 to assist in improving education.
The NECT has successfully brought together groups of people interested in education so that we can work collaboratively to improve education. These groups include the teacher unions, businesses, religious groups, trusts, foundations and NGOs.
WHAT ARE THE LEARNING PROGRAMMES?
One of the programmes that the NECT implements on behalf of the DBE is the ‘District Devel-opment Programme’. This programme works directly with district officials, principals, teachers, parents and learners; you are all part of this programme!
The programme began in 2015 with a small group of schools called the Fresh Start Schools (FSS). Curriculum learning programmes were developed for Maths, Science and Language teachers in FSS who received training and support on their implementation. The FSS teachers remain part of the programme, and we encourage them to mentor and share their experience with other teachers.
The FSS helped the DBE trial the NECT learning programmes so that they could be improved and used by many more teachers. NECT has already begun this scale-up process in its Universalisa-tion Programme and in its Provincialisation Programme.
Everyone using the learning programmes comes from one of these groups; but you are now brought together in the spirit of collaboration that defines the manner in which the NECT works. Teachers with more experience using the learning programmes will deepen their knowledge and understanding, while some teachers will be experiencing the learning programmes for the first time.
Let’s work together constructively in the spirit of collaboration so that we can help South Africa
eliminate poverty and improve education!www.nect.org.za

iii
CONTENTSMessage from NECT iiContents iiiProgramme Orientation iv
Topic 1 Euclidean Geometry 1Topic 1, Lesson 1: Revision of similarity, ratio & proportion
and the midpoint theorem 5Topic 1, Lesson 2: Proportionality theorem 16Topic 1, Lesson 3: Similar triangles 23Topic 1, Lesson 4: Pythagorean theorem 37Topic 1, Lesson 5: Revision and Consolidation 44
Topic 2 Statistics 52Topic 2, Lesson 1: Revision of Grade 10 & 11 58Topic 2, Lesson 2: Scatter plots, least squares regression line,
correlation coefficient 77Topic 2, Lesson 3: Revision and consolidation 93
Topic 3 Counting and Probability 95Topic 3, Lesson 1: Revision 100Topic 3, Lesson 3: The fundamental counting principle and factorial notation 111Topic 3, Lesson 3: Solving problems using the fundamental counting principle 120Topic 3, Lesson 4: Revision and consolidation 133

iv Grade 12 MATHEMATICS Term 3
MATHEMATICS GRADE 12, TERM 3
PROGRAMME ORIENTATION Welcome!
The NECT FET Mathematics Learning Programme is designed to support teachers by provid-ing:
z Lesson Plans
z Trackers
z Resource Packs
z Assessments and Memoranda
z Posters.
This Mathematics Learning Programme provides most of the planning required to teach FET Mathematics. However, it is important to remember that although the planning has been done for you, preparation is key to successful teaching. Set aside adequate time to properly prepare to teach each topic.
Also remember that the most important part of preparation is ensuring that you develop your own deep conceptual understanding of the topic. Do this by:
z working through the lesson plans for the topic
z watching the recommended video clips at the end of the topic
z completing all the worked examples in the lesson plans
z completing all activities and exercises in the textbook.
If, after this, a concept is still not clear to you, read through the section in the textbook or related teacher’s guide, or ask a colleague for assistance. You may also wish to search for additional teaching videos and materials online.
Orientate yourself to this Learning Programme by looking at each component, and by taking note of the points that follow.

vGrade 12 MATHEMATICS Term 3
MATHEMATICS GRADE 2, TERM 3
TERM 3 TEACHING PROGRAMME
1. In line with CAPS, the following teaching programme has been planned for FET Mathematics for Term 3:
Grade 10 Grade 11 Grade 12
Topic No. of weeks Topic No. of
weeks Topic No. of weeks
Analytical Geometry 2 Measurement 1 Euclidean Geometry 2Finance and Growth 2 Euclidean Geometry 3 Statistics 2Statistics 2 Trigonometry 2 Counting and
probability2
Trigonometry 1.5 Finance, growth and decay
2
Euclidean Geometry 1 Probability 2Measurement 1.5
2. Term 3 lesson plans and assessments are provided for ten weeks for Grades 10 and 11.
3. Term 3 lesson plans and assessments are provided for six weeks for Grade 12
4. Each week includes 4,5 hours of teaching time, as per CAPS.
5. You may need to adjust the lesson breakdown to fit in with your school’s timetable.
LESSON PLAN STRUCTURE
The Lesson Plan for each term is divided into topics. Each topic is presented in exactly the same way:
TOPIC OVERVIEW
1. Each topic begins with a brief Topic Overview. The topic overview locates the topic within the term, and gives a clear idea of the time that should be spent on the topic. It also indicates the percentage value of this topic in the final examination, and gives an overview of the important skills and content that will be covered.
2. The Lesson Breakdown Table is essentially the teaching plan for the topic. This table lists the title of each lesson in the topic, as well as a suggested time allocation. For example:

vi Grade 12 MATHEMATICS Term 3
MATHEMATICS GRADE 12, TERM 3
Lesson title Suggested time (hours)
1. Revision 1,5
2. Gradient and average gradient 1
3. The Sequential Table shows the prior knowledge required for this topic, the current knowledge and skills to be covered, and how this topic will be built on in future years.
z Use this table to think about the topic conceptually:
- Looking back, what conceptual understanding should learners have already mas-tered?
- Looking forward, what further conceptual understanding must you develop in learn-ers, in order for them to move on successfully?
z If learners are not equipped with the knowledge and skills required for you to continue teaching, try to ensure that they have some understanding of the key concepts before moving on.
z In some topics, a revision lesson has been provided.
4. The NCS Diagnostic Reports. This section is potentially very useful. It lists common problems and misconceptions that are evident in learners’ NSC examination scripts. The Lesson Plans aim to address these problem areas, but it is also a good idea for you to keep these in mind as you teach a topic.
5. The Assessment of the Topic section outlines the formal assessment requirements as prescribed by CAPS for Term 3.
Grade Assessment requirements for Term 3 (as prescribed in CAPS)10 Two tests11 Two tests12 One test and one preliminary examination
6. The glossary of Mathematical Vocabulary provides an explanation of each word or phrase relevant to the topic. In some cases, an explanatory sketch is also provided. It is a good idea to display these words and their definitions or sketches somewhere in the classroom for the duration of the topic. It is also a good idea to encourage learners to copy down this table in their free time, or alternately, to photocopy the Mathematical Vocabulary for learners at the start of the topic. You should explicitly teach the words and their meanings as and when you encounter these words in the topic.

viiGrade 12 MATHEMATICS Term 3
MATHEMATICS GRADE 2, TERM 3
INDIVIDUAL LESSONS
1.. Following the Topic Overview, you will find the Individual Lessons. Each lesson is structured in exactly the same way. The routine within the individual lessons helps to improve time on task, and therefore, curriculum coverage.
2. In addition to the lesson title and time allocation, each lesson plan includes the following:
A. Policy and Outcomes. This provides the CAPS reference, and an overview of the objectives that will be covered in the lesson.
B. Classroom Management. This provides guidance and support as you plan and prepare for the lesson.
z Make sure that you are ready to begin your lesson, have all your resources ready (including resources from the Resource Pack), have notes written up on the chalk-board, and are fully prepared to begin.
z Classroom management also suggests that you plan which textbook activities and exercises will be done at which point in the lesson, and that you work through all exercises prior to the lesson.
z In some cases, classroom management will also require you to photocopy an item for learners prior to the lesson, or to ensure that you have manipulatives such as boxes and tins available.
The Learner Practice Table. This lists the relevant practice exercises that are available in each of the approved textbooks.
z It is important to note that the textbooks deal with topics in different ways, and therefore provide a range of learner activities and exercises. Because of this, you will need to plan when you will get learners to do the textbook activities and exercises.
z If you feel that the textbook used by your learners does not provide sufficient practice activities and exercises, you may need to consult other textbooks or references, including on0line references.
z The Siyavula Open Source Mathematics textbooks are offered to anyone wishing to learn mathematics and can be accessed on the following website: https://www.everythingmaths.co.za/read
C. Conceptual Development:
This section provides support for the actual teaching stages of the lesson.
Introduction: This gives a brief overview of the lesson and how to approach it. Wherever possible, make links to prior knowledge and to everyday contexts.
Direct Instruction: Direct instruction forms the bulk of the lesson. This section describes the teaching steps that should be followed to ensure that learners develop conceptual understanding. It is important to note the following:

viii Grade 12 MATHEMATICS Term 3
MATHEMATICS GRADE 12, TERM 3
z Grey blocks talk directly to the teacher. These blocks include teaching tips or suggestions.
z Teaching is often done by working through an example on the chalkboard. These worked examples are always presented in a table. This table may include grey cells that are teaching notes. The teaching notes help the teacher to explain and demon-strate the working process to learners.
z As you work through the direct instruction section, and as you complete worked examples on the chalkboard, ensure that learners copy down:
• formulae, reference notes or explanations
• the worked examples, together with the learner’s own annotations.
z These notes then become a reference for learners when completing examples on their own, or when preparing for examinations.
z At relevant points during the lesson, ensure that learners do some of the Learner Practice activities as outlined at the beginning of each lesson plan. Also, give learners additional practice exercises and questions from past papers as homework. Ensure that learners are fully aware of your expectations in this respect.
D. Additional Activities / Reading. This section provides you with web links related to the topic. Get into the habit of visiting these links as part of your lesson preparation. As teacher, it is always a good idea to be more informed than your learners. If possible, organise for learners to view video clips that you find particularly useful.
TRACKER
1. A Tracker is provided for each grade for each term. The Trackers are CAPS compliant in terms of content and time.
2. You can use the Tracker to document your progress. This helps you to monitor your pacing and curriculum coverage. If you fall behind, make a plan to catch up.
3. Fill in the Tracker on a daily or weekly basis.
4. At the end of each week, try to reflect on your teaching progress. This can be done with the HoD, with a subject head, with a colleague, or on your own. Make meaningful notes about what went well and what didn’t. Use the reflection section to reflect on your teaching, the learners’ learning and to note anything you would do differently next time. These notes can become an important part of your preparation in the following year.

ixGrade 12 MATHEMATICS Term 3
MATHEMATICS GRADE 2, TERM 3
RESOURCE PACK, ASSESSMENT AND POSTERS
1. A Resource Pack with printable resources has been provided for each term.
2. These resources are referenced in the lesson plans, in the Classroom Management section.
3. Two posters have been provided as part of the FET Mathematics Learning Programme for Term 3.
4. Ensure that the posters are displayed in the classroom.
5. Try to ensure that the posters are durable and long-lasting by laminating it, or by covering it in contract adhesive.
6. Note that you will only be given these resources once. It is important for you to manage and store these resources properly. You can do this by
z Writing your school’s name on all resources
z Sticking resource pages onto cardboard or paper
z Laminating all resources, or covering them in contact paper
z Filing the resource papers in plastic sleeves once you have completed a topic.
7. Add other resources to your resource file as you go along.
8. Note that these resources remain the property of the school to which they were issued.
ASSESSMENT AND MEMORANDUM
In the Resource Pack you are provided with assessment exemplars and memoranda as per CAPS requirements for the term. For Term 3, the Resource Pack contains two tests and memoranda for Grade 10, and contains two tests and memoranda for Grade 11. One test, with memorandum, is provided for Grade 12. If your learners write a common examination, you could use the examinations provided for revision or as trial examinations.
CONCLUSION
Teacher support and development is a complex process. For successful Mathematics teachers, certain aspects of this Learning Programme may strengthen your teaching approach. For emerging Mathematics teachers, we hope that this Learning Programme offers you meaningful support as you develop improved structure and routine in your classroom, develop deeper conceptual understanding in your learners and increase curriculum coverage.


TOPIC 1 EUCLIDEAN GEOMETRy
1Grade 12 MATHEMATICS Term 3
Term 3, Topic 1: Topic Overview
EUCLIDEAN GEOMETRy
TOPIC 1 EUCLIDEAN GEOMETRy
AA. TOPIC OVERVIEW
z This topic is the first of three topics in Term 3. z This topic runs for two weeks (9 hours). z It is presented over five lessons. z The lessons have been divided according to sub-topics, not according to one school lesson.
An approximate time has been allocated to each lesson (which will total 9 hours). For exam-ple, one lesson in this topic could take three school lessons. Plan according to your school’s timetable.
z Euclidean Geometry counts 33% of the final Paper 2 examination. z There are four proofs required for examination purposes. When this is the case, the proof is
covered at the end of the lesson concerned. This gives learners the opportunity to work with the theorem first and gain a better understanding of it before doing the proof.
z These lesson plans do not incorporate the proofs that are not required for examination purposes. This does not mean you should not do the proofs of these theorems with learners – an understanding of the proof can assist learners in making more sense of a theorems.
z Euclidean Geometry can be difficult to teach. The following link may be of use to you to assist with ideas on how to teach it. https://www.youtube.com/watch?v=VQU2XqG_F8U&t=273s
Breakdown of topic into 5 lessons:
Lesson title Suggested time (hours)
Lesson title Suggested time (hours)
1 Revision of similarity, ratio and proportion and the midpoint theorem.
2 4 Pythagorean theorem 1
2 Proportion theorem (including the midpoint theorem)
2 5 Revision and Consolidation
2
3 Similar triangles theorem
2

2 Grade 12 MATHEMATICS Term 3
TOPIC 1 EUCLIDEAN GEOMETRy
C
SEQUENTIAL TABLE
GRADE 11 and earlier GRADE 12
LOOKING BACK CURRENT
z All theorems on straight lines, triangles and parallel lines
z Theorem of Pythagoras z Similarity and Congruency z Midpoint theorem z Properties of quadrilaterals z Circle Geometry.
z Proportionality theorems z Similar triangles z Theorem of Pythagoras (proof by similar
triangles)
WHAT THE NSC DIAGNOSTIC REPORTS TELL US
According to NSC Diagnostic Reports there are a number of issues pertaining to Euclidean Geometry.
These include:
z giving incorrect or incomplete reasons
z naming angles incorrectly
z making many irrelevant statements
z failing to mention the parallel lines in the reason
z unable to identify the corresponding sides
z not knowing the difference between the value of a ratio and a length
z failing to recall properties of quadrilaterals required
z inability to use correct reasons for converses.
It is important that you keep these issues in mind when teaching this section.
Remind learners that this section requires logical reasoning. Learners need to be encouraged to scrutinise the given information for clues and then plan a way forward.
B

3Grade 12 MATHEMATICS Term 3
TOPIC 1 EUCLIDEAN GEOMETRy
ASSESSMENT OF THE TOPIC
z CAPS formal assessment requirements for Term 3:• Test• Preliminary examination
z A test, with memorandum, is provided in the Resource Pack. The test is aligned to CAPS in every respect, including the four cognitive levels as required by CAPS (page 53).
z The questions usually take the form of given information and diagrams related to one or more of the theorems learned.
z Monitor each learner’s progress to assess (informally) their grasp of the concepts. This information can form the basis of feedback to the learners and will provide you valuable information regarding support and interventions required.
MATHEMATICAL VOCABULARy
Be sure to teach the following vocabulary at the appropriate place in the topic:
Term Explanation
Euclidean Geometry
Geometry based on the postulates of Euclid. Euclidean geometry deals with space and shape using a system of logical deductions
theorem A statement that has been proved based on previously established statements
converse A statement formed by interchanging what is given in a theorem and what is to be proved
corollary A statement that follows with little or no proof required from an already proven statement. For example, it is a theorem in geometry that the angles opposite two congruent sides of a triangle are also congruent (isosceles triangle). A corollary to that statement is that an equilateral triangle is also equiangular.
Theorem of Pythagoras
In any right-angled triangle, the square on the hypotenuse is equal to the sum of the squares on the other two sides.
D
E

4 Grade 12 MATHEMATICS Term 3
TOPIC 1 EUCLIDEAN GEOMETRy
hypotenuse The longest side in a right-angled triangle. It is opposite the right angle.
complementary angles
Angles that add up to 90º.
supplementary angles
Angles that add up to 180º.
vertically opposite angles
Non-adjacent opposite angles formed by intersecting lines.
intersecting lines
Lines that cross each other.
perpendicular lines
Lines that intersect each other at a right angle.
parallel lines Lines the same distance apart at all points. Two or more lines are parallel if they have the same slope (gradient).
transversal A line that cuts across a set of lines (usually parallel).
corresponding angles
Angles that sit in the same position on each of the parallel lines in the position where the transversal crosses each line.
alternate angles Angles that lie on different parallel lines and on opposite sides of the transversal.
co-interior angles
Angles that lie on different parallel lines and on the same side of the transversal.
congruent The same. Identical.
similar Looks the same. Equal angles and sides in proportion.
proportion A part, share, or number considered in comparative relation to a whole. The equality of two ratios. An equation that can be solved.
ratio The comparison of sizes of two quantities of the same unit. An expression.
area The space taken up by a two-dimensional polygon.

TOPIC 1, LESSON 1: REVISION OF SIMILARITy, RATIO & PROPORTION AND THE MIDPOINT THEOREM
5Grade 12 MATHEMATICS Term 3
TERM 3, TOPIC 1, LESSON 1
REVISION OF SIMILARITY, RATIO & PROPORTION AND THE MIDPOINT THEOREM
Suggested lesson duration: 2 hours
TOPIC 1, LESSON 1: REVISION OF SIMILARITy, RATIO & PROPORTION AND THE MIDPOINT THEOREM
APOLICy AND OUTCOMES
CAPS Page Number 48
Lesson ObjectivesBy the end of the lesson, learners should be able to:
z similarity z ratio and proportion z midpoint theorem.
CLASSROOM MANAGEMENT
1. Make sure that you are ready and prepared.
2. Advance preparation: Work through the lesson plan and exercises.
3. Write the lesson heading on the board before learners arrive.
4. Write work on the chalkboard before the learners arrive.
5. If there isn’t a revision exercise in the textbook that you use, use an exercise from a Grade 9 book (similarity) and a Grade 10 book (midpoint theorem).
6. The table below provides references to this topic in Grade 12 textbooks. Plan when you will get learners to practice the concepts learned by completing the exercises. Work through the lesson plan and decide where you will get learners to do the exercises. Indicate this on your lesson plans.
LEARNER PRACTICE
MIND ACTION SERIES
PLATINUM VIA AFRIKA
CLEVER CLASSROOM MATHS
EVERYTHING MATHS
(SIYAVULA)
EX PG EX PG EX PG EX PG EX PG EX PG
1 207 8.18.2
316321
B

6 Grade 12 MATHEMATICS Term 3
TOPIC 1, LESSON 1: REVISION OF SIMILARITy, RATIO & PROPORTION AND THE MIDPOINT THEOREM
C CONCEPTUAL DEVELOPMENT
INTRODUCTION
1. Traditionally learners seem to struggle more with geometry than algebra. To alleviate this problem, quality time spent on revision is essential.
2. Moving on to the Grade 12 work, before you are sure that learners know their work from previous years, will not be beneficial if there is a gap in their basic knowledge.
3. Ensure you show learners that you enjoy this topic – this can help give them the confidence to believe they are capable of excelling in geometry.
DIRECT INSTRUCTION
1. Ask: What do the words congruent and similar mean?
2. Praise any learners who attempt to answer, particularly if their definition is accurate.
3. Ask learners to write the following definitions in their books:
Congruent – For two shapes to be congruent, they must have equal sides and equal angles.
Similar – For two shapes to be similar, they must have corresponding sides in proportion and their corresponding angles must be equal.
4. Ask: What are the signs for similarity and congruency?
(Similarity (///); congruency (≡))
5. Tell: If you have difficulty remembering these, the congruent sign is like the equal sign (=) and congruent means ‘exactly equal’.
6. Say: Although we have reminded ourselves of both terms learned in Grade 9 related to triangles, our focus now is on similarity. Similarity is a key part of the geometry we will learn this year.
SIMILARITy
1. An important skill when dealing with similar triangles is to be able to write up the proportion statements from the statement regarding the triangles being similar.
2. In other words, If ∆PQR///∆TRS then TRPQ
RSQR
TSPR= =

7Grade 12 MATHEMATICS Term 3
TOPIC 1, LESSON 1: REVISION OF SIMILARITy, RATIO & PROPORTION AND THE MIDPOINT THEOREM
3. Show learners how the sides in the statement match up with how the sides are paired up in the concluding statement regarding which sides will be in proportion.
4. Ask learners to try this one on their own: If ∆ABC///∆GHJ then …
GH
AB
HJ
BC
GJ
AC= =b l
5. Tell learners that to prove two triangles similar they can do one of two things:
z Prove three equal angles
z Prove that the sides are in proportion.
6. Point out that it will usually be clear which to prove from the information given.
z If any angle sizes are given, the first proof will be appropriate.
z If any side lengths are given the second proof will be appropriate.
7. Tell learners to write down the above two points.
8. Discuss the first option (proving angles equal). Ask: Do we need to find three equal angles or is it possible to prove all the angles are equal by finding less than that? (If two pairs of angles are equal, the third pair must be equal because there are three angles in a triangle).
9. Point out to learners that if they are asked to prove two triangles similar, the correct order (in other words with the paired sides that are or in proportion and the corresponding angles that are equal) is always given.
10. For example, if the question asks to prove that ∆ADE///∆PQR, then there is already evidence as to where to start looking for what sides are in proportion and what angles might be equal. In this case, AD is in proportion to PQ, DE is in proportion to QR and AE is in proportion to PR. Also, Â = P^ , D^ = Q^ & E = R^
HOWEVER, make it clear that this is not to say they can use this in their proof. It should merely be used as a guide as to where to look for equal sides or angles if they are stuck.
11. Ask learners again if they have any questions. Do some fully worked examples on the board. Learners should write them in their exercise books.

8 Grade 12 MATHEMATICS Term 3
TOPIC 1, LESSON 1: REVISION OF SIMILARITy, RATIO & PROPORTION AND THE MIDPOINT THEOREM
Example 1:1) Prove ∆ADE///∆ACB 2) Find the length of AD and AB
D
E
A9cm
6cm
2 1
14cm
12cm
A
C
Ask: What is given on the diagram that could be helpful? (Parallel lines)Ask: Which angles are equal due to the parallel lines? Ask: Are there any other equal angles?
Statement Reason
1) In ∆ADE and ∆ACB
Â2 = Â1
D^ = Ĉ
∴ Ê = B^
∴ ∆ADE///∆ACB
2) ACAD
BCDE
ABAE= =
∴ AD AB14 12
9 6= =
∴ 9AB = (6)(12)9AB = 72 AB = 8
12AD = (9)(14)12AD = 126
AD = 10,5
Vert opp <’s equal
Alt <’s equal; DE//BC
<’s of ∆ = 180º
AAA
∆ADE///∆ACB

9Grade 12 MATHEMATICS Term 3
TOPIC 1, LESSON 1: REVISION OF SIMILARITy, RATIO & PROPORTION AND THE MIDPOINT THEOREM
Example 2:Find the height of the tree (BC)AD = 3m, DE = 2m and AC = 30m
E
DCA
B
3m
2m
30m
Tell learners that we always assume a perfect world in maths questions. In other words, the tree here is perpendicular to the ground.Therefore, we can assume that DE//tree (BC)
Statement Reason
In ∆ABC and ∆AED
 = ÂB^ = ÊĈ = D^
∴ ∆ABC///∆AED
∴ AEAB
EDBC
ADAC= =
BC 30
2 3=
∴ 3BC = 30×2∴ 3BC = 60
∴ BC = 20The tree is 20m high
CommonCorres <’s; parallel lines<’s of a ∆ = 180º
AAA
Example 3:
E
A
B
C D
1) Which triangle is similar to ∆ACD?2) If AE:AD = 3:8 and AB = 9cm,
determine the length of BCANA exemplar
Ask: What do the parallel lines tell you? Are there any equal angles? (Corresponding)Point out that the two triangles (ABE and ACD) share a common angle.Remind learners that once they have made a similar statement, they need to be able to change it into a ratio statement.When ratios are given, it is usually easier to re-write them in the format more commonly used – that of fractions.This way, knowledge of equations can be used: If a c
b d= then a.d = b.c

10 Grade 12 MATHEMATICS Term 3
TOPIC 1, LESSON 1: REVISION OF SIMILARITy, RATIO & PROPORTION AND THE MIDPOINT THEOREM
Statement Reason
1) ∆ACD///∆ABE
∴ AC CD ADAB BE AE= =
2) If AE:AD = 3:8
then AEAD
3
8=
Tell learners that they need to find the fraction in their previous statement (1) that matches what is mentioned here. Point out that it doesn’t matter that it is ‘upside down’ providing they change the numerator and denominator of the other fraction which will be of use. The one linked to AB and BC
AB AE
AC AD=
AC
9 3
8=
∴ 3AC = (9)(8) 3AC = 72 AC = 24 BC = AC – AB ∴ BC = 24 – 9 BC = 15
AAAsides in proportion
RATIO AND PROPORTION
1. A good understanding of ratio and proportion is essential for a better understanding of the Grade 12 theorems. Spend time discussing these terms to ensure learners are confident in their meanings.
2. Tell learners that what they had to do in the example just completed is a skill that you are going to discuss now.
3. Say: The two terms, ‘ratio and proportion’ are often used together. Ratio and proportion are closely connected but are not the same. We are going to look at what each one means and learn some aspects that will assist us in Grade 12 geometry.
4. Give the definitions of ratio and proportion for learners to write in their exercise books. Ratio: the comparison of the size of two quantities of the same unit. Proportion: a mathematical concept, which states the equality of two ratios. When two sets

11Grade 12 MATHEMATICS Term 3
TOPIC 1, LESSON 1: REVISION OF SIMILARITy, RATIO & PROPORTION AND THE MIDPOINT THEOREM
of numbers increase or decrease in the same ratio, they are said to be directly proportional to each other.
5. Use examples now to explain more clearly the difference between the two concepts. Learners should take these down in their exercise books.
Ratio Proportion
R B R B R R B B
R R B B B B
In the given figure, there are 3 red flowers to 2 blue flowers. The red to blue flowers are in the ratio 3 : 2. 3 and 2 are two quantities of the same unit.
1 out of 3 flowers is red. Therefore, 2 out of 6 flowers are red.
1 : 3 = 2 : 6
6. Points to make regarding ratios: (these can be for discussion only)
z The order of the terms is significant
z The existence of ratios can only be between quantities of the same kind
z The unit of the quantity should be the same (for example: although length may be the same, both should be in cm).
7. Complete the following exercise on proportions (which involves the equality of ratios): Learners must write everything in their exercise books. Begin with a basic statement concerning the proportion between four variables, p,q,r and s:
If p: q = r : s, then qp
sr= and ps = qr (cross multiplication)
If: Then: Point out to learners that:
p : q = r : s q : p = s : r the variables were inverted.
p : q = r : s p : r = q : s the pairs were alternated but the first variable in one ratio went with the first variable in the other ratio.

12 Grade 12 MATHEMATICS Term 3
TOPIC 1, LESSON 1: REVISION OF SIMILARITy, RATIO & PROPORTION AND THE MIDPOINT THEOREM
p : q = r : s p + q : q = r + s : s if the 2nd variable (unit) is added to the first in EACH ratio, the ratios remain in proportion.
p : q = r : s p – q : q = r – s : s if the 2nd variable (unit) is subtracted from the first in EACH ratio, the ratios remain in proportion.
p : q = r : s p + q : p – q = r + s : r – s This rule is a combination of the two previous rules.
p : q = r : s p + r : q + s The first unit in each ratio are added and the second unit in each ratio are added.
p : q = r : s p – r : q – s The first unit in each ratio are subtracted and the second unit in each ratio are subtracted.
8. Tell learners that not all of these facts will be used regularly but they are all useful to know. The first original statement and the first two rules are used the most often. Learners should highlight these in some way.
THE MIDPOINT THEOREM
1. Ask for a volunteer to make the drawing on the board and discuss what the midpoint theorem tells us according to his/her drawing.
2. Ensure the following is covered for learners to take down in their exercise books:
Given: Then:
E
A
B C
D E
A
B C
D
1
2– of

13Grade 12 MATHEMATICS Term 3
TOPIC 1, LESSON 1: REVISION OF SIMILARITy, RATIO & PROPORTION AND THE MIDPOINT THEOREM
3. Tell learners to write down the full theorem: The line which joins the midpoints of two sides of a triangle is parallel to the third side of the triangle and equals half its length.
4. Ask learners if they have any questions. If not, tell them that you are going to do some fully worked examples on the board. Learners should write them in their exercise books.
Statement Reason
Find x
E
x6
A
B C
D
This is a straightforward question and learners can use the midpoint theorem to get the answer with no calculation.
Solution:x = 12 mid-point theorem
Example 2 Teaching notes
In ∆PQR, A and B are the midpoints of sides PQ and PR respectively. AR and BQ intersect at W. D and E are points on WQ and WR respectively such that WD = DQ and WE = ER.
RQ
W
E
A B
P
D
Prove that ADEB is a parallelogram.NSC Nov 2016
Remind learners to always read through the given information carefully. Confirm that:1. learners understand the given
information2. the given information has been
transferred onto the diagramAs they do this, learners should think about what else they already know from theorems they have learned.Ask: Name all the triangles where the midpoint theorem can be applied.(∆PQR,∆WQR)Ask: How can we prove that a quadrilateral is a parallelogram? 1. Both pairs of opposite sides equal.2. Both pairs of opposite sides parallel.3. One pair of opposite sides equal and
parallel.4. Diagonals bisect each other.Remind learners that there is one more way of proving that a quadrilateral is a

14 Grade 12 MATHEMATICS Term 3
TOPIC 1, LESSON 1: REVISION OF SIMILARITy, RATIO & PROPORTION AND THE MIDPOINT THEOREM
parallelogram, but it involves angles which have not been given in this question.Ask for a volunteer suggest a way of answering the question before completing it on the board with them.
Solution:
In ∆PQR:
2AB QR= 1 mid-point theorem
AB || QR mid-point theoremIn ∆WQR:
2DE QR= 1 mid-point theorem
DE || QR mid-point theorem∴ AB = DE and AB || DE∴ ADEB is a parm one pair oppos sides equal and parallel
9. Ask directed questions so that you can ascertain learners’ level of understanding. Ask learners if they have any questions.
10. Give learners an exercise to complete on their own.
11. Walk around the classroom as learners do the exercise. Support learners where necessary.
Although circle geometry from Grade 11 has not been covered in this revision lesson, learners may need a recap of the theorems. If time permits, a lesson could be done in class otherwise an offer of a lesson after school may be worthwhile as it is tested again in the Grade 12 final examination. The video links offered below could also be used for yourself or shared with the learners.
ADDITIONAL ACTIVITIES/ READING
Further reading, listening or viewing activities related to this topic are available on the following web links:
https://www.youtube.com/watch?v=MAjEfC9CFGk
https://www.youtube.com/watch?v=-cxJMsqHH1Y
(Ratio and proportion)
https://www.youtube.com/watch?v=exnFVDNBf94
https://www.youtube.com/watch?v=JAdCofZbKTE
(Midpoint theorem)
D

15Grade 12 MATHEMATICS Term 3
TOPIC 1, LESSON 1: REVISION OF SIMILARITy, RATIO & PROPORTION AND THE MIDPOINT THEOREM
https://www.youtube.com/watch?v=A_1qG0M8gNI
(Midpoint theorem and converse)
https://www.youtube.com/watch?v=XUus6-9E9sQ&t=39s
https://www.youtube.com/watch?v=des4jx-5uS4
(Circle theorems)

TOPIC 1, LESSON 2: PROPORTIONALITy THEOREM
16 Grade 12 MATHEMATICS Term 3
TERM 3, TOPIC 1, LESSON 2
PROPORTIONALITY THEOREMSuggested lesson duration: 2 hours
TOPIC 1, LESSON 2: PROPORTIONALITy THEOREM
A POLICy AND OUTCOMES
CAPS Page Number 48
Lesson ObjectivesBy the end of the lesson, learners should be able to:
z prove the theorem, ‘a line drawn parallel to one side of a triangle divides the other two sides proportionally’.
z answer riders using the proportionality theorem.
CLASSROOM MANAGEMENT
1. Make sure that you are ready and prepared.
2. Advance preparation: Work through the lesson plan and exercises.
3. Write the lesson heading on the board before learners arrive.
4. Write work on the chalkboard before the learners arrive. For this lesson draw one acute-angled triangle and the first table for learners to complete (point 2).
5. The table below provides references to this topic in Grade 12 textbooks. Plan when you will get learners to practice the concepts learned by completing the exercises. Work through the lesson plan and decide where you will get learners to do the exercises. Indicate this on your lesson plans.
LEARNER PRACTICE
MIND ACTION SERIES
PLATINUM VIA AFRIKA
CLEVER CLASSROOM MATHS
EVERYTHING MATHS
(SIYAVULA)
EX PG EX PG EX PG EX PG EX PG EX PG
123
251256257
2 214 12
245249
11.111.2
277281
11.2 287 8.48.5
329333
B

17Grade 12 MATHEMATICS Term 3
TOPIC 1, LESSON 2: PROPORTIONALITy THEOREM
CCONCEPTUAL DEVELOPMENT
INTRODUCTION
1. Many learners have a mental block against geometry – encourage and praise learners as often as possible throughout these lessons.
2. This lesson follows an investigative approach.
DIRECT INSTRUCTION
1. Ask learners to draw two large triangles with a pen and ruler. Ask them to draw any two types (acute-angled, obtuse-angled or right-angled). Label each one ABC – it is not important where they choose to put the A, B and C.
2. Say: Lay your ruler on BC in the first triangle and draw a line IN PENCIL parallel to BC inside the triangle. It can be any distance from the base – try to avoid it being too close to the middle.
Once learners have drawn in their own line in their exercise books, draw a line on one of the triangles on the board.
Say (and do yourself): Label the new line DE.
E
A
B C
D
Note: BC does not need to be in the ‘base’ position. Refer learners to the table on the board. Ask learners to write it into their exercise books and complete it by measuring all the sides (recommend that they measure in mm for accuracy) and finding the ratio of the two sides. Leaners should round their answers to 3 decimal places.
BDAD = AB
AD = ABBD =
ECAE = AC
AE = ACCE =

18 Grade 12 MATHEMATICS Term 3
TOPIC 1, LESSON 2: PROPORTIONALITy THEOREM
3. Say: What do you notice about your answers? (Each pair below each other are equal).
4. Demonstrate the following on your own triangle on the board:
Note: As you draw in a curve, say ‘AD to BD’ is equal to ‘AE to EC’ etc. After showing the first pair, erase it to show the next pair and saying ‘AD to AB’ is equal to ‘AE to AC’After showing the second pair, erase it to show the next pair and saying ‘BD to AB’ is equal to ‘CE to AC’
DBAD
E
A
B C
D
AE
EC
ABAD
E
A
B C
D
ACAE
BABD
E
A
B C
D
CACE
5. Say: Erase DE. Lay your ruler on AB and draw a line DE parallel to AB. Make it either further away or closer than the last time.
Learners should repeat the entire process by completing the table below. Once the table has been completed, you need to repeat the action of showing which sides are in proportion as in the table above. For ease of everyone’s tables being the same, tell learners that D should lie on BC and E should lie on AC

19Grade 12 MATHEMATICS Term 3
TOPIC 1, LESSON 2: PROPORTIONALITy THEOREM
CEAE = AC
AE = ACCE =
DCBD = BC
BD = BCCD =
6. Ask learners to draw another triangle – a different type to the one they already had (in other words an obtuse-angled triangle or a right-angled triangle). Label the triangle ABC. Repeat points 2 to 5 using the new triangle.
7. Tell learners that, through investigation, they have learned a new theorem.
Ask learners to write the heading: Proportionality theorem in their books and to copy this diagram:
E
A
B C
D
8. Ask learners to write down the theorem in full, as well as the acceptable abbreviated form that can be used when using the theorem in a question. Tell learners to copy the following table into their books and add an extra row for the converse at the bottom.
Theorem Acceptable abbreviated form
A line drawn parallel to one side of a triangle divides the other two sides proportionally.
Line parallel one side of ∆
9. Ask: What theorem does this theorem remind you of? (The midpoint theorem)
10. Tell learners that the midpoint theorem is a special case of the proportionality theorem as it only works if the line drawn parallel to the third side is through the midpoints of the other two sides and, although we could say that the sides are in proportion, we know that the sides are really equal.

20 Grade 12 MATHEMATICS Term 3
TOPIC 1, LESSON 2: PROPORTIONALITy THEOREM
11. Ask: What does the converse of this theorem state? (If a line divides two sides of a triangle in the same proportion, then the line is parallel to the third side). Tell learners to write this in the next row of their table:
Theorem Acceptable abbreviated form
A line drawn parallel to one side of a triangle divides the other two sides proportionally.
Line parallel one side of ∆
12. Do a worked example. Learners should write it in their exercise books and take notes.
Example Teaching notes
Given that BC // DE, find the value of x.
E AC
B
D
5 3
x + 3
x - 2
Remind learners that in geometry we need to be clear on why a statement is known to us by giving a reason for any new statement we make.Ask: Make a statement using the sides.
ADBD
AECE=
Point out that it could also have been
orABAD
ACAE
ABBD
ACCE
= =
and that they need to find the statement which will give them the easier calculation.Once the statement has been made, substitute the given values and solve.
Solution:
ADBD
AECE= Line parallel one side of ∆
xx2
3
3
5
-
+=
3(x+3) = 5(x-2) 3x+9 = 5x-10
2x = 19 x = 9,5
13. Ask directed questions so that you can ascertain learners’ level of understanding. Ask learners if they have any questions.
14. Give learners an exercise to complete with a partner.
15. Walk around the classroom as learners do the exercise. Support learners where necessary.

21Grade 12 MATHEMATICS Term 3
TOPIC 1, LESSON 2: PROPORTIONALITy THEOREM
16. Once learners have completed an exercise and it has been corrected, move on to proving the theorem with them.
17. Prove the theorem that they have just learned and practiced:
z Explain that all theorems can be proved using other theorems.
z Proving why a theorem works can often offer an understanding of another aspect of geometry.
z Understanding why a theorem will always work may also assist learners to remember the theorem.
z Tell learners that when proving a theorem, it is accepted practice to use other previously accepted statements (other theorems) but not the statement regarding the theorem that is being proved.
18. Point out that using the theorem and proving the theorem are very different. In the exercises that they have completed so far, learners were using the theorem. Now they will prove it.
19. Work through the proof of ‘A line drawn parallel to one side of a triangle divides the other two sides proportionally’. As it is the first theorem you are doing with them, explain how the same headings are always used: given, required to prove (RTP) and proof.
20. Ask learners to write the proof in the back of their exercise books so that all the proofs they need to learn for the exams are in one place. The heading should be the theorem written in full.
Proof for: A line drawn parallel to one side of a triangle divides the other two sides proportionally
GIVEN: DE || BC
E
A
B C
D
RTP: BDAD
CEAE
=
CONSTRUCTION: In ∆ADE, draw height DG (to base AE) and height EF (to base AD). Join BE and CD to create ∆BDE and ∆CED.

22 Grade 12 MATHEMATICS Term 3
TOPIC 1, LESSON 2: PROPORTIONALITy THEOREM
PROOF:
C
F
E
A
B
G
D
Statement Reason
.
.
.
.
AreaArea
AreaArea
BDEADE
BD EFAD EF
BDAD
CDEADE
EC DGAE DG
ECAE
21212121
DD
DD
= =
= =
Area Areaand BDE CDED D=
∴ AreaArea
AreaArea
BDEADE
CDEADE
DD
DD=
∴ BDAD
ECAE=
same base (DE), same height (between parallel lines)
ADDITIONAL ACTIVITIES/ READING
Further reading, listening or viewing activities related to this topic are available on the following web links:
http://learn.mindset.co.za/resources/mathematics/grade-12/euclidean-geometry/02-proportionali-ty-theorems
(The proportionality theorem and its converse)
https://www.youtube.com/watch?v=dlW3jeTj1Ag
(The proportionality theorem and its converse)

TOPIC 1, LESSON 3: SIMILAR TRIANGLES
23Grade 12 MATHEMATICS Term 3
TERM 3, TOPIC 1, LESSON 3
SIMILAR TRIANGLESSuggested lesson duration: 2 hours
TOPIC 1, LESSON 3: SIMILAR TRIANGLES
APOLICy AND OUTCOMES
CAPS Page Number 48
Lesson ObjectivesBy the end of the lesson, learners should be able to:
z prove the theorem, ‘if two triangles are equiangular then the corresponding sides are in proportion (and the triangles are therefore similar)’
z answer riders using similar triangles.
CLASSROOM MANAGEMENT
1. Make sure that you are ready and prepared.
2. Advance preparation: Work through the lesson plan and exercises.
3. Write the lesson heading on the board before learners arrive.
4. Write work on the chalkboard before the learners arrive. For this lesson draw the diagram for the first example.
5. The table below provides references to this topic in Grade 12 textbooks. Plan when you will get learners to practice the concepts learned by completing the exercises. Work through the lesson plan and decide where you will get learners to do the exercises. Indicate this on your lesson plans.
LEARNER PRACTICE
MIND ACTION SERIES
PLATINUM VIA AFRIKA
CLEVER CLASSROOM MATHS
EVERYTHING MATHS
(SIYAVULA)
EX PG EX PG EX PG EX PG EX PG EX PG
4567
263267272275
34
217221
34
252254
11.311.4
289294
11.3 295 8.68.78.8
336340346
B

24 Grade 12 MATHEMATICS Term 3
TOPIC 1, LESSON 3: SIMILAR TRIANGLES
C CONCEPTUAL DEVELOPMENT
INTRODUCTION
1. Learners first encountered similar triangles in Grade 9, so the concept of similarity should be familiar.
2. Most of the questions from this lesson onwards combine the similar triangles and the proportionality theorem.
3. Most of this lesson makes use of examples to assist learners in understanding what will be expected of them. Although learners should already have the skills to use their knowledge of proportion and similarity, they often find what is covered now quite difficult. Each example used is essential to learners for learners to be exposed to as many ways a question can be asked as possible. Do each example step-by-step with learners.
DIRECT INSTRUCTION
1. Write ∆DFG///∆PQR on the board. Ask: What can you tell me from the statement?
(D^ = P^ , F^ = Q^ and Ĝ = R^ and PQDF
QRFG
PRDG= = )
If this is not easy for learners, do a few more examples. If triangles are similar, learners must know that they are being told that the angles are all equal (in the order given) and that the sides are in proportion.Do as many examples as necessary until learners can immediately write down the corresponding information necessary to a similarity statement.
Remind learners that other statements can be made from the proportion statements using cross multiplication:
PQDF
QRFG
PRDG= =
DF.QR = PQ.FG OR FG.PR = QR.DG OR DF.PR = PQ.DG
3. Tell learners that they may sometimes have to work in reverse to find which sides and which triangles to look in for the solution. For example: Prove EF2 = KE.GH Say: This may look complicated, but what could this have looked like before the cross multiplication happened?
orKEEF
EFGH
GHEF
EFKE
= =

25Grade 12 MATHEMATICS Term 3
TOPIC 1, LESSON 3: SIMILAR TRIANGLES
Show learners how to see which triangles should be looked at to prove this:
EF GH=KE EF
z First look at the statements this way and tell learners to check if EFK forms a triangle and if GHEF forms a triangle: EFK is possible (learners would need to check the diagram – it could also be a straight line).
z Clearly GHEF will not be a triangle. This ratio will therefore not work.
Perhaps the other option will work better:
EF KE=GH EF
Again, we get EFGH and EFK. If this happens – learners need to look for equal sides that could be substituted for one of the sides so that two triangles CAN be found within the ratios formed.
4. This is an important skill which we will come back to later when it is required in an example that we will do.
5. Say: You have now encountered similarity of triangles as well as the connection to the sides being in proportion. These concepts get combined now. To cover as many possibilities of how these concepts are combined, we are going to work through four examples together. It is important you work carefully and keep up as we go through the examples. Ask questions if you are unsure so that you are not left behind.
6. Do the following worked examples:
z As each part of the question is answered, use a diagram to show what is required visually. Refer learners to the diagram all the time.
z Encourage learners to highlight parallel lines as it makes the triangle (and therefore the proportions) easier to see.
z Encourage learners to shade triangles that need to be proved similar.

26 Grade 12 MATHEMATICS Term 3
TOPIC 1, LESSON 3: SIMILAR TRIANGLES
Example 1
1. Complete the following statement of the theorem: If a line divides two sides of a triangle in the same proportion, then …2. In the diagram, ABC is a triangle with F on AB and E on AC. BC||FE. D is on AF with
. AEAFAD
5
312= = units and EC = 8 units.
E
F
12 8A
B
C
D
a) Prove that DE||FC. b) If AB = 14 units, calculate the length of BF.
SEP 2015
Teaching notes
1.This is study work – remind learners that they need to know their theorems. Say: If you are asked a theorem at the beginning of a question, it is an indication that this theorem will be required. This is useful if you find the question difficult – making this theorem your focus may assist you in seeing something you may not have done without the hint.2a)Ask: What do we know about parallel lines? (Corresponding angles and alternate angles are equal) Note: although this is true, remind learners what the focus should be. Ask: What else do we know about parallel lines in triangles from this year’s work and in particular from the first question? (If a line divides two sides of a triangle in the same proportion then that line must be parallel to the third side)Ask: Which sides would have to be in proportion to make DE ||FC?AE:EC = AD:DF OR AE:AC = AD:AFUsing either of these pairs will work. Tell learners if we can show that any of these proportions are equal, then the lines must be parallel.

27Grade 12 MATHEMATICS Term 3
TOPIC 1, LESSON 3: SIMILAR TRIANGLES
2b)Tell learners to consider the two sides mentioned. Ask: Do the two sides mentioned have a connection? (Yes – using the parallel lines given in the question, BF:BA = CE:CA)Ask: Is there enough information available to use these pairs? In other words, could I make a statement with just one unknown?(Yes – using the 8, 12 and 14)Tell learners to start with the unknown side – it will make the algebraic manipulation easier.
Solution:
1. … then the line is parallel to the third side.
2. a)
ECAE
DFAD
KK8
12
2
3
2
3
2
3
= =
= =
∴ ECAE
DFAD=
∴ | FC|DE line divides two sides of ∆ in proportion(If AE:AC = AD :AF had been used, the ratios would have been 3:5)
2. b) BABF
CACE= line || one side ∆
BF14 20
8=
∴ .BF20
8 14=
∴ ,BF528
5 6= =

28 Grade 12 MATHEMATICS Term 3
TOPIC 1, LESSON 3: SIMILAR TRIANGLES
Example 2
In the diagram below, ACBT is a cyclic quadrilateral having AC||TB. CT is produced to P such that the tangent PA meets the circle at A. BT produced meets PA at D.
T
P
22
32
A
B
C
D
1. Prove that ∆PAT /// ∆PCA.2. If PA = 6, TC = 5 and PT = x, a) show that PT = 4 b) calculate the length of PD.
GAUTENG SEP 2017
Teaching notes
1.Ask: What do we need to prove two triangles similar?(Sides in proportion or 2 (3) equal angles)Ask: From the information given, which proof is it likely to be? (Angles)Say: Don’t forget that the triangles are given in the correct order. Use this to look carefully at the pairs of angles that should be equal if you get stuck.Remind learners to look carefully at the information given: cyclic quad, tangent, parallel lines – one or more of these will need to be used to find the two equal angles required. Point out that any of the above information that is not used will more than likely be needed in another question.2.a)Remind learners that if ‘show that’ or ‘prove that’ is in a question, they may not use the information required to be shown. The information should merely be used as a check as if they were asked to ‘find’. However, it does mean that the information may need to be used in a further question.Tell learners to consider the side mentioned.Ask: Is there a connection with other sides to make a proportion statement? (Yes – using the similar triangles proved)

29Grade 12 MATHEMATICS Term 3
TOPIC 1, LESSON 3: SIMILAR TRIANGLES
Ask: Once a statement has been made, is there enough information on the sides mentioned? In other words, could I make a statement with just one unknown?Ask a learner for the proportion statement from the similar triangles and write it on the board. Tick what is wanted and tick what is known. { {
PAPT
CAAT
PCPA= =
{Say: Firstly, it seems clear the middle fraction will not be required.
PAPT
PCPA=
Secondly, notice that two sides are the same, so when we cross multiply, there are only three sides involved. PA2 = PT.PCThere doesn’t seem to be enough information. What other information were we given? (TC = 5) There is no TC here – look at the drawing, find TC. Note that TC lies on PC – the line in our statement. Do we have a length for PC?(Yes - x+5)
Remind learners that a length cannot be negative.2.b)Tell learners to consider the side mentioned. Ask: Is there a connection with other sides to make a proportion statement? (Yes – using the parallel lines given in the question, PD:PA = PT:TC)Ask: Is there enough information available to use these pairs?
In other words, could I make a statement with just one unknown? (Yes – using the 4, 6 and 9 – from the 5+4)
Solution:
1. In ∆PAT and ∆PCA P^ = P^ common Â1=Ĉ1 tan chord theorem ∴PT^ A = PÂC int <’s of ∆ ∴ ∆PAT///∆PCA AAA

30 Grade 12 MATHEMATICS Term 3
TOPIC 1, LESSON 3: SIMILAR TRIANGLES
2a) PAPT
CAAT
PCPA= = ∆PAT///∆PCA
PA2 = PT.PC
(6)2 = x(x + 5)
36 = x2 + 5x 0 = x2 + 5x - 36
0 = (x + 9)(x - 4)
∴ x = -9 or x = 4
∴ PT = 4
2b) PAPD
TCPT= line ∥ one side ∆
PD6 9
4=
.PD
9
4 6=
∴ ,PD38
2 67= =
Example 3
In the diagram below, D and E are points on the sides AC and AB respectively of ∆ABC such that DE∥BC. F is a point on BC such that EF∥AC. AB produced, and DF produced meet in G.
E
B
A
C
G
F
D3
3
31
1
11
42 2
2 2
1. Prove that FCBC
DAAC= .
2. Prove that: ∆BFE///∆EDA3. It is further given that EF = 2, BF = 3,5 and ED = 10, determine the length of a) AD b) DC
EC SEP 2017

31Grade 12 MATHEMATICS Term 3
TOPIC 1, LESSON 3: SIMILAR TRIANGLES
Teaching notes
1.Ask: Is there a direct connection between these sides? (No)
Is there a two-way connection? In other words, do both pairs have sides in common that they are connected to? (Yes – both are in proportion to BA:EA using the two pairs of parallel sides given).
2.Ask: What do we need to prove two triangles similar?
(Sides in proportion or 2 (3) equal angles)Ask: From the information given, which proof is it likely to be? (angles)Say: Don’t forget that the triangles are given in the correct order. Use this to look carefully at the pairs of angles that should be equal if you get stuck.Remind learners to look at all the information given – in this case the parallel lines.3a.Ask: Is there a connection with the sides given and the unknown side?
(Yes – the sides are all directly linked to the triangles that were proved similar in (2))3b.Ask: Is there a connection with the sides given and the unknown side?
(Yes – it is opposite a known side and opposites sides of a parallelogram are equal)
Solution:
1. FCBC
EABA= line || one side ∆ (EF||AC)
DAAC
EABA= line || one side ∆ (DE||BC)
∴ FCBC
DAAC=
2. In ∆BFE and ∆EDA Ê1 = Â corres <’s; EF||AC B^ 2 = Ê3 corres <’s; ED||BC ∴ F^3 = D^ 1 int <’s of ∆ ∴ ∆BFE///∆EDA AAA
3a. EFAD
BFED= ∆BFE///∆EDA
,
,.
,
AD
AD
AD
2 3 510
3 510 2
740
5 71
=
=
= =
3b. DC = 2 opp sides of parm

32 Grade 12 MATHEMATICS Term 3
TOPIC 1, LESSON 3: SIMILAR TRIANGLES
Example 4
In the diagram below, cyclic quadrilateral EFGH is drawn. Chord EH produced and chord FG produced meet at K. M is a point on EF such that MG||EK. Also, KG = EF.
E
B
F
K
G
HM
3
1
1
1
2
2
2
1. Prove that: a) ∆KGH /// ∆KEF b) EF 2 = KE.GH c) KG2 = EM.KF2. If it is given that KE = 20 units, KF = 16 units and GH = 4 units, calculate the length of EM.
MAY/JUNE 2016
Teaching notes
1a)Ask: What do we need to prove two triangles similar?(Sides in proportion or 2 (3) equal angles)Ask: From the information given, which proof is it likely to be? (angles)Say: Don’t forget that the triangles are given in the correct order. Use this to look carefully at the pairs of angles that should be equal if you get stuck.Remind learners to look carefully at the information given: cyclic quad, parallel lines – one or both will need to be used to find the two equal angles required. Also, point out, any of the above not used will more than likely be needed in another question.1b)Tell learners that as two triangles have just been proved similar, it would make sense to start with the proportion statements from those triangles to check if they would be any help in proving what is required.Remind learners that they may not be sure at this stage if this will be helpful so in an assessment situation they should work on scrap paper or the question paper.

33Grade 12 MATHEMATICS Term 3
TOPIC 1, LESSON 3: SIMILAR TRIANGLES
If ∆KGH /// ∆ KEF then: KEKG
KFKH
EFGH= =
Remind learners what you started showing them at the beginning of this lesson. Start with the statement given and reverse back into a proportion statement:
EF 2 = KE.GHWork in reverse:
orKEEF
EFGH
GHEF
EFKE
= =
Ask: Is there a connection between any of these statements and the one we are trying to prove? (Yes – many sides are the same)Say: Perhaps we should remove the fraction from the first statement which is not useful then have a closer look.
andKEKG
EFGH
KEEF
EFGH
= =
Ask: Can you see the connection is looking clearer now? But what is the problem?(The first one has a KG and the second one has 2 EFs).Ask: What ideas do you have to solve this problem? (Use the fact that EF = KG - given in the question)1c)Learners should note that the side that has been squared is yet again the side that is equal to another side. We will probably need to use substitution again.Tell learners to work with the statement that needs to be proved and change it back into a proportion statement.
KG2 = EM.KF
orEMKG
KGKF
KFKG
KGEM
= =
Tell learners to look at the diagram and check each of the statements made. It should be clear that the first statement is not useful. The second statement almost links to the triangle EFK which has parallel lines MG and EK.Ask: What is the problem? (EM:EF would be the statement made from that triangle)But what do we know? (EF = KG)
2.Ask: Is there a connection with the sides given and the unknown side?(Not a clear connection, and this makes it difficult for learners to see).Remind learners to look back at any given information as well as what has been proved. These are the only places that the answer could lie.If learners still don’t see the connection for themselves, remind them that EF = KG and to look at the two statements that have been proved.Ask: What if we substituted one statement for the other?(That would make the LHS of the two statements equal and therefore, the RHS of both would be equal too).

34 Grade 12 MATHEMATICS Term 3
TOPIC 1, LESSON 3: SIMILAR TRIANGLES
Solution:
1a) In ∆KGH and ∆KEF K^ = K^ common Ĥ2 = F^ ext < cyclic quad ∴ Ĝ3 = Ê int <’s of ∆ ∴ ∆KGH /// ∆KEF AAA
1b) KEKG
EFGH= ∆KGH /// ∆KEF
but KG = EF given
∴ KEEF
EFGH=
∴ EF 2 = KE.GH
1c) FK
KGEFEM
= line || one side ∆
but KG = EF given
∴ KFKG
KGEM
=
∴ KG 2 = EM.KF
2. KG 2 = EM.KF and EF 2 = KE.GH but KG = EF ∴ KE.GH = EM.KF ∴ 20.4 = EM.16 ∴ EM = 5 units
7. Ask directed questions so that you can ascertain learners’ level of understanding. Ask learners if they have any questions.
8. Give learners an exercise to complete with a partner.
9. Walk around the classroom as learners do the exercise. Support learners where necessary.
10. Once learners have completed an exercise and it has been corrected, move on to proving the theorem with them.
11. Ask learners to write the proof in the back of their exercise books so that all the proofs they need to learn for the exams are in one place. The heading should be the theorem written in full.

35Grade 12 MATHEMATICS Term 3
TOPIC 1, LESSON 3: SIMILAR TRIANGLES
Proof for: If two triangles are equiangular, their sides are in proportion (and therefore the triangles are similar).
GIVEN: Â = D^ , B^ = Ê and Ĉ = F^
E FCB
A
D
P Q
RTP: DEAB
DFAC
EFBC
= =
CONSTRUCTION: Mark off P and Q on DE and DF so that PD = AB and DQ = AC. Join PQ.
PROOF:
Statement Reason
∆ABC ≡ ∆DEF∴ DP^ Q = B^
but B^ = Ê∴ DP^ Q = Ê
∴ PQ || EF
∴ DEDP
DFDQ=
but DP = AB and DQ = AC
∴ DEAB
DFAC=
Similarly, by constructing PE and QE on DE and EF respectively it could be proved that
DEAB
EFBC=
∴ DEAB
DFAC
EFBC
= =
SAS
given
corres <’s equal

36 Grade 12 MATHEMATICS Term 3
TOPIC 1, LESSON 3: SIMILAR TRIANGLES
ADDITIONAL ACTIVITIES/ READING
Further reading, listening or viewing activities related to this topic are available on the following web links:
https://www.youtube.com/watch?v=t38S1-LvgY4
(Similarity theorem)
https://www.youtube.com/watch?v=zPFw_Iy0QQw
(Converse of similar triangles theorem)
D

TOPIC 1, LESSON 4: PyTHAGOREAN THEOREM
37Grade 12 MATHEMATICS Term 3
TERM 3, TOPIC 1, LESSON 4
PYTHAGOREAN THEOREMSuggested lesson duration: 1 hours
TOPIC 1, LESSON 4: PyTHAGOREAN THEOREM
APOLICy AND OUTCOMES
CAPS Page Number 48
Lesson ObjectivesBy the end of the lesson, learners should be able to:
z prove the theorem of Pythagoras z use the theorem of Pythagoras and the theorem, the perpendicular drawn from the vertex
of the right angle of a right-angled triangle to the hypotenuse, divides the triangle into two triangles that are similar to each other and similar to the original triangle to find the lengths of missing sides
z answer riders using a combination of all the theorems covered so far.
CLASSROOM MANAGEMENT
1. Make sure that you are ready and prepared.
2. Advance preparation: Work through the lesson plan and exercises.
3. Write the lesson heading on the board before learners arrive.
4. Write work on the chalkboard before the learners arrive. For this lesson draw the diagram for point 1.
5. The table below provides references to this topic in Grade 12 textbooks. Plan when you will get learners to practice the concepts learned by completing the exercises. Work through the lesson plan and decide where you will get learners to do the exercises. Indicate this on your lesson plans.
B

38 Grade 12 MATHEMATICS Term 3
TOPIC 1, LESSON 4: PyTHAGOREAN THEOREM
C
LEARNER PRACTICE
MIND ACTION SERIES
PLATINUM VIA AFRIKA
CLEVER CLASSROOM MATHS
EVERYTHING MATHS
(SIYAVULA)
EX PG EX PG EX PG EX PG EX PG EX PG
8 277 5 224 5 257 11.5 303 11.411.5-11.8*
298 8.9 351
CM*: Mixed exercises incorporating a combination of concepts
CONCEPTUAL DEVELOPMENT
INTRODUCTION
1. Once learners have worked with similar triangles again, the concepts in this lesson should be quite easy for them.
2. The lesson takes an investigative approach while practicing proving triangles and similar and writing which sides are in proportion.
DIRECT INSTRUCTION
1. Use the diagram below:
D
B
A
C
2. Ask: How many right-angled triangles can you see? (Three)
Name them (∆ ABC, ∆ ABD and ∆ ACD)

39Grade 12 MATHEMATICS Term 3
TOPIC 1, LESSON 4: PyTHAGOREAN THEOREM
3. Ask learners to prove ∆ABC /// ∆DBA. Give learners a few minutes, then confirm they did the following:
In ∆ABC///∆DBA: CÂB = AD^ B = 90º given B^ = B^ common ∴ AĈB = BÂD <’s of ∆ ∆ABC /// ∆DBA AAA
4. Ask learners to prove ∆ABC///∆DAC. Give learners a few minutes, then confirm they did the following:
In ∆ABC /// ∆DBA:In ∆ABC /// ∆DAC: CÂB = AD^ C = 90º given Ĉ = Ĉ common ∴ AB^ C = CÂD <’s of ∆ ∆ABC /// ∆DAC AAA
5. Write the two statements on the board.
∆ABC /// ∆DBA and ∆ABC ///∆DAC
6. Ask: If this is true what can you deduce? (∆DBA /// ∆DAC)
What statement can we make about all three triangles? ∆ABC///∆DBA///∆DAC
7. Look at the sides that are in proportion. Say: We will look at one pair of sides at a time.
If ∆ABC /// ∆DBA If ∆ABC /// ∆DAC If ∆DBA /// ∆DAC
then BDAB
ABBC
ADAC
= = then ADAB
ACBC
CDAC= = then AD
BDACAB
CDAD= =
Say: Let’s focus on a specific pair and work with the proportions.
Point out that the pair of sides chosen was the pair that had the repeated side in it.
If BDAB
ABBC= If AC
BCCDAC= If AD
BDCDAD=
then AB 2 = BD.BC then AC 2 = CD.CB then AD 2 = BD.CD

40 Grade 12 MATHEMATICS Term 3
TOPIC 1, LESSON 4: PyTHAGOREAN THEOREM
8. Show each of these statements on the diagram:
AB 2 = BD.BC
D
BD.BC
B=
A
AB2
C
(read right to left)
AC 2 = CD.CB
D
CD.CB
B
A
AC2
C=
(read right to left)
AD 2 = BD.CD
D
CD.DB
B
A
AD2
C=
(read right to left)

41Grade 12 MATHEMATICS Term 3
TOPIC 1, LESSON 4: PyTHAGOREAN THEOREM
Encourage learners to see the pattern – it will make it easier for them in an assessment situation. Draw a triangle similar to the one used above but labelled with P, Q, R and S or G, H, J and K etc. and ask questions like the three questions above to confirm learners have grasped the concept.For example, in the diagram below:Ask: IR 2 = ? ER 2 = ? TR 2 = ? IR 2 = IT.IE ER 2 = ET.EI TR 2 = ET.TI
R
I
T
E30º
9. Tell learners that you have proved the following theorem: The perpendicular drawn from the vertex of the right angle of a right-angled triangle to the hypotenuse, divides the triangle into two triangles that are similar to each other and similar to the original triangle.
Go through each part of the theorem, showing it on the original diagram at the same time.
10. Say: Using the results of this theorem, we can also prove the theorem of Pythagoras.
Proof for the theorem of Pythagoras
RTP: BC 2 = AB 2 + AC 2
D
B
A
C

42 Grade 12 MATHEMATICS Term 3
TOPIC 1, LESSON 4: PyTHAGOREAN THEOREM
PROOF:
AB 2 = BD.BC and AC 2 = CD.CB
∴ AB 2 + AC 2 = BD.BC + CD.CB
∴ AB 2 + AC 2 = BC(BD + CD)
∴ AB 2 + AC 2 = BC(BC)
∴ AB 2 + AC 2 = BC 2
11. Ask learners if they have any questions before you do a worked example with them. Learners should write the worked example in their exercise books.
Example Teaching notes
Find x and y:
R
S
TV
y x
20
4
Remind learners to look for the pattern.Once x or y have been found, the theorem of Pythagoras can be used for the other one using RT as the hypotenuse. For the sake of practicing the new work, ask learners to use the new theorem learned for finding both x and y.
Solution:
.
.
xxx
yy
y
4 20
80
80 4 5
16 20
320
320 8 5
2
2
2
2
=
=
= =
=
=
= =
12. Ask directed questions so that you can ascertain learners’ level of understanding. Ask learners if they have any questions.
13. Give learners an exercise to complete with a partner.
14. Walk around the classroom as learners do the exercise. Support learners where necessary.

43Grade 12 MATHEMATICS Term 3
TOPIC 1, LESSON 4: PyTHAGOREAN THEOREM
ADDITIONAL ACTIVITIES/ READING
Further reading, listening or viewing activities related to this topic are available on the following web links:
https://www.youtube.com/watch?v=8h0g3Ap8b7E
(Pythagoras theorem and its converse)
D

TOPIC 1, LESSON 5: REVISION AND CONSOLIDATION
44 Grade 12 MATHEMATICS Term 3
TERM 3, TOPIC 1, LESSON 5
REVISION AND CONSOLIDATIONSuggested lesson duration: 2 hours
TOPIC 1, LESSON 5: REVISION AND CONSOLIDATION
A POLICy AND OUTCOMES
CAPS Page Number 48
Lesson ObjectivesBy the end of the lesson, learners should be able to:
z all concepts covered in previous lessons.
CLASSROOM MANAGEMENT
1. Make sure that you are ready and prepared.
2. Advance preparation: Work through the lesson plan and exercises.
3. Write the lesson heading on the board before learners arrive.
4. Write work on the chalkboard before the learners arrive. For this lesson draw the diagram for the first example.
5. The table below provides references to this topic in Grade 12 textbooks.
LEARNER PRACTICE
MIND ACTION SERIES
PLATINUM VIA AFRIKA
CLEVER CLASSROOM MATHS
EVERYTHING MATHS
(SIYAVULA)
EX PG EX PG EX PG EX PG EX PG EX PG
RevSome
Ch
279285
Rev 225 Qu’s 259 Rev 305 11.911.10
313315
8.10 355
B

45Grade 12 MATHEMATICS Term 3
TOPIC 1, LESSON 5: REVISION AND CONSOLIDATION
CCONCEPTUAL DEVELOPMENT
INTRODUCTION
1. This lesson is important. So far learners have mostly used the theorems in isolation. Learners must now combine all the information and consolidate their knowledge.
2. Encourage learners. If they enjoy the challenge of Euclidean Geometry, their skills and knowledge are likely to improve.
DIRECT INSTRUCTION
1. Ask learners to revise what they have learned in this section. Point out issues that you know are important as well as problems that you encountered from your own learners during the topic.
2. If learners want you to explain a concept again, do that now.
3. Do a selection of the Grade 12 geometry questions from the March examinations for 2016 and 2017 before learners do a consolidation exercise.
4. As you do each example, get as much input from learners as possible. Ask questions and encourage discussion. Learners should write each example in their exercise books.
5. Remind learners to read the given information carefully and to keep looking at the diagram as they read each item of information.
6. Point out that all information given will always be useful.
7. All the diagrams are available and enlarged in the Resource Pack.

46 Grade 12 MATHEMATICS Term 3
TOPIC 1, LESSON 5: REVISION AND CONSOLIDATION
Example 1
In the diagram, PQRS is a quadrilateral with diagonals PR and QS drawn. W is a point on PS. WT is parallel to PQ with T on QS. WV is parallel to PR with V on RS. TV is drawn. PW : WS = 3:2
T
P
Q W
V
S
R
12
12
a) Write down the value of the ratios: (i) TQST (ii) VR
SV
b) Prove that T^ 1 = Q^ 1.c) Complete the following statement: ∆VWS /// ….d) Determine WV : PR
Teaching notes
Before learners begin, they should fill in the ratio given using 3k and 2k and also show that PS will be 5k.As other ratios are found they should be filled in on the diagram to assist in future questions.a)Both (i) and (ii) should be easily recognised by learners. If they have highlighted the parallel lines, it should be easy to see.b)Ask: Can anyone see the connection with the sides that are in proportion that was just proved? (Both statements share WP
SW . Therefore, the other two must also be in proportion).
And if they are in proportion, then what else must be true? (Parallel sides and corresponding angles).c)If learners, have highlighted the parallel sides, they should recognise the similar triangles in ∆PRS.d)This is a statement made directly made from the previous answer – if triangles are similar, their sides are in proportion.

47Grade 12 MATHEMATICS Term 3
TOPIC 1, LESSON 5: REVISION AND CONSOLIDATION
Solution:
a) (i) TQST
WPSW= line // one side ∆
3
2=
(ii) VRSV
WPSW= line // one side ∆
3
2=
b) TQST
VRSV= both equal WP
SW
∴ TV || QR line divides two sides ∆ in proportion ∴ T^ 1 = Q^ 1. corres <’s
∆VWS /// ∆RPS
PRWV
SPSW= ∆VWS/// ∆RPS
5
2=
Example 2
In the diagram below, ∆ABC and ∆PQR are given with  = P^ , B^ = Q^ and Ĉ = R^
A
D E
Q R
P
B C
DE is drawn such that AD = PQ and AE = PR.a) Prove that ∆ADE ≡ ∆PQR.b) Prove that DE || BC.
c) Hence, prove that PQAB
PRAC=

48 Grade 12 MATHEMATICS Term 3
TOPIC 1, LESSON 5: REVISION AND CONSOLIDATION
Teaching notes
a)Learners should find this straightforward, providing they know their conditions of congruency. Ask: Which condition of congruency will be used? (SAS)b)Ask: How do you prove that two lines are parallel?(Find corresponding or alternate angles equal).Is there enough information here to do that?(Yes, using the fact that the two triangles were proved congruent).c)Ask: What do we know about the sides in ∆ABC now that the sides have been proved parallel? (The sides are in proportion).Once this statement has been made, equal sides can be substituted.
Solution:
a) In ∆ADE and ∆PQR: AD = PQ given AE = PR given  = P^ given ∆ADE ≡ ∆PQR SASb) ÂD^ E = Q^ ∆ADE≡∆PQR but B^ = Q^ given ∴ AD^ E = B^
∴ DE||BC corres <’s equal
c) ADAB
AEAC
= line parallel one side ∆
AD = PQ given AE = PR given
∴ PQAB
PRAC=

49Grade 12 MATHEMATICS Term 3
TOPIC 1, LESSON 5: REVISION AND CONSOLIDATION
Example 3
In the diagram below, VR is a diameter of a circle with centre O. S is any point on the circumference. P is the midpoint of RS. The circle with RS as diameter cuts VR at T. ST, OP and SV are drawn.
R
TO
V
S
P1
1
2
221
1
a) Why is OP⏊PS?b) Prove that ∆ROP /// ∆RVS.c) Prove that ∆RVS /// ∆RST.d) Prove that ST 2 = VT.TR
Teaching notes
Remind learners they should always read all the information carefully and fill anything onto the diagram that they think may be useful.Ask: What is useful? (VŜR = 90º because VR is a diameter; ST^R = 90º because RS is a diameter; OP = OR because O is the centre; P^ 1 = P^ 2 = 90º, because the line from the centre to the midpoint of a chord is perpendicular to the chord)Tell learners to mark all of these on the diagram – but to remember that these pieces of information were not given and that if any of them are used, a reason will need to be given.a)This was covered aboveb) and c)Ask: How do we prove two triangles similar?(Equal angles or sides in proportion).Which fact is more suitable for these triangles? (Equal angles)

50 Grade 12 MATHEMATICS Term 3
TOPIC 1, LESSON 5: REVISION AND CONSOLIDATION
d)Say: ‘Undo’ the statement given in the question to ascertain which triangles need to be considered.
ST 2 = VT.TR
VTST
STTR=
Ask: Do the letters (STV and TRS) form triangles that could be proved similar? (Yes)
Solution:
a) Line from centre to midpoint chord
b) OP || VS midpt theoremIn ∆ROP and ∆RVS:
O^ 2 = V^ corres <’s ; OP//VS R^ = R^ common ∴ P^ 2 = Ŝ1 <’s of ∆ ∴ ∆ROP /// ∆RVS AAA
c) In ∆RVS and ∆RST: R^ = R^ common VŜR = ST^ R = 90º < in semi-circle RŜT = RV^ S <’s of ∆ ∴ ∆RVS ///∆RST AAA
d) In ∆RTS and ∆STV: RT^ S = VT^ S = 90º <’s on straight line RŜT = RV^ S proved above ∴ R^ = Ŝ1 <’s of ∆ ∴ ∆RTS /// ∆STV AAA
∴ RT TSST VT=
∴ ST^ 2 = VT.TR
8. Ask directed questions so that you can ascertain learners’ level of understanding. Ask learners if they have any questions.
9. Give learners an exercise to complete with a partner.
10. Walk around the classroom as learners do the exercise. Support learners where necessary.

51Grade 12 MATHEMATICS Term 3
TOPIC 1, LESSON 5: REVISION AND CONSOLIDATION
11. Once learners have completed the exercises provided and you have assisted them with any corrections, give the learners the following activity to do to assist them for the final examinations:
Tell learners to summarise all their theorems into one table (so far, they have multiple small tables). Learners need to add an extra column at the end where they should make a sketch to demonstrate the theorem.Suggest that they also put their Grade 8 - 11 theorems in the summary too.
Give learners a few days to a week to complete their summaries. Check that they have an accurate summary and that they have remembered all the theorems. Time permitting, learners could work in pairs or groups of three to check each other’s tables, and add to their own tables where necessary. This must be a useful and productive experience for them that will assist them in their understanding and preparation for an assessment.

TOPIC 2 STATISTICS
52 Grade 12 MATHEMATICS Term 3
Term 3, Topic 2: Topic Overview
STATISTICS
TOPIC 2 STATISTICS
A A. TOPIC OVERVIEW
z This topic is the second of three topics in Term 3. z This topic runs for two weeks (9 hours). z It is presented over three lessons. z The lessons have been divided according to sub-topics, not according to one school lesson.
An approximate time has been allocated to each lesson (which will total 9 hours). For exam-ple, one lesson in this topic could take three school lessons. Plan according to your school’s timetable.
z Statistics counts 13% of the final Paper 2 examination. z This is a section of work in which learners can score maximum marks. Make a concerted
effort to ensure learners understand this topic. It should not be relegated to a rushed job at the end of the year. (Diagnostic report)
z There is ample time to revise the concepts from previous years and to learn and consolidate the new concepts.
Breakdown of topic into 3 lessons:
Lesson title Suggested time (hours)
Lesson title Suggested time (hours)
1 Revision of Grade 10 and 11 statistics
3,5 3 Revision 2
2 Scatter plots, Least squares regression line, correlation coefficient
3,5

53Grade 12 MATHEMATICS Term 3
TOPIC 2 STATISTICS
C
SEQUENTIAL TABLE
GRADE 11 and earlier GRADE 12
LOOKING BACK CURRENT
z Measures of central tendency in grouped and ungrouped data
z Estimated mean, modal interval and interval in which the median lies
z Measures of dispersion z Five number summary and box and
whisker diagrams z Analysis of statistics z Histograms z Frequency polygons z Ogives (cumulative frequency curves) z Variance and standard deviation of
ungrouped data z Symmetric and skewed data z Outliers.
Use: z statistical summaries z scatterplots z regression (a least squares regression
line) z correlation
to analyse and make meaningful comments on the context associated with given bivariate data, including interpolation, extrapolation and discussions on skewness.
WHAT THE NSC DIAGNOSTIC REPORTS TELL US
According to NSC Diagnostic Reports there are a number of issues pertaining to Analytical Geometry.
These include:
z inability to draw an accurate least squares regression line z candidates being confused between a line of best fit and a least squares regression line z many candidates having no idea of the concept of correlation, how to calculate the correla-
tion coefficient or comment on it z inability to complete a cumulative frequency table.
It is important that you keep these issues in mind when teaching this section.
When teaching statistics ensure that learners understand the terms required in this section. For example, the difference between trend and correlation. Learners should also be exposed to real life scenarios and given opportunities to answer many different types of questions (particu-larly of an interpretive nature) to improve their performance.
B

54 Grade 12 MATHEMATICS Term 3
TOPIC 2 STATISTICS
ASSESSMENT OF THE TOPIC
z CAPS formal assessment requirements for Term 3:• Test• Preliminary examination
z A test, with memorandum, is provided in the Resource Pack. The test is aligned to CAPS in every respect, including the four cognitive levels as required by CAPS (page 53).
z The questions usually take the form of being given a set of data, finding measures of central tendency and dispersion and finding trends.
z Monitor each learner’s progress to assess (informally) their grasp of the concepts. This information can form the basis of feedback to the learners and will provide you valuable information regarding support and interventions required.
MATHEMATICAL VOCABULARy
Be sure to teach the following vocabulary at the appropriate place in the topic:
Term Explanation
data Facts or information collected from people or objects. Data is plural for datum
population The entire group of people or objects that data is collected from
sample A smaller part of the population - studied if the population is large
random How to choose a smaller sample of the population to attempt to not be biased.
questionnaire Set of questions with a choice of answers used in the data collection process
survey The collecting of data from a group of people
discrete data Data that can only take certain values. For example, the number of learners in a class (there can’t be half a learner)
D
E

55Grade 12 MATHEMATICS Term 3
TOPIC 2 STATISTICS
continuous data Data that can take on any value within a certain range. For example, the heights of a group of learners (heights could be measured in decimals)
tally A way of keeping count by drawing marks. Every fifth mark is drawn across the previous four (to form a gate-like diagram) so you can easily see groups of five
frequency tables
A table that lists a set of scores and their frequency. Often used with tallies. It summarises the totals and shows how often something has occurred
ogive A cumulative frequency graph. Can be used to determine how many data values lie above or below a certain value in a data set
measures of central tendency
A measure of central tendency is a single value that describes the way in which a group of data cluster around a central value. There are three measures of central tendency: the mean, the median and the mode
mean The average of a set of numbers. Calculated by adding all the values then dividing by how many numbers there are
median The middle number in a sorted list of numbers. To find the median, place all numbers in order from smallest to biggest and find the middle number (or the mean of the two middle numbers if the data set contains an even number of values)
mode The number that appears the most often in a set of data. There can be two or more modes. There could also be no mode in a set of data
modal class The class with the highest frequency from a set of grouped data. In other words, the interval with the most “members”
measures of dispersion
Measures of dispersion like the range, percentiles and quartiles tell you about the spread of scores in a data set
range Like central tendency, they help you summarise a set of data with one or just a few numbers
percentiles The difference between the highest and lowest value in a set of data

56 Grade 12 MATHEMATICS Term 3
TOPIC 2 STATISTICS
quartiles Each of four equal groups into which a population can be divided according to the distribution of values of a variableThe values that divide a list of numbers into quarters Quartiles divide a rank-ordered data set into four equal parts. The values that divide each part are called the first, second, and third quartiles; and they are denoted by Q1, Q2, and Q3, respectively
interquartile range
The interquartile range (IQR) is a measure of variability, based on dividing a data set into quartiles
histogram A graph representing data that is grouped into ranges and each bar represents data that follows on from the previous bar Example, one bar could represent how many learners got a mark from 40-49 and the bar immediately next to it would represent 50-59
scatter plots A graph in which the values of two variables are plotted along two axes. The pattern of the resulting points reveals whether there is any correlation between the two sets of values
outliers Values that are significantly higher or lower than all the other values in the data set. They are also called extremesOutliers can affect the mean of the data and are sometimes excluded when calculations are done
skewed data A measure of the asymmetry of the distribution If the data is represented visually, the curve will be distorted
estimated mean An estimate of the mean can be determined for grouped data. Unlike listed data, the individual values for grouped data are not available, and you are not able to calculate their sum To calculate the mean of grouped data, the first step is to determine the midpoint of each interval, or class. These midpoints must then be multiplied by the frequencies of the corresponding classes The sum of the products divided by the total number of values will be the value of the estimated mean
variance A measure of the spread of a data set It is the average of the squared differences from the mean
standard deviation
A quantity expressing by how much the members of a group differ from the mean value for the groupStandard deviation is the square root of the variance

57Grade 12 MATHEMATICS Term 3
TOPIC 2 STATISTICS
ungrouped data Ungrouped data has not been classified or has not been subdivided in the form of groups. This type of data is totally the raw data. Ungrouped data is in the form of a list of numbers
grouped data Data that has been ordered and sorted into groups called classes Data that has been bundled together in categoriesHistograms and frequency tables can be used to show this type of data
five number summary
Lowest value, lower quartile, median, upper quartile and highest value from a set of dataThe five numbers are used to draw a box and whisker plot
box and whisker plot
A simple way of representing statistical data on a plot in which a rectangle is drawn to represent the second and third quartiles, usually with a vertical line inside to indicate the median value The lower and upper quartiles are shown as vertical lines either side of the rectangle The lowest value and highest value in the data set are represented at each end
line of best fit A straight line drawn through the centre of a group of data points plotted on a scatter plot It is drawn intuitively
least squares regression line
‘Least squares’ is a statistical method used to determine an equation for a line of best fit by minimising the sum of squares created by a mathematical function A “square” is determined by squaring the distance between a data point and the regression line
correlation coefficient
A statistical measure of the linear relationship (correlation) between a dependent and independent variable It is represented as r and its value varies from 1 to -1

TOPIC 2, LESSON 1: REVISION OF GRADE 10 & 11
58 Grade 12 MATHEMATICS Term 3
TERM 3, TOPIC 2, LESSON 1
REVISION OF GRADE 10 & 11Suggested lesson duration: 2.ty5 hours
TOPIC 2, LESSON 1: REVISION OF GRADE 10 & 11
A POLICy AND OUTCOMES
CAPS Page Number 48
Lesson ObjectivesBy the end of the lesson, learners should be able to:
z variance and standard deviation z skewed data z estimated mean z ogives.
CLASSROOM MANAGEMENT
1. Make sure that you are ready and prepared.
2. Advance preparation: Work through the lesson plan and exercises.
3. Write the lesson heading on the board before learners arrive.
4. You will need Resources 1, 2 and 3 from the Resource Pack.
5. Write work on the chalkboard before the learners arrive. For this lesson if it was not possible to make a copy of the diagrammatic representation of the five dogs from the Resource Pack, draw a simple sketch.
6. If there aren’t enough questions covering all the concepts done in the lesson, either add the revision exercise from the end of a Grade 11 textbook or add items from a Grade 11 test on Statistics.
LEARNER PRACTICE
MIND ACTION SERIES
PLATINUM VIA AFRIKA
CLEVER CLASSROOM MATHS
EVERYTHING MATHS
(SIYAVULA)
EX PG EX PG EX PG EX PG EX PG EX PG
Rev 288 1 230 Qu’s 1
262268
12.1 323 12.1 322 9.1 370
B

59Grade 12 MATHEMATICS Term 3
TOPIC 2, LESSON 1: REVISION OF GRADE 10 & 11
CCONCEPTUAL DEVELOPMENT
INTRODUCTION
1. It is important to revise the concepts covered previously. If any concepts need to be taught again, do that now. At least 50% of the Data Handling in the final examination is on Grade 10 and 11 work.
2. The example to aid the explanation of standard deviation is the same one that is used when it is first encountered in Grade 11. It is a simple explanation with a good example that learners tend to understand easily.
3. Note that when calculator work is discussed, the Casio (80+ range) has been used. The diagnostic reports recommend using one brand on a regular basis so that learners get used to the operation procedures. If more learners in your class have a brand other than the one being used, ensure they are confident using their own calculator.
DIRECT INSTRUCTION
1. Start the lesson by telling learners that several concepts need to be revised and you are going to go through each one before doing some fully worked examples with them. Tell them that they should take notes when you are explaining, giving definitions or doing diagrams on the board.
2. Say: We are going to start by recapping standard deviation, why we use it and how we find it.
3. Tell learners: Deviation means ‘how far from the normal’. The standard deviation is a measure of how spread out the data is. The symbol used is σ which is the Greek letter, sigma (write the symbol on the board).
4. We need the variance to find standard deviation. Ask: What is variance? (Variance is the average of the squared differences from the mean).
Learners should write down this definition even though it may mean little at this point. It will be referred to again later.
5. The following example, using the height of five dogs, is used to explain both variance and standard deviation. Tell learners what it is we are finding out about the data provided when we find standard deviation – we are finding what the norm is and which data lies within the norm and which data lies outside the norm. The heights of five dogs are found and recorded: 600mm; 470mm; 170mm; 430mm and 300m.

60 Grade 12 MATHEMATICS Term 3
TOPIC 2, LESSON 1: REVISION OF GRADE 10 & 11
This diagram is available in the Resource Pack. There is no need to draw it in detail on the board. You need to draw certain lines as you explain. If it can’t be copied, draw a very basic representation of it. In addition, write the five heights clearly on the board.
600
400
200
0
Steps to follow:
z Find the mean of the heights
z Find the difference between each dog’s height and the mean (some answers will be negative)
z Square the differences
z Find the average of the squared differences
z Find the square root of the answer.
Write these steps on the board. Tell learners not to write them down yet as some steps need more explanation. Learners should write down the steps as you complete the example. Learners should also make their own notes.
Height Mean Difference Diff squared Mean of squares600mm
5
1970
= 394mm
206 42 436
5
108 520
= 21 704
470mm 76 5 776170mm -224 50 176430mm 36 1 296300mm -94 8 836Draw a horizontal line on the diagram to represent the mean measurement.
Once the differences have been found: Ask: Why do you think we need to square these numbers before we can find the mean of them?(if we found the mean of a set of positive and negative integers it would not represent the data as the answer could even be quite close to zero).

61Grade 12 MATHEMATICS Term 3
TOPIC 2, LESSON 1: REVISION OF GRADE 10 & 11
6. Remind learners that what we have found (21 704) is the variance. Refer learners back to the definition they wrote down earlier – variance is the mean of the squared differences. Point out that this very large number could not tell us anything about how far each dog’s height might be from the mean.
7. Ask: Why do you think we find the square root of this number to find standard deviation? (To ‘undo/reverse’ the squaring that was done to alleviate the problem of the negative integers)
, ...21704 147 322=
The standard deviation is 147mm (rounded to the nearest whole).
8. Add 147mm to the mean (394 + 147 = 541) and subtract 147mm from the mean (394 -147 = 247) Draw a horizontal line at these two measurements. Shade the ‘bar’ created.
147
600
400
200
0
147
9. Say: The shaded bar represents the heights within one standard deviation from the mean. Repeat the statement and ensure learners write it down. This tells us that after taking all the data into account, we can see which dogs fall within one standard deviation of the mean and which dogs are considered ‘outside the norm’ and are either very tall or very short.
10. Spend time showing that we could make a wider bar if we added the standard deviation again to the top of the bar (541) and subtracted it from the bottom of the bar (247) to get 688 and 100 respectively. If we drew in the horizontal lines, we would now be seeing which dogs lay within TWO standard deviations of the mean.
11. Explain further by discussing what is considered to be the norm in a set of data:
z 66% should lie within one standard deviation from the mean
z 95% should lie within two standard deviations from the mean
z 99,7% should lie within three standard deviations from the mean.

62 Grade 12 MATHEMATICS Term 3
TOPIC 2, LESSON 1: REVISION OF GRADE 10 & 11
Point out, however, that this is only likely to be true if the set of data is large. The above example does not have sufficient data to draw any realistic conclusions. Learners may benefit from seeing this information visually and taking it down in their Books:
68% of data95% of data
99,7% of data
0-1-2-3 1 2 3
12. Remind learners how to find standard deviation on the calculator.
‘what you should see’ is for your benefit but if it is possible to share this with learners, do so. Alternately you can just tell them what they expect to see at each step.
Steps to follow What you should see (dog heights used)
MODE, choose STAT (2)
Choose 1-VAR (1)
Enter data, pressing = after each number
Press: AC; SHIFT, STAT (1)

63Grade 12 MATHEMATICS Term 3
TOPIC 2, LESSON 1: REVISION OF GRADE 10 & 11
Choose Var (4)
Choose σx (3)
Press equal
13. Write the steps on the board, then ask learners to put in the five dog heights and confirm they get 147,322…
14. Remind learners that they should only use the long method if specifically asked. If this does occur, which is very rare, there is usually a table (similar to the one completed in point 5) to complete.
If variance is required in a question, learners will find the standard deviation then square it.
15. Ask if anyone has any questions before moving on to the next concept.
16. Tell learners: We are going to look at skewed data. Learners should write the heading in their books. Remind learners to take notes as you explain, define or draw diagrams.
17. In general, data is skewed if there are outliers – data that is not part of the norm according to the rest of the data. Outliers are values that are significantly higher or lower than the rest of the data.
18. If a histogram is drawn of a set of data and looks like this:

64 Grade 12 MATHEMATICS Term 3
TOPIC 2, LESSON 1: REVISION OF GRADE 10 & 11
Freq
uenc
y
variable 1
6
5
4
3
2
1
00.00 2.00 4.00 6.00 8.00 10.00 12.00
The data represented here is said to be normally distributed. The mean and median will be equal (if the data is perfectly distributed), or very close to each other.
19. Write the following summary on the board for learners to write in their exercise books, discussing each aspect as you write it:
Skewed data Teaching notes
Negatively skewed (mean subtract median is negative)
Positively skewed(mean subtract median is positive)
If the mean and median are known and there is no visual representation of the data, this method can be used to fi nd in which direction the data is skewed
mean < median < modeMean will be to the left of the median
mode < median < meanMean will be to the right of the median
If a histogram or distribution curve is given (remind learners that the curve is a representation of the histogram), the ‘tail’ will show in which direction the data is skewed.
(Longer tail on left = skewed to left)
(Longer tail on right = skewed to the right)

65Grade 12 MATHEMATICS Term 3
TOPIC 2, LESSON 1: REVISION OF GRADE 10 & 11
In a box and whisker plot, the longer box will show in which direction the data is skewed. Tell learners to shade the longer part of the box and write ‘skewed left’ and ‘skewed right’ in the appropriate box and whisker plot.
Skewed to the left – the data is more spread out on the left
Skewed to the right – the data is more spread out on the right.
20. Finish the discussion on skewed data by pointing out that the mean is susceptible to the influence of outliers and is not always a good representation of the data. Both the mean and median are good representations of the data if the sample is normally distributed. If the data is skewed, the mean tends to be ‘dragged’ in the direction of the skewness – in this case the median would be a better measure of central tendency. The more skewed the data, the greater the difference between the mean and the median.
21. Ask if anyone has any questions before moving on to the next concept.
22. Ask: What is the difference between ungrouped and grouped data? (Ungrouped data: raw data that has not been classified. A list of numbers. Grouped data: data that has been sorted into groups (classes)).
23. Ask: How do we find the mean of ungrouped data? (Add all the values and divide by the number of values). Ask: Why can’t we use the same method to find the mean of grouped data? (We don’t know each value – only how many there are in a certain class interval).
24. Remind learners how to find the mean of grouped data by working through this following example:
Num
ber o
f stu
dent
s 76543210
61-65 66-70 71-75 76-80 81-85 86-90 91-95 96-100

66 Grade 12 MATHEMATICS Term 3
TOPIC 2, LESSON 1: REVISION OF GRADE 10 & 11
Say: We need to represent the information in the histogram in a table to assist us. Write the following headings on the board:
Class Interval(percentage)
Frequency Midpoint of class interval
Midpoint × frequency
Discuss what each heading means: z Class interval: The size of each class into which a range of a variable is divided. In this
case, 61 – 65, 66 – 70 etc. Intervals are also often written as inequalities. In this case, 61 ≤ x ≤ 65 could have been used.
z Frequency: How many sets of data lie in each interval.
z Midpoint of class interval: The middle value of the class interval
z Midpoint × frequency: calculating the total if each number in the class interval is the midpoint.
Tell learners to complete the table.
Class Interval(percentage)
Frequency Midpoint of class interval
Midpoint × frequency
61 – 65 1 63 63
66 – 70 0 68 0
71 – 75 2 73 146
76 – 80 3 78 234
81 – 85 6 83 498
86 – 90 1 88 88
91 – 95 6 93 558
96 - 100 3 98 294
25. Ask: Why do we find the midpoint of each interval? We don’t know the actual data, but we have a reasonable idea of the results so we use the midpoint of each interval. Essentially, we are assuming that each learner achieved a result of the midpoint of the class intervals.
26. Finally, we add the totals and divide by 22 (the number of learners) to find estimated mean.
.22
188185 5=
27. Remind learners to always look at their answer and ask themselves if it looks reasonable. In other words, does it lie in the range of data (61 – 100)?

67Grade 12 MATHEMATICS Term 3
TOPIC 2, LESSON 1: REVISION OF GRADE 10 & 11
28. Say: None of the measures of central tendency should lie outside the data range. Let’s have a look at how the other measures of central tendency could be asked with grouped data.
29. Ask: Which range of marks (class interval) was the most common? (81 – 85 and 91 – 95 both had six learners in them).
30. Ask: What measure of central tendency is being discussed? (The mode). Point out that as we don’t know the exact values we can’t give a mode, so instead we talk about a modal class – the class with the most data in it. This data has two modal classes: 81 – 85 and 91 – 95.
31. Ask: How can we find where the median value will lie? (We would need to know the total number of learners represented and find where the middle value would be).
32. There are 22 learners in total represented here. The median position would therefore be between 11 and 12. Ask: Which class interval would the median be in? (81 – 85).
If necessary, count through each class interval, accumulating totals as you go, with learners to show how to find where position 11/12 would be.(1 + 0 = 1; 1 + 2 = 3; 3 + 3 = 6; 6 + 6 = 12)
33. Ask if there are any questions before you move onto the final concept to be revised.
34. Ask: What is an ogive? (A cumulative frequency curve used to represent the accumulated amount of data).
Use an example if learners find this difficult and have forgotten the concept:If a school is raising funds and wants to put up a board for people to know how much has been collected, an ogive would be an excellent way to represent it. The total so far is the accumulated amount as each week’s (it doesn’t have to be a week) total is added to the total from the week before and so on.It would not be as impressive, for instance, to show it in a bar graph where each week showed its own total – some weeks may look bad when little was raised and people would also not know the total so far unless they added it themselves.
35. Remind learners that, due to the totals being accumulated, an ogive CAN NEVER GO DOWN. If zero is added to a previous total it will remain the same and the graph would be flat for that interval.
36. Say: Remember that an ogive should always form an S-like shape.
37. Use the following example to explain further: The following table represents the mathematics results of 155 learners.

68 Grade 12 MATHEMATICS Term 3
TOPIC 2, LESSON 1: REVISION OF GRADE 10 & 11
Marks Frequency
15 – 20 2
20 - 25 5
25 - 30 8
30 - 35 10
35 - 40 13
40 - 45 17
45 - 50 20
50 - 55 16
55 - 60 12
60 - 65 15
65 - 70 17
70 - 75 20
Ask learners to write the table in their books. They should add a third and fourth column on the right as shown.
38. Say: Label the third column ‘cumulative frequency’ – this is where we are going to accumulate the number of learners as we go. What are we expecting the total number of learners to be when we get to the end? (155) Ask learners to add for you as you fill it in on your table on the board. 2 ; 2 + 5 = 7 ; 7 + 8 = 15 etc.
Marks Frequency Cumulative frequency
15 – 20 2 2
20 - 25 5 7
25 - 30 8 15
30 - 35 10 25
35 - 40 13 38
40 - 45 17 55
45 - 50 20 75
50 - 55 16 91

69Grade 12 MATHEMATICS Term 3
TOPIC 2, LESSON 1: REVISION OF GRADE 10 & 11
55 - 60 12 103
60 - 65 15 118
65 - 70 17 135
70 - 75 20 155
39. The fourth column is for the co-ordinates. Before filling in the co-ordinates with learners remind them of the following:
z An important feature of an ogive is that it shows the total number of observations in a data set that are less than or equal to the UPPER boundary (think of ‘up to’).
z The lower boundary of the first interval is used for the first co-ordinate. Thereafter, only upper boundaries are used.
z Co-ordinates are made up of: (upper boundary; cumulative frequency)
40. Complete the table with learners: Recommend that they write the first co-ordinate above the others. It will be (15;0). This represents that zero learners got less than 15% - this will be the starting point of the ogive on the horizontal axis. The ogive is ‘grounded’ to show that there are no values lower than the lower boundary of the first class interval.
Marks Frequency Cumulative frequency
Co-ordinates(15;0)
15 – 20 2 2 (20;2)
20 - 25 5 7 (25;7)
25 - 30 8 15 (30;15)
30 - 35 10 25 (35;25)
35 - 40 13 38 (40;38)
40 - 45 17 55 (45;55)
45 - 50 20 75 (50;75)
50 - 55 16 91 (55;91)
55 - 60 12 103 (60;103)
60 - 65 15 118 (65;118)
65 - 70 17 135 (70;135)
70 - 75 20 155 (75;155)

70 Grade 12 MATHEMATICS Term 3
TOPIC 2, LESSON 1: REVISION OF GRADE 10 & 11
41. Point out what some points represent: (50;75) means that 75 learners got less than 50. (65;118) means that 118 learners got less than 65.
42. Draw the ogive on the board. Remind learners:
z to label the graph so it is clear what data is represented
z the vertical axis will always represent the cumulative frequency and should be marked as such
z draw the ogive freehand –it is a curved graph.
180
160
140
120
100
80
60
40
20
5 10 15 20 25 30 35 40 45 50 55 60 65 70 750
Marks
Cum
ulat
ive
freq
uenc
y
20
7
15
25
38
55
75
91
103
118
135
155
43. Say: Let us use the ogive to estimate some measures of dispersion. To find the estimated median:
z Find the middle number in the total value (77,5 – the decimal will not be important – remember that it is an estimate)
z Mark this number on the vertical axis and draw a horizontal line to the ogive
z From this point, draw a vertical line down to the horizontal axis
z The reading will give the estimated median.

71Grade 12 MATHEMATICS Term 3
TOPIC 2, LESSON 1: REVISION OF GRADE 10 & 11
Cu
mu
lative
Fre
qu
en
cy
Marks
180
160
140
120
100
80
60
40
20
0 5 10 15 20 25 30 35 40 45 50 55 60 65 70 75
27
0
15
25
38
55
75
91
103
118
135
155
The estimated mean is 51% or 52%
44. To find the lower quartile:
i. Find a quarter of the total value (38,75 – the decimal will not be important – remember that it is an estimate).
ii. Mark this number on the vertical axis and draw a horizontal line to the ogive.
iii. From this point, draw a vertical line down to the horizontal axis.
iv. The reading will give the estimated lower quartile.
The estimated lower quartile is 40%.
45. Learners could be asked to read information from the graph given information on the horizontal axis. Example, estimate how many learners got 60% or more:
z Find 60 on the horizontal axis and draw a vertical line to the ogive.
z Draw a horizontal line to the cumulative frequency (vertical axis).
z However, keep in mind that the question said 60 or more (the reading would be the answer if the question had been 60 or less).
z Use the reading to subtract from the total number of learners (155).
The number of learners who achieved more than 60% is 52 (155 – 103).
46. Ask if anyone has any questions before you do some fully worked examples on the board.
47. Do three fully worked examples from previous Grade 12 exams. Learners should write the examples in their exercise books.

72 Grade 12 MATHEMATICS Term 3
TOPIC 2, LESSON 1: REVISION OF GRADE 10 & 11
The ogive for the example below is available in the resource book. It has been enlarged for your convenience.
Example 1
The amount of money, in Rands, that learners spent at tuck shop on a specific day was recorded. The data is represented in the ogive below.
Money spent (R)
Cum
ula
tive f
requency
Ogive
(10, 0)
(20, 12)
(30, 25)
(40, 45)
(50, 61)
(60, 65)
70
60
50
40
30
20
10
0
0 10 20 30 40 50 60 70
An incomplete frequency table is also given for the data:
Amount of money (in R) 10 ≤ x < 20 20 ≤ x < 30 30 ≤ x < 40 40 ≤ x < 50 50 ≤ x < 60
Frequency a 13 20 b 4
a) How many learners visited the tuck shop on that day?b) Write down the modal class of this data.c) Determine the values of a and b in the frequency table.d) Use the ogive to estimate the number of learners that spent at least R45 on the day
the data was recorded at the tuck shop.MAR 2017
Solutions: Teaching notes
a) 65 learners This is the total represented in the last co-ordinate.
b) 30 ≤ x < 40 This can usually be seen by the part of the curve (from one co-ordinate to the next) that increases the most quickly. It is safer however, to look at each of the y-co-ordinates and calculate which interval has the most data.

73Grade 12 MATHEMATICS Term 3
TOPIC 2, LESSON 1: REVISION OF GRADE 10 & 11
c) a = 12 b = 61 - 45 = 16
The value of a can be easily read from the co-ordinate (20;12) as no values have been accumulated yet.The value of b requires a subtraction calculation: subtract the accumulated amount at the end of the previous interval from accumulated amount at the end of that interval.
d) 10 or 11
Example 2
The box and whisker diagram below shows the marks (out of 80) obtained in a History test by a class of 9 learners.
20 30 40 50 60 70 8032 62
75
a) Comment on the skewness of the data.b) Write down the range of the marks obtained.c) If the learners had to obtain a mark of 32 to pass the test, estimate the percentage of
the class that failed the test.d) In ascending order, the second mark is 28, the third mark 36 and the sixth mark 69.
The seventh and eight marks are the same. The average for the test is 54.
28 36 69
Fill in the marks of the remaining learners in ascending order.MAR 2016
Solutions: Teaching notes
a) The data is skewed to the left The data is clearly more spread out on the left-hand side looking at the box.
b) 60 Largest value – smallest value (80-20)
c) 25% of the learners failed 32% is marked as the lower quartile. Therefore, the quarter of learners in the first quartile must have all failed.

74 Grade 12 MATHEMATICS Term 3
TOPIC 2, LESSON 1: REVISION OF GRADE 10 & 11
d) x54
9
445=
+
486 = 445+x 41 = x
20 28 36 41 62 69 75 75 80
Tell learners to fill in the lowest and highest values – they are easily read from box and whisker plot.75 is also a mark clearly shown on the plot and as it lies between 69 and 80 it must be the both the 7th and 8th value as they were given as equal.62 is also a mark clearly shown on the plot but until the final value is found we can’t know exactly which of the final two places it will go.If the 8 values we know are totaled, we know that total plus the one unknown will give an average of 54.
Example 3
A company recorded the number of messages sent by e-mail over a period of 60 working days. The data is shown in the table below:
NUMBER OF MESSAGES NUMBER OF DAYS
10 < x ≤ 20 2
20 < x ≤ 30 8
30 < x ≤ 40 5
40 < x ≤ 50 10
50 < x ≤ 60 12
60 < x ≤ 70 18
70 < x ≤ 80 3
80 < x ≤ 90 2
a) Estimate the mean number of messages sent per day, rounded to two decimal places.b) Draw a cumulative frequency graph (ogive) of the data on the grid.c) Hence, estimate the number of days on which 65 or more messages were sent.
MAR 2016

75Grade 12 MATHEMATICS Term 3
TOPIC 2, LESSON 1: REVISION OF GRADE 10 & 11
Solutions: Teaching notes
a) 33,603080
51=Ask: How do we find an estimated mean? (Find the midpoint of the interval, multiply it by the frequency, total the frequencies and divide by 60).
b)
OGIVE / OGIEF70
65
60
55
50
45
40
35
30
25
20
15
10
5
0
0 10 20 30 40 50 60 70 80 90 100
Number of messages/Getal boodskappe
Cum
ulat
ive
freq
uenc
y/K
umul
atie
we
frek
wen
sie
Remind learners: z To first make a cumulative
frequency column. z To ‘ground’ the ogive. The
first co-ordinate is always the lower part of the lowest boundary and 0. In this case (10;0).
z All the other co-ordinates are made up of the upper part of each boundary with the corresponding cumulative frequency.
z Join the points freehand – it should be a curve.
c) 60 – 48 = 12 days Find 65 on the horizontal axis representing the number of messages. Read off the corresponding number on the vertical axis (cumulative frequency). Subtract this reading from the total as it said ‘or more’.
48. Ask directed questions so that you can ascertain learners’ level of understanding. Ask learners if they have any questions.
49. Give learners an exercise to complete with a partner.
50. Walk around the classroom as learners do the exercise. Support learners where necessary.

76 Grade 12 MATHEMATICS Term 3
TOPIC 2, LESSON 1: REVISION OF GRADE 10 & 11
ADDITIONAL ACTIVITIES/ READING
Further reading, listening or viewing activities related to this topic are available on the following web links:
https://www.youtube.com/watch?v=sBK_oE8KDx8
(Drawing an ogive)
https://www.youtube.com/watch?v=n5rhuZDbYCM
(Determining skewness in ogive curves)
https://www.youtube.com/watch?v=XSSRrVMOqlQ
(What is skewness)
https://www.youtube.com/watch?v=mwT3ykS8r08
(Skewed data and outliers)
https://www.youtube.com/watch?v=WVx3MYd-Q9w
(Calculating standard deviation)
https://www.youtube.com/watch?v=qqOyy_NjflU
(How to calculate variance and standard deviation)
https://www.youtube.com/watch?v=KwpcKCX51ro
https://www.youtube.com/watch?v=kJrhyb6aG3A
(Estimated mean)
D

TOPIC 2, LESSON 2: SCATTER PLOTS, LEAST SQUARES REGRESSION LINE, CORRELATION COEFFICIENT
77Grade 12 MATHEMATICS Term 3
TERM 3, TOPIC 2, LESSON 2
SCATTER PLOTS, LEAST SQUARES REGRESSION LINE, CORRELATION COEFFICIENT
Suggested lesson duration: 4 hours
TOPIC 2, LESSON 2: SCATTER PLOTS, LEAST SQUARES REGRESSION LINE, CORRELATION COEFFICIENT
APOLICy AND OUTCOMES
CAPS Page Number 48
Lesson ObjectivesBy the end of the lesson, learners should be able to:
z draw a scatterplot and read information from a scatterplot z find the least squares regression line z use the least squares regression line to interpolate and extrapolate z find the correlation coefficient z comment on the strength of the correlation coefficient.
CLASSROOM MANAGEMENT
1. Make sure that you are ready and prepared.
2. Advance preparation: Work through the lesson plan and exercises.
3. You will need Resources 4, 5 and 6 from the Resource Pack.
4. Write the lesson heading on the board before learners arrive.
5. Write work on the chalkboard before the learners arrive. For this lesson draw the scatterplot (point 1) on the board.
6. The table below provides references to this topic in Grade 12 textbooks. Plan when you will get learners to practice the concepts learned by completing the exercises. Work through the lesson plan and decide where you will get learners to do the exercises. Indicate this on your lesson plans.
B

78 Grade 12 MATHEMATICS Term 3
TOPIC 2, LESSON 2: SCATTER PLOTS, LEAST SQUARES REGRESSION LINE, CORRELATION COEFFICIENT
C
LEARNER PRACTICE
MIND ACTION SERIES
PLATINUM VIA AFRIKA
CLEVER CLASSROOM MATHS
EVERYTHING MATHS
(SIYAVULA)
EX PG EX PG EX PG EX PG EX PG EX PG
1 295 2 237 2 275 12.212.3
328335
12.212.312.412.5
327332338345
9.29.39.4
377384391
CONCEPTUAL DEVELOPMENT
INTRODUCTION
1. Learners first encountered scatterplots in Grade 9 where they may have already drawn in a line of best fit.
2. Ensure the difference between a line of best fit and a least squares regression line is clear when discussed later in the lesson.
DIRECT INSTRUCTION
1. Ask: What is a scatterplot and what is a scatterplot used for? (A graph in which the values of two variables are plotted along two axes. The main reason for representing the information on a scatterplot is to find if there is a connection (correlation) between the two sets of data. The pattern of the resulting points reveals this).

79Grade 12 MATHEMATICS Term 3
TOPIC 2, LESSON 2: SCATTER PLOTS, LEAST SQUARES REGRESSION LINE, CORRELATION COEFFICIENT
Scie
nce
92
88
84
80
76
72
68
64
60
56
52
48
44
Maths
44 48 52 56 60 64 68 72 76 80 84 88 920
2. Use the scatterplot above to discuss the following points with learners:
z This scatterplot shows the marks of a class of learners for mathematics and science.
z Each point represents one learner. His/her mark is read off as a co-ordinate.
z The two lowest marks represented here are 44% for mathematics and 52% for science and 44% for mathematics and 56% for Science
z The two highest marks represented here are 82% for mathematics and 86% for science and 86% for mathematics and 84% for science.
z The fact that the points are packed closely together shows that there is a strong correla-tion (the degree of correlation). In other words, there is strong relationship between the mathematics marks and the science marks achieved by individual learners.
z The cluster of points all forming an increasing pattern. This indicates a positive correla-tion (the type of correlation). You could say that the higher your mathematics mark, the higher your science mark is likely to be or the lower your mathematics mark, the lower your science mark is likely to be.
z If the pattern had been clustered together but decreasing, the correlation would still have been strong, but it would be a negative correlation. You could say the higher the mathematics mark, the lower the science mark or the lower the mathematics mark, the higher the science mark.
3. Ask learners if they have any questions.
4. Tell learners to write the heading Scatterplots and copy the diagram into their exercise books. It needn’t be entirely accurate. Learners should write the definition of a scatterplot and its use.
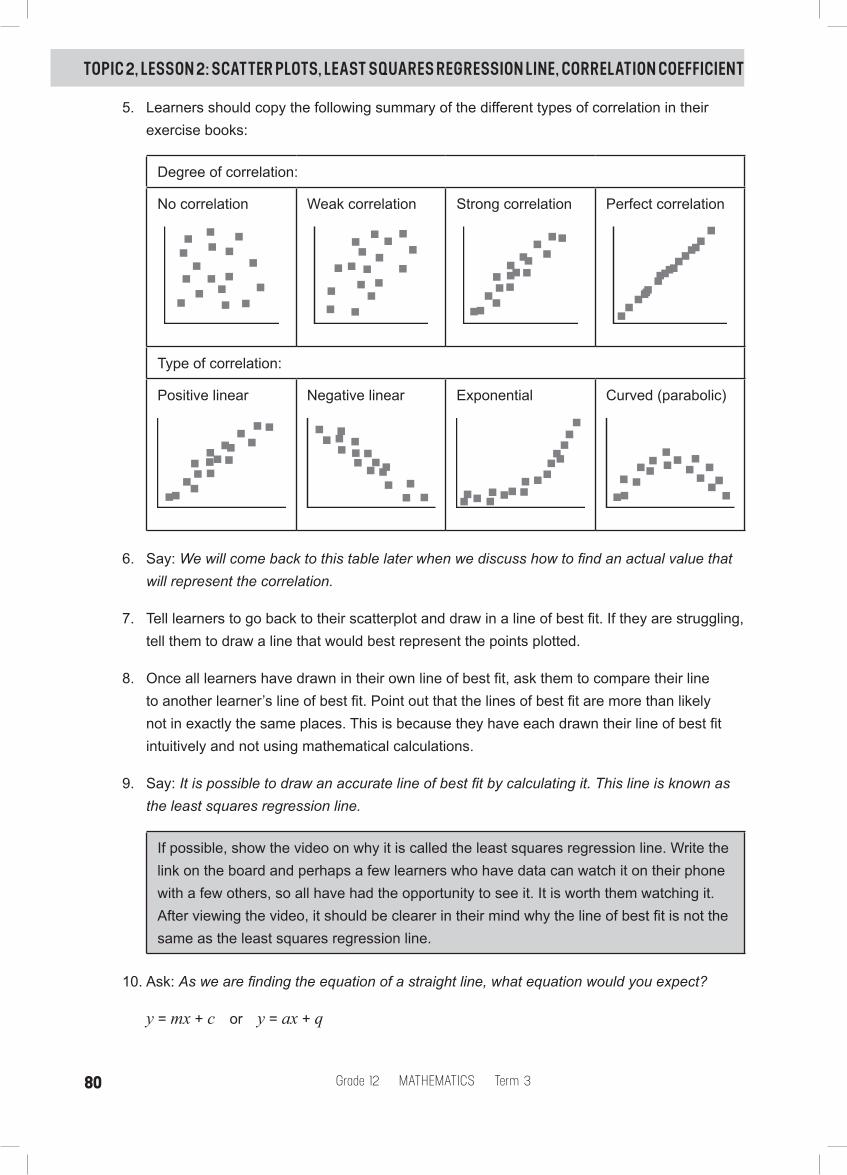
80 Grade 12 MATHEMATICS Term 3
TOPIC 2, LESSON 2: SCATTER PLOTS, LEAST SQUARES REGRESSION LINE, CORRELATION COEFFICIENT
5. Learners should copy the following summary of the different types of correlation in their exercise books:
Degree of correlation:
No correlation Weak correlation Strong correlation Perfect correlation
Type of correlation:
Positive linear Negative linear Exponential Curved (parabolic)
6. Say: We will come back to this table later when we discuss how to find an actual value that will represent the correlation.
7. Tell learners to go back to their scatterplot and draw in a line of best fit. If they are struggling, tell them to draw a line that would best represent the points plotted.
8. Once all learners have drawn in their own line of best fit, ask them to compare their line to another learner’s line of best fit. Point out that the lines of best fit are more than likely not in exactly the same places. This is because they have each drawn their line of best fit intuitively and not using mathematical calculations.
9. Say: It is possible to draw an accurate line of best fit by calculating it. This line is known as the least squares regression line.
If possible, show the video on why it is called the least squares regression line. Write the link on the board and perhaps a few learners who have data can watch it on their phone with a few others, so all have had the opportunity to see it. It is worth them watching it. After viewing the video, it should be clearer in their mind why the line of best fit is not the same as the least squares regression line.
10. Ask: As we are finding the equation of a straight line, what equation would you expect?
y = mx + c or y = ax + q

81Grade 12 MATHEMATICS Term 3
TOPIC 2, LESSON 2: SCATTER PLOTS, LEAST SQUARES REGRESSION LINE, CORRELATION COEFFICIENT
Tell learners that, as they know, different variables can be used to represent the gradient and the y-intercept. On the calculator, in this section, A is used for the y-intercept and B is used for the gradient.
Point out that they must not be put off by the calculator also using A + Bx which is not the way they are familiar with.
11. Write the steps to finding the equation of the line on their calculator on the board. Learners should copy the steps in their exercise books. Tell learners that they will practise the steps by doing a few examples then they can add notes to the steps that may assist them.
‘What you should see’ is for your benefit. If possible share this with learners. Alternatively, you can tell learners what they expect to see at each step.
Steps to follow What you should see
1 MODE, choose STAT (2)
2 Choose A+BX (2)
3 Enter data, pressing = after each number in each column
4 Press: AC; SHIFT, STAT (1)
5 Choose Reg (5)
At this point, share this information with learners:A,B and r are all important. For finding the equation of the least squares regression line, A and B are relevant now.

82 Grade 12 MATHEMATICS Term 3
TOPIC 2, LESSON 2: SCATTER PLOTS, LEAST SQUARES REGRESSION LINE, CORRELATION COEFFICIENT
6 Choose A (1) and press =
7 Repeat steps 4 and 5
8 Choose B (2) and press =
12. Before drawing the lines, ensure that everyone is confident in the calculator work to find the equation of the least squares regression line.
13. Use the following sets of data, for learners to practice and gain confidence:
Set 1 Set 2 Set 3
x y x y x y
56 11 122 32 0,2 8
62 14 130 35 0,45 5
58 13 118 51 0,6 6
61 10 131 36 0,21 5
74 15 121 48 0,32 7
55 12 127 40 0,56 8
14 The equations are:
Set 1: y = 1,571 + 0,179x
Set 2: y = 160,521 - 0,963x
Set 3: y = 6,474 + 0,067x
Give learners time to practice. Write the data on the board and walk around to assist where necessary. Tell learners they need to practice until the process on the calculator becomes quite easy.

83Grade 12 MATHEMATICS Term 3
TOPIC 2, LESSON 2: SCATTER PLOTS, LEAST SQUARES REGRESSION LINE, CORRELATION COEFFICIENT
15. Say: We need to ensure that we draw the line accurately. The y-intercept is usually the easiest point to plot, but the other point will be the average of each set of values. That can also be found on the calculator. The steps are as follows and can be used from the screen with both sets of data entered:
Press: AC; SHIFT, STAT (1)Choose Var (4)
Choose x (2)Read as x bar – this is the mean of all the x-values.Press =
Press: AC; SHIFT, STAT (1)
Choose Var (4)
Choose y (2)Read as y bar – this is the mean of all the y-values.Press =
16. This ordered pair ( x ; y ) needs to be plotted and used to draw the line. If the y-intercept is not a value on the axes, tell learners they can substitute any x-value into the equation found and find a corresponding y-value.
17. Do examples in which you combine the concepts of drawing a scatter plot, finding the least squares regression line and drawing the line onto the scatter plot.

84 Grade 12 MATHEMATICS Term 3
TOPIC 2, LESSON 2: SCATTER PLOTS, LEAST SQUARES REGRESSION LINE, CORRELATION COEFFICIENT
Teaching notes for both examples:Remind learners to:
z Draw axes and label them clearly. z Consider the scale and what numbers are needed on each axes. z Find the co-ordinates from the table. z If the y- intercept does not lie within the range available, any point can be found using
substitution (as in the first example where 4 was used).Refer learners to their steps to find the equation of the least squares regression line as well as the steps discussed a short while ago on how to draw the line.
Example 1 Teaching notes
The table below shows the shoe size and mass of 10 boys.
Size 5 12 7 10 10 9 8 11 6 8Mass 65 97 68 92 78 78 76 88 74 80
a) Find the equation of the least squares regression line
b) Draw a scatter plotc) Draw the least squares regression line
onto the scatter plot.
Ask: What might we be looking for with this set of data?(A correlation between the size shoe a boy wears and his mass).Ask: Would you expect a correlation?(Yes – in general, the bigger a boy is, the higher is mass is likely to be).
When the equation of the least squares regression line has been found, ask: Is the gradient positive or negative? (positive)Was this expected? (Yes – we discussed that the correlation was likely to be positive).
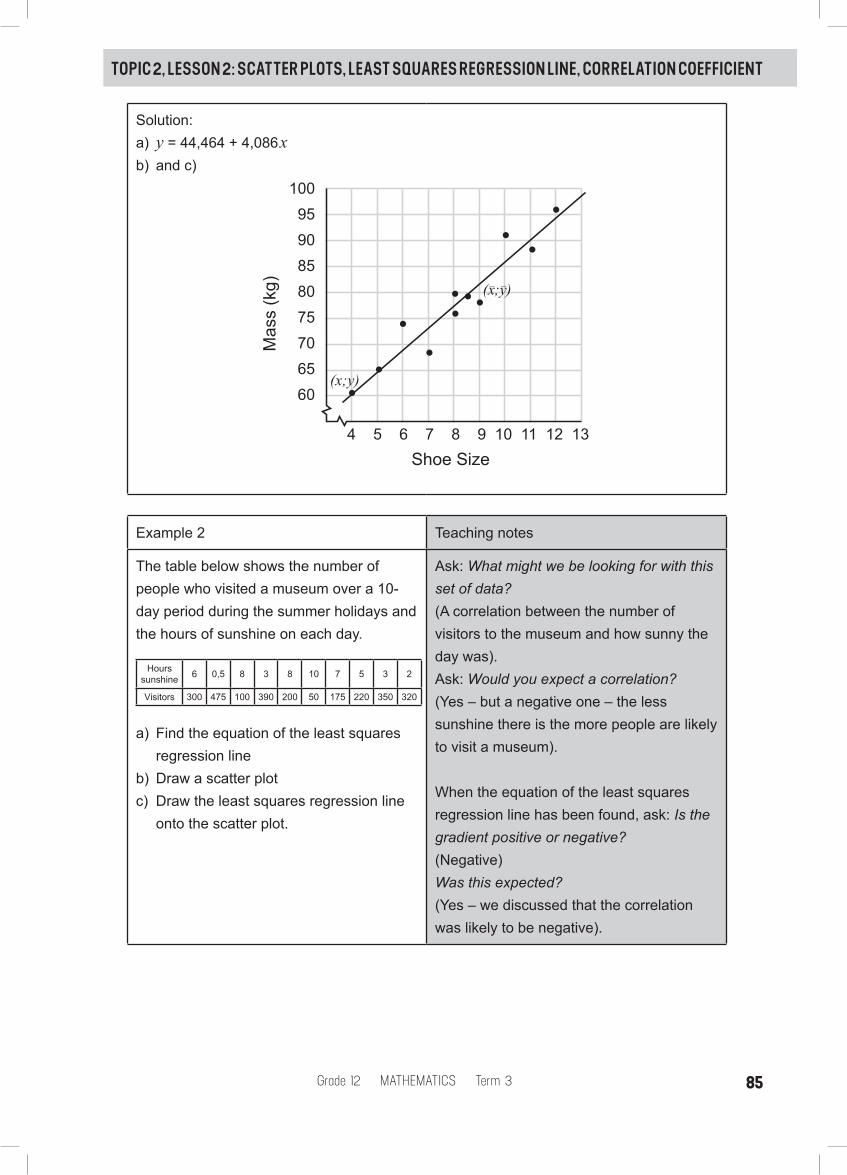
85Grade 12 MATHEMATICS Term 3
TOPIC 2, LESSON 2: SCATTER PLOTS, LEAST SQUARES REGRESSION LINE, CORRELATION COEFFICIENT
Solution:a) y = 44,464 + 4,086xb) and c)
100
95
90
85
80
75
70
65
60
4 5 6 7 8 9 10 11 12 13
Mass (
kg)
Shoe Size
(x–;y–)
(x;y)
Example 2 Teaching notes
The table below shows the number of people who visited a museum over a 10-day period during the summer holidays and the hours of sunshine on each day.
Hours sunshine 6 0,5 8 3 8 10 7 5 3 2
Visitors 300 475 100 390 200 50 175 220 350 320
a) Find the equation of the least squares regression line
b) Draw a scatter plotc) Draw the least squares regression line
onto the scatter plot.
Ask: What might we be looking for with this set of data?(A correlation between the number of visitors to the museum and how sunny the day was).Ask: Would you expect a correlation?(Yes – but a negative one – the less sunshine there is the more people are likely to visit a museum).
When the equation of the least squares regression line has been found, ask: Is the gradient positive or negative? (Negative)Was this expected? (Yes – we discussed that the correlation was likely to be negative).

86 Grade 12 MATHEMATICS Term 3
TOPIC 2, LESSON 2: SCATTER PLOTS, LEAST SQUARES REGRESSION LINE, CORRELATION COEFFICIENT
Solution:a) y = 470,326 - 40,443xb) and c)
500
450
400
350
300
250
200
150
100
0 1 2 3 4 5 6 7 8 9 10
Num
ber
of V
isitors
Hours of Sunshine
(x–;y–)
18. Ask learners if they have any questions before you teach them the final new concept.
19. Say: Look at the first scatter plot concerning shoe size and mass. What degree of correlation would you say there is between the two sets of data? (Strong) What evidence do you have for this? (The points are clustered quite close together forming a straight line). What did we say about the gradient? (It is positive; the line slopes in an upwards direction). This tells us that there is a strong positive correlation between the two sets of data.
20. Say: Look at the second scatter plot concerning sunshine and a museum visit. What degree of correlation would you say there is between the two sets of data? (Strong) What evidence do you have for this? (The points are clustered quite close together forming a straight line). What did we say about the gradient? (It is negative; the line slopes in a downwards direction). This tells us that there is a strong negative correlation between the two sets of data.
21. Use calculators to find an actual value that can tell us how strong or weak the correlation between the data is. This will also tell us whether the correlation is positive or negative. Remember: If the correlation is positive it means: as one value gets bigger, the second value is likely to also get bigger. If the correlation is negative it means: as one value gets bigger, the second value is likely to get smaller.

87Grade 12 MATHEMATICS Term 3
TOPIC 2, LESSON 2: SCATTER PLOTS, LEAST SQUARES REGRESSION LINE, CORRELATION COEFFICIENT
22. Learners should enter the data of the first example into their calculator again and proceed as they did to find A and B. Tell learners to stop at the screen where A and B can be found (after choosing ‘5’ for regression) and note the r as mentioned earlier. This is the correlation coefficient. Press 3 and =.
23. Ask: What do you get? 0,8954 Say: Write it down and we will discuss it shortly.
24. Tell learners to find the correlation coefficient of the second example. Ask: What do you get? -0,93447
25. Tell learners that the correlation coefficient will ALWAYS lie from -1 to 1. The closer it is to -1 or 1, the stronger the correlation. The closer it is to zero, the weaker the correlation. A correlation coefficient of -1 or 1 shows a perfect correlation between the two sets of data. A correlation coefficient of 0 shows no correlation at all.
26. Ask: Do the two correlation coefficients found show what we expected when we looked at the scatter plot? (Yes – the first one is positive and is very close to 1 - showing a strong positive correlation. The second one is negative and is extremely close to -1 - showing a very strong negative correlation).
Remind learners that the negative correlation does not mean there isn’t a correlation. A negative correlation means that as one set of data gets bigger, the other set is getting smaller.
27. Learners should copy the following summary into their exercise books to assist them in describing the correlation between two sets of data. (Some textbooks have a summary which learners can copy – if this is the case, there is no need to write it on the board). The correlation coefficient (r) ranges from -1 to 1. This can be written in the form:
-1 ≤ r ≤ 1
Strong StrongModerate
Negative Correlation Positive CorrelationNo Correlation
ModerateWeak
-1 -0,8 -0,5 -0,2 0 0,2 0,5 0,8 1
Weak
28. Say: Before we do some fully worked examples where all these concepts will be combined, let’s discuss how the equation of the least squares regression line can be used to answer questions. Consider again the shoe and mass data and the equation y = 44,464 + 4,086x that was found.

88 Grade 12 MATHEMATICS Term 3
TOPIC 2, LESSON 2: SCATTER PLOTS, LEAST SQUARES REGRESSION LINE, CORRELATION COEFFICIENT
29. Two types of questions could be asked. Use the equation of the least squares regression line to estimate the mass of a boy with a:
a) size 8,5 shoe
b) size 4 shoe
30. Point out to learners that both values are those represented by the x-values (shoe sizes). Ask: What is the difference between the two using the data in the table? size 8,5 falls within the range of data given but size 4 does not.
31. Say: Let’s substitute the values and find the answers before discussing the difference further.
a) y = 44,464 + 4,086x b) y = 44,464 + 4,086x
y = 44,464 + 4,086(8,5) y = 44,464 + 4,086(4)
y = 79,195 y = 60,808
Because the first value was in the range of data given, it is said that we are interpolating, and the result is considered to be reliable. Because the second value was NOT in the range of data given, it is said that we are extrapolating, and the result is considered to be unreliable.
32. Tell learners to write down these two words with the example and explanation.
33. Do two fully worked examples from past examinations before learners get the opportunity to work on their own. Learners should take the examples down in their books.
The scatter plots for the examples below are available in the Resource Pack. Resource 6. They have been enlarged for your convenience.

89Grade 12 MATHEMATICS Term 3
TOPIC 2, LESSON 2: SCATTER PLOTS, LEAST SQUARES REGRESSION LINE, CORRELATION COEFFICIENT
Example 1
A survey was conducted at a local supermarket relating the distance that shoppers lived from the store to the average number of times they shopped at the store in a week. The results are shown in the table below.
Distance from the store in km 1 2 3 4 5 7 8 10
Average number of times shopped per week
12 10 7 7 6 2 3 2
SCATTER PLOT
Distance from the store in km
Aver
age
num
ber o
f tim
essh
oppe
d pe
r wee
k
12
11
10
9
8
7
6
5
4
3
2
1
0
0 1 2 3 4 5 6 7 8 9 10
a) Use the scatter plot to comment on the relationship between the distance a shopper lived from the store and the average number of times she/he shopped at the store in a week.
b) Calculate the correlation coefficient of the data.c) Calculate the equation of the least squares regression line of the data.d) Use the answer in (c) to estimate the average number of times that a shopper living
6km from the supermarket will visit the store in a week.e) Sketch the least squares regression line on the scatter plot.
NOV 2016
Teaching notesThe questions below are similar to those already covered. Remind learners to find the
( x ; y ) point to ensure their least squares regression line is accurate.

90 Grade 12 MATHEMATICS Term 3
TOPIC 2, LESSON 2: SCATTER PLOTS, LEAST SQUARES REGRESSION LINE, CORRELATION COEFFICIENT
Solution:a) Strongb) -0,9462…c) y = 11,71-1,12xd) y = 11,71-1,12(6) y = 4,99 ∴ 5 timese)
SCATTER PLOT
Distance from the store in km
Aver
age
num
ber o
f tim
essh
oppe
d pe
r wee
k
1211109876543210
0 1 2 3 4 5 6 7 8 9 10

91Grade 12 MATHEMATICS Term 3
TOPIC 2, LESSON 2: SCATTER PLOTS, LEAST SQUARES REGRESSION LINE, CORRELATION COEFFICIENT
Example 2
An ice cream shop recorded the sales of ice cream, in rand, and the maximum temperature, in °C, for 12 days in a certain month. The data that they collected is represented in the table and scatter plot below.
Temperature in ºC 24,2 26,4 21,9 25,2 28,5 32,1 29,4 35,1 33,4 28,1 32,6 27,2
Sales of ice cream in rand 215 325 185 332 406 522 412 614 544 421 445 408
Sale
s of
ice
crea
m in
rand
Temperature in ºC
SCATTER PLOT650
600
550
500
450
400
350
300
250
200
150
20 22 24 26 28 30 32 34 36 38
a) Describe the influence of the temperature on the sales of ice cream in the scatter plot.b) Give a reason why this trend cannot continue indefinitely.c) Calculate an equation for the least squares regression line.d) Calculate the correlation coefficient.e) Comment on the strength of the relationship between the variables.
MAR 2015
Teaching notesThe questions below are similar to those already covered.Tell learners that in order to answer b) they need to think of what is and isn’t possible in real life.
Solution:a) As the temperature increases, the ice cream sales also increase.b) The temperature cannot increase indefinitely.c) y = -460,35 + 30,09xd) r = 0,96e) Very strong positive correlation.

92 Grade 12 MATHEMATICS Term 3
TOPIC 2, LESSON 2: SCATTER PLOTS, LEAST SQUARES REGRESSION LINE, CORRELATION COEFFICIENT
34. Ask directed questions so that you can ascertain learners’ level of understanding. Ask learners if they have any questions.
35. Give learners an exercise to complete on their own.
36. Walk around the classroom as learners do the exercise. Support learners where necessary.
ADDITIONAL ACTIVITIES/ READING
Further reading, listening or viewing activities related to this topic are available on the following web links:
https://www.youtube.com/watch?v=jEEJNz0RK4Q
(Why a least squares regression line is called this)
https://www.youtube.com/watch?v=40EU5HMrDOw
(How to find the equation of the least squares regression line on the casio calculator)
https://www.youtube.com/watch?v=ugd4k3dC_8Y
(Correlation coefficient explained)
https://www.youtube.com/watch?v=jf-SIOFUuEo
(Interpreting the correlation coefficient)
D

TOPIC 2, LESSON 3: REVISION AND CONSOLIDATION
93Grade 12 MATHEMATICS Term 3
TERM 3, TOPIC 2, LESSON 3
REVISION AND CONSOLIDATIONSuggested lesson duration: 2.5 hours
TOPIC 2, LESSON 3: REVISION AND CONSOLIDATION
APOLICy AND OUTCOMES
CAPS Page Number 48
Lesson ObjectivesBy the end of the lesson, learners will have revised:
z all the concepts required in this topic.
CLASSROOM MANAGEMENT
1. Make sure that you are ready and prepared.
2. Advance preparation: Work through the lesson plan and exercises.
3. Write the lesson heading on the board before learners arrive.
4. The table below provides references to this topic in Grade 12 textbooks. Plan when you will get learners to practice the concepts learned by completing the exercises. Work through the lesson plan and decide where you will get learners to do the exercises. Indicate this on your lesson plans.
LEARNER PRACTICE
MIND ACTION SERIES
PLATINUM VIA AFRIKA
CLEVER CLASSROOM MATHS
EVERYTHING MATHS
(SIYAVULA)
EX PG EX PG EX PG EX PG EX PG EX PG
Rev 304 Rev 241 Qu’s 278 Rev 339 12.612.7
349353
9.5 395
B

94 Grade 12 MATHEMATICS Term 3
TOPIC 2, LESSON 3: REVISION AND CONSOLIDATION
C CONCEPTUAL DEVELOPMENT
INTRODUCTION
1. Ask learners to recap what they have learned in this section. Point out issues that you know are important, as well as problems that you encountered from your own learners.
2. If learners want you to explain a concept again, do that now.
DIRECT INSTRUCTION
1. Ask learners to do the revision exercise from their textbook. There should be enough time to also ask learners to do another revision exercise – either from another textbook or questions from a previous test or past examination.
2. Ask directed questions so that you can ascertain learners’ level of understanding. Ask learners if they have any questions.
3. Walk around the classroom as learners do the exercise. Support learners where necessary. Stop learners at certain times to discuss or mark a question on the board. Use the time well.

TOPIC 3 COUNTING AND PROBABILITy
95Grade 12 MATHEMATICS Term 3
Term 3, Topic 3: Topic Overview
COUNTING AND PROBABILITy
TOPIC 3 COUNTING AND PROBABILITy
AA. TOPIC OVERVIEW
z This topic is the third of three topics in Term 3. z This topic runs for two weeks (9 hours). z It is presented over four lessons. z The lessons have been divided according to sub-topics, not according to one school lesson.
An approximate time (which will total 9 hours) has been allocated to each lesson. For exam-ple, one lesson in this topic could take two school lessons. Plan according to your school’s timetable.
z Probability counts 10% of the final Paper 1 examination. z Traditionally, probability either gets taught extremely well or almost not at all. The average
for Grade 12 probability over the last four years in the final examination is less than 25%. If you feel that you need to improve your own content knowledge, watch videos and read up on the concepts required. Watch the following 3-minute video for some inspiration: https://www.ted.com/talks/arthur_benjamin_s_formula_for_changing_math_education (Arthur Benjamin is a professor of mathematics in the United States of America. He dis-cusses the fact that most topics in school mathematics lead to being able to learn calculus. However, he believes that statistics and probability are more important and that calculus can always be studied in more detail by students of mathematics who go on to study mathemat-ics at tertiary level).
Breakdown of topic into 4 lessons:
Lesson title Suggested time (hours)
Lesson title Suggested time (hours)
1 Revision of Grade 10 & 11
2,5 3 Solving problems using the fundamental counting principle
2,5
2 Fundamental counting principle and factorial notation
2 4 Revision and Consolidation
2

96 Grade 12 MATHEMATICS Term 3
TOPIC 3 COUNTING AND PROBABILITy
C
SEQUENTIAL TABLE
GRADE 11 and earlier GRADE 12
LOOKING BACK CURRENT
z Compare relative frequency and theoretical probability
z Mutually exclusive events z Complementary events z Use the identities:
P(A or B) = P(A)+ P(B) – P(A and B)P(A or B) = P(A)+ P(B) (for mutually exclusive events)P(A and B) = P(A) × P(B) (for independent events)P(not A) = 1 – P(A) (for complementary events)
z Dependent and independent events z Use of Venn diagrams, tree diagrams and
contingency tables to solve problems.
z Revise previous work z The fundamental counting principle z Probability problems using the
fundamental counting principle.
WHAT THE NSC DIAGNOSTIC REPORTS TELL US
According to NSC Diagnostic Reports there are a number of issues pertaining to Analytical Geometry.
These include:
z Confusion between n(A) and P(A) z Not reading from a contingency table correctly z No understanding of mutually exclusive events and independent events. z Incorrect use of notation (for example, P(0,2)) z Inability to distinguish between the scenarios in which repetition was allowed, and scenarios
where repetition was not allowed.
It is important that you keep these issues in mind when teaching this section. Remind learners that this section requires logical reasoning. Learners need to be encouraged to scrutinise the given information for clues and then plan a way forward.
B

97Grade 12 MATHEMATICS Term 3
TOPIC 3 COUNTING AND PROBABILITy
ASSESSMENT OF THE TOPIC
z CAPS formal assessment requirements for Term 3:• Test• Preliminary examination
z A test, with memorandum, is provided in the Resource Pack. The test is aligned to CAPS in every respect, including the four cognitive levels as required by CAPS (page 53).
z The questions usually take the form of scenarios in which the fundamental counting principle is required to calculate the total number of possibilities as well as leading to probability problems.
z Monitor each learner’s progress to assess (informally) their grasp of the concepts. This information can form the basis of feedback to the learners and will provide you valuable information regarding support and interventions required.
MATHEMATICAL VOCABULARy
Be sure to teach the following vocabulary at the appropriate place in the topic:
Term Explanation
probability The likelihood, or chance, of something happening A probability answer is ALWAYS in the range: 0 ≤ x ≤ 1
trial/experiment The process of trying something out to find the chance (probability) of an event occurring. For example: Tossing a coin 100 times
outcome A possible result from an experiment For example: ‘tails’ is one of two possible outcomes when tossing a coin
sample space The sample space of an experiment is the set of all possible outcomes of that experiment
experimental probability
The result of doing an experiment to find the chances of an event occurring
For example: An experiment was conducted to see how many tails appeared when a coin was tossed 100 times. The result was
100
47
D
E

98 Grade 12 MATHEMATICS Term 3
TOPIC 3 COUNTING AND PROBABILITy
relative frequency
The outcome of an experiment In the above example
100
47 is the relative frequency
theoretical probability
The probability of an event happening using knowledge of numbers. The theoretical calculation
( )( )
( )
nn
P A SA
=
tree diagram Method used for counting the number of possible outcomes of an event. The last column of the tree diagram shows all the possible outcomes
contingency table
Table showing the distribution of one variable in rows and another in columns, used to study the correlation between the two variables
Venn diagram Useful way of representing mathematical or logical sets of information In a Venn diagram, the position and overlapping of circles are used to indicate the relationships between different sets of information
union The set of all outcomes that occur in at least one of the events Key word: or
intersection The set of outcomes that occur in all the events Key word: and
mutually exclusive events
Events with no outcomes in common (no intersection)
complementary events
Mutually exclusive events that contain all the outcomes between them
independent events
Events where the outcome of one event does not affect the outcome of the other events
dependent events
Events where the outcome of one event affects the outcome of the next event
fundamental counting principle
A way to work out the number of outcomes when different options are offered. The principle can be used in probability problems If there are m ways of doing one event, n ways of doing a 2nd event and p ways of doing a 3rd event, then there will be m × n × p total possible arrangements

99Grade 12 MATHEMATICS Term 3
TOPIC 3 COUNTING AND PROBABILITy
factorial notation
The result of multiplying a sequence of descending natural numbers down to 1 (such as 4 × 3 × 2 × 1) The symbol is ‘!’. 4! = 4 × 3 × 2 × 1 = 24
permutation An arrangement* or ordering of several distinct objects where order matters
NOTE: * Avoid using the word ‘combination’ in this section. In probability, a combination is an arrangement of objects where order does not matter. These are not covered in CAPS.

TOPIC 3, LESSON 1: REVISION
100 Grade 12 MATHEMATICS Term 3
TERM 3, TOPIC 3, LESSON 1
REVISIONSuggested lesson duration: 2.5 hours
TOPIC 3, LESSON 1: REVISION
A POLICy AND OUTCOMES
CAPS Page Number 49
Lesson ObjectivesBy the end of the lesson, learners will have revised:
z tree diagrams z Venn diagrams z contingency tables z mutually exclusive z complementary z independent events.
CLASSROOM MANAGEMENT
1. Make sure that you are ready and prepared.
2. Advance preparation: Work through the lesson plan and exercises.
3. Write the lesson heading on the board before learners arrive.
4. Write work on the chalkboard before the learners arrive. For this lesson write the sub-heading ‘Tree diagrams’ and the summary of a tree diagram drawn (point 1).
5. Prepare the bag with pens and pencils (point 4).
6. Prepare label cards for Venn diagrams (point 9).
7. The table below provides references to this topic in Grade 12 textbooks. Plan when you will get learners to practice the concepts learned by completing the exercises. Work through the lesson plan and decide where you will get learners to do the exercises. Indicate this on your lesson plans.
B

101Grade 12 MATHEMATICS Term 3
TOPIC 3, LESSON 1: REVISION
C
LEARNER PRACTICE
MIND ACTION SERIES
PLATINUM VIA AFRIKA
CLEVER CLASSROOM MATHS
EVERYTHING MATHS
(SIYAVULA)
EX PG EX PG EX PG EX PG EX PG EX PG
Rev 306 1 248 Qu’s123
280283284286
13.1 357 13.1 355 10.110.210.3
410418423
CONCEPTUAL DEVELOPMENT
INTRODUCTION
1. A knowledge of all the probability concepts from previous years is essential to Grade 12 as the final examination will assess a combination of this work and the new work to be covered.
2. A generous amount of time has been allocated to this revision lesson – use it well to ensure that learners start the new work, confident in the old work.
DIRECT INSTRUCTION
1. Refer learners to the diagram on the board. Show each part and remind learners when multiplication occurs and when addition occurs. Remind learners how each ‘clump’ of branches should add up to a probability of 1.
Outcome 1
Outcome 2
Outcome 3
Outcome 1
Outcome 2
Outcome 3
Outcome 1
Outcome 2
Outcome 3
Outcome 1
Outcome 3
SEQUENCE OF EVENTS
1ST EVENT 2ND EVENT TOTAL=1
2/3
1/6
1/6
1/4
MULTIPLY ALONG BRANCHES
ADD
UP
THE
RESULTS
YOU
NEED
C
H
O
I
C
E
S
Outcome 2

102 Grade 12 MATHEMATICS Term 3
TOPIC 3, LESSON 1: REVISION
2. Learners should copy the diagram in their exercise books. Once they have done so, ask: What are independent events and dependent events?
3. Ensure that learners can explain the concepts of independent and dependent events with the use of an example. Independent events: the probability of one event is not affected by another event. For example, tossing a coin more than once – the second toss is not affected by what was tossed previously. Dependent events: the probability of one event is affected by another event. For example, if there is a bag of two different coloured balls and one is drawn out but not replaced, this affects the probability of drawing a certain colour in a following draw. Learners should write these definitions in their books.
4. Once the term ‘not replaced’ has been used, discuss this and ensure learners understand clearly what is meant. If need be, perform a short experiment with the learners.
Use the bag with pens and pencils. Discuss the probability of drawing a pen or a pencil. Let a learner draw one pen or pencil out of the bag, but then replace it. Discuss the probability of drawing a pen or pencil in the next draw – learners need to recognise that because the item drawn was replaced, the probability in the second draw remains the same as for the first draw. This scenario represents independent events.Repeat the activity. Discuss the probability again but do not replace what the first learner draws out. Ask learners what the probability is now of drawing a pen or pencil. Learners need to recognise that because the item drawn was not replaced, the probability in the second draw has been affected. The total number of items in the bag will be one less and the probability of drawing a pen or pencil is now affected by the first item not being replaced. This scenario represents dependent events.
5. Do a worked example with learners. Learners should write the example in their books.
Example Teaching notes
The probability that the first answer in a maths quiz competition will be correct is 0,4. If the first answer is correct, the probability of getting the next answer correct rises to 0,5. However, if the answer is wrong, the probability of getting the next answer correct is only 0,3.a) Represent the information on a tree
diagram. Show the probabilities associated with each branch as well as the possible outcomes.
Tell learners that this may initially seem like a difficult question. The instruction to draw a tree diagram is key because this will make it much clearer.
Ask: How many options are given? (2)How many questions will be asked/extensions needed? (2)What are the options? (Correct or wrong).

103Grade 12 MATHEMATICS Term 3
TOPIC 3, LESSON 1: REVISION
b) Calculate the probability of getting the second answer correct.
NSC NOV 2016
Say: Look carefully at the outcomes – choose those that represent the second answer being correct.Multiply along the branches leading to these outcomes and add.
Solution:a)
0,4
0,6 0,3
0,7
0,5
0,5C
W
C (C;C)
(W;C)
(W;W)
(C;W)
C
W
W
b) P (2nd answer correct) = P (C and C) + P (W and C) = (0,4)(0,5) + (0,6)(0,3) = 0,38
6. Ask learners if there are any concepts relating to tree diagrams that they are unsure of. If so, answer their questions before moving on.
7. Say: We are going to look at Venn diagrams.
8. Clear the board and draw a few diagrams such as the one below on the board to use during the discussion. Draw up to 10 if possible, even if it means making them a little smaller than you would like.
A B
9. Use the papers/cards prepared with one of the following written on each one:
A and B not A A or B
not (A or B) A B only
B not (A and B) A only
not B
10. Say: I would like a volunteer to come up and choose one paper out of the bag then shade the part matching what is said on the paper on one of the Venn diagrams.

104 Grade 12 MATHEMATICS Term 3
TOPIC 3, LESSON 1: REVISION
If you have learners that generally find mathematics a challenge and may be intimidated by this, offer to do one example first. Once you have done one example, tell learners that you will assist them where necessary as it is a learning exercise for everyone in the class.
11. Once all 10 diagrams have been shaded, put all the papers back in the bag. Say: I would like a volunteer to come up and choose a paper again. This time, the learner must show which Venn diagram matches the statement, then they need to write the statement at the appropriate Venn diagram as well as the mathematical notation.
For example, A and B is written as (A ∩ B) so both ways will be written next to the appropriate diagram.
12. Once this round is complete, learners should write the summary in their exercise books.
A and B
A B
not A
A B
A or B
A B
not (A or B)
A BA B
A
A B
B only
A B
B
A B
not (A and B)
A BA B

105Grade 12 MATHEMATICS Term 3
TOPIC 3, LESSON 1: REVISION
A only
A B
not B
A BA B
13. Ask: What are mutually exclusive events and complementary events? Allow learners to share what they remember. Learners may want to use an example to describe the concept; demonstrate it on the board using a Venn diagram; or represent it using the correct notation. Once all possibilities have been discussed, ensure the following summary is available for learners to write in their exercise books:
Note: If learners used a good example, use it to replace the one below.
Mutually exclusive events Complementary events
Explanation/Example
Events with no intersection. Grade 10 learners (A) and Grade 11 learners (B).
Events that contain all the possible outcomes between them. A learner either draws a pencil from the bag (E) or they do not (E’).Only one event can happen at a time, but event one must happen.
Venn diagram
A
B E
E'
Notation P(A and B) = 0 P(E) = 1 - P(E ')
14. Do the following two worked examples with learners now. Learners should write them in their exercise books.

106 Grade 12 MATHEMATICS Term 3
TOPIC 3, LESSON 1: REVISION
Example 1 Teaching notes
A survey was conducted amongst 100 learners at a school to establish their involvement in three codes of sport: soccer, netball and volleyball. The results are shown below:
z 55 learners play soccer (S) z 21 learners play netball (N) z 7 learners play volleyball (V) z 3 learners play netball only z 2 learners play soccer and volleyball z 2 learners play netball and volleyball z 1 learner plays all three sports
The Venn diagram below shows the information above.
S N
31
2
ac
b
deV
a) Determine the values of a,b,c,d and e.
Tell learners that this question is very similar to needing to draw the Venn diagram from the information given. They will still need to work out what numbers go in each section.Ask: Where should we always start when completing a Venn diagram?(The intersection)Say: Next, we need to work our way outwards from there until the last areas filled in are those that represent ONLY a certain set.Tell learners to note that the 1 has been filled in.
Ask: How will we find the value of ‘a’?(It is the only missing value, so knowing that 21 learners play netball will be used and the other numbers subtracted).Ask: How will we find the value of ‘b’?(It forms part of the intersection of soccer and volleyball and we know that is 2 but 1 has already been counted).Say: c and d can now both be found using the totals for each sport and e will be found in a similar way – we know the total surveyed.
b) What is the probability that one of the learners chosen at random from this group plays netball or volleyball?
NSC NOV 2016
Ask a learner to come and show you on the Venn diagram which areas represent netball OR volleyball. Remind them that or is more.(Only c and e are excluded).

107Grade 12 MATHEMATICS Term 3
TOPIC 3, LESSON 1: REVISION
Solution:a) a = 15 ;b = 1 ;c = 38 ;d = 3 ;e = 37
b) ( )orP N V 10025
41
= =
Example 2 Teaching notes
William writes a Mathematics examination and an Accounting examination. He estimates that he has a 40% chance of passing the Mathematics examination. He estimates that he has a 60% chance of passing the Accounting examination. He estimates that he has a 30% chance of passing both.Determine the probability that William will fail Mathematics and Accounting.
EC 2015
Point out to learners that this question does not give a suggestion as to what method could be used to assist in calculating the answer.The key word is that there is a ‘both’ - in other words an intersection which implies that a Venn diagram may be useful.Ask: How many sets are represented?(Two – mathematics and accounting).Ask: Are they inclusive? (Yes – the chance of passing both)Tell learners to draw the frame and the two overlapping circles.Ask: Which part of the Venn diagram must always be completed first?(The intersection)Tell learners to find the information that describes this (30% chance of passing both) and to fill it in.Ask: How much chance is still left after the intersection has been completed of passing each exam?(10% for mathematics and 30% for accounting).Fill this in and then finally check if it totals to 100% - if not there is something outside the sets (in other words it is not exhaustive).Failing both will be the probability on the outside of the sets.

108 Grade 12 MATHEMATICS Term 3
TOPIC 3, LESSON 1: REVISION
Solution:
M A
0,30,1 0,3
0,3
P (fail both) = 0,3
15. Ask learners if there are any concepts related to Venn diagrams or the other concepts covered that they are unsure of. If so, answer their questions before moving on.
16. Say: We are going to look at contingency tables.
17. Say: A contingency table is a table showing the distribution of one variable in rows and another in columns, used to study the correlation between the two variables.
18. Use this example to explain further:
Medicine Taken
Col
d Le
ngth yes no Total
1-3 days 86 19 105
4-7 days 16 79 95
Total 102 98 200
19. Discuss the following points with learners using the example which summarises how many people took medicine when they had a cold and for how long they had the cold. Ask:
z How many people had a cold for 1 – 3 days? (105)
z How many people had a cold for 4 – 7 days? (95)
z How many people took medicine for their cold? (102)
z How many people did not take medicine for their cold? (98)
z How many people had a cold for 1 – 3 days AND took medicine? (86)
z How many people had a cold for 4 – 7 days and did NOT take medicine? (79)
Stop after each question to confirm where the answer was read from the table.

109Grade 12 MATHEMATICS Term 3
TOPIC 3, LESSON 1: REVISION
20. Tell learners that they can read from these tables to calculate probabilities. The same table will be used to answer probability questions:
Teaching notes Solution
Find the probability that a person, chosen at random:
had a cold for 1 – 3 days Note that each of these questions has a focus on one of the totals of the various headings (other than the grand total which will be the denominator).
200
105
had a cold for 4 - 7 days200
95
took medicine for their cold200
102
did not take medicine for their cold 200
98
had a cold for 1 – 3 days and took medicine
Note that each of these questions has a focus on an item from a column and an item from a row – in other words, two of the headings (other than the grand total which will be the denominator).
200
86
took medicine and had a cold for 4 – 7 days 200
16
had a cold for 4 – 7 days and did not take medicine 200
79
did not take medicine and had a cold for 1 – 3 days 200
19
took medicine, given that they had a cold for 1 – 3 days
Note that each of these questions has a focus on a different area for the total since the question states, given that. This means that a particular group is already chosen.For example, given that they took medicine means that the total number of people who took medicine is the new sample space.
105
86
had a cold for 4 – 7 days given that they took medi-cine
102
16
did not take medicine, giv-en that they had a cold for 4 - 7 days.
95
79
had a cold for 1 - 3 days given that they took medi-cine
102
86
21. Ask: Does anyone have any questions before we move on?
22. Remind learners that independent events were discussed earlier when tree diagrams were covered. Ask: How can events be proved to be independent?

110 Grade 12 MATHEMATICS Term 3
TOPIC 3, LESSON 1: REVISION
For events to be independent, the probability of one event multiplied by the probability of the other event is equal to the probability of the intersection of the 2 events.
P (A and B) = P (A) × P (B)
Tell learners to write this in their exercise books.
23. Say: Contingency tables can be used in questions relating to whether or not two events are independent. For example: Are the events: taking medicine and having a cold for 4 – 7 days independent of each other?
Solution: Teaching notes
P(taking medicine) × P(4-7 day cold)
200
102
200
95#=
,4000969
0 24225= =
P(taking medicine AND 4 – 7 day cold)
08,20016
0= =
0,24225≠0,08∴ the events are not independent.
Find the probability of each of the events on their own and multiply them.
Find the probability of the event of the intersection of the two events.If the answers are equal, the events are independent.
24. Ask directed questions so that you can ascertain learners’ level of understanding. Ask learners if they have any questions.
25. Give learners an exercise to complete with a partner.
26. Walk around the classroom as learners do the exercise. Support learners where necessary.
ADDITIONAL ACTIVITIES/ READING
Further reading, listening or viewing activities related to this topic are available on the following web links:
https://www.youtube.com/watch?v=gtCFMsxp6ag
(Teaching Grade 11 probability)
https://www.youtube.com/watch?v=mdYilUV7GwQ
D

TOPIC 3, LESSON 3: THE FUNDAMENTAL COUNTING PRINCIPLE AND FACTORIAL NOTATION
111Grade 12 MATHEMATICS Term 3
TERM 3, TOPIC 3, LESSON 2
THE FUNDAMENTAL COUNTING PRINCIPLE AND FACTORIAL NOTATION
Suggested lesson duration: 2 hours
TOPIC 3, LESSON 3: THE FUNDAMENTAL COUNTING PRINCIPLE AND FACTORIAL NOTATION
APOLICy AND OUTCOMES
CAPS Page Number 49
Lesson ObjectivesBy the end of the lesson, learners should be able to:
z explain the fundamental counting principle z do simple problems using the fundamental counting principle z explain and use factorial notation.
CLASSROOM MANAGEMENT
1. Make sure that you are ready and prepared.
2. Advance preparation: Work through the lesson plan and exercises.
3. Write work on the chalkboard before the learners arrive. For this lesson write the choices for the key holders up (point 1).
4. The table below provides references to this topic in Grade 12 textbooks. Plan when you will get learners to practice the concepts learned by completing the exercises. Work through the lesson plan and decide where you will get learners to do the exercises. Indicate this on your lesson plans.
LEARNER PRACTICE
MIND ACTION SERIES
PLATINUM VIA AFRIKA
CLEVER CLASSROOM MATHS
EVERYTHING MATHS
(SIYAVULA)
EX PG EX PG EX PG EX PG EX PG EX PG
12
310312
4 288 13.213.313.4
361365367
13.213.313.413.5
359361363365
10.410.5
428430
B

112 Grade 12 MATHEMATICS Term 3
TOPIC 3, LESSON 3: THE FUNDAMENTAL COUNTING PRINCIPLE AND FACTORIAL NOTATION
C CONCEPTUAL DEVELOPMENT
INTRODUCTION
1. Explain the basic idea of the fundamental counting principle. Use demonstrations to assist learners in gaining a deeper understanding before doing the more complicated problems in the next lesson.
DIRECT INSTRUCTION
1. Start the lesson by giving learners the following scenario: You and your friend decide to make key holders to make some extra money. You offer people the following choices:
Wood: Pine or oakSize: Small, medium or large
2. Ask: Work out how many possible options could be made. Learners can work with a partner.
3. Learners should have found six choices:
z Small pine
z Medium pine
z Large pine
z Small oak
z Medium oak
z Large oak.
4. Before discussing the concept further, do a second example: You need to get dressed to go and visit friends. You have the following to choose from:
Pants: Jeans or chinosTop: collared shirt, short-sleeved t-shirt,
long-sleeved t-shirt or sweatshirt
5. Ask: Work out all the possible options and write them down.
6. Learners should have found eight choices of outfit:
z Jeans and collared shirt

113Grade 12 MATHEMATICS Term 3
TOPIC 3, LESSON 3: THE FUNDAMENTAL COUNTING PRINCIPLE AND FACTORIAL NOTATION
z Jeans and short-sleeved T-shirt
z Jeans and long-sleeved T-shirt
z Jeans and sweatshirt
z Chinos and collared shirt
z Chinos and short-sleeved T-shirt
z Chinos and long-sleeved T-shirt
z Chinos and sweatshirt
7. Ask: Look at both examples, the number of choices in each and the total number of options. Is there an easier way to work out the total amount of possible options? (Multiply the number of options to get the total possible options).
8. Write the heading, Fundamental counting principle on the board and write the rule that has just been found more formally:
If one event can occur in m ways and another event can occur in n ways, then there are m × n ways of doing BOTH.
Learners should write the heading and the rule in their exercise books.
9. This rule is not limited to two events. For example, if a person is buying a new car and is given the following options:
z Automatic or manual
z White, red, blue or black
z Hatchback or sedan
There will be 2 × 4 × 2 = 16 possible different cars for the buyer to choose.
10. Use an example that couldn’t possibly be worked using the same method as in the first two examples:
When a crime has been committed and a witness saw one of the criminals getting away, the police may ask the witness to look through photographs of various features to try and put together an identikit of the criminal.The police have the following available to choose from:
z 40 hairlines
z 48 eyes and eyebrows
z 56 noses
z 35 mouths
z 65 chins and cheeks

114 Grade 12 MATHEMATICS Term 3
TOPIC 3, LESSON 3: THE FUNDAMENTAL COUNTING PRINCIPLE AND FACTORIAL NOTATION
Ask: How many different faces can be put together using this database?
(40 × 48 × 56 × 35 × 65 = 244 608 000)
If the witness was positive about the hairline, eyes and eyebrows and nose, there will only be one choice for those features. How many different faces could still be made?
(1 × 1 × 1 × 35 × 65 = 2 275)
11. Confirm that learners know why ‘1’ was used for those choices. It is an important idea throughout this section.
12. Extend this idea further.
13. Consider number plates. Ask: How many possible different number plates there can be in one province?
14. Say: Number plates in South Africa are made up in various ways according to the province. Let’s look at a few possibilities.
Description Example
Type 1 The province (or city) abbreviation and 5 digits CA 56819
Type 2 3 letters of the alphabet, 3 digits and the province abbreviation
DST 551 MP
Type 3 2 letters of the alphabet, 2 digits, 2 letters of the alphabet and the province abbreviation
DG 71 SZ GP
Type 2 and 3: No vowels may be used and the digit zero may not be used.All 3 types: Repeats are allowed.
15. Encourage learners to always make a dash for each possible item that needs to be considered. For example: ___ ___ ___ ___ ___ if five items need considering.
16. Say: Let’s work out how many different number plates each of these rules can make.
For each type, tell learners to make the dashes to represent where different symbols (letters or numbers) could go. In other words, ignore the province or town represented as there are no options for that. However, learners could use ‘1’ option if they wished – it would not be incorrect.

115Grade 12 MATHEMATICS Term 3
TOPIC 3, LESSON 3: THE FUNDAMENTAL COUNTING PRINCIPLE AND FACTORIAL NOTATION
Note: There are some basic facts that learners need to know in this section: z There are 26 letters in the alphabet. 5 of those are vowels and 21 are consonants. z There are 10 digits (zero and 1 – 9) z There are 52 cards in a standard pack of cards. The 52 cards comprise four suits
each: - 13 hearts and 13 diamonds make up 26 red cards - 13 spades and 13 clubs make up the 26 black cards.
Each suit has the Ace and 2 to 10 as well as 3 picture cards – Jack, Queen and King.
Teaching Notes Total different number plates possible
Type 1
There are five place holders for the different options:____ ____ ____ ____ ____Ask: How many digits are there that could go in position 1? (Nine – there are 10 digits in total but zero may not be used) Tell learners to place 9 on the dash.Ask: How many digits are there that could go in position 2? (Nine as repeats are allowed).Tell learners to write 9 on the first dash (place holder).Repeat the question for each place holder.Once all the place holders have a number, tell learners to multiply.
9 × 9 × 9 × 9 × 9= 59 049

116 Grade 12 MATHEMATICS Term 3
TOPIC 3, LESSON 3: THE FUNDAMENTAL COUNTING PRINCIPLE AND FACTORIAL NOTATION
Type 2
There are six place holders for the different options:____ ____ ____ ____ ____ ____Note the bigger space between where letters end and digits begin. This makes it easier for learners.Ask: How many letters are there that could go in position 1? (21 – as vowels may not be used) Tell learners to place 21 on the dash.Ask: How many letters are there that could go in position 2? (21 as repeats are allowed) Ask: How many letters are there that could go in position 3? (21 as repeats are allowed)Ask: How many digits are there that could go in position 4? (9 as repeats are allowed)Ask: How many digits are there that could go in position 5? (9 as repeats are allowed)Ask: How many digits are there that could go in position 6? (9 as repeats are allowed)Once all the place holders have a number, tell learners to multiply.
21 × 21 × 21 × 9 × 9 × 9= 6 751 269
Type 3
There are six place holders for the different options:____ ____ ____ ____ ____ ____Note the bigger spaces again.Ask: How many letters are there that could go in position 1? (21 – as vowels may not be used) Tell learners to place 21 on the dash.Ask: How many letters are there that could go in position 2? (21 as repeats are allowed) Ask: How many digits are there that could go in position 3? (9 as repeats are allowed)Ask: How many digits are there that could go in position 4? (9 as repeats are allowed)Ask: How many letters are there that could go in position 5? (21 as repeats are allowed) Ask: How many letters are there that could go in position 6? (21 as repeats are allowed)Once all the place holders have a number, tell learners to multiply.
21 × 21 × 9 × 9 × 21 × 21= 15 752 961

117Grade 12 MATHEMATICS Term 3
TOPIC 3, LESSON 3: THE FUNDAMENTAL COUNTING PRINCIPLE AND FACTORIAL NOTATION
17. Ask: Based on these possibilities, why did some provinces have to consider making a change to the types of number plates? (They needed to change in order to create more possibilities. There are probably many more cars on the road)
18. Point out to learners that when letters or numbers CAN be repeated, it is in fact the same number that is being repeated; therefore, we can simplify the calculation using exponents. For example, we have the digits 1; 3 and 5 and 7 to make a 4-digit code. How many different codes can be made if digits can be repeated?
___ ___ ___ ___
Ask: How many digits are there that could go in position 1? (4) and position 2? (4) position 3? (4) position 4? (4) Therefore, the number of codes that can be made is: 4 × 4 × 4 × 4 = 256 There is a shorter way of writing this: 44.
19. Look at examples where we may not repeat anything already used:
20. Ask for three volunteers to come and stand at the front of the class. Ask the class: In how many different ways could they stand? Let learners move into different positions for the rest of the class to count the ways – there should be six.
21. Write the word CAT on the board. Ask: How many different ‘words’ (they don’t have to be real) can you form with these letters? You may not repeat letters. Give learners a few minutes to write down as many as they can find. Show the following way using the fundamental counting principle: First make dashes to represent the positions ____ ____ ____ Ask: How many letters could go in position 1? (3 – the C or A or T) Ask: How many letters could go in position 2? (2, because one letter has already been used in position 1) Ask: How many letters could go in position 3? (1, because two letters have already been used in position 1 and 2) Tell learners to multiply. 3 × 2 × 1 = 6. There are six different ‘words’ that can be made with the letters C, A and T.
22. Write the word SAVOURY on the board and repeat the activity. There are 7 × 6 × 5 × 4 × 3 × 2 × 1 = 5 040. There are 5 040 different ‘words’ that can be made from the 7 letters in the word savoury.

118 Grade 12 MATHEMATICS Term 3
TOPIC 3, LESSON 3: THE FUNDAMENTAL COUNTING PRINCIPLE AND FACTORIAL NOTATION
23. Say: The first example was quick and easy to calculate – you didn’t even need a calculator. The second example was quite easy to think about but a little time consuming to put into the calculator. Imagine how long it would take to work out in how many ways we could order the letters of the alphabet!
26 × 25 × 24 × 23 × 22 × 21 × 20……… × 2 × 1
24. Ask: What do the three examples discussed have in common even though we didn’t start with the same number? (Each one of them starts with the number of objects available and each successive (following) number goes down one until we get to 1.)
25. Say: There is a function on the calculator that can assist us in doing these calculations quickly and there is a special name for multiplying a list of numbers in this manner. It is called factorial notation.
26. Learners write: Factorial notation as a heading in their books. Learners also write the explanation: The product of a sequence of descending natural numbers. For example, 4 × 3 × 2 × 1 and this is written as 4!
27. Say: Find the factorial function on your calculator. Look for x! Notice that x! does not have its own button and that the second function key will be required.
28. Learners should try the two previous examples. They should use their calculator and the factorial key to confirm that 3! = 6 and 7! = 5 040 Some learners may want to calculate 26! It is a very large number and will be shown in scientific notation as it is too big for the calculator screen.
29. These different ways of ordering objects have a special name – they are permutations. Learners should write the following in their books: An ordering of n objects is a permutation. In general, the number of permutations of n distinct objects is n! = n × (n - 1) × (n - 2) × (n - 3)……× 3 × 2 × 1.
30. Remind learners that using factorials still incorporates the fundamental counting principle.
31. Ask directed questions so that you can ascertain learners’ level of understanding. Ask learners if they have any questions.
32. Give learners an exercise to complete with a partner.
Walk around the classroom as learners do the exercise. Support learners where necessary.

119Grade 12 MATHEMATICS Term 3
TOPIC 3, LESSON 3: THE FUNDAMENTAL COUNTING PRINCIPLE AND FACTORIAL NOTATION
ADDITIONAL ACTIVITIES/ READING
Further reading, listening or viewing activities related to this topic are available on the following web links:
http://www.classzone.com/eservices/home/pdf/student/LA212AAD.pdf
http://learn.mindset.co.za/sites/default/files/resourcelib/emshare-topic-overview-asset/Maths%2012-3%20A%20Guide%20to%20Counting%20and%20Probability.pdf
http://www.amesa.org.za/AMESA2014/Proceedings/papers/1%20hour%20workshops/8.%20Desiree%20Timmet%20-%20The%20Counting%20principle.pdf
http://virtualnerd.com/algebra-2/probability-statistics/permutations-combinations/counting-outcomes/fundamental-counting-principle-definition
https://www.youtube.com/watch?v=TZj5nrtgol0
https://www.youtube.com/watch?v=bsGmzMpIpD0
(Using the calculator for factorial calculations)
D

TOPIC 3, LESSON 3: SOLVING PROBLEMS USING THE FUNDAMENTAL COUNTING PRINCIPLE
120 Grade 12 MATHEMATICS Term 3
TERM 3, TOPIC 3, LESSON 3
SOLVING PROBLEMS USING THE FUNDAMENTAL COUNTING PRINCIPLE
Suggested lesson duration: 2,5 hours
TOPIC 3, LESSON 3: SOLVING PROBLEMS USING THE FUNDAMENTAL COUNTING PRINCIPLE
A POLICy AND OUTCOMES
CAPS Page Number 49
Lesson ObjectivesBy the end of the lesson, learners should be able to:
z use the fundamental counting principle to solve problems which will include probability.
CLASSROOM MANAGEMENT
1. Make sure that you are ready and prepared.
2. Advance preparation: Work through the lesson plan and exercises.
3. Write the lesson heading on the board before learners arrive.
4. The table below provides references to this topic in Grade 12 textbooks. Plan when you will get learners to practice the concepts learned by completing the exercises. Work through the lesson plan and decide where you will get learners to do the exercises. Indicate this on your lesson plans.
LEARNER PRACTICE
MIND ACTION SERIES
PLATINUM VIA AFRIKA
CLEVER CLASSROOM MATHS
EVERYTHING MATHS
(SIYAVULA)
EX PG EX PG EX PG EX PG EX PG EX PG
345
315319324
56
291293
13.513.6
370373
13.613.713.813.9
367369372377
10.610.710.8
432435439
B

121Grade 12 MATHEMATICS Term 3
TOPIC 3, LESSON 3: SOLVING PROBLEMS USING THE FUNDAMENTAL COUNTING PRINCIPLE
CCONCEPTUAL DEVELOPMENT
INTRODUCTION
1. In the previous lesson learners should have come to an understanding of using the fundamental counting principle to find the number of different ways of ordering objects (permutations).
2. The concept of permutations will be continued and extended in this lesson. Learners will find this challenging if they were not comfortable with the work covered in the previous lesson.
DIRECT INSTRUCTION
Note: Each of the examples below (points 1 – 6) can be changed into learner activities (like the one used in the previous lesson). The examples will assist learners in understanding how the arrangement of objects works. Examples:For the first example (point 1), ask six learners to stand in front of the class and ask how many ways we could arrange them. It is not so easy for learners to keep moving around. After a while, ask learners to stand aside and you choose six positions (perhaps with a marker on the floor). Stand at the first marker/position and ask: How many choices do I have to stand in this position? (6). Step over to the new position and ask:How many choices to do I have to stand in this position? (5), and so on. Say: We will use the counting principle to find the total number of arrangements.Making the different kinds of examples physical (use girls and boys where vowels and consonants are used) will help learners.Using the learners does not mean you shouldn’t do the same examples with words - as below. These still need to be completed.
1. Ask: Find the number of permutations possible using the word PASTOR. (6! = 720)
If any learners still find this challenging, do a few more examples or repeat those from the previous lesson. Use the word PASTOR to demonstrate five more concepts. Learners should write all the examples in their exercise books and they should make notes as the go.

122 Grade 12 MATHEMATICS Term 3
TOPIC 3, LESSON 3: SOLVING PROBLEMS USING THE FUNDAMENTAL COUNTING PRINCIPLE
2. Ask: What if I changed the instruction to - how many different words can we make if the word must start with ‘R’? Say: Draw the dashes and fill in the R on the first one as that must happen – there is no choice.
R ____ ____ ____ ____ ____
Ask: How many letters are there that could go in the first position requiring a letter? (5 – the R has already been used) and position 2? (4) position 3? (3) position 4? (2) position 5? (1)
R 5 4 3 2 1
∴ the number of permutations: 5! = 120
3. Let’s look at some more possible ways to ask this type of question: How many different words can we make if the word must start with ‘R’ and end with ‘P’? Say: Draw the dashes and fill in the R on the first one and the P in the last position as that must happen – there is no choice.
R ____ ____ ____ ____ P
Ask: How many letters are there that could go in the 1st position requiring a letter? (4 – the R and P have already been used) and position 2? (3) position 3? (2) position 4? (1)
R 4 3 2 1 P
∴ the number of permutations: 4! = 24
4. Say: Let’s look at a more unusual question – how many different words can we make if the word must start with a consonant and end with a vowel? Say: Draw your dashes
____ ____ ____ ____ ____ ____
The first and last letters have specific requirements and must therefore be considered first. Ask: How many letters are there that could go in the first position requiring a consonant? (Four – P, S, T or R). How many letters are there that could go in the last position requiring a vowel? (Two – A or O).
4 ____ ____ ____ ____ 2
Remind learners: No matter which letters end up in those positions, TWO letters will now have been used – one in position 1 and one in position 6. Ask: How many letters are there that could go in the first position requiring a letter (position 2)? (Four as two are already accounted for).

123Grade 12 MATHEMATICS Term 3
TOPIC 3, LESSON 3: SOLVING PROBLEMS USING THE FUNDAMENTAL COUNTING PRINCIPLE
How many letters are there that could go in the second position requiring a letter (position 3)? (3) How many letters are there that could go in the third position requiring a letter (position 4)? (2) How many letters are there that could go in the fourth position requiring a letter (position 5)? (1)
4 4 3 2 1 2
(4 × 4 × 3 × 2 × 1 × 2)
∴ the number of permutations: 4 × 2 × 4! = 192 Underline the middle 4 × 3 × 2 × 1 to show where 4! comes from.
5. The next idea we look at is when certain objects need to be grouped together. For example, still using the word PASTOR, let’s use the idea of the vowels needing to be together. The question would read as: How many different arrangements are possible if the vowels must be next to each other? A good way to imagine (and ensure) that the vowels stay together is to think about them as being tied together with an elastic band. The list of letters would then look as follows:
P S T R A O
It is like the vowels are one object - they must move together into a position. The grouped vowels will be treated as ONE item. Ask: How many objects do I have to move around? (Five, because the vowels need to combine into 1) Say: Five is correct, but there is an added complication – do the vowels have to be in the same position we see them in now? (No – they could change positions and still be next to each other!) Tell learners to write 2! inside the vowel group to show the number of ways that they could be arranged. Ask learners to draw the dashes (only five as there are five objects).
____ ____ ____ ____ ____
Ask: How many letters are there that could go in the first position requiring a letter? (Five – any one of the objects is acceptable). Position 2? (4) Position 3? (3) Position 4? (2) Position 5? (1) Remind learners that one of those objects has some arrangement of its own so that needs to be included in the calculation. ∴ the total arrangements possible: 5! × 2! = 240

124 Grade 12 MATHEMATICS Term 3
TOPIC 3, LESSON 3: SOLVING PROBLEMS USING THE FUNDAMENTAL COUNTING PRINCIPLE
6. Repeat the exercise with the requirement that all the consonants are together:
P S T R A O
Remember, these are two separate objects.
Ask: How many objects do I have to move around? (Three because the consonants need to combine into one). Say: Three is correct, but remember the added complication – do the consonants have to be in the same position we see them in now? (No – they could change positions and still be next to each other!). In how many ways could they be arranged inside their own little group? (4!). Tell learners to write that inside the group. Now ask learners to draw their dashes (only three as there are three objects).
____ ____ ____
Ask: How many letters are there that could go in the first position requiring a letter? (Three – any one of the objects is acceptable) and position 2? (2) position 3? (1) Remind learners: One of the objects has some arrangements of its own so that needs to be included in the calculation. ∴ the total arrangements possible: 3! × 4! = 144
7. Ask if there are any questions before you move on to using the skills learned and include finding the probability of possible arrangements occurring.
8. Write the following example on the board and ask learners to write it down and think about how they would answer it.
Consider the word DAUGHTER. a) How many arrangements can be made with the letters in this word?b) How many arrangements can be made that start with a vowel?c) What is the probability that the new word will start with a vowel?
Discuss with learners before asking them to try these on their own. Remind learners to use the dashes to assist them. Ask: How will you find the probability? (The answer to (b) divided by the answer to (a) which represents the total possible outcomes)

125Grade 12 MATHEMATICS Term 3
TOPIC 3, LESSON 3: SOLVING PROBLEMS USING THE FUNDAMENTAL COUNTING PRINCIPLE
Solutions:
a) 8! = 40 320b) 3 × 7! = 15 120
c) ,4032015120
0 375=
9. Ask: Does the probability answer look reasonable considering the number of vowels in the word? (Yes – three of the eight words are vowels and the probability matches that).
Tell learners that they should always look at the answer to confirm whether it makes sense.
10. Point out that this question was set out in a way that it led to what was required to answer the final question. Use one more example to illustrate that this may not always be the case.
Consider the word MACHINERY. Consider the number of different arrangements that could be made using all the letters and find the probability that a word starts with H and ends with a vowel.
Ask learners to write the question down and think about it as they do so. Ask: Although this question looks like less work, can you see that we will still need the total possible permutations as well as the total number of ways a word can start with H and end with a vowel before we can find the probability? Give learners a few minutes to get started on their own. Decide when to help or do the solution for them to check their work.
Solution:
Number of possible permutations (n(S)): 9! = 362 880Number of ways to start with H and end with a vowel (n(E)):
H 7 6 5 4 3 2 1 3
7! × 3 = 15 120
P(start with H and end with vowel) = ,36288015120
0 0417=
Note: S represents sample space and E represents Event.
11. Ask if learners have any questions. Do some fully worked examples from past examinations. Learners should write the worked examples in their exercise books.

126 Grade 12 MATHEMATICS Term 3
TOPIC 3, LESSON 3: SOLVING PROBLEMS USING THE FUNDAMENTAL COUNTING PRINCIPLE
Example 1 Teaching notes
Seven cars, of different manufacturers, of which 3 are silver, are to be parked in a straight line. a) In how many different ways can ALL the
cars be parked?Tell learners to use dashes and consider how many options there are for each place.
b) If the 3 silver cars must be parked next to each other, determine in how many different ways the cars can be parked?
NOV 2014
The three silver cars must be together. Imagine them tied up and made into one object. Think of the new total number of objects but don’t forget that the three silver cars could also be arranged in different ways within their group.
Solution:a) 7! = 7 × 6 × 5 × 4 × 3 × 2 × 1 = 5 040b) Car 1 Car 2 Car 3 Car 4 [Silver Car 1 Silver Car 2 Silver Car 3] [3!]
3! × 5! = 3 × 2 × 1 × 5 × 4 × 3 × 2 × 1 = 720

127Grade 12 MATHEMATICS Term 3
TOPIC 3, LESSON 3: SOLVING PROBLEMS USING THE FUNDAMENTAL COUNTING PRINCIPLE
Example 2 Teaching notes
A group of 3 South Africans, 2 Australians and 2 Englishmen are staying at the same hotel while on holiday. Each person has his/her own room and the rooms are next to each other in a straight corridor.If the rooms are allocated at random, determine the probability that the 2 Australians will have adjacent rooms and the Englishmen will also have adjacent rooms.
MAR 2017
Tell learners to notice immediately that it is a probability question (they should underline the word probability in an exam situation).Therefore, they will need:
z Total possible arrangements with no restrictions
z Total possible arrangements with the restriction given.
This will give the values used to find probability.Encourage learners to continue using dashes and remind them to group together and think of the arrangements inside the groups.
Solution: Working:n(S): 7! = 5 040
7 6 5 4 3 2 1 n (E): 5! × 2! × 2! = 480
SA SA SA AUS AUS ENG ENG 2! 2!
5 4 3 2 1
∴ ( )! ! !
,!
P E 5 2 20 095
7 212# #
= = =

128 Grade 12 MATHEMATICS Term 3
TOPIC 3, LESSON 3: SOLVING PROBLEMS USING THE FUNDAMENTAL COUNTING PRINCIPLE
Example 3 Teaching notes
A Banana Airways aeroplane has 6 seats in each row. a) How many possible arrangements are
there for 6 people to sit in a row of 6 seats?
A straightforward question which should present no complications for learners.
b) Xoliswa, Anees and 4 other passengers sit in a certain row on a Banana Airways flight. In how many different ways can these 6 passengers be seated if Xoliswa and Anees must be seated next to each other?
Remind learners to use the dashes and to group Xoliswa and Anees together. Learners should remember that Xoliswa and Anees can be arranged in more than one way.
c) Mary and 5 other passengers are to be seated in a certain row. If seats are allocated at random, what is the probability that Mary will sit at the end of the row?
MAR 2016
Tell learners to notice immediately that it is a probability question (they should underline the word probability in an exam situation).Therefore, they will need:
z Total possible arrangements with no restrictions (already found in (a))
z Total possible arrangements with the restriction given
This will give the values used to find probability.This question, however, has a different element to it – Mary could be on the left of the row or the right of the row and still be at the end. Ask: What do we do when there is more than one possibility? Think about tree diagrams.(Add the possibilities)Encourage learners to continue using the dashes.

129Grade 12 MATHEMATICS Term 3
TOPIC 3, LESSON 3: SOLVING PROBLEMS USING THE FUNDAMENTAL COUNTING PRINCIPLE
Solution:a) 6! = 6 × 5 × 4 × 3 × 2 × 1 = 720
b) X A P1 P2 P3 P4 2!
5 4 3 2 1
5! × 2! = 240
c) Number of ways Mary could be on the end: 1 5 4 3 2 1 (Mary)
But she could also be at the other end 5 4 3 2 1 1 (Mary)
∴1 × 5! + 5! × 1 = 240
∴ P(Mary will be on the end) = 720
240
3
1=
Example 4 Teaching notes
Nametso may choose DVD’s from 3 categories as listed below:
Drama Romance Comedy• Last Hero
• Midnight
• Stranger Calls
• Missing in
Action
• Only 40
Seconds Left
• One Heart
• You and Me
• Love Song
• Bird’s First
Nest
• Laughing
Dragon
• Falling Down
• Sitting on the
Stairs
a) Nametso must choose one DVD from the Drama category. What is the probability that she will choose Midnight?
Basic probability
b) How many different selections are possible if her selection must include ONE drama, ONE romance and ONE comedy?
Basic use of the fundamental counting principle BUT point out that they will not use factorial notation as there are only three options.Encourage learners to use dashes.

130 Grade 12 MATHEMATICS Term 3
TOPIC 3, LESSON 3: SOLVING PROBLEMS USING THE FUNDAMENTAL COUNTING PRINCIPLE
c) Calculate the probability that she will have Last Hero and Laughing Dragon as part of her selection in (b)?
MAR 2015
NOTE: A copy of the above table has been enlarged
and is provided at the end of the lesson.
This could be calculated using basic probability principles but as learners need to practice the fundamental counting principle, that method should be used today.Tell learners to notice immediately that it is a probability question.Therefore, they will need:
z Total possible arrangements with no restrictions (already found in b)).
z Total possible arrangements with the restriction given.
Encourage learners to use dashes.
Solution:
a) 15
b) 5 4 3
5 × 4 × 3 = 60
c) 1 4 1
(LH) (LD)
∴ P(LH and LD) = 1 4 1 1
60 15
# #=

131Grade 12 MATHEMATICS Term 3
TOPIC 3, LESSON 3: SOLVING PROBLEMS USING THE FUNDAMENTAL COUNTING PRINCIPLE
Example 5 Teaching notes
The digits 1 – 7 are used to create a 4-digit code to enter a locked room. How many different codes are possible if the digits may not be repeated and the code must be an even number bigger than 5 000?
NOV 2016
This scenario creates more than one possibility, so addition will be required.(There is more than one method of doing this, you may want to explore another method yourself).Ask: How many digits can be in the first position? (Three – 5, 6 and 7 will make a number greater than 5 000)Ask: How many digits can be in the last position? (Three – 2, 4 and 6 will make it an even number).Ask: Do you notice a complication? (6 is on both lists).This can be addressed by considering three possibilities: ending in 2, ending in 4 and ending in 6.The case of the number ending in 6 will affect how many digits are available to start the number.Encourage the use of dashes.
Solution:
Ending in 2:
3 5 4 1
Ending in 4:
3 5 4 1
Ending in 6:
2 5 4 1
Start with the 1 possibility in position 4, then show the 3 possibilities in position 1 before filling in the number of digits that would be left over for the middle two positions (after 2 have been used there are 5 then 4 leftover).When 6 is in the last place, there are only 2 digits that can be in position 1 but there are still 5 and 4 digits left for the middle positions.
Number of different codes: (3 × 5 × 4 × 1) + (3 × 5 × 4 × 1) + (2 × 5 × 4 × 1) = 60 + 60 + 40 = 160
12. Ask directed questions so that you can ascertain learners’ level of understanding. Ask learners if they have any questions.

132 Grade 12 MATHEMATICS Term 3
TOPIC 3, LESSON 3: SOLVING PROBLEMS USING THE FUNDAMENTAL COUNTING PRINCIPLE
13. Give learners an exercise to complete with a partner.
14. Walk around the classroom as learners do the exercise. Support learners where necessary.
Enlarged table for Example 4:
Drama Romance Comedy
• Last Hero• Midnight• Stranger Calls• Missing in Action• Only 40 Seconds Left
• One Heart• You and Me• Love Song• Bird’s First Nest
• Laughing Dragon• Falling Down• Sitting on the Stairs
ADDITIONAL ACTIVITIES/ READING
Further reading, listening or viewing activities related to this topic are available on the following web links:
https://www.youtube.com/watch?v=guvaQtcVlM4
https://www.youtube.com/watch?v=fPdYKStm7Nw
https://www.youtube.com/watch?v=Yw-Oaumh2Ww
https://www.youtube.com/watch?v=aegBgqk5jeg
D

TOPIC 3, LESSON 4: REVISION AND CONSOLIDATION
133Grade 12 MATHEMATICS Term 3
TERM 3, TOPIC 3, LESSON 4
REVISION AND CONSOLIDATIONSuggested lesson duration: 2 hours
TOPIC 3, LESSON 4: REVISION AND CONSOLIDATION
APOLICy AND OUTCOMES
CAPS Page Number 49
Lesson ObjectivesBy the end of the lesson, learners will have revised:
z all the concepts required in this topic.
CLASSROOM MANAGEMENT
1. Make sure that you are ready and prepared.
2. Advance preparation: Work through all the questions that learners will be doing.
3. The table below provides references to this topic in Grade 12 textbooks.
LEARNER PRACTICE
MIND ACTION SERIES
PLATINUM VIA AFRIKA
CLEVER CLASSROOM MATHS
EVERYTHING MATHS
(SIYAVULA)
EX PG EX PG EX PG EX PG EX PG EX PG
Rev S ch
325327
Rev 268 Qu’s 296 Rev 376 13.1013.11
380382
10.9 441
B

134 Grade 12 MATHEMATICS Term 3
TOPIC 3, LESSON 4: REVISION AND CONSOLIDATION
C CONCEPTUAL DEVELOPMENT
INTRODUCTION
1. Now that we have worked through a range of concepts, let’s revise and consolidate what we have learnt.
DIRECT INSTRUCTION
1. Ask learners to remind the class what they have learned in this section. Point out issues that you know are important as well as problems that you encountered with your learners.
2. If learners want you to explain a concept again, do that now.
3. Ask learners to do the revision exercise from their textbook. If you have an extra worksheet or a past test paper, this would also be an excellent way for them to consolidate what they have learned. It would also give them the opportunity of knowing what to expect when they must do an assessment.
4. Walk around the classroom as learners do the exercise. Support learners where necessary.