length of the fertile period - milbank memorial fund...average length of the fertile period....
TRANSCRIPT
L E N G T H O F T H E F E R T I L E P E R I O D
R o b e r t G. P o t t e r , Jr.1
I n t r o d u c t i o n
IT is well known that a woman is not equally fertile through
out her menstrual cycle. Only during a relatively short period, approximately in the middle of her cycle, does she
have an appreciable chance of conceiving. The average duration of this “ fertile period” is not known with precision. Yet such knowledge is important in order to be able to specify the relationships of coital frequency to ease of conception or to risk of contraceptive failure. For example, if the fertile period averages 24 hours, then doubling the rate of coitus might approximately double the monthly chance of pregnancy. In contrast, if the fertile period averages 72 hours, or even 48 hours, doubling a coital rate will fall well short of doubling pregnancy chances because of the heightened likelihood that two or more copulations will coincide with the same fertile period. As a second example, in the practice of artificial insemination by donor, it is common procedure to inseminate several times per menstrual cycle at 48 hour intervals. This interval is entirely reasonable if the fertile period lasts 48 hours, but is not short enough if the fertile period lasts only 24 hours.
The most direct approach to estimating the length of the fertile period, and the basis of most estimates, is to measure the useful life of spermatozoa and ova within the female reproductive tract. But such are the difficulties of measurement that published estimates have ranged from 72 hours down to less than 24.2 Most investigators now doubt that the fertile period averages as long as 72 hours. Yet despite three decades of interest in the subject, it remains unsettled whether the fertile period averages closest to 12,24,36 or 48 hours.
1 Office of Population Research, Princeton University. The writer is indebted to W . D. Borrie, A . J. Coale, P. C. Sagi, and C. Tietze for their valuable criticisms.
2 For an early compilation of estimates, see Pearl, Raymond: Natural History of Population. London, Oxford University Press, 1939, p. 67.
133Two investigators, Farris3 and Tietze,4 have used more in
direct approaches. Following distinct lines of attack, they have independently estimated that the fertile period is 24 hours or less.
This paper has three objectives. First, results from studies of the longevity of sperm and ova within the female reproductive tract are briefly reviewed. Second, the focus is shifted to more indirect approaches with special attention paid to Tietze’s scheme of analysis. Finally, Tietze’s scheme of analysis is applied to two additional types of data.
D i r e c t A p p r o a c h
Most published estimates of the length of the fertile period have their origin in efforts to measure the periods during which ova remain fertile and spermatozoa retain their virility within the female reproductive tract. Fairly firm evidence exists that the ovum is typically fertilizable for less than 12 hours after ovulation.5 This period being so brief, the length of the fertile period comes to depend pretty much on the duration of sperm virility within the female. Unfortunately this duration is not known at all precisely and cannot be measured directly. The only practical method of measurement is the period during which spermatozoa continue to show movement, at various sites in the female; but the period of motility is believed to exceed substantially the period of virility, though the precise extent of the differential is conjectural.
3 Farris, Edmond J.: H uman Fertility and Problems of the M ale. White Plains, The Authors’ Press, 1950, p. 191.
4 Tietze, C .: Probability of Pregnancy Resulting from a Single Unprotected Coitus. Fertility and Sterility, September-October, 1960, xi, pp. 485-488. This paper is perhaps the first statistical study devoted entirely to the problem of estimating the length of the fertile period.
5 Rock, J. and Hertig, A. J.: The Human Conceptus during the First Two Weeks of Gestation. American Journal of Obstetrics and Gynecology, 1948, 55, pp. 6-17. E. Potter interprets the research of Hertig and Rock to mean that “ the normal life of the ovum after expulsion from the ovary is limited to 8 hours. After that degenerative changes take place and even though the ovum is fertilized, abortion or malfunction is the usual outcome.” Pathology of the Fetus and the N ewborn. Chicago, The Year Book Publishers, 1952, p. 4. After surveying the literature, Ruben- stein et al. conclude: “ the fertilizable life of the ovum is probably less than 6 hours.” See Rubenstein, E. B.; Strauss, H .; Lazarus, M . L .; and Hankins, H .: Sperm Survival in Women. Fertility amd Sterility, Jan.-Feb., 1951, 2, p. 15.
Length of the Fertile Period
134It is generally agreed that the cervix constitutes a particu
larly favorable site for sperm longevity. According to the researches of Cary,6 Cohen and Stein,7 and Moench,8 sperm survival in the cervix may be put at about 48 hours, though much longer durations are reported as exceptional occurrences. Data pertaining to sperm survival in the uterus or in the oviduct are much more fragmentary. Belonoschkin summarizes the literature in the following way:
Spermia exhibit approximately the following life spans in the various sections of the genitalia: in the vagina, 2 to 4 hours; in the cervix, as long as 72 hours; and in the cavum uteri about 24 hours. The life span in the tubes has not yet been accurately determined; it probably amounts to 48 hours.9
Thus it appears that 48 hours may be regarded as a liberal upper bound for the useful life of spermatoza within the female. If, in addition, the fertility of the ovum lasts only a few hours, toward which consensus now leans, then the fertile period cannot typically endure as long as 72 hours. Indeed doubts are raised about its averaging even 48 hours. However whether the fertile period averages closest to 12,24, or 36 hours remains quite conjectural. Additional evidence is required for a judgment here.
Two I n d i r e c t A p p r o a c h e s
Farris and Tietze utilize more indirect methods to gauge the length of the fertile period. Farris derives an estimate of 12 to 24 hours from his experience with artificial insemination by donor.10 Among patients successfully inseminated, he achieves
6 Cary, W . H .: Duration of Sperm Cell Migration and Uterine Secretions. Journal of the American Medical Association, 1936, 106, p. 2222.
7 Cohen, M . R. and Stein, I. F .: Sperm Survival at Estimated Ovulation Time. Fertility and Sterility, Jan.-Feb., 1951, 2, pp. 20-27; and by the same authors: Sperm Survival at Estimated Ovulation Time: Prognostic Significance, Fertility and Sterility, March-April, 1950, 1, pp. 170-175.
8 Moench, G. L .: The Longevity of the Human Spermatozoa. American Journal of Obstetrics amd Gynecology, 1939, 38, pp. 153-155.
9 Belonoschkin, B .: Determination of the Fertilizing Ability of Sperm. International Journal of Fertility, Jan.-March, 1959, p. 7.
10 Farris, Edmond J.: H uman Fertility and Problems of the M ale. White Plains, The Authors’ Press, 1950, p. 191.
The Milbank Memorial Fund Quarterly
135a pregnancy rate of .55 when inseminations are performed on the “ correct” day as determined by the rat hyperemia test, a relatively exact technique for indicating time of ovulation. The high pregnancy rate of .55 falls away to .00 and .20 when inseminations are performed one day early and one day late.11 However Farris’ results are not to be taken at face value. Most of the patients inseminated 24 hours early or late are patients who have failed to conceive during two or more cycles of insemination performed at supposedly correct times and for this reason may be suspected of subfecundity.12
Recently Tietze, too, has estimated that the fertile period averages 12 to 24 hours.13 To derive his estimate, Tietze brings together data pertaining to coital frequency and speed of conception. Since his procedure offers a point of departure for developing several alternative estimates, it is worth describing in detail. Before this description, however, it is convenient to distinguish additional aspects of the fertile period besides its average length.
S o m e D i m e n s i o n s o f t h e F e r t i l e P e r i o d
One must exercise care in defining what is meant by the average length of the fertile period. Theoretically in any ovulatory cycle there is a point in time, some number of hours before or after ovulation, when coitus has it greatest chance of leading to conception. As the time of coitus deviates from this optimum, the probability of conception decreases. The curve describing this decline might be termed the “ shape” of the fertile period. The area under this curve defines the “ length” of the fertile period, which varies from month to month for the same couple, and of course among couples. Another important as-
11 Potter, Jr., R. G .: Farris’ Formula for Predicting Fertile Days. In C old Spring Harbor Symposia on Q uantitative B iology, Volume x xn , 1957, pp. 178-180. In this experience, 100 pregnancies are achieved in the course of 326 inseminations. The .55 rate refers to frequency of pregnancies during the initial 2 months. As will be discussed later, this rate of .55 is inflated by a tendency for patients to abandon treatment after a few months of unsuccessful insemination.
12 Ibid., pp. 183-185.13 Tietze, op. cit.
Length of the Fertile Period
136pect, and one often overlooked, is the proportion of menstrual cycles during which there exists even a possibility of initiating a detectable pregnancy. During many menstrual cycles such a possibility does not exist: the couple are constrained from intercourse by illness or temporary separation; the cycle is anovulatory; the particular ovum is incapable of fertilization; abortion occurs so early that conception is not recognized; and so forth. During these “ unfavorable” menstrual cycles, one or more conditions make it impossible for any timing of coitus to lead to an identifiable conception.
By and large, when indirect methods of estimation are used, it is not possible to infer the average length of fertile periods without first making assumptions about other aspects, such as typical shape, variation in length, and typical frequency of unfavorable menstrual cycles. Problems of estimation are greatly simplified if one assumes that the fertile period is rectangular in shape, with all the hours of the menstrual cycle classified as either sterile or fertile. Then the length of the fertile period is simply the number of hours, during a favorable menstrual cycle, when the probability of conception is nonzero. Estimation is still further simplified by assuming that the fertile period is constant in length.
The Milbank Memorial Fund Quarterly
T i e t z e ’ s E s t i m a t e
Tietze seeks to determine the range of fertile period length for which data on coital frequency remain consistent with data on monthly chances of pregnancy in the absence of contraception. Assumptions about coital frequency are based on figures reported for the female sample of Kinsey et al,14 The mean monthly chance of conception in the absence of contraception Tietze assumes to be between .2 and .3.15 He posits a constant
14 Kinsey, A. C .; Pomeroy, W . B.; Martin, C. E .; and Gebhard, P. H .: Sexual Behavior in the H uman Female, Philadelphia, W . B. Saunders, 1953, Table 93.
15 The reasons which Tietze advances for choosing a range of 2 to .3 are not altogether convincing. He justifies the lower limit of .2 "mainly on the distribution of intervals between marriage and first birth, and between successive births within the same family, in a carefully studied rural population in the parish of Crulai,
(Continued on page 137)

137intermenstrum of 25 days. This intermenstrum is divided into two subperiods: a fertile period of F days and a sterile period of 25-F days. In other words, the fertile period is assumed constant in length and rectangular in shape. Furthermore every menstrual cycle is viewed as favorable in the sense that one coitus during any part of the fertile period suffices for conception and the resultant pregnancy is always detected.
Two alternative assumptions are made about the manner in which coition is distributed over the intermenstrum; and corresponding to these assumptions are a pair of models originally proposed by Glass and Grebenik.16 In the first model it is assumed that there is an equal chance of coitus taking place at any time during the intermenstrum. Therefore chances of a single coitus occurring outside the fertile period is (25-F )/25, while chances that n coitions will fail to initiate pregnancy are
Normandy, during the period 1674-1742. . . .” The upper limit of .3 he bases on the pregnancy rate, during the first month after deliberately stopping contraceptions, of two groups of urban Americans, totalling 2,677 couples for which combined sample he calculates, in another paper (viz., Differential Fecundity and Effectiveness of Contraception. The Eugenics Review, January, 1959, 50, p. 231) a pregnancy rate of .34.
Yet the range of .2 to .3 does find justification in a forthcoming analysis focused on problems of estimating mean fecundability; see Chapter iv and its accompanying appendix in Westoff, C. F .; Potter, Jr., R. G .; Sagi, P. C .; and Mishler, E. G .: Family Growth in M etropolitan A merica, to be published by Princeton University Press. According to the estimates judged most useful, the proportion of American couples becoming pregnant in the first month of marriage, when not using contraception, ranges from .25 to .30, while the proportion of pregnancies occurring the first month after deliberately stopping contraception ranges from around .30 to .40. Almost certainly these estimates are upwardly biased, in varying degree, as a result of insufficient pains taken to insure that only conceptions coinciding with first menstrual mid-periods after marriage, or after deliberate cessation of contraception, are included, while conceptions occurring during second menstrual mid-periods are excluded, even though many of them occur only? 4 or 5 weeks after marriage or cessation of contraception. When allowance is made for this bias, the range of 2 to .3 appears more reasonable than .3 to .4, though the lower bound of .2 represents a firmer estimate than the upper bound of .3. The consistent tendency for the pregnancy rate to be higher the first month after deliberately stopping contraception, as compared to the first month of marriage before starting contraception, is attributed in the same analysis, to a net balancing of several measurement biases and selectivities with respect to fecundability. In sum, .2 probably underestimates the mean fecundability of urban Americans, while, less assuredly, .3 overestimates it.
16 Glass, D . V. and Grebenik, E .: T he T rend and Pattern of Fertility in Great Britain. Papers of the Royal Commission on Population, Vol. 6, London, H.M.S.O., 1954, Part i, p. 255.
Length of the Fertile Period
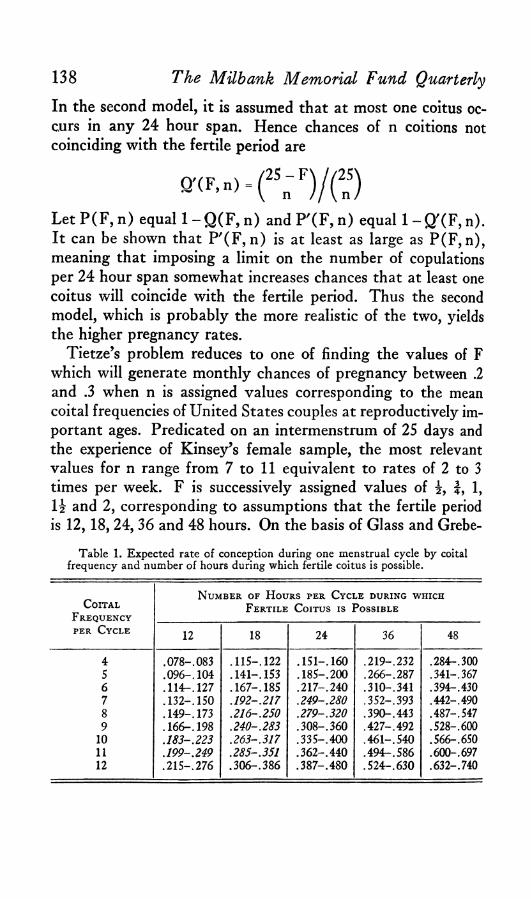
138In the second model, it is assumed that at most one coitus occurs in any 24 hour span. Hence chances of n coitions not coinciding with the fertile period are
The Milbank Memorial Fund Quarterly
Q '(F ,n )
Let P(F, n) equal 1 -Q (F , n) and P '(F , n) equal 1 -Q '(F , n). It can be shown that P '(F, n) is at least as large as P(F, n), meaning that imposing a limit on the number of copulations per 24 hour span somewhat increases chances that at least one coitus will coincide with the fertile period. Thus the second model, which is probably the more realistic of the two, yields the higher pregnancy rates.
Tietze’s problem reduces to one of finding the values of F which will generate monthly chances of pregnancy between .2 and .3 when n is assigned values corresponding to the mean coital frequencies of United States couples at reproductively important ages. Predicated on an intermenstrum of 25 days and the experience of Kinsey’s female sample, the most relevant values for n range from 7 to 11 equivalent to rates of 2 to 3 times per week. F is successively assigned values of f, 1, l i and 2, corresponding to assumptions that the fertile period is 12, 18,24,36 and 48 hours. On the basis of Glass and Grebe-
Table 1. Expected rate of conception during one menstrual cycle by coital frequency and number of hours during which fertile coitus is possible.
CoitalN umber of H ours per Cycle during which
F ertile Coitus is Possible
per Cycle 12 18 24 36 48
4
ooOfooo
.115 -.122 .15 1 -.160 .219-.232 .284-. 3005 .09 6 -.104 .141-.153 .18 5 -.200 .266-.287 .341-.3676 .11 4 -.127 .167-.185 .21 7 -.240 .310-.341 .394-.4307 .13 2 -.150 .1 92 -.2 17 .249-.280 .352-.393 .442-.4908 .149-.173 .216 -.250 .279-.320 .390-.443 .487-.5479 .166-.198 .240 -.283 .30 8 -.360 .427-.492 .528-.600
10 .183 -.223 .263 -.3 17 .33 5 -.400 .46 1 -.540 .566-.65011 .199 -.249 .285-.351 .3 6 2 -.440 .49 4 -.586 .600-. 69712 .21 5 -.276 .3 0 6 -.386 .3 8 7 -.4 8 0 .52 4 -.630 .632-.740
139nik’s models, two fecundabilities (monthly probabilities of pregnancy) are calculated for each pair of F and n values. Tietze’s results are duplicated in Table 1. Quite clearly, for the most appropriate coital frequencies, it is fertile periods of 12-24 hours that yield conception rates of .2 to .3, while longer fertile periods, say 36 or 48 hours, yield excessively high estimates of fecundability.
Length of the Fertile Period
A p p r a i s i n g T i e t z e ’ s E s t i m a t e
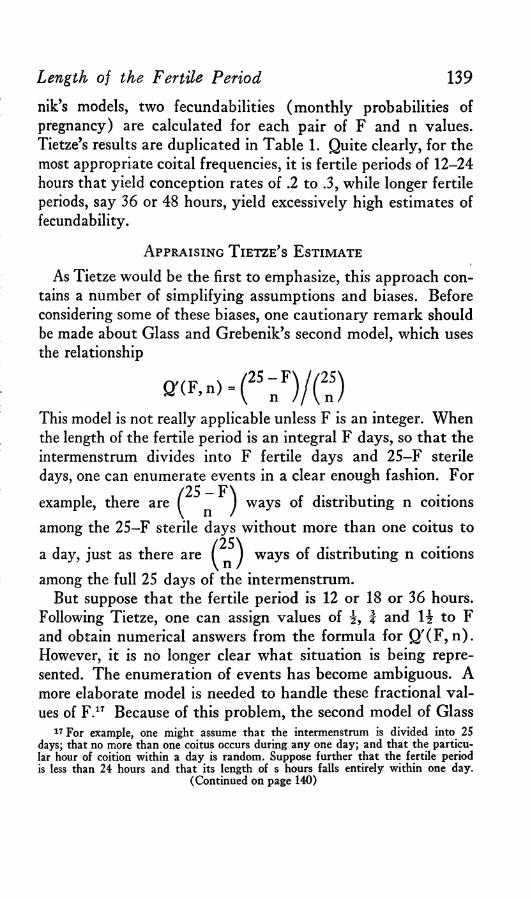
As Tietze would be the first to emphasize, this approach contains a number of simplifying assumptions and biases. Before considering some of these biases, one cautionary remark should be made about Glass and Grebenik’s second model, which uses the relationship
Q '(F ,n )
This model is not really applicable unless F is an integer. When the length of the fertile period is an integral F days, so that the intermenstrum divides into F fertile days and 25—F sterile days, one can enumerate events in a clear enough fashion. Forexample, there are ways of distributing n coitionsamong the 25—F sterile days without more than one coitus toa day, just as there are ways of distributing n coitionsamong the full 25 days of the intermenstrum.
But suppose that the fertile period is 12 or 18 or 36 hours. Following Tietze, one can assign values of i , f and I f to F and obtain numerical answers from the formula for Q '(F, n). However, it is no longer clear what situation is being represented. The enumeration of events has become ambiguous. A more elaborate model is needed to handle these fractional values of F.17 Because of this problem, the second model of Glass
17 For example, one might assume that the intermenstrum is divided into 25 days; that no more than one coitus occurs during any one day; and that the particular hour of coition within a day is random. Suppose further that the fertile period is less than 24 hours and that its length of s hours falls entirely within one day.
(Continued on page 140)
140and Grebenik will not be used, in later sections of this paper, except in connection with fertile periods of 24, 48, or 72 hours length. Fortunately, fractional values of F do not present a problem for the first model of Glass and Grebenik.
Turning to the question of biases inherent in Tietze’s approach, one of these biases works toward an exaggeration of fertile period length.18 Some couples deliberately increase their coital frequency during that part of the menstrual cycle which they believe to be most fertile. It is not known what proportion of couples in the United States have accurate information about the positioning of the fertile period in the menstrual cycle or what proportion, having this knowledge, use it to regulate their intercourse when trying to become pregnant. If this proportion is appreciable, then the average fecundabilities of .2
Then the probability of a coitus coinciding with the fertile period is (s/24)P '(l,n ). This follows since P '(l,n ) represents the probability of a coitus coinciding with the day containing the fertile period and given that event, the probability that the coition will coincide with one of the s fertile hours is s/24. Fecundability values obtained in this manner, with s set equal to J and J, prove barely lower than those obtained by Tietze when he assigns values of i and | to F in the formula for Q'CFjn). Hence the qualification probably has little substantive importance.
The above logic may be adapted to handle fraction values of F between 1 and 2, but the calculation of fecundabilities becomes more tedious and does not produce unique results unless the position of the fertile period relative to the grid of 24-hour spans is made rigid.
18 One simplifying assumption implicit in Tietze’s approach, namely that heightened coital frequency does not adversely affect male virility, appears warranted for most males, except perhaps when very high frequencies are involved. In a series of articles published in Fertility and Sterility, J. MacLeod and R. Z. Gold have shown, in a convincing way, that sperm count is a secondary factor except when it falls below a minimum, estimated to be in the neighborhood of 20 million sperms per c.c. or 60 million total. Given a sperm count above this minimum, the important factors for virility— among those few factors measurable in large samples— become the percentage of active sperms and the character of their movement. Heightened coital frequency does not appear to penalize either quality. Furthermore, coital frequencies of 3 or 4 times per week do not depress the sperm counts of most males below, or even near, critical levels. Of special relevance, among several pertinent articles, is “The Male Factor in Fertility and Infertility: Semen Quality in Relation to Age and Sexual Activity.” Fertility and Sterility, January-February, 1953, 4, pp. 10-33. For the oligospermatic male who barely meets, or fails to meet, the minimum sperm count even after several days of continence, increases from moderate to high coital frequencies may lower conception chances. Cf. Farris, Edmond J.: H uman Fertility and Problems of the M ale, pp. 101-119. The incidence of oligospermatic males in the general population is not known. MacLeod and Gold find that 7 per cent of the husbands from 936 fertile unions have total sperm counts below 50 million while the corresponding frequency among husbands from 783 infertile unions is 15 per cent: Spermatozoon Counts in 1,000 Men of Known Fertility and in 1,000 Cases of Infertile Marriages. Journal of Urology, 1951, 66, p. 439.
The MUbank Memorial Fund Quarterly

to .3 are being generated by shorter fertile periods than would otherwise be the case.
Most of the other biases appear to be working in the opposite direction, that is, they favor underestimation of the fertile period. On the basis of calculations, summarized in the Appendix, the tentative conclusion is that three of these downward biases are of secondary magnitude. They are biases arising from assumptions (1 ) that the fertile period is constant in length; (2 ) that it is rectangular in shape; and (3) that all couples have the same coital frequency, rather than frequencies varying around a stipulated mean.
However even if the judgment is correct that these listed biases are minor, there remains one reason for suspecting that Tietze’s estimate of 12 to 24 hours is low. Tietze assumes that every menstrual cycle contains a fertile period of such character that one coitus during it suffices to initiate pregnancy and this pregnancy is always recognized. As noted already, many more conditions than an optimally timed copulation are required to produce an identifiable gestation. The male partner must be able to deposit sperm of sufficient volume and quality. The menstrual cycle must be ovulatory. Upon ovulation, the extruded ovum must reach the Fallopian tubes and from there, fertilized, it must pass to the uterus, implant, and endure long enough for pregnancy to be detected. If the percentage of unfavorable cycles, lacking one or more of these prerequisites, is small, then the fertile period may be as short as Tietze estimates it to be. However, if the percentage of unfavorable menstrual cycles is one half or more, then the fertile period probably averages nearer 36 hours than 18.
Unfortunately the frequency of unfavorable cycles is not known within a wide range. The incidence of seriously sub- fertile husbands is probably quite low, at least in samples of couples who are demonstrating their fertility by having another pregnancy. Presumably too, the proportion of menstrual cycles during which illness or temporary separation compel continence is fairly low. The rate of anovulatory cycles is usually put at
Length of the Fertile Period 141
142around 5 per cent, and higher for subfecund women.19 How frequently accidents befall ova between ovaries and Fallopian tubes is unknown.20 It is thought by some experts that many ova reaching the tubes are incapable of fertilization, though a quantitative estimate of their frequency is not available.21
However, of all the factors contributing to unfavorable menstrual cycles, perhaps the most important is early foetal wastage. Numerous studies indicate that 10 per cent of all recognized pregnancies end in spontaneous abortion, with the highest wastage rates experienced in the second and third months of pregnancy.22 It is generally believed that the true wastage rate is highest in the first month and appears lower only because of the difficulty of detecting early miscarriages. It is also generally agreed that the majority of early foetal deaths are attributable to constitutional defects of the ovum and a lesser frequency
The Milbank Memorial Fund Quarterly
19 Basal body temperature and endometrial biopsy have been the two means commonly used to measure incidence of anovulation. Though the two methods have given consistent results, the possibility that both are downwardly biased cannot be excluded. Several studies indicate frequencies below 10 per cent for regularly menstruating women in the 20’s or early 30’s. See the review articles: Wong, A.S.H.; Engle, E. T . and Buxton, C. L .: Anovulatory Menstruation in Women. American Journal of Obstetrics and Gynecology, 1950, 60, pp. 790-797, and Tompkins, P.: Endometrial Biopsy Determination of Incidence of Ovulation in 402 Regularly Menstruating Women. Fertility and Sterility, January-February, 1953, 4, pp. 76-79. Data showing that anovulation increases at either end of the reproductive span is given in Collett, M . E .; Wertenberger, G. E.; and Fiske, V. M .: The Effect of Age upon the Pattern of the Menstrual Cycle. Fertility and Sterility, September-October, 1954, 5, pp. 437-448. That frequent anovulation is also one symptom of subfecundity is documented by Rock, J.; Bartlett, M . K .; and Matson, D. D .: The Incidence of Anovulatory Menstruation among Patients of Low Fertility. American Journal of Obstetrics and Gynecology, 1939, 37, pp. 3-12.
20 Whether or not this loss is consequential is debated in the following article and its accompanying discussion, Westman, A .: Investigations into the Transport of the Ovum. In Engle, Earl T . (e d .): Studies on T estis and Ovary Eggs and Sperm. Springfield, 111., Charles C. Thomas, 1952, pp. 163-175.
21 See Witschi, E .: Overripeness of the Eggs as a Cause of Twinning and Terato- genesis: A Review, Cancer Research, November, 1952, 12, pp. 763-786. Witschi makes much of the fact “ that in all carefully investigated polyovular mammals at least one-third of ovulated eggs either are not fertilizable or produce grossly abnormal embryos,” ibid., p. 775. H e also believes that the work of A. T. Hertig and J. Rock (cited below) proves that this generalization applies to the human female. See also the review article of L. B. Shettles: The Ovum in Infertility, Abortion, and Developmental Anomaly. Fertility and Sterility, Nov.-Dee., 1956, 7, pp. 561-571.
22 Foetal, Infant and Early C hildhood M ortality, Vol. i. New York, United Nations, 1954, ST/SOA/Series A /1 3 , pp. 14-16.
143to deficiencies in the maternal environment.23 One expert, reviewing the literature in 1954, concluded that “ the total prenatal loss may be as low as 20 and as high as 70 per cent of all conceptions.”24
Only one authoritative estimate exists of the incidence, among fertile women, of fertilized ova destined to abort. Over a 17 year period, Hertig and Rock have recovered 34 early concep- tuses from 210 patients. Ten of the 34 fertilized ova, or approximately 30 per cent, have been interpreted as so abnormal as to run a high risk of aborting.25
The 34 conceptuses actually came from a smaller group of 107 patients who satisfied three conditions making it much more likely that fertilized ova would be recovered. First, each of the women gave evidence of having ovulated during the menstrual cycle in which the operation occurred. Second, each reported having intercourse within 24 hours before or after ovulation as judged from the endometrial morphology. Third, all these women appeared free of pathological conditions in the tubes, ovaries, or uterus that would interfere with conception. In addition, all had previous pregnancies. Their ages, ranging from 25 to 43, averaged 33 years, and, more important, the 24 women producing normal ova averaged about the same
23 In 3 studies, the proportions of early abortions ascribed to “ defective germ plasm” are .85, .63, and .66, based on sample sizes of 104, 979, and 791 respectively: ibid., p. 16. See also Corner, G. W . and Bartelmez, G. W .: Early Abnormal Embryos of the Rhesus Monkey. In Engle, E. T . (e d .) : Pregnancy W astage. Springfield, 111., Charles C. Thomas, 1953, pp. 3-8.
24 Foetal, Infant and Early C hildhood M ortality. Vol. i, p. 1.25 Thirteen of the 34 ova, or 38 per cent, are considered abnormal in some degree
or other. See Hertig, A . T .; Rock, J. and Adams, E. C .: A Description of Human Ova within the First 17 Days of Development. American Journal of Anatomy, 1956, 98, p. 438. Ten of the 34 early conceptuses appear destined for abortion, with or without clinical signs of pregnancy. See Hertig, A. T .; Rock, J.; Adams, E. C. and Menkin, M . C .: Thirty-Four Fertilized Ova, Good, Bad, and Indifferent, Recovered from 210 Women of Known Fertility. Pediatrics, January, 1959, 23, p. 205. Based on a somewhat smaller experience of 28 early conceptuses recovered from 136 patients, the same investigators interpreted 12 ova (43 per cent) as abnormal in some degree, of which 7 ova (25 per cent) seemed so abnormal as to be certain of aborting. These 7 they subclassified into 4 (14 per cent) liable to abort v/ithout clinical signs of pregnancy and 3 (11 per cent) liable to abort with pregnancy manifest. See Hertig, A . T . and Rock, J.: A Series of Potentially Abortive Ova Recovered from Fertile Women Prior to Their First Missed Menstrual Period. American Journal of Obstetrics and Gynecology, 1949, 58, p. 986.
Length of the Fertile Period
age (33.8 years versus 33.1) as the 10 women producing abnormal ova.26
Among the 107 patients, one factor greatly affecting chances of recovering an ovum was the stage of development of that ovum at the time of operation. Chances of recovery are slim while the ovum is still in the tubes or during the first 2 or 3 days of implantation. Chances are higher during a brief period when the ovum is free in the uterus, just prior to implantation. Recovery becomes relatively assured only when the ovum is well implanted.27 Four of 8 tubal ova proved abnormal, but such a small sample does not yield trustworthy inferences. Thirty-six of the patients were operated upon late enough in the menstrual cycle so that theoretically a fertilized ovum had time to become well implanted if it was going to. From these 36 women, 21 early conceptuses were collected. Six of the 21 ova appeared fated to abort, a rate of foetal wastage of 28.6 per cent.28 This wastage rate does not include fertilized ova failing to implant. Hence the total rate of foetal wastage may exceed 30 per cent. However this conclusion is uncertain because the lower bound of 28.6 per cent, based on only 21 cases, is subject to a large sampling error.29
In view of all these factors that can prevent the initiation of an identifiable pregnancy during a particular menstrual cycle —forced continence, anovulation, lost ova, failures of fertilization, and early foetal wastage—it is unlikely that the incidence of unfavorable menstrual cycles is less than twenty per cent and may be as high as 50 per cent or more. In brief, as stated at the outset, the frequency of unfavorable menstrual cycles is not known within a wide range. Tietze’s estimate of 12-24
26Hertig and Rock, Thirty-Four Fertilized Ova . . . , Pediatrics, January, 1959, 23, pp. 204-205.
27 Ibid., pp. 204-206.28 Ibid., p. 206.29 Given random samples of this size, one can expect to observe, about once in 40
times, a rate of .286 or higher even though the population rate is only .14 per cent. Under the same sampling conditions, one may expect, about once in 40 times, to observe a rate of .286 or more even though the population rate is .50 per cent. These proportions have been derived by setting p + 2 (p q /2 1 )i and p '-2 (p 'q '/2 1 )* equal to .286 and solving for p and p'.
144 The Milbank Memorial Fund Quarterly
hours as the length of the fertile period is correspondingly uncertain. Possibly the fertile period is 18 hours or less if the proportion of unfavorable menstrual cycles is something like one-fifth or one-quarter and if an important fraction of United States wives possess, and use, accurate information about the positioning of the fertile period within the menstrual cycle. Possibly too the fertile period is nearer 36 hours if deliberate timing of intercourse has only secondary importance and if the fraction of unfavorable menstrual cycles exceeds one-half. Clearly, additional data are needed to settle whether the fertile period averages nearer 18 or 36 hours.
E x p e r i e n c e w i t h A r t i f i c i a l I n s e m i n a t i o n b y D o n o r
Additional evidence comes from the practice of artificial insemination by donor. Before considering the experience of E. J. Farris, attention will be given to reports by five physicians: A. F. Guttmacher, J. O. Haman, S. J. Kleegman, L. Portnoy, and F. C. Shields. These physicians, who perform several inseminations per menstrual cycle, at 48 hour intervals, start these inseminations early enough and continue them long enough to be confident of bracketing the fertile period.80 This practice of multiple inseminations is made necessary by the unreliability of available techniques for dating ovulation.
Of interest is the proportion of fecund patients who become pregnant during the first month of treatment when inseminations are performed at 48 hour intervals. This figure cannot be estimated directly, though two calculations yield upper and lower bounds for it. In the five series combined, the proportion of pregnancies occurring in the first month of insemination is .39, based on 374 pregnancies, with an approximate standard error of .025. This proportion may be interpreted as an overestimate of the figure desired because of a tendency for patients to drop out after a few months of unsuccessful treatment, so that only patients who become pregnant fairly promptly are
30 These five series and two others are compared in Potter, Jr., R. G .: Artificial Insemination by Donors. Fertility and Sterility, January-February, 1958, 9, pp. 37-53.
Length of the Fertile Period 145
146included in the calculation. Alternatively, when all 534 patients are taken as the base, 27 per cent become pregnant in the first month of insemination. This proportion, with an approximate standard error of .019, affords an underestimate inasmuch as some of the patients are sterile.
In the five series under review, then, the mean fecundability of the nonsterile patients may be estimated as between .27 and .39. If the fraction of sterile patients is small, as seems likely, then the correct value is close to .27. Almost certainly it is well under .39, say .33 or less, because of the many patients who drop out after a few months of treatment.31
For the sake of illustration, accept .3 as a provisional estimate of the mean fecundability of patients inseminated every 48 hours. Still one cannot draw inferences about the length of the fertile period without first assuming something about the frequency of unfavorable menstrual cycles. If this incidence is taken as 20 per cent, probably a low estimate, then one must posit an 18 hour fertile period, derived from the equation
(x/48) .8 = .3 x= 18.
Alternatively, if one assumes that half or more of all menstrual cycles are unfavorable, then one must postulate a fertile period
31 Only Kleegman’s report contains full information about patient drop-out. Of 116 patients, 42 fail to become pregnant and of these latter, 28 have abandoned treatment by the end of the 4th month. Clearly, if all her patients had been willing to continue treatment for a year, if necessary, the proportion eventually becoming pregnant might have been considerably higher than the 64 per cent observed. This conclusion is reinforced by the fact that the three physicians who mention early patient loss as a problem— namely, Guttmacher, Kleegman, and Portnoy—succeeded in impregnating only .55 to .68 of their patients, whereas the other two physicians, Haman and Shields, report proportions of .76 and .78.
It is plausible but not demonstrable that the fraction of sterile patients is low in the five series. Theoretically, a wife is not accepted for treatment unless her husband is found sterile and she herself appears capable of bearing a child. If prognosis of the husband as sterile could be regarded as always reliable, then one could reasonably infer that the wife, despite her history of infertility, has no greater chance of being sterile than a woman of her age in the general population; and this chance of sterility is quite low for women in their twenties and early thirties. However, in unknown degree the tests performed on the husbands are misleading. Further, the standards of fitness required of the patients themselves vary greatly from one practice to another. It is not even certain that all the donors are virile, precautions notwithstanding.
The Milbank Memorial Fund Quarterly
147of 30 hours or more. This range of 18 to 30 hours is somewhat high or low depending on whether the mean fecundability of patients inseminated every 48 hours is below or above .3. In sum, these results based on five series of artificial inseminations, by donor corroborate, but do not extend, the results obtained by Tietze.
Additional implications about the length of the fertile period, and also about the incidence of unfavorable menstrual cycles, are gained by considering a sixth series accumulated by Farris. In this series at most one insemination is performed per menstrual cycle, with this insemination timed by his relatively precise rat hyperemia test. (Since this technique of dating ovulation requires a special colony of rats, it is not practical for the physician.) No insemination is performed during a month when the patient exhibits certain patterns of hyperemic reaction. Farris claims that past experience has shown that these patterns are incompatible with pregnancy. Thus Farris may have a means of avoiding useless insemination during some of the unfavorable menstrual cycles.32
On the basis of 232 inseminations, nearly all of them representing first or second months of treatment, performed on successfully treated patients, Farris and his coworkers achieved 128 pregnancies, for a pregnancy rate of .55.33 Although his pregnancy rate during first months of insemination cannot be
32 Two articles containing description of Farris’ procedures are his: A Test for Determining the Time of Ovulation and Conception in Women. American Journal of Obstetrics and Gynecology, 1946, 52, pp. 14-27 and The Prediction of the Day of Human Ovulation by the Rat Test as Confirmed by 50 Conceptions, ibid., 1948, 56, pp. 347-352. See also relevant sections of his H uman Ovulation and Fertility. Philadelphia, Lippincott, 1956. The most searching appraisal of the rat test is reported in Corner, G. W .; Farris, E. J.; and Corner, Jr., G. W .: The Dating of Ovulation and Other Ovarian Crises by Histological Examinations in Comparison with the Farris Test. American Journal of Obstetrics and Gynecology, 1950, 59, pp. 514-528. For additional comment, see Potter, Jr., R. G .: Farris’ Formula for Predicting Fertile Days. C old Spring H arbor Symposia on Quantitative B iology, Vol. 22, 1957, pp. 176-185.
33 In 1957, the writer estimated that on the basis of 154 inseminations, performed at estimated optimum time, Farris and his co-workers had produced 84 pregnancies: op. cit., p. 179. Subsequently, in a personal communication, Dr. Farris reported 44 additional pregnancies preceded by 80 inseminations. For more data on a total experience of 162 conceptions by insemination, see Farris, E. J.: The Period of Human Ovulation and a Consideration of the Fertile and Infertile Periods. Acta Endocrmologica Supplementum, 1956, 28, pp. 114-120.
Length of the Fertile Period
148calculated exactly, presumably it is somewhat higher than .55.
The difference between a rate of .55 based on 128 pregnancies and one of .39 based on 374 is highly significant statistically.34 Data are not available to estimate the proportion of Farris’ patients who become pregnant the first month of insemination, to compare with the .27 calculated for the other five series. One might assume that the proportion of pregnancies occurring in the first month has the same ratio in Farris’ practice to the proportion of patients becoming pregnant in one month of treatment as in the other five practices. That is, one might multiply Farris’ pregnancy rate of .55 by (.27/.39) to obtain .38. Quite likely this estimate is low. Farris’ loss of fecund patients through drop-out is relatively low if only because he achieves so many quick impregnations. The incidence of reproductive pathology may also be relatively high among Farris’ patients, excepting comparison with Portnoy’s sample.35 Hence the proportion of Farris’ fecund patients becoming pregnant in the first month is probably above .40 but several points below .55, say for purposes of discussion .4 to .5.
Now if the rat hyperemia test is as accurate a means of dating ovulation as its originator believes, then a pregnancy rate of .4 to .5 may approach the maximum possible, thereby implying an incidence of unfavorable cycles of around 50 to 60 per cent. This conclusion, if tempting, is risky. The rat hyperemia test is subject to error having a standard deviation of several hours at least; and to this error must be added the possibility of a several hour bias.36 In addition, Farris and his coworkers cannot always arrange to have the time of insemination coincide with the time indicated as best by the rat test. On this ground, the maximal pregnancy rate might be well over .5. On the other hand, Farris withholds insemination in roughly one out of five cycles which appear unfavorable and by this means raises to an unknown extent his pregnancy rate. Despite these uncertainties, Farris’ experience lends added plausibility
34 The associated critical ratio exceeds 3.35 Potter, Jr., R. G .: Artificial Insemination by Donors, p. 40.36 Potter, op. cit., pp. 178-179.
The Milbank Memorial Fund Quarterly
to the idea that the incidence of unfavorable cycles may be as high as one-half.
The fact that Farris obtains a higher pregnancy rate than do the five physicians inseminating at 48 hour intervals implies, plainly enough, that during a menstrual cycle the probability of conception does not remain near peak values for as long as 48 hours. In addition, the difference in pregnancy rates is consistent with, but does not prove, the hypothesis that the fertile period averages well under 48 hours.37
C o n c e p t i o n D e l a y s a s A f f e c t e d b y C o i t a l F r e q u e n c y
The last type of data to be considered is the pregnancy rates of women reporting different coital frequencies, in the absence of contraception. As noted already, the results of MacLeod and Gold suggest that male virility is not ordinarily jeopardized by increased sexual activity except possibly when the male is oligospermatic or when the increase is to very high coital frequencies. Nevertheless there is one reason for not expecting increases in coital frequency to produce commensurate increases in fecundability. As coital frequency increases, so does the chance of 2 or more coitions coinciding with the same fertile period, with all but the first of this set of coitions rendered in some degree superfluous. Furthermore, the longer the fertile period, the more important this attenuating factor. Thus the extent to which coital frequency differentiates conception delays offers an additional clue as to the length of the fertile period.
For United States couples, only three sets of conception delays have been found that are classifiable by coital frequency. These three series are first reviewed. Next, under Tietze’s simplifying assumptions, the models of Glass and Grebenik are used to compute hypothetical conception delays as differentiated by coital frequency. Finally, from the comparison of empirical and hypothetical values, implications are drawn about
37 If one assumes that the fertile period is nearly rectangular in shape, then the implication of a length well under 48 hours follows. But other shapes can be stipulated which could give the observed difference in pregnancy rates even though the area under the curve defining conception chances totaled more than 48 hours.
Length of the Fertile Period 149
ISO The Milbank Memorial Fund Quarterly
CoitalFrequency
N umber of Pregnancies
M ean C onception D elay
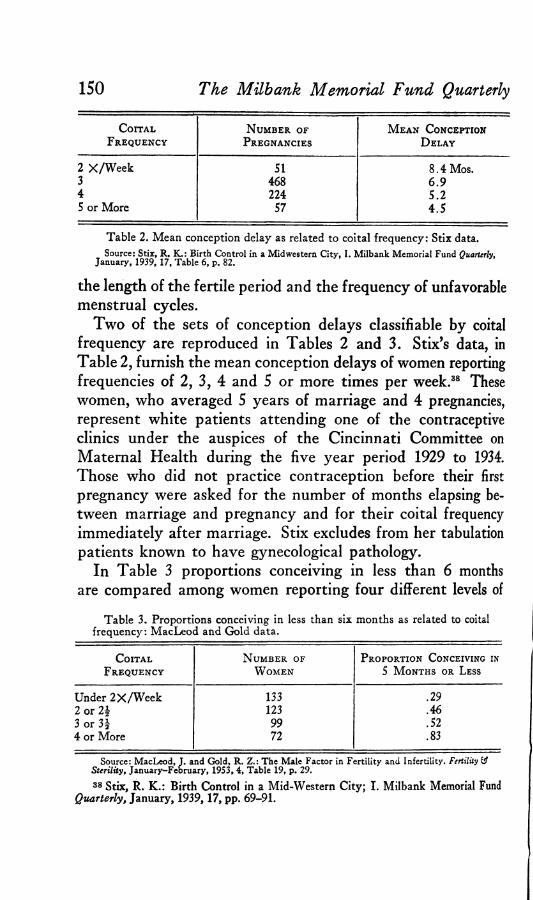
2 X /W e e k SI 8 .4 Mos.3 468 6 .94 224 S.25 or More 57 4.S
Table 2. Mean conception delay as related to coital frequency: Stix data.Source: Stix, R. K.: Birth Control in a Midwestern City, I. Milbank Memorial Fund Quarterly,
January, 1939, 17, Table 6, p. 82.
the length of the fertile period and the frequency of unfavorable menstrual cycles.
Two of the sets of conception delays classifiable by coital frequency are reproduced in Tables 2 and 3. Stix’s data, in Table 2, furnish the mean conception delays of women reporting frequencies of 2, 3, 4 and 5 or more times per week.38 These women, who averaged 5 years of marriage and 4 pregnancies, represent white patients attending one of the contraceptive clinics under the auspices of the Cincinnati Committee on Maternal Health during the five year period 1929 to 1934. Those who did not practice contraception before their first pregnancy were asked for the number of months elapsing between marriage and pregnancy and for their coital frequency immediately after marriage. Stix excludes from her tabulation patients known to have gynecological pathology.
In Table 3 proportions conceiving in less than 6 months are compared among women reporting four different levels of
Table 3. Proportions conceiving in less than six months as related to coital frequency: MacLeod and Gold data.
C oitalFrequency
N umber of W omen
Proportion Conceiving in 5 M onths or Less
Under 2 X /W e e k 133 .292 or 2\ 123 .463 or 3£ 99 .524 or More 72 .83
Source: MacLeod, T. and Gold, R. Z.: The Male Factor in Fertility and Infertility. Fertility & Sterility, January-February, 1953, 4, Table 19, p. 29.
38 Stix, R. K .: Birth Control in a Mid-Western City; I. Milbank Memorial Fund Quarterly, January, 1939, 17, pp. 69-91.
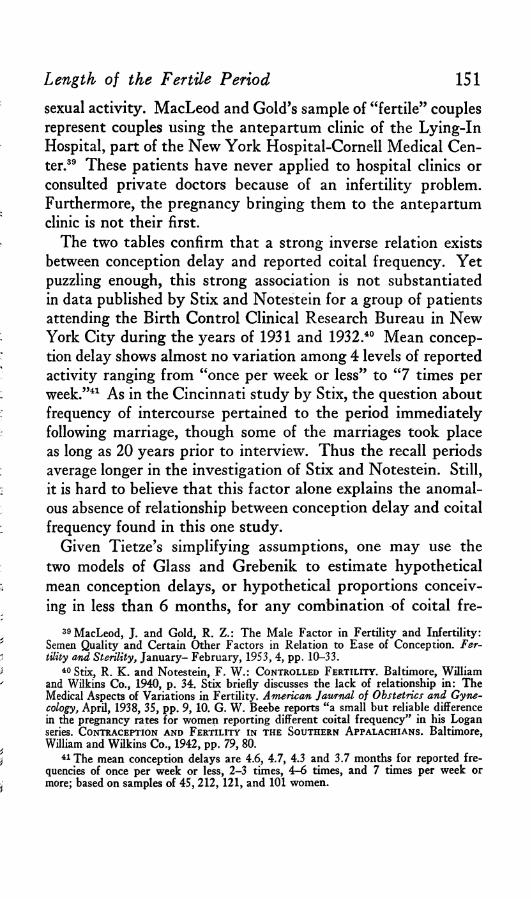
151sexual activity. MacLeod and Gold’s sample of “ fertile” couples represent couples using the antepartum clinic of the Lying-In Hospital, part of the New York Hospital-Cornell Medical Center.39 These patients have never applied to hospital clinics or consulted private doctors because of an infertility problem. Furthermore, the pregnancy bringing them to the antepartum clinic is not their first.
The two tables confirm that a strong inverse relation exists between conception delay and reported coital frequency. Yet puzzling enough, this strong association is not substantiated in data published by Stix and Notestein for a group of patients attending the Birth Control Clinical Research Bureau in New York City during the years of 1931 and 1932.40 Mean conception delay shows almost no variation among 4 levels of reported activity ranging from “ once per week or less” to “ 7 times per week.”41 As in the Cincinnati study by Stix, the question about frequency of intercourse pertained to the period immediately following marriage, though some of the marriages took place as long as 20 years prior to interview. Thus the recall periods average longer in the investigation of Stix and Notestein. Still, it is hard to believe that this factor alone explains the anomalous absence of relationship between conception delay and coital frequency found in this one study.
Given Tietze’s simplifying assumptions, one may use the two models of Glass and Grebenik to estimate hypothetical mean conception delays, or hypothetical proportions conceiving in less than 6 months, for any combination of coital fre-
39 MacLeod, J. and Gold, R. Z .: The Male Factor in Fertility and Infertility: Semen Quality and Certain Other Factors in Relation to Ease of Conception. Fertility and Sterility, January- February, 1953, 4, pp. 10-33.
40 Stix, R. K . and Notestein, F. W .: Controlled Fertility. Baltimore, William and Wilkins Co., 1940, p. 34. Stix briefly discusses the lack of relationship in: The Medical Aspects of Variations in Fertility. American Jatvrnal of Obstetrics and Gynecology, April, 1938, 35, pp. 9, 10. G. W . Beebe reports “ a small but reliable difference in the pregnancy rates for women reporting different coital frequency” in his Logan series. Contraception and Fertility in the Southern A ppalachians. Baltimore, William and Wilkins Co., 1942, pp. 79, 80.
41 The mean conception delays are 4.6, 4.7, 4.3 and 3.7 months for reported frequencies of once per week or less, 2 -3 times, 4 -6 times, and 7 times per week or more; based on samples of 45 ,212 ,12 1 , and 101 women.
Length of the Fertile Period
152 The Milbank Memorial Fund Quarterly
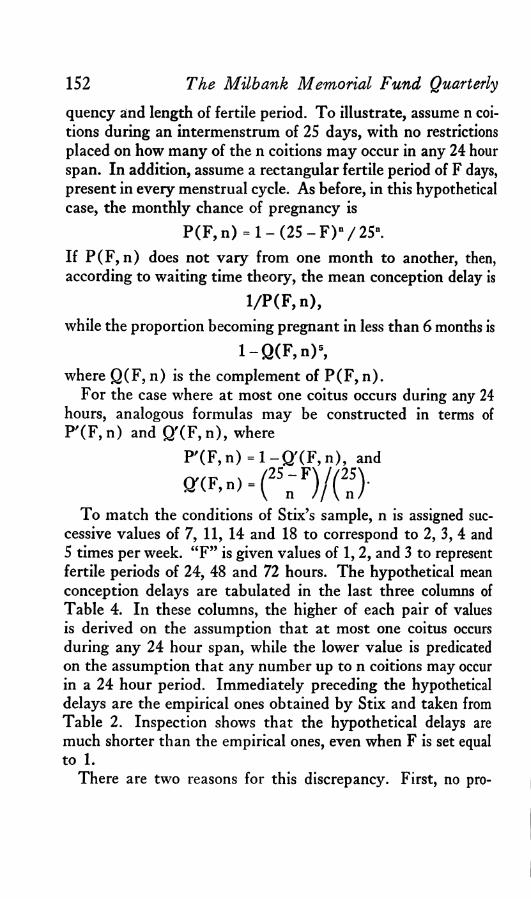
quency and length of fertile period. To illustrate, assume n coitions during an intermenstrum of 25 days, with no restrictions placed on how many of the n coitions may occur in any 24 hour span. In addition, assume a rectangular fertile period of F days, present in every menstrual cycle. As before, in this hypothetical case, the monthly chance of pregnancy is
P(F, n) = 1 - (25 - F ) n/25".If P (F , n) does not vary from one month to another, then, according to waiting time theory, the mean conception delay is
1/P (F , n),while the proportion becoming pregnant in less than 6 months is
l - Q ( F ,n ) 5,where Q(F, n) is the complement of P(F, n).
For the case where at most one coitus occurs during any 24 hours, analogous formulas may be constructed in terms of P '(F , n) and Q '(F, n), where
P '(F ,n ) = l - Q '( F ,n ) , and
^ F’">=(25„'F)/(n>To match the conditions of Stix’s sample, n is assigned suc
cessive values of 7, 11, 14 and 18 to correspond to 2, 3, 4 and 5 times per week. “ F” is given values of 1, 2, and 3 to represent fertile periods of 24, 48 and 72 hours. The hypothetical mean conception delays are tabulated in the last three columns of Table 4. In these columns, the higher of each pair of values is derived on the assumption that at most one coitus occurs during any 24 hour span, while the lower value is predicated on the assumption that any number up to n coitions may occur in a 24 hour period. Immediately preceding the hypothetical delays are the empirical ones obtained by Stix and taken from Table 2. Inspection shows that the hypothetical delays are much shorter than the empirical ones, even when F is set equal to 1.
There are two reasons for this discrepancy. First, no pro

153vision is being made for unfavorable menstrual cycles. If the chance of pregnancy during a favorable cycle is p, but only “ c” proportion of all menstrual cycles are favorable, then the mean pregnancy delay increases to 1/cp, larger than 1/p by a factor of 1/c. Secondly, it is being assumed that all members of a coital class share a common monthly chance of pregnancy. Actually, class members vary considerably in their fecundabili- ties both on account of errors in their reported coital frequency and variation in other factors influencing fecundability. It is easily shown that when two groups possess the same mean fecundability, that group which has the greater variation around this mean will exhibit the longer mean conception delay. Without knowing how variable fecundability is in each coital class, it is impossible to estimate (1 -c), the proportion of unfavorable cycles, from these data. However variation in fecundability depends closely on variation in frequency of unfavorable cycles. Therefore, the fact that the hypothetical conception delays in Table 4 are so much smaller than the empirical ones, even when F is set equal to one, serves as additional evidence that the incidence of unfavorable cycles is substantial.
An identical result is obtained when hypothetical proportions conceiving in less than 6 months are calculated by means of the two models of Glass and Grebenik and compared with the empirical proportions obtained by MacLeod and Gold. Accord-
Length of the Fertile Period
Table 4. Comparison of empirical and hypothetical mean conception delays, as related to coital frequency: Stix data.
CoitalFrequency
ObservedM ean
ConceptionD elay1
H ypothetical D elays2 assuming Fertile P eriod L ength of :
24 Hours 48 Hours 72 Hours
M o. M o. M o. M o.
2 X /W eek 8 .4 4 .0 2 .3 1 .73 6 .9 2 .8 1 .7 1.34 5 .2 2 .3 1 .5 1 .25 4 .5 1 .9 1.3 1.1
1 Taken from Table 2.* Calculated as l/P (F ,n ), where P(F,n) = 1 - (25 - F )»/25“ .
154 The Milbank Memorial Fund Quarterly
CoitalFrequency
O bserved P roportion
C onceiving in 5 M onths or
L ess1
H ypothetical P roportions2 assuming F ertile P eriod L ength of:
24 Hours 48 Hours 72 Hours
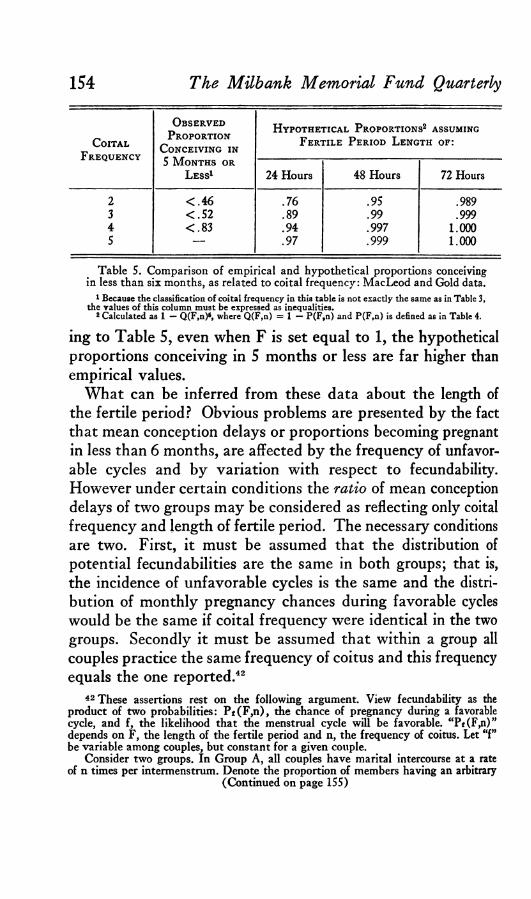
2 < .4 6 .76 .95 .9893 < .5 2 .89 .99 .9994 < .8 3 .94 .997 1.0005 — .97 .999 1.000
Table 5. Comparison of empirical and hypothetical proportions conceiving in less than six months, as related to coital frequency: MacLeod and Gold data.
1 Because the classification of coital frequency in this table is not exactly the same as in Table 3, the values of this column must be expressed as inequalities.
2 Calculated as 1 — Q(F,n)6, where Q(F,n) = 1 — P(F,n) and P(F,n) is defined as in Table 4.
ing to Table 5, even when F is set equal to 1, the hypothetical proportions conceiving in 5 months or less are far higher than empirical values.
What can be inferred from these data about the length of the fertile period? Obvious problems are presented by the fact that mean conception delays or proportions becoming pregnant in less than 6 months, are affected by the frequency of unfavorable cycles and by variation with respect to fecundability. However under certain conditions the ratio of mean conception delays of two groups may be considered as reflecting only coital frequency and length of fertile period. The necessary conditions are two. First, it must be assumed that the distribution of potential fecundabilities are the same in both groups; that is, the incidence of unfavorable cycles is the same and the distribution of monthly pregnancy chances during favorable cycles would be the same if coital frequency were identical in the two groups. Secondly it must be assumed that within a group all couples practice the same frequency of coitus and this frequency equals the one reported.42
42 These assertions rest on the following argument. View fecundability as the product of two probabilities: P f(F ,n ), the chance of pregnancy during a favorable cycle, and f, the likelihood that the menstrual cycle will be favorable. aPt(F,n)” depends on F, the length of the fertile period and n, the frequency of coitus. Let “f” be variable among couples, but constant for a given couple.
Consider two groups. In Group A , all couples have marital intercourse at a rate of n times per intermenstrum. Denote the proportion of members having an arbitrary
(Continued on page 155)
Length of the Fertile Period 155
CoitalFrequency
O bservedConception
D elay1
H ypothetical Conception D elay1 assuming F ertile P eriod L ength of :
24 Hours 48 Hours 72 Hours
2 X /W eek 100 100 100 1003 82 70 74 774 62 58 65 715 54 47 57 65
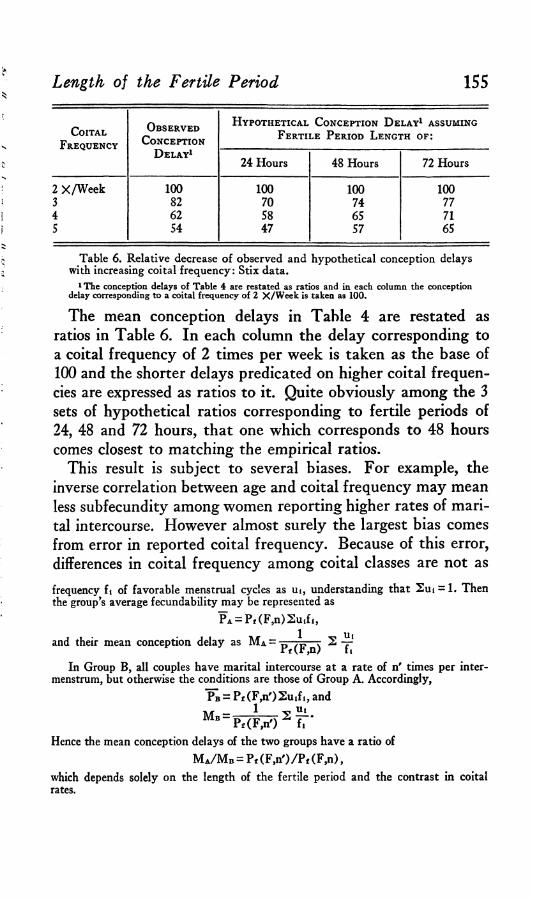
Table 6. Relative decrease of observed and hypothetical conception delays with increasing coital frequency: Stix data.
1 The conception delays of Table 4 are restated as ratios and in each column the conception delay corresponding to a coital frequency of 2 X /W eek is taken as 100.
The mean conception delays in Table 4 are restated as ratios in Table 6. In each column the delay corresponding to a coital frequency of 2 times per week is taken as the base of 100 and the shorter delays predicated on higher coital frequencies are expressed as ratios to it. Quite obviously among the 3 sets of hypothetical ratios corresponding to fertile periods of 24, 48 and 72 hours, that one which corresponds to 48 hours comes closest to matching the empirical ratios.
This result is subject to several biases. For example, the inverse correlation between age and coital frequency may mean less subfecundity among women reporting higher rates of marital intercourse. However almost surely the largest bias comes from error in reported coital frequency. Because of this error, differences in coital frequency among coital classes are not asfrequency ft of favorable menstrual cycles as ut, understanding that Sut = 1. Then the group’s average fecundability may be represented as
PA = Pf (F ,n)2 u .f i ,
and their mean conception delay as M a =
In Group B, all couples have marital intercourse at a rate of n' times per inter- menstrum, but otherwise the conditions are those of Group A . Accordingly,
PB = P f(F ,n ')2 u ,fi , and
M b =1
Pf(F,n') 2 Hift #
Hence the mean conception delays of the two groups have a ratio of
M a/ M b = Pt (F,n')/Pf (F,n),which depends solely on the length of the fertile period and the contrast in coital rates.
156large as reported and, as a result, the above calculation tends to overestimate the length of the fertile period. Not knowing the magnitude of error, one cannot gauge the degree of overestimation. In sum, taken alone, the available data on conception delay classified by reported coital frequency support only an inference that the fertile period averages under 48 hours. However these same data have furnished additional evidence that the incidence of unfavorable menstrual cycles is high and such an incidence, combined with data reviewed earlier, suggest that the fertile period is more likely in the neighborhood of 30 hours than 18.
S u m m a r y
It is well known that only during a relatively short portion of the human menstrual cycle does coitus have an appreciable chance of leading to conception. Despite the practical importance of knowing the length of this fertile period, no general agreement has existed as to whether it averages closest to 12, 24, 36, or 48 hours.
Studies of the survivorship of sperms and ova within the female all but eliminate the possibility that the fertile period averages as long as 72 hours and even make doubtful a mean duration as long as 48 hours. However these investigations do not yield a useful indication of how much shorter than 48 hours the mean length of the fertile period may be.
Three additional estimates have been assembled. The first is taken from an analysis by Tietze who estimates the lengths of fertile period that generate reasonable conception delays given the coital frequencies reported in the female sample of Kinsey et al. The second and third estimates are derived by adapting Tietze’s scheme of analysis to data on artificial insemination by donor and to comparisons of conception delays among women reporting different coital frequencies. Together, these three lines of evidence furnish additional reason for believing that the fertile period typically lasts less than 48 hours. However they, too, fail to settle whether the fertile period averages nearer 18 or 36 hours.
The Milbank Memorial Fund Quarterly
157
A choice between 18 or 36 hours presupposes an assumption about the combined incidence of anovulation, failure of fertilization, and early foetal wastage. If the proportion of menstrual cycles affected by these phenomena is low, then the fertile period probably averages in the neighborhood of 18 hours or a little more. If the proportion of “ unfavorable” menstrual cycles reaches one half, then a fertile period nearer 36 hours must be postulated. Indirect evidence has been cited to make such a high incidence credible. However this issue is not likely to be resolved until the frequency of ova destined to abort can be estimated more confidently. Indeed, in the long run, precise estimates of the fertile period, including such aspects as “ shape” and variability of length, must wait until more direct techniques of measuring the periods of sperm virility and ovum fer- tilizability within the female become available.
APPENDIX: AN ANALYSIS OF THREE BIASES
To apply the two models of Glass and Grebenik, Tietze has to assume that fertile periods are rectangular in shape and constant in length and that coitus is practiced at a uniform rate of n times per intermenstrum. This appendix shows that the biases associated with these simplifying assumptions are probably of secondary importance. The discussion proceeds by illustration. Attention is first given to changes in fecundability (monthly probability of conception) when a trapezoidal fertile period is substituted for a rectangular one; next when a constant fertile period is replaced by a variable one of the same mean length, and lastly when a uniform rate of coitus is replaced by variable frequencies.
A. C o m p a r is o n o f T r a p e z o i d a l a n d R e c t a n g u l a r F e r t i l e P e r io d
In keeping with Glass and Grebenik’s two models, two patterns of coitus during the constant intermenstrum of 25 days are distinguished: “ spaced coition” when not more than one coitus occurs during any 24 hour span; and “ non-spaced coition” when any number of coituses, up to n, may occur during a 24 hour period.
In the case of unspaced coition, the shape of the fertile period does not affect fecundability. Whatever the shape of the fertile period,
Length of the Fertile Period

chances that the ith of n coituses will not coincide with the fertile period holds constant at (25-F)/25 if F is the length of the fertile period, or, more precisely, if F is the area under the curve describing the probability that coitus will initiate pregnancy during any time point of the 25-day intermenstrum. Hence, given unspaced coition, fecundability equals 1 - (25-F)“/25n for any given F and n, regardless of the shape of the fertile period.
On the other hand, if coition is spaced, shape of the fertile period does affect fecundability. Spacing intercourse increases chances that at least one coitus will coincide with the fertile period and the gain thereby derived for fecundability is maximal when the fertile period, of area F, is rectangular in shape, with height 1 and length F. The gain becomes progressively less as the shape of the fertile period changes so that its average height decreases from 1 while its base— the time interval during which chances of pregnancy are nonzero— increases from F. In the extreme, its base becomes 25 and its height uniformly F/25. Then spacing intercourse loses all significance. Whatever the patterning of n coituses, chances of not becoming pregnant remain at (25-F)n/25“.
Accordingly, if a trapezoidal fertile period is substituted for a rectangular one, fecund abilities are unaffected in the case of non- spaced coition, i.e.,
P(F ',n) = P (F ,n);but in the case of spaced coition, fecund abilities are somewhat reduced, i.e.,
P '(F ',n) < P '(F ,n).More generally,
P(F,n) < P '(F ',n) < P '(F ,n).To illustrate, let the fertile period have a symmetrical trapezoidal
shape such that its base equals 3; its height equals 1; and with sides sloping inward at 45 degrees, its upper parallel equals 1. These dimensions determine an area of 2, spread over a base of three unequally fertile days. Assume spaced coition so that at most one coitus coincides with the first third, the central third, or the last third of the fertile period. The probability that a single coitus coinciding with one of these three fertile days will initiate pregnancy is .5, 1.0, and .5 respectively. Hence the probability Q '(F',n) of not becoming pregnant, given n spaced coituses, is the sum of four com-
158 The Milbank Memorial Fund Quarterly
Length of the Fertile Period 159
M onthly P robability of P regnancy (F ecundability)
CoitalFrequency (per Intermenstrum) Coition
N ot Spaced1
Coition Spaced
Trapezoidal Fertile Period2
Rectangular Fertile Period3
4 .28 .29 .308 .49 .53 .55
12 .63 .71 .74
1 Values based on P(2,n) = 1 — 23n/25n.2 See text for derivation of P '(F',n) values.8 Values based on P'(2,n) = (25 — n)(24 — n)/(25)(24).
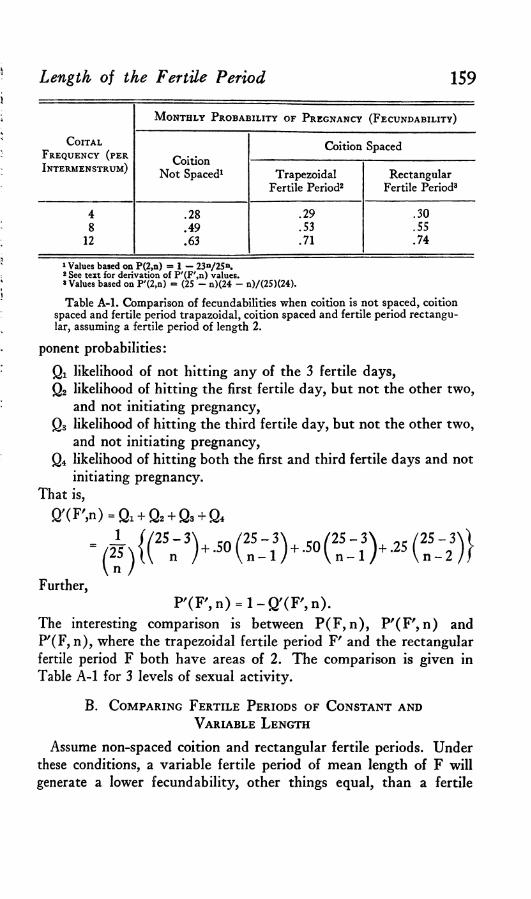
Table A -l . Comparison of fecundabilities when coition is not spaced, coition spaced and fertile period trapazoidal, coition spaced and fertile period rectangular, assuming a fertile period of length 2.
ponent probabilities:Qi likelihood of not hitting any of the 3 fertile days,Q2 likelihood of hitting the first fertile day, but not the other two,
and not initiating pregnancy,Q3 likelihood of hitting the third fertile day, but not the other two,
and not initiating pregnancy,Q4 likelihood of hitting both the first and third fertile days and not
initiating pregnancy.That is,
Q'CF'jn) = Qi + Q2 + Q3 + Q4
Further,P ' ( F » = 1 - Q ' ( F » .
The interesting comparison is between P(F, n), P'(F', n) and P'(F, n), where the trapezoidal fertile period Fr and the rectangular fertile period F both have areas of 2. The comparison is given in Table A-l for 3 levels of sexual activity.
B. C o m p a r i n g F e r t il e P e r io d s o f C o n s t a n t a n d
V a r i a b l e L e n g t h
Assume non-spaced coition and rectangular fertile periods. Under these conditions, a variable fertile period of mean length of F will generate a lower fecundability, other things equal, than a fertile

160 The Milbank Memorial Fund Quarterly
period of constant length F. It is desired to show that the decrement in fecundability remains small even when the variability in length is quite large.
Let x, the length of the fertile period, vary from 0 to 2F according to the symmetrically triangular density given in Chart 1. This density yields a mean length of F, a standard deviation of (1/6)* F, or approximately .4F, and therefore a coefficient of variation (standard deviation over mean) of approximately .4. The latter represents a substantial relative variability. Let P(F*, n) denote the fecundability associated with this variable fertile period.
X
F x»2F

Length of the Fertile Period 161
M ean L ength of F ertile P eriodCOITAL
Frequency (per Intermenstrum)
24 Hours 48 Hours 72 Hours
Variable1 Constant2 Variable Constant Variable Constant
4 .15 .15 .28 .28 .39 .408 .27 .28 .47 .49 .61 .64
12 .38 .39 .60 .63 .74 .78
1 See text for derivation of P(F*,n) values.2 Values based on P(F,n) = 1 — (25 — F)n/25n.
Table A-2. Comparison of fecundabilities when fertile period constant and when variable, by coital frequency and mean length of fertile period.
By a series of algebraic manipulations, the expression on the right may be converted into a form convenient for calculation, i.e.,
£i = 0( - D 1 1 2(2» + » - l ) F,
(25)‘ (i + l ) (i + 2 )*As before, P(F, n) denotes fecundability when the fertile period is rectangular and constant in length.
Table A-2 furnishes comparisons of P(F, n) and P(F*, n) for several combinations of mean fertile period length and coital frequency. It is seen that the differences are generally small and diminish for shorter fertile periods and lower levels of sexual activity.
An expression is not readily available for P'(F*, n), the fecundability associating with a variable fertile period and spaced coition. As noted earlier (p. 139), the second model of Glass and Grebenik is not amenable to fractional values of F.
C . C o m p a r i s o n o f C o n s t a n t a n d V a r i a b l e
C o i t a l F r e q u e n c i e s
Assume a constant rectangular fertile period and unspaced coition. Suppose further that a group is subdivided into classes representing different coital frequencies. Let Wi denote the proportion having a coital frequency of i. The group’s fecundability may be represented as
whereP(F,n') = l -Q (F ,n ')
Q f F . i O - S w . ^ E ) 1
162 The Milbank Memorial Fund Quarterly
Let Siwj = n. Then the interesting comparison will be between P(F, n') and P(F, n), where the latter term denotes that all members of the second group are practicing coitus at a uniform frequency of n.
An analogous comparison may be constructed for the case of spaced coition. Here we have P'(F, n), together with
P'(F,n') = l-Q '(F ,n ') ,
= S W i(25 - i ) (F)
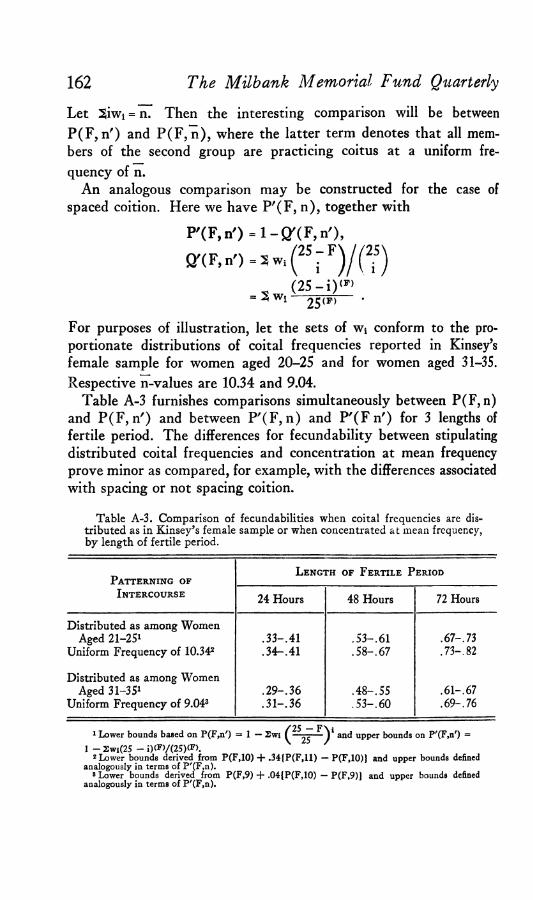
25(F)For purposes of illustration, let the sets of w4 conform to the proportionate distributions of coital frequencies reported in Kinsey’s female sample for women aged 20-25 and for women aged 31-35. Respective n-values are 10.34 and 9.04.
Table A-3 furnishes comparisons simultaneously between P(F, n) and P(F, n') and between P'(F, n) and P'(F n') for 3 lengths of fertile period. The differences for fecundability between stipulating distributed coital frequencies and concentration at mean frequency prove minor as compared, for example, with the differences associated with spacing or not spacing coition.
Table A-3. Comparison of fecundabilities when coital frequencies are distributed as in Kinsey’s female sample or when concentrated at mean frequency, by length of fertile period.
Patterning ofL ength of Fertile P eriod
Intercourse 24 Hours 48 Hours 72 Hours
Distributed as among Women Aged 21-251
Uniform Frequency of 10.342.3 3 -.4 1 .3 4 -.4 1
.5 3 -.6 1
.5 8 -.6 7.67 -. 73 .73-.82
Distributed as among Women Aged 31-351
Uniform Frequency of 9.043.2 9 -.3 6 .3 1 -3 6
.4 8 -.5 5
.5 3 -.6 0.61-.67 .6 9 -7 6
✓ 25_F\ *1 Lower bounds based on P(F,n') = 1 — Swi ( — ;r=— V and upper bounds on P'(F,n') *
1 -2w i(25 - i)(F)/(25)(F).2 Lower bounds derived from P(F,10) + .34{P(F,11) — P(F,10)} and upper bounds defined
analogously in terms of P'(F,n).8 Lower bounds derived from P(F,9) + .04{P(F,10) — P(F,9)J and upper bounds defined
analogously in terms of P'(F,n).