lehman brothers global healthcare conference presentation
TRANSCRIPT

Lehman Lehman Brothers Brothers
Healthcare Healthcare ConferenceConference
March 10, 2006March 10, 2006
22006 Lehman Brothers Healthcare Conference
Paul JulianPaul Julian
Executive Vice PresidentExecutive Vice Presidentandand
Group PresidentGroup President

32006 Lehman Brothers Healthcare Conference
Some of the information in this presentation may constitute forward-looking statements that are subject to various uncertainties. These uncertainties could cause actual results to differ materially from those projected or implied. The risk factors associated with those uncertainties are described in the Company’s reports and exhibits filed with the Securities and Exchange Commission. Financial information is presented here in summary form. Full details are provided in the Company’s most recent 10-Q report. All of this information is available at www.mckesson.com. The Company assumes no obligation to update or revise any such statements, whether as a result of new information or otherwise.
Safe Harbor Clause

42006 Lehman Brothers Healthcare Conference
McKesson Facts
$80.5 billion in revenues in FY05FY05 EPS $2.19 (excluding Securities Litigation charge**, loss of $0.53, as reported)Over 25,000 employees306 million shares outstanding* $16.5 billion market capFounded 1833, headquartered in San Francisco
160% Return to Shareholders since April 1, 2000
PharmaSolutions$76.3 B
Medical-Surgical$2.9 B
Provider Technologies$1.3 B
FY05 REVENUES
FY05 OPERATING PROFIT
PharmaSolutions$1 B
Medical-Surgical$102 M
Provider Technologies$107 M
* As of quarter ended 12/31/05**See Schedule 1 from 5/5/05 press release for reconciliation

52006 Lehman Brothers Healthcare Conference
Healthcare TrendsHealthcare Trends

62006 Lehman Brothers Healthcare Conference
Healthcare Trends Drive McKesson Strategy and Growth
Demographics drive drug
consumption
McKesson handles over 30% of the nation’s drug needs
Increased involvement by consumers in their own healthcare
Focus on managing
chronic diseases
McKesson provides health management solutions across spectrum
Technology improves healthcare
quality
McKesson solutions deliver best practice information at point of care
Demand by payors and employers for improved outcomes
Focus on patient safety
McKesson solutions provide supply chain integrity and reduce medication errors –bar-code mandate for hospitals
Pressure to control
healthcare costs
McKesson delivers solutions to manage the complex handoffs in a fragmented industry
72006 Lehman Brothers Healthcare Conference
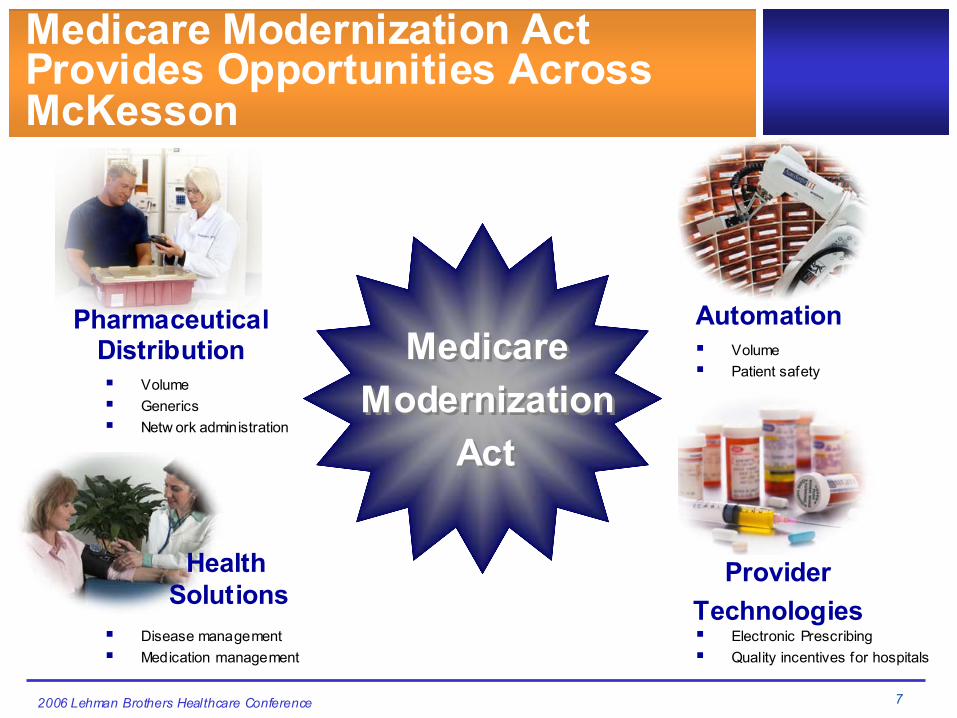
Medicare Modernization Act Provides Opportunities Across McKesson
VolumePatient safety
VolumeGenericsNetw ork administration
Disease managementMedication management
Pharmaceutical Distribution
Health Solutions
Electronic PrescribingQuality incentives for hospitals
ProviderTechnologies
AutomationMedicare
ModernizationAct
MedicareModernization
Act

82006 Lehman Brothers Healthcare Conference
McKesson OverviewMcKesson Overview

92006 Lehman Brothers Healthcare Conference
Delivering Value from the Center of Healthcare
Pharmaceutical & medical-surgical distribution to all sites
Solutions for medication safety
Pharmacy outsourcing and consulting
Specialty pharmaceuticals
Inpatient automation
Information solutions for hospitals, payors,
home care, and physicians
Pharmaceutical repackaging
Retail pharmacy automation
Disease management

102006 Lehman Brothers Healthcare Conference
Leader in Growing Areas
U.S. Pharmaceutical$234 B 5-7% projected growth (1)
Canadian Pharmaceutical $12 B US5-7% projected growth (1)
HIT – Hospital and Alternate Site $20 B8-11% projected growth (3)
Well positioned in all growing healthcare areas
(1) IMS(2) Medical Devices & Supplies M arket Update(3) Dornfest, Gartner Aug 2003, Forrester(4) Includes medical management software/content, disease management, coding, compliance ser vices
U.S. Medical-Surgical $80 B6-8% projected growth (2)
Payor – Outsourced and Software$8 B20-25% projected growth (4)
112006 Lehman Brothers Healthcare Conference
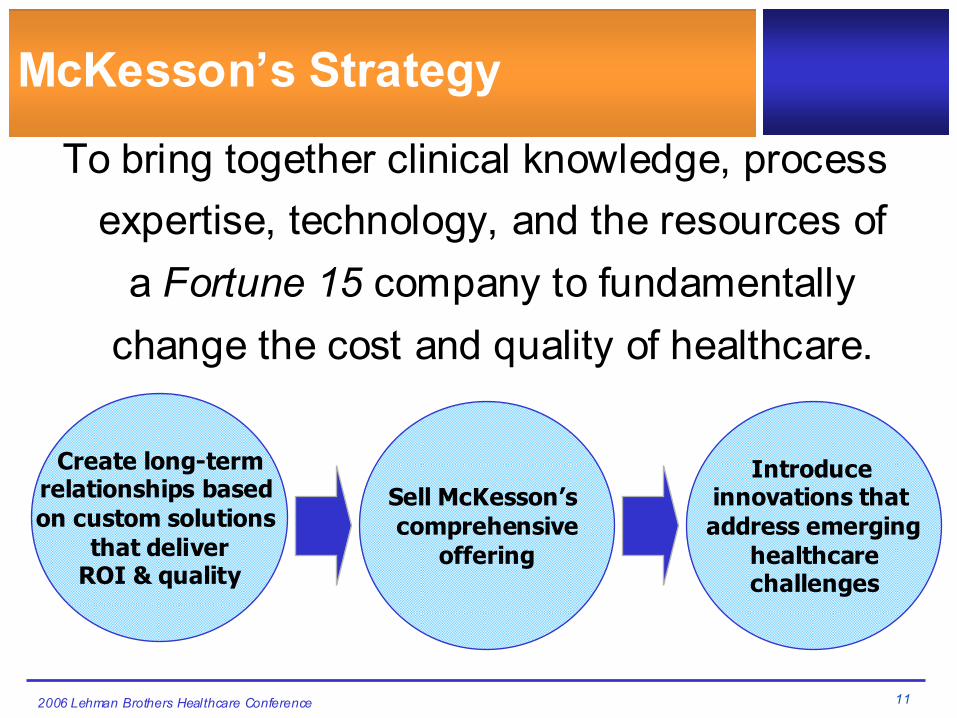
McKesson’s Strategy
To bring together clinical knowledge, process expertise, technology, and the resources of
a Fortune 15 company to fundamentally change the cost and quality of healthcare.
Create long-termrelationships based on custom solutions
that deliverROI & quality
Sell McKesson’s comprehensive
offering
Introduce innovations that address emerging
healthcarechallenges

122006 Lehman Brothers Healthcare Conference
Long-term Relationships with Market Leaders
Vanderbilt University Medical CenterVanderbilt University Medical Center

132006 Lehman Brothers Healthcare Conference
McKesson McKesson PharmaceuticalPharmaceutical
#1 in U.S., Canada, and Mexico
Large Rx repackaging
Leading generics provider
#1 in retail pharmacy automation
Specialty distribution & patient services for
manufacturers
#1 in medical management software and services for
payors
#1 in disease management for Medicaid agencies
McKesson McKesson MedicalMedical--SurgicalSurgical
#1 in primary care
#1 in extended care
Total supply solution in acute
care
Private label product offerings
Rapid growth in physician office pharmaceuticals and equipment
Market Leading Positions in Healthcare Services
McKesson McKesson Provider TechnologiesProvider Technologies
63% of health systems
51% of hospitals with 200+ beds
Leader in clinical, revenue cycle, and resource
management solutions
More “Best in KLAS”products than any
other vendor
#1 in robotic hospital pharmacy dispensing
#1 in bedside scanning

142006 Lehman Brothers Healthcare Conference
1998
Only SixSigma
Distributor
1993
AwardWinningAcumax®in all DCs
1990s
First use of Bar
Codes in DCs
2002
Flawless execution:
Best-in-class
service
1999
First mobile computing:
Closed Loop
DistributionSM
tool
Leader inRFID
technology
2006
McKesson U.S. Pharmaceutical Supply Chain Safety Leadership
Benefits for Supply Chain:
Product integrity
Product visibility
Availability
Accuracy
Verified pedigree
Rapid delivery

152006 Lehman Brothers Healthcare Conference
McKesson Value-Added U.S. Pharmaceutical Distribution
Industry-leading service levelsNext day deliveries with 99% fill rates99.74% invoice pricing integrity vs. 99.3% industry average
Aggregation of deliveryRDC reduces shipping and delivery costs for 500+ manufacturers
Centralized ServiceFirst Call Center7 million calls annually, #1 in industry by Purdue Benchmark Research
Broadest value-adding offeringAutomation for retail, hospital and mail orderCentral FillGenerics
Continuous improvementSix Sigma since 1998 for McKesson and our customers

162006 Lehman Brothers Healthcare Conference
Patent Expirations Driving Increased Generics Sales
CAGR 2003-2008 : 12.8%; Merrill Lynch; IMS; McKesson analysis
Annual Patent Expirations$ Billions
$11
$15
$9
$20
$16$14
2003
2004
2005
2006
2007
2008
Est. U.S. Generics Industry$ Billions
$17$20
$23$26
$28$31
2003
2004
2005
2006
2007
2008

172006 Lehman Brothers Healthcare Conference
Strong FY06 Momentum in Provider Technologies
CustomerSatisfactionCustomerSatisfaction
Up 9%Up 9%20 Products 20 Products
Of 2005 KLAS Report *Of 2005 KLAS Report *
EmployeeSatisfactionEmployeeSatisfactionWorld
ClassWorld
Class
RevenuesRevenues
Up 19%Up 19%
AccountabilityAccountability
Ranked in Top 3Ranked in Top 3
* Top 20 Year-End Best In KLAS Awards* Top 20 Year-End Best In KLAS Awards
19%
9%

182006 Lehman Brothers Healthcare Conference
Financial PerformanceFinancial Performance

192006 Lehman Brothers Healthcare Conference
Five Years of Strong Growth
$28.0 $31.3 $36.8
$56.4$10.7
$42.3 $47.9
$21.6
$8.7
$13.2$14.8
FY00FY
01FY02
FY03
FY04FY
05
Warehouse SalesDirect Revenues
$36.7 $42.0
$50.0$57.1
$69.5 $24.1
$80.5
17% CAGR (total sales)
$Billions

202006 Lehman Brothers Healthcare Conference
EPS(continuing operations)
($0.15)
$0.65
$1.43$1.89
$2.18
FY00
FY01
FY02
FY03
FY04
FY05Diluted EPS, continuing operations**
$2.18
**See EPS Reconciliation slide at the end of this presentation for a complete reconciliation to reported results.
27% CAGR
212006 Lehman Brothers Healthcare Conference
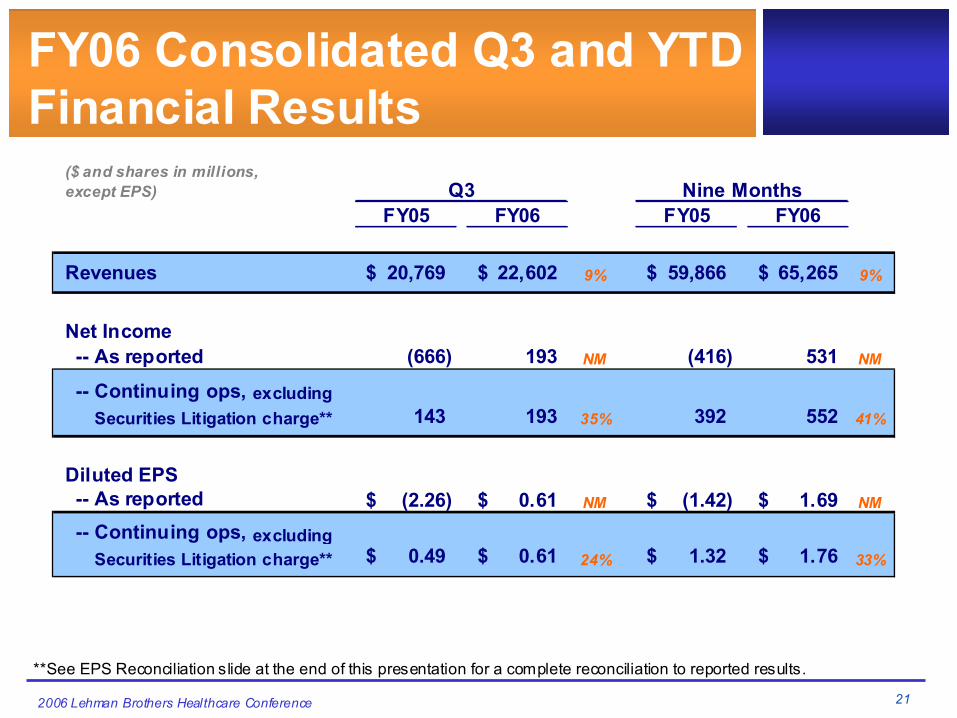
FY06 Consolidated Q3 and YTDFinancial Results
($ and shares in millions, except EPS)
FY05 FY06 FY05 FY06
Revenues 20,769$ 22,602$ 9% 59,866$ 65,265$ 9%
Net Income-- As reported (666) 193 NM (416) 531 NM
-- Continuing ops, excludingSecurities Litigation charge** 143 193 35% 392 552 41%
Diluted EPS-- As reported (2.26)$ 0.61$ NM (1.42)$ 1.69$ NM
-- Continuing ops, excludingSecurities Litigation charge** 0.49$ 0.61$ 24% 1.32$ 1.76$ 33%
Q3 Nine Months
**See EPS Reconciliation slide at the end of this presentation for a complete reconciliation to reported results.

222006 Lehman Brothers Healthcare Conference
Q3 and YTD FY06 Segment Results
Strong results in Pharmaceutical Solutions and Provider Technologies drove improved quarterly and YTD performance
Q3 Nine Months($ in millions) FY05 FY06 Var. FY05 FY 06 Var.
RevenuesPharmaceutical Solutions $19,702 $21,387 9% $56,774 $61,827 9%Medical-Surgical 736 814 11% 2,157 2,327 8%Provider Technologies 331 401 21% 935 1,111 19%
Total $20,769 $22,602 9% $59,866 $65,265 9%
Operating ProfitPharmaceutical Solutions $243 $306 26% $682 $860 26%Medical-Surgical 24 8 -67% 71 60 -15%Provider Technologies 28 38 36% 61 95 56%
Total $295 $352 19% $814 $1,015 25%
* Excludes Warehouse Sales

232006 Lehman Brothers Healthcare Conference
Strong, Flexible Balance Sheet
($ in millions)FY05 FY06
Cash and Cash Equivalents 1,033$ 2,183$
Operating Cash Flow - Nine Months 497$ 1,477$
Debt to Capital 22.9% 14.4%
Net Debt to Net Capital Employed 8.0% -25.3%
December 31,

242006 Lehman Brothers Healthcare Conference
Financial Flexibility to Create Shareholder Value
STRATEGIC OPTIONS FOR CASHSTRATEGIC OPTIONS FOR CASH
Strong Strong BalanceBalance
SheetSheet
Resolution of Resolution of Shareholder Shareholder
LitigationLitigation
Improving Improving Business Business
Performance Performance and Cash Flowand Cash Flow

252006 Lehman Brothers Healthcare Conference
What McKesson RepresentsManagement with strong track record of financial performance
Core pharmaceutical business positioned for growth
Stable of higher margin businesses poised to take advantage of the evolution of healthcareStrong cash flow and balance sheet, providing flexibility to increase shareholder value
Commitment to financial transparency and communication
Create Value for Suppliers, Customers and Shareholders
Create Value for Suppliers, Create Value for Suppliers, Customers and ShareholdersCustomers and Shareholders

272006 Lehman Brothers Healthcare Conference
EPS Reconciliation($ and shares in millions except EPS)
FY04 FY05
$ 643 $ (160)
Exclude: Securities Litigation charge - 1,200
Estimated income tax benefit - (390) - 810
Net income, continuing ops, excluding Securities Litigation charge $ 643 $ 650
$ 2.18 $ 2.18
299 301
Net income (loss), continuing ops - as reported
Diluted earnings per common share, continuing ops, excluding Securities Litigation charge *
Shares on which diluted earnings per common share were based *
* For the years ended March 31, 2005 and 2004, interest expense, net of related income taxes, of $6.2 million has been added to net income, excluding the Securities Litigation charge, for purposes of calculating diluted earnings per share. This calculation also includes the impact of dilutive securities (stock options, convertible junior subordinated debentures and restricted stock).

282006 Lehman Brothers Healthcare Conference
EPS Reconciliation($ and shares in millions, except EPS)
FY05 FY06 FY05 FY06
$ (667) $ 193 - % $ (418) $ 517 - %
Exclude: Securities Litigation charge 1,200 1 - 1,200 53 -
Estimated income tax benefit (390) (1) - (390) (18) -810 0 - 810 35 -
Net income, continuing ops,excluding Securities Litigation charge $ 143 $ 193 35 % $ 392 $ 552 41 %
$ 0.49 $ 0.61 24 % $ 1.32 $ 1.76 33 %
301 316 5 % 300 315 5 %
Nine Months
Net income, (loss) continuing ops - as reported
Diluted earnings per common share, continuing ops, excluding Secuities Litigation charge
Shares on which diluted earnings per common share were based
Q3
For the quarter and nine months ended December 31, 2004, interest expense, net of related income taxes, of $2 million, and $5 million has been added to net income, excluding the securities litigation charge, for purposes of calculating diluted earnings per share. This calculation also includes the impact of dilutive securities (stock options, convertible junior subordinated debentures and restricted stock).