lehman brothers strategy
TRANSCRIPT

7/31/2019 Lehman Brothers Strategy
http://slidepdf.com/reader/full/lehman-brothers-strategy 1/47
Sovereign StrategyA Framework for Analysis
Kaushik Rudra
February 2002
Confidential

7/31/2019 Lehman Brothers Strategy
http://slidepdf.com/reader/full/lehman-brothers-strategy 2/47
The Framework
for Analysis

7/31/2019 Lehman Brothers Strategy
http://slidepdf.com/reader/full/lehman-brothers-strategy 3/47
3
Framework for Analysis
A combination of top down and bottom up analysis
Fundamental, credit, political and technical analysis
Globally unified view disseminated via a total rate of return
Model Portfolio Inter- and intra-country relative value ideas disseminated via a
relative value portfolio
7/31/2019 Lehman Brothers Strategy
http://slidepdf.com/reader/full/lehman-brothers-strategy 4/47
4
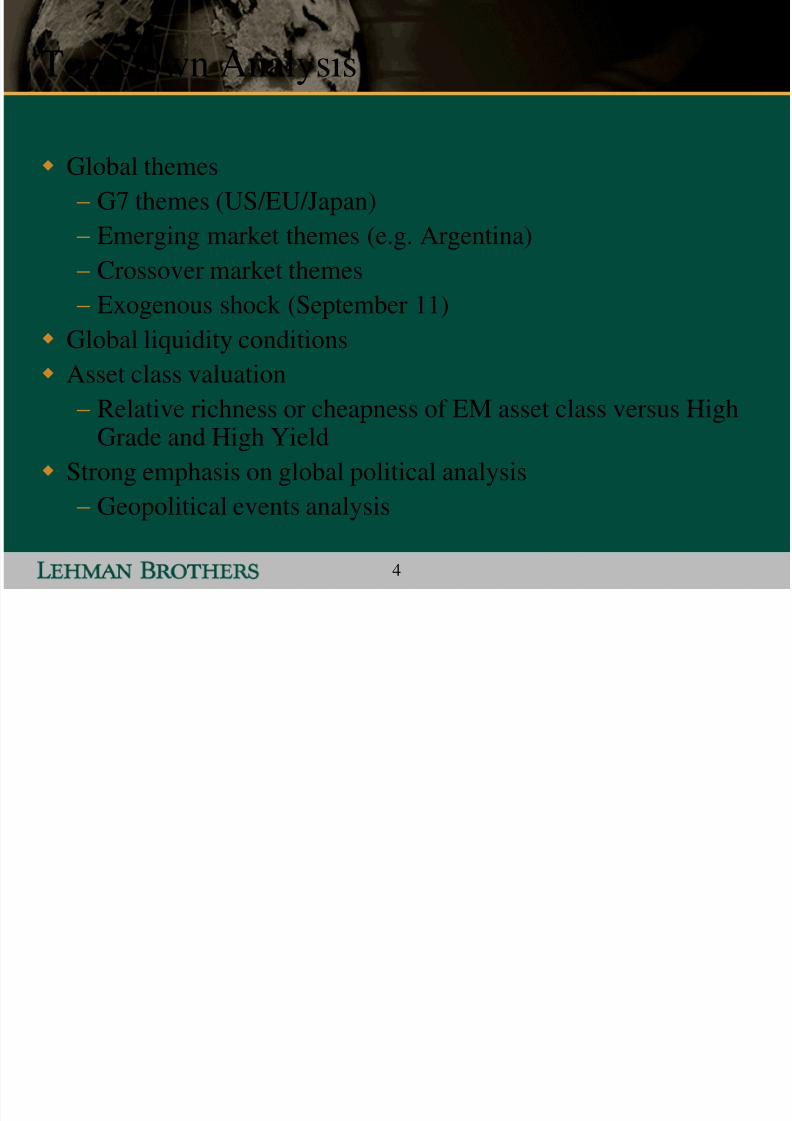
Top Down Analysis
Global themes
G7 themes (US/EU/Japan)
Emerging market themes (e.g. Argentina)
Crossover market themes Exogenous shock (September 11)
Global liquidity conditions
Asset class valuation
Relative richness or cheapness of EM asset class versus HighGrade and High Yield
Strong emphasis on global political analysis
Geopolitical events analysis

7/31/2019 Lehman Brothers Strategy
http://slidepdf.com/reader/full/lehman-brothers-strategy 5/47
5
Bottom Up Analysis
Fundamental analysis
Real sector analysis
Public sector financing analysis
External financing analysis Debt dynamics exercise
External support (private and public sector)
Reform and privatization effort
Multilateral support Geopolitical and strategic considerations
Access to foreign capital (direct & portfolio)
Question 1: Capacity to Service Debt?
7/31/2019 Lehman Brothers Strategy
http://slidepdf.com/reader/full/lehman-brothers-strategy 6/47
6
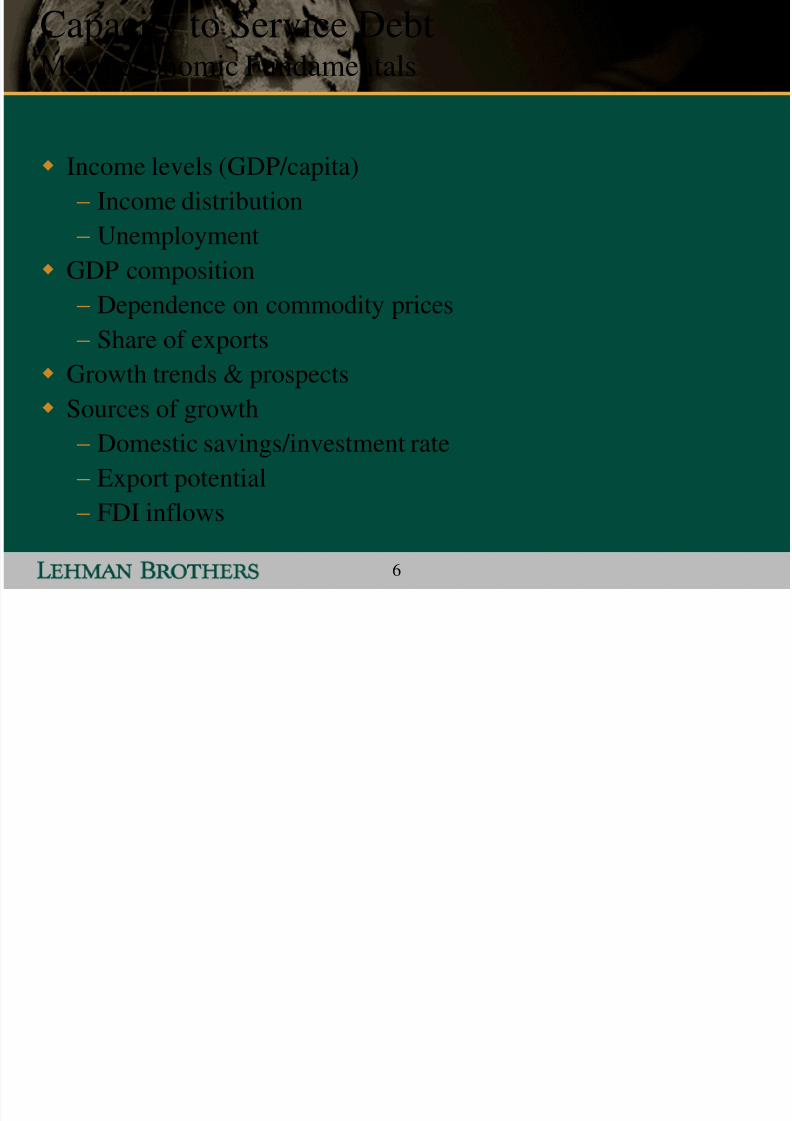
Capacity to Service DebtMacroeconomic Fundamentals
Income levels (GDP/capita)
Income distribution
Unemployment
GDP composition Dependence on commodity prices
Share of exports
Growth trends & prospects
Sources of growth Domestic savings/investment rate
Export potential
FDI inflows
7/31/2019 Lehman Brothers Strategy
http://slidepdf.com/reader/full/lehman-brothers-strategy 7/477
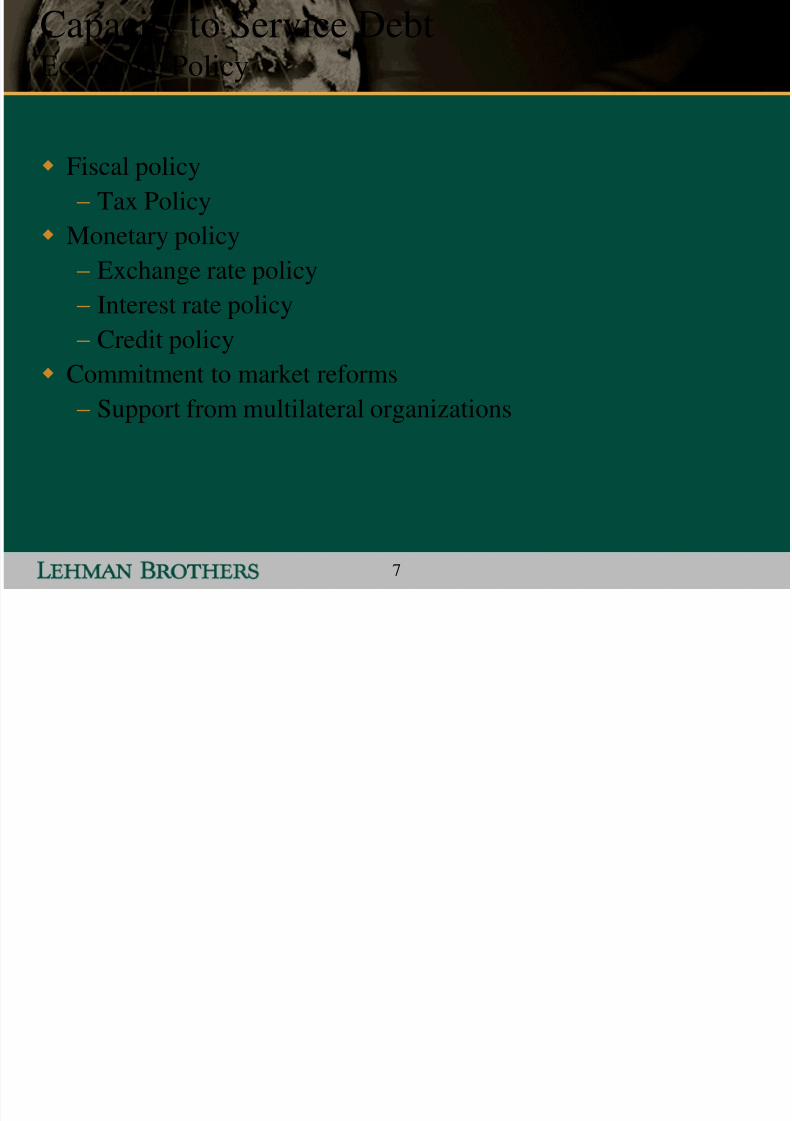
Capacity to Service DebtEconomic Policy
Fiscal policy
Tax Policy
Monetary policy
Exchange rate policy Interest rate policy
Credit policy
Commitment to market reforms
Support from multilateral organizations

7/31/2019 Lehman Brothers Strategy
http://slidepdf.com/reader/full/lehman-brothers-strategy 8/478
Capacity to Service DebtFiscal and Monetary Policy
Effectiveness – impact on growth, inflation, FX rate
Purpose of government spending
Ability to raise taxes
Economy‟s sensitivity to interest rates Commitment to price stability
Key indicators
Budget deficit/GDP
Primary deficit/GDP Public debt/GDP
Level of real interest rates
Inflation trend
7/31/2019 Lehman Brothers Strategy
http://slidepdf.com/reader/full/lehman-brothers-strategy 9/479
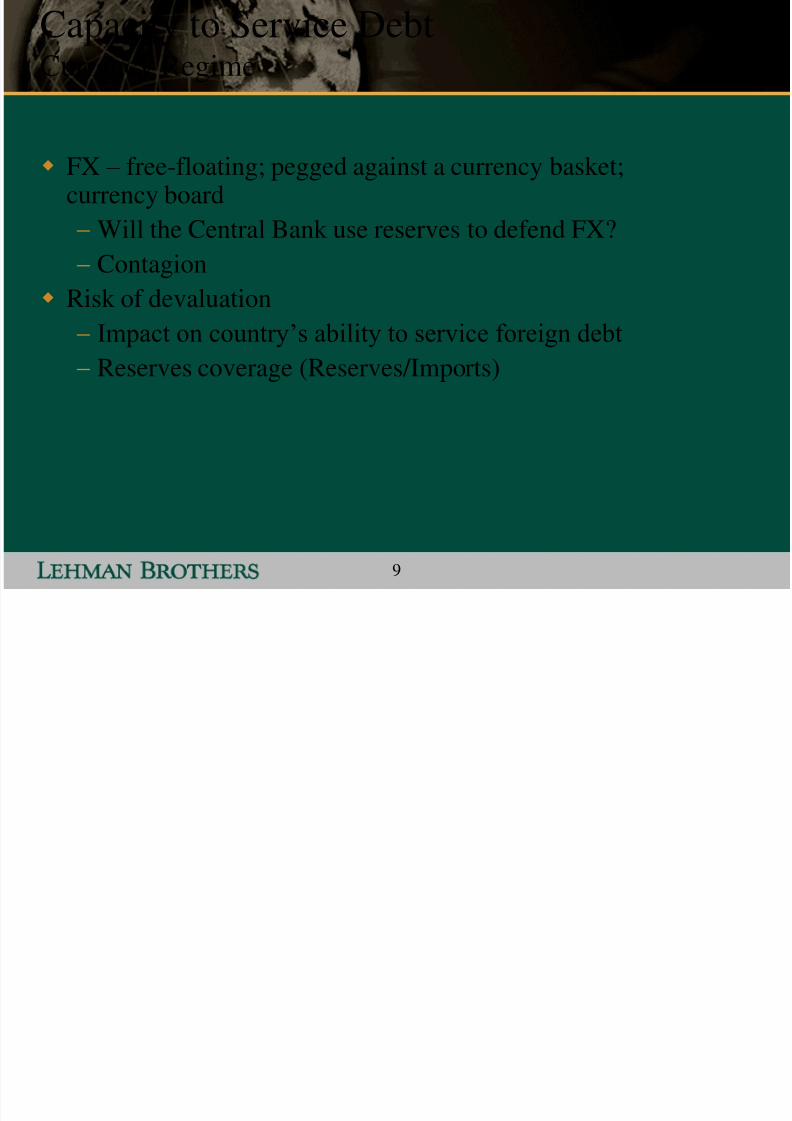
Capacity to Service DebtCurrency Regime
FX – free-floating; pegged against a currency basket;currency board
Will the Central Bank use reserves to defend FX?
Contagion Risk of devaluation
Impact on country‟s ability to service foreign debt
Reserves coverage (Reserves/Imports)
7/31/2019 Lehman Brothers Strategy
http://slidepdf.com/reader/full/lehman-brothers-strategy 10/4710
Capacity to Service DebtCommitment to Market Reforms
Privatization
Pace, scale, price
Ability to attract strategic investors
Trade liberalization Banking sector restructuring
Labor reforms
Public support
Legal/regulatory framework
7/31/2019 Lehman Brothers Strategy
http://slidepdf.com/reader/full/lehman-brothers-strategy 11/4711
Capacity to Service DebtSupport from Multilateral Organizations
Official lending: IMF, World Bank, EBRD, etc.
Often covers a substantial portion of funding needs
IMF program in place
Availability of contingency funds Signaling mechanism for private lenders
Track record
7/31/2019 Lehman Brothers Strategy
http://slidepdf.com/reader/full/lehman-brothers-strategy 12/4712
Capacity to Service DebtBalance of Payments
Typical EMG economy
Current account deficit (trade deficit; interest payments onexternal debt)
Dependency on foreign capital inflows Large current account deficit
May exert pressure on FX
Not necessarily negative
Differentiating factor
Funding sources FDIs - long-term investments into real economy
Portfolio flows – short-term; subject to changes ininvestor sentiment

7/31/2019 Lehman Brothers Strategy
http://slidepdf.com/reader/full/lehman-brothers-strategy 13/47
13
Capacity to Service DebtBalance of Payments
Trade Balance
Exports
• Growth catalyst
• Competitiveness Imports
• Consumption vs Capital
Services Balance
Tourism, Transportation, Interest Payments Capital Account
Direct and Portfolio investment
External Debt

7/31/2019 Lehman Brothers Strategy
http://slidepdf.com/reader/full/lehman-brothers-strategy 14/47
14
Financing Requirements Financing Sources
2000 2001F 2002F 2000 2001F 2002F
Current Account 676 725 670 Capital Account 823 350 500
Amortizations 547 792 806 Direct Investments 1,002 500 600
Multilateral 209 338 319 Portfolio Investments -179 -150 -100
Bilateral 195 278 159 Disbursements 951 1,121 1,080
Private Sector & Other 143 176 328 Multilateral 449 381 450IMF
(3)274 66 150
World Bank (4)
71 150 150
Other 104 165 150
Bilateral 142 120 130
Private Sector & Other(5)
360 620 500
Total 1,223 1,517 1,476 Total 1,774 1,471 1,580
Capacity to Service Debteg. Bulgaria – Estimating Financing Gap/Surplus
Bulgaria Financing Equation (US$ million)(1,2)
Source: Lehman Brothers, Bulgarian National Bank, IMF(1) Assumes no change in reserves, no capital flight and no errors and omissions(2) Excludes short-term debt, which we assume will get rolled over(3) Includes a one year IMF program (US$150 million) in 2002(4) Assumes disbursement of US$150 million in 2002. According to the new CAS drawn up by the
world bank, Bulgaria will receive between US$250 – 750 million between 2002 – 04(5) Includes euro-denominated (300 million) eurobond in 2002
7/31/2019 Lehman Brothers Strategy
http://slidepdf.com/reader/full/lehman-brothers-strategy 15/47
15
Capacity to Service DebtWhat determines the scale of FDIs?
Stable political regime
Natural wealth export potential
Sizable home market
Low labor costs Geographic location/cultural ties
Developed infrastructure
Stable legal/regulatory framework
7/31/2019 Lehman Brothers Strategy
http://slidepdf.com/reader/full/lehman-brothers-strategy 16/47
16
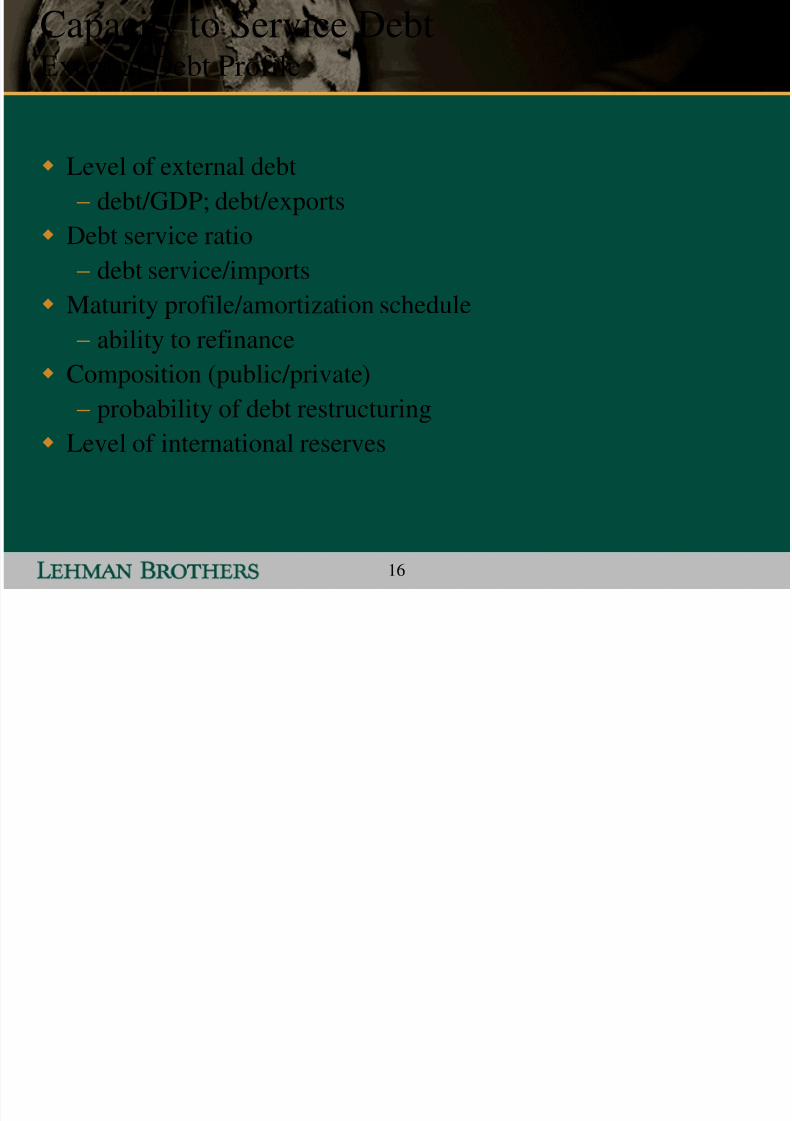
Capacity to Service DebtExternal Debt Profile
Level of external debt
debt/GDP; debt/exports
Debt service ratio
debt service/imports Maturity profile/amortization schedule
ability to refinance
Composition (public/private)
probability of debt restructuring Level of international reserves
i i b

7/31/2019 Lehman Brothers Strategy
http://slidepdf.com/reader/full/lehman-brothers-strategy 17/47
17
Capacity to Service DebtSovereign Credit Ratings
Moody‟s & S&P
Issuer rating = Foreign currency rating
Domestic currency rating
Domestic currency debt typically rated higher for EMG countries Government can print money/raise taxes
Rating differential wider for lower-rated countries
Sovereign ceiling
Government‟s ability to introduce FX & capital controls
7/31/2019 Lehman Brothers Strategy
http://slidepdf.com/reader/full/lehman-brothers-strategy 18/47
18
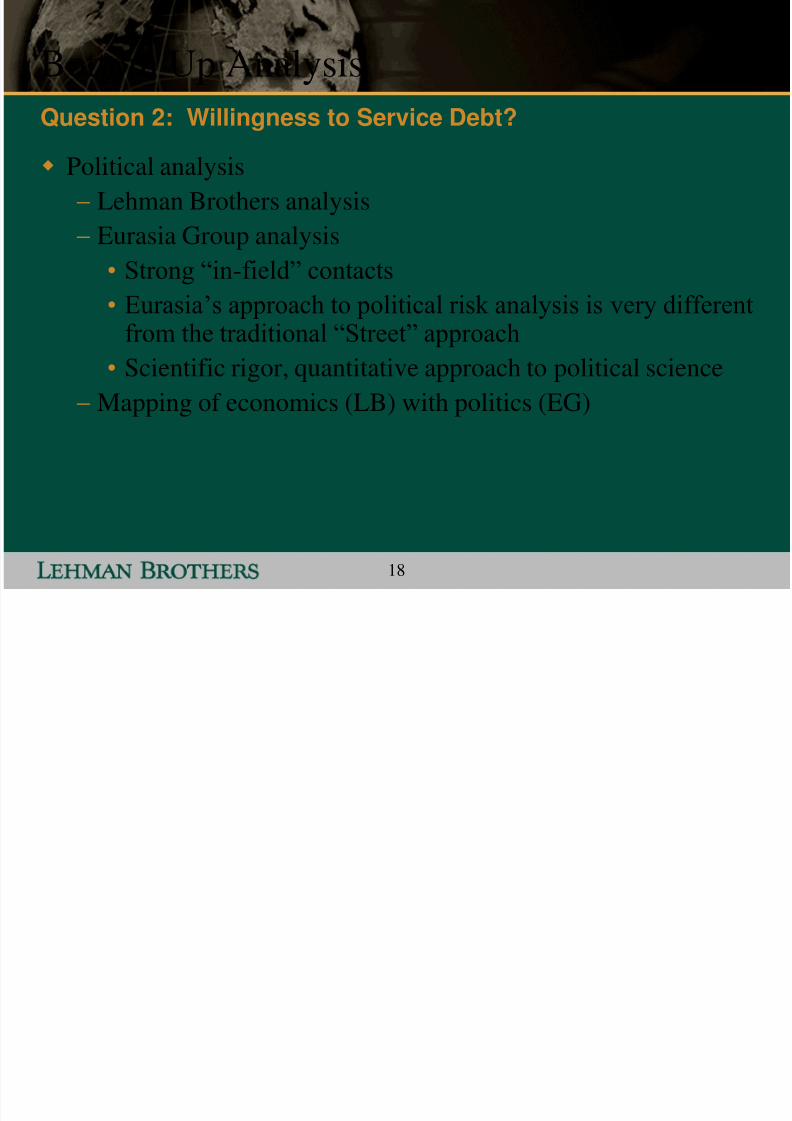
Bottom Up Analysis
Political analysis
Lehman Brothers analysis
Eurasia Group analysis
• Strong “in-field” contacts • Eurasia‟s approach to political risk analysis is very different
from the traditional “Street” approach
• Scientific rigor, quantitative approach to political science
Mapping of economics (LB) with politics (EG)
Question 2: Willingness to Service Debt?
Willi f S i D b
7/31/2019 Lehman Brothers Strategy
http://slidepdf.com/reader/full/lehman-brothers-strategy 19/47
19
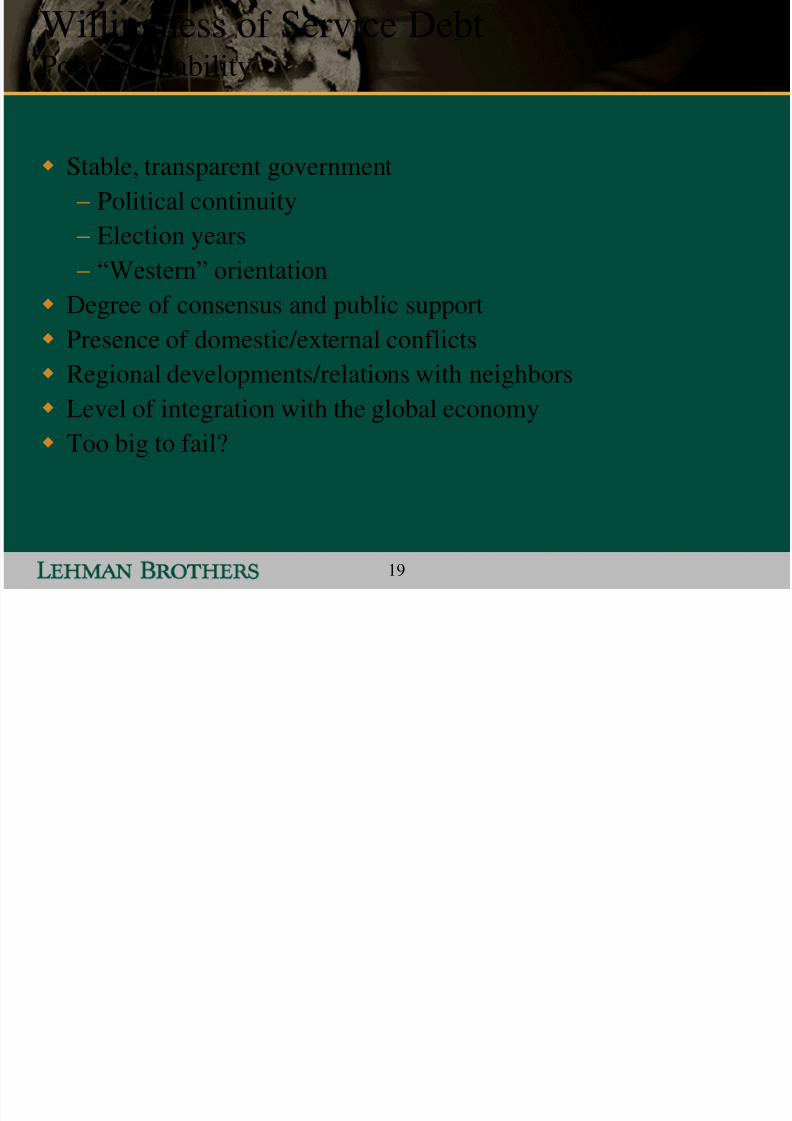
Willingness of Service DebtPolitical Stability
Stable, transparent government
Political continuity
Election years
“Western” orientation Degree of consensus and public support
Presence of domestic/external conflicts
Regional developments/relations with neighbors
Level of integration with the global economy Too big to fail?

7/31/2019 Lehman Brothers Strategy
http://slidepdf.com/reader/full/lehman-brothers-strategy 20/47
20
Bottom Up Analysis
Answers to questions 1 and 2…plus
Technical considerations
Holders of debt
Relative allocation of debt Index considerations
Other considerations
• Buybacks
• Debt restructuring• Issuance/supply
Question 3: Will the Credit Outperform?
Will h C di O f

7/31/2019 Lehman Brothers Strategy
http://slidepdf.com/reader/full/lehman-brothers-strategy 21/47
21
Will the Credit OutperformTechnical Factors
Risk appetite for the asset class
Correlation with the market and the risk of contagion
Type of investors
Inclusion in the index
Short/long positions
New supply/debt exchange
Market and asset liquidity
7/31/2019 Lehman Brothers Strategy
http://slidepdf.com/reader/full/lehman-brothers-strategy 22/47
Investment Outperformance Through
Exposure to Sovereign Markets
I t f th A t Cl

7/31/2019 Lehman Brothers Strategy
http://slidepdf.com/reader/full/lehman-brothers-strategy 23/47
23
Importance of the Asset ClassContagion and Crossover
Current Yield/Total Return Enhancement
Why Invest in Sovereign Markets?
Fi d I A t Cl
7/31/2019 Lehman Brothers Strategy
http://slidepdf.com/reader/full/lehman-brothers-strategy 24/47
24
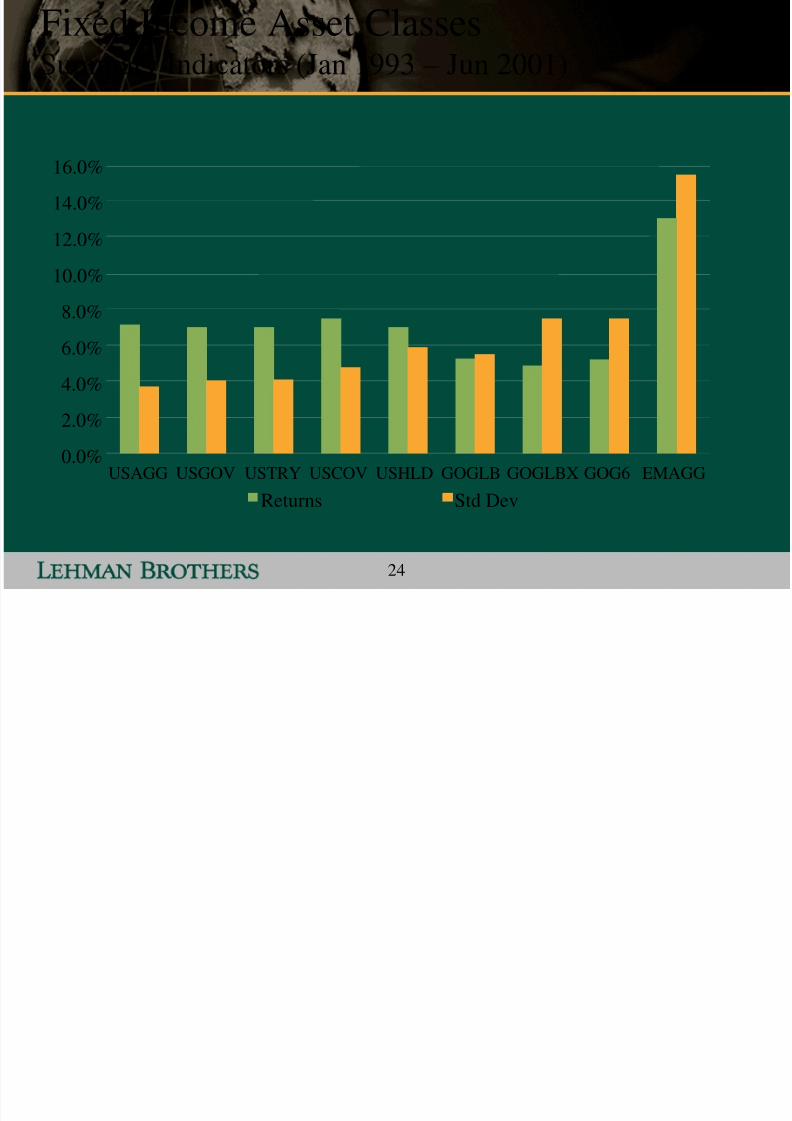
Fixed Income Asset ClassesSummary Indicators (Jan 1993 – Jun 2001)
0.0%
2.0%
4.0%
6.0%
8.0%
10.0%
12.0%
14.0%
16.0%
USAGG USGOV USTRY USCOV USHLD GOGLB GOGLBX GOG6 EMAGG
Returns Std Dev
I t f th A t Cl
7/31/2019 Lehman Brothers Strategy
http://slidepdf.com/reader/full/lehman-brothers-strategy 25/47
25
Importance of the Asset Class:Contagion and Crossover
Current Yield/Total Return Enhancement
Diversification
Why Invest in Sovereign Markets?
Fi d I A t Cl

7/31/2019 Lehman Brothers Strategy
http://slidepdf.com/reader/full/lehman-brothers-strategy 26/47
26
January 1993 – June 2001
Fixed Income Asset ClassesCross-correlation Matrix
USAGG USGOV USCOR USHLD GOGLB GOG6 EMAGG
USAGG 100%
USGOV 98% 100%
USCOR 97% 93% 100%
USHLD 41% 30% 54% 100%
GOGLB 51% 54% 47% 15% 100%
GOG6 25% 28% 22% 1% 95% 100%
EMAGG 20% 13% 30% 52% -3% -9% 100%

7/31/2019 Lehman Brothers Strategy
http://slidepdf.com/reader/full/lehman-brothers-strategy 27/47
27
Efficient Frontier Argument
Portfolio Return = X1*R1+X2*R2, where X1 and X2 are thepercentage of the portfolio in the two indices; R1 and R2 are theaverage returns for therespective indices
Portfolio Volatility = [(X1^2)*(s1^2)+ (X2^2)*(s2^2) +
2X1X2*(1,2)(s1)(s2)]^(1/2), where (1,2) is the correlationbetween the returns of the two indices
Portfolio Returns are a Weighted Average of Returns
Portfolio Volatility is not a Weighted Averageof Volatility
7/31/2019 Lehman Brothers Strategy
http://slidepdf.com/reader/full/lehman-brothers-strategy 28/47
28
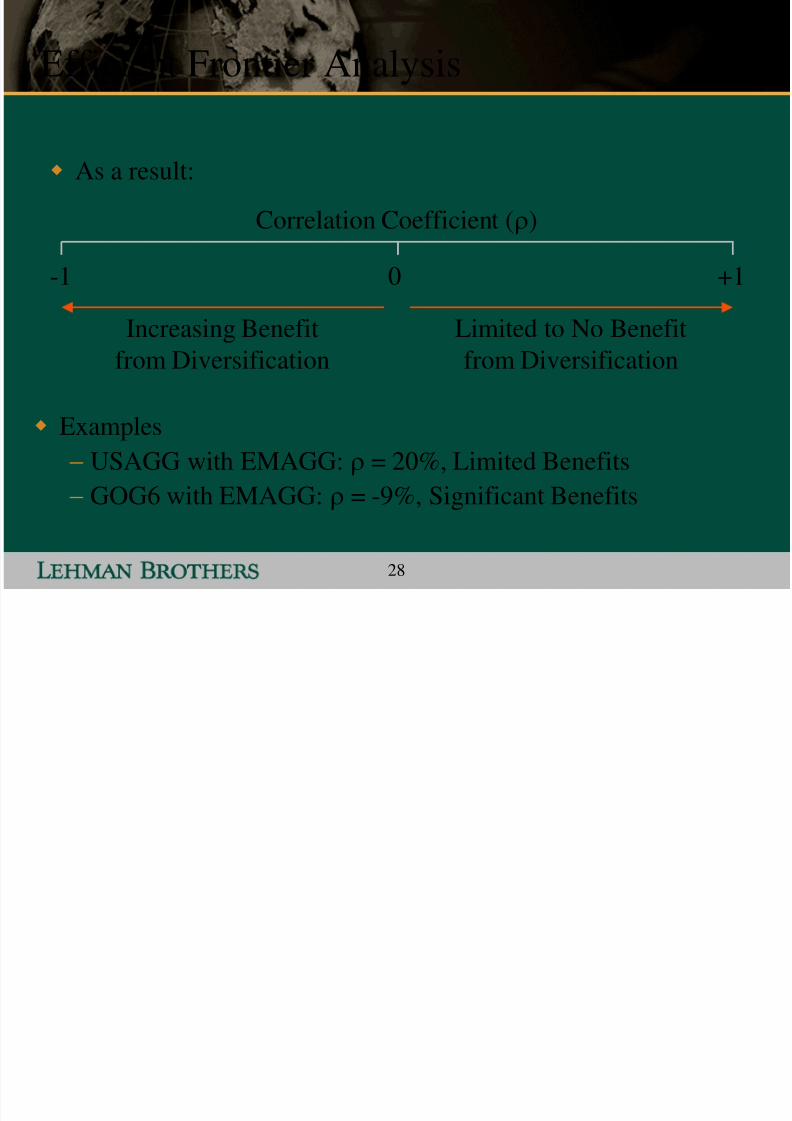
Efficient Frontier Analysis
Examples
USAGG with EMAGG: = 20%, Limited Benefits
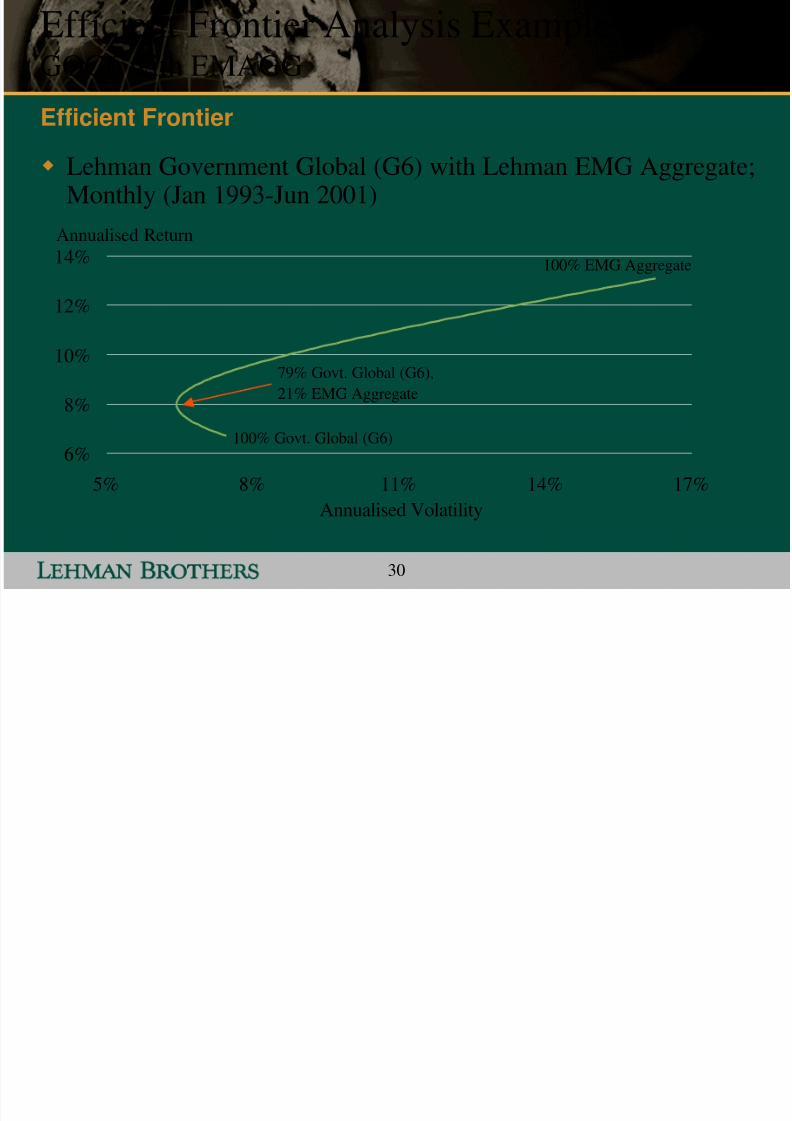
GOG6 with EMAGG: = -9%, Significant Benefits
Correlation Coefficient ()
-1 0 +1
Increasing Benefit
from Diversification
Limited to No Benefit
from Diversification
As a result:
Efficient Frontier Anal sis E amples USAGG
7/31/2019 Lehman Brothers Strategy
http://slidepdf.com/reader/full/lehman-brothers-strategy 29/47
29
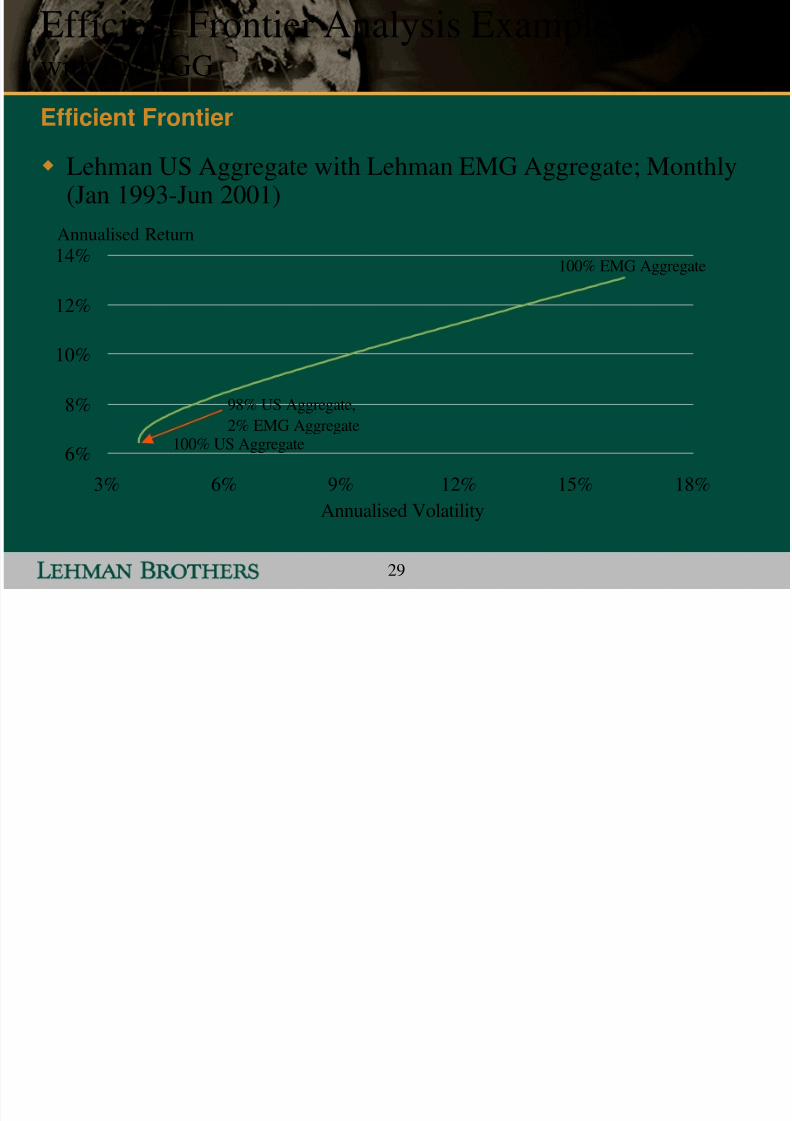
Efficient Frontier Analysis Examples USAGG
with EMAGG
Lehman US Aggregate with Lehman EMG Aggregate; Monthly(Jan 1993-Jun 2001)
Efficient Frontier
6%
8%
10%
12%
14%
3% 6% 9% 12% 15% 18%
Annualised Volatility
98% US Aggregate,
2% EMG Aggregate100% US Aggregate
100% EMG Aggregate
Annualised Return
Efficient Frontier Analysis Examples
7/31/2019 Lehman Brothers Strategy
http://slidepdf.com/reader/full/lehman-brothers-strategy 30/47
30
Efficient Frontier Analysis ExamplesGOG6 with EMAGG
Lehman Government Global (G6) with Lehman EMG Aggregate;Monthly (Jan 1993-Jun 2001)
Efficient Frontier
6%
8%
10%
12%
14%
5% 8% 11% 14% 17%
Annualised Volatility
Annualised Return
79% Govt. Global (G6),
21% EMG Aggregate
100% Govt. Global (G6)
100% EMG Aggregate
Importance of the Asset Class
7/31/2019 Lehman Brothers Strategy
http://slidepdf.com/reader/full/lehman-brothers-strategy 31/47
31
Importance of the Asset ClassContagion and Crossover
Current Yield/Total Return Enhancement
Diversification
The Potential Crossover Stories
Why Invest in Sovereign Markets?
7/31/2019 Lehman Brothers Strategy
http://slidepdf.com/reader/full/lehman-brothers-strategy 32/47
7/31/2019 Lehman Brothers Strategy
http://slidepdf.com/reader/full/lehman-brothers-strategy 33/47
33
200
300
400
500
600
700
800
900
1,000
3-Aug-98 17-Nov-98 3-Mar-99 17-Jun-99 2-Oct-99 16-Jan-00 1-May-00
C a s h f l o w Y i e l d M o d e l
S p r e a d ( b p )
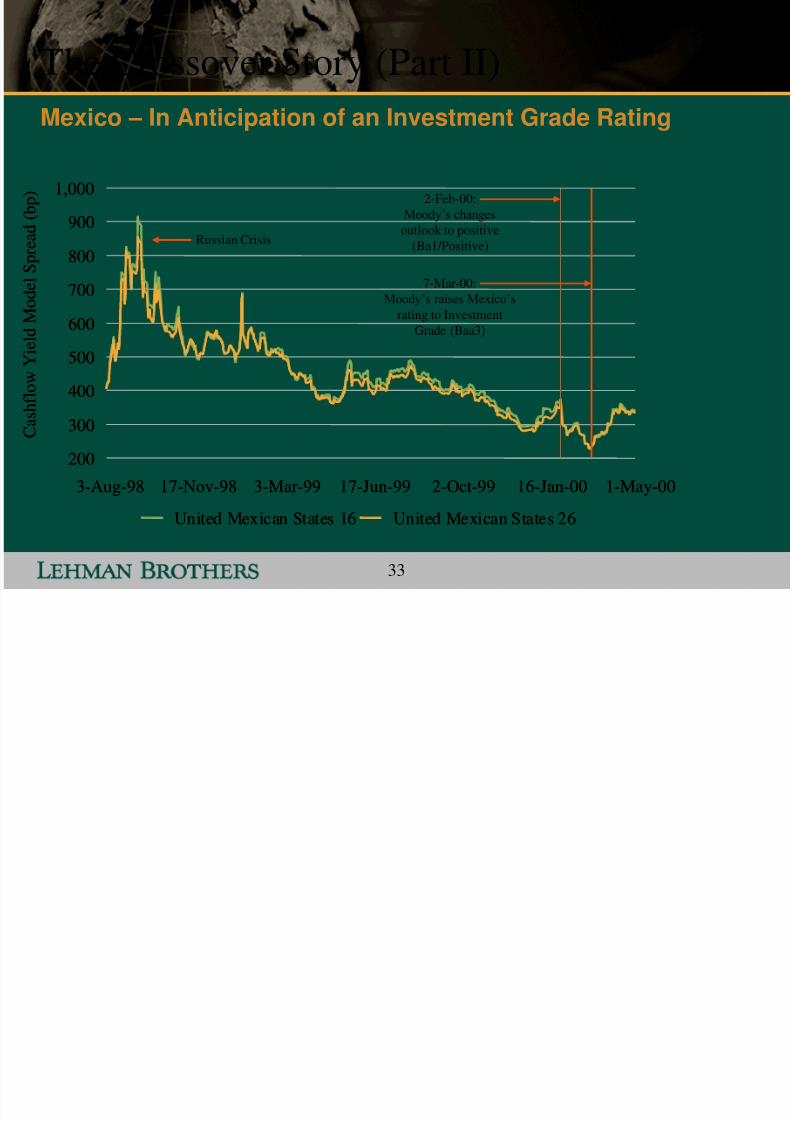
United Mexican States 16 United Mexican States 26
200
300
400
500
600
700
800
900
1,000
3-Aug-98 17-Nov-98 3-Mar-99 17-Jun-99 2-Oct-99 16-Jan-00 1-May-00
C a s h f l o w Y i e l d M o d e l
S p r e a d ( b p )
United Mexican States 16 United Mexican States 26
The Crossover Story (Part II)
Mexico – In Anticipation of an Investment Grade Rating
Russian Crisis
2-Feb-00:
Moody‟s changes
outlook to positive
(Ba1/Positive)
7-Mar-00:Moody‟s raises Mexico‟s
rating to Investment
Grade (Baa3)
Importance of the Asset Class
7/31/2019 Lehman Brothers Strategy
http://slidepdf.com/reader/full/lehman-brothers-strategy 34/47
34
Importance of the Asset ClassContagion and Crossover
Current Yield/Total Return Enhancement
Diversification
The Potential Crossover Stories
Convergence Plays
Why Invest in Sovereign Markets?
7/31/2019 Lehman Brothers Strategy
http://slidepdf.com/reader/full/lehman-brothers-strategy 35/47
35
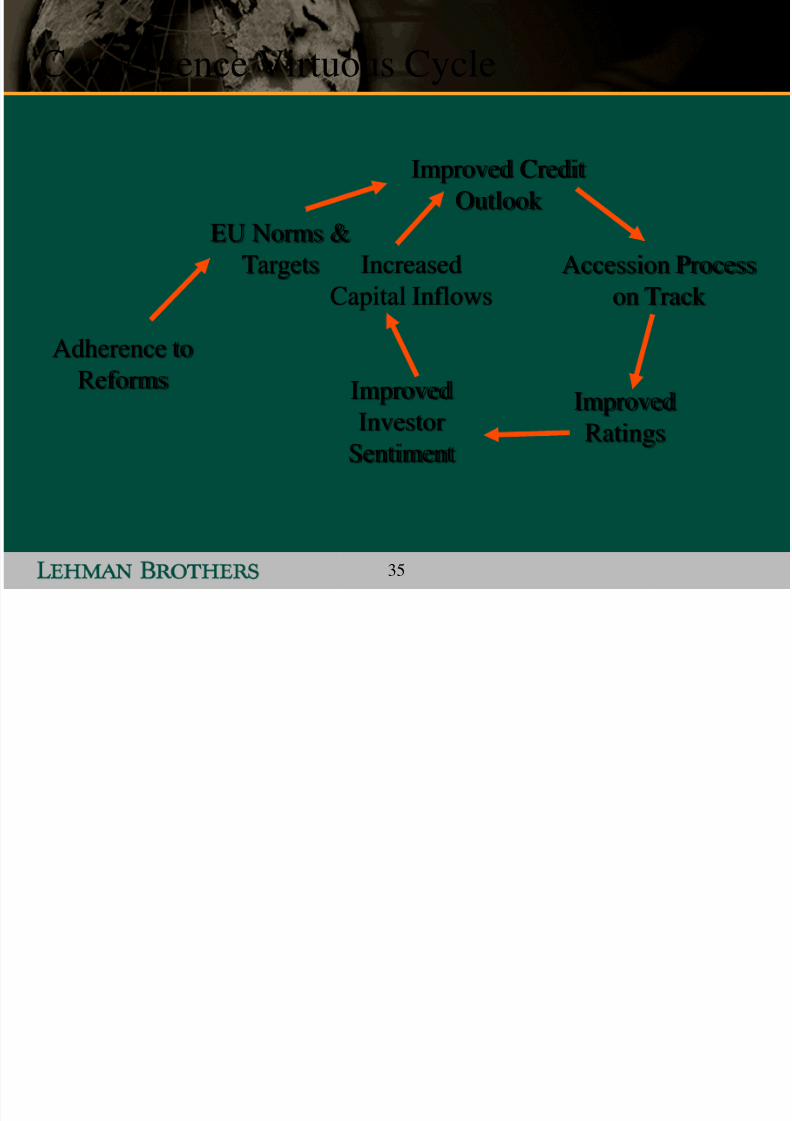
Convergence Virtuous Cycle
Adherence to
Reforms
Improved Credit
Outlook
EU Norms &
Targets Accession Process
on Track
Improved
Ratings
Improved
InvestorSentiment
Increased
Capital Inflows

7/31/2019 Lehman Brothers Strategy
http://slidepdf.com/reader/full/lehman-brothers-strategy 36/47
Applying the Approach
View for 2002

7/31/2019 Lehman Brothers Strategy
http://slidepdf.com/reader/full/lehman-brothers-strategy 37/47
37
Total Return Model Portfolio
Benchmark – LB Emerging Markets Index
Components of the Model Portfolio
EM top down view (regional breakdown)
EM bottom up view (country selection)
Asset selection
• Duration view (based on overall country view)
• US treasury yield curve view (fixed versus floating)
• Collateralized versus non-collateralized
Risk Profile – tracking error analysis Yield curve
Credit spreads
Issuer selection

7/31/2019 Lehman Brothers Strategy
http://slidepdf.com/reader/full/lehman-brothers-strategy 38/47
38
Themes for 2002
5 Themes
High beta countries will outperform in H1‟02
Commodity and oil prices
• Demand factors may dominate – countries that can sustainlow oil prices will outperform
Limited financing requirements
• Watch current account/current account dynamics
Argentina: has it completely decoupled?
Politics – Implication of a war in Iraq and continued conflictin Israel/Palestine

7/31/2019 Lehman Brothers Strategy
http://slidepdf.com/reader/full/lehman-brothers-strategy 39/47
39
Themes for 2002
1. Emerging Markets as a Yield Play
Emerging Markets remain attractive from a yield standpointin H1 „02
• Outlook for EM ex-Argentina still robust (fundamentals strong,
financing requirements limited) Assumption: Global growth conditions remain weak in H1 ‟02; pick up
in H2 ‟02
• Fed bias in Q1 (and probably Q2) towards growth – bias will changeto inflation in Q2 and beyond
• Watch for strong economic data as a precursor to a change in bias Current trade: EM cheap (relative to treasury) begins to get reversed…
• Relative yield differential declines as Fed begins to act on inflation
H1 ‟02: High beta names (Russia, Brazil etc.) do well
7/31/2019 Lehman Brothers Strategy
http://slidepdf.com/reader/full/lehman-brothers-strategy 40/47
40
Themes for 2002
2. Commodity prices: A play on global growth
Oil prices, commodity prices remain soft to low as long globalgrowth remains weak
• LB oil forecast for 2002: $17 p/b
If V-shaped recovery does not play out, oil prices remain soft for alonger period
Russia will be ok – strong reserve build up, stabilization fund,changed geopolitical environment
Venezuela will be more worrisome
• Deteriorating fiscal situation, troubling politics

7/31/2019 Lehman Brothers Strategy
http://slidepdf.com/reader/full/lehman-brothers-strategy 41/47
41
Themes for 2002
3. Financing Requirements Current Account, Capital Account: will it change in 2002? Major EM Countries – Limited gross external financing
requirements Multilateral (especial IMF) flushed with liquidity
Brazil: Net financing requirement $12 billion, of which public sectorwill need at most $6 billion
Russia: Zero financing requirement (even if oil remains atlow levels)
Turkey: Moral Hazard at play Argentina: Covered?….but other more important issues to consider
Relative to available cash, overall financing requirements seemfairly innocuous
7/31/2019 Lehman Brothers Strategy
http://slidepdf.com/reader/full/lehman-brothers-strategy 42/47
42
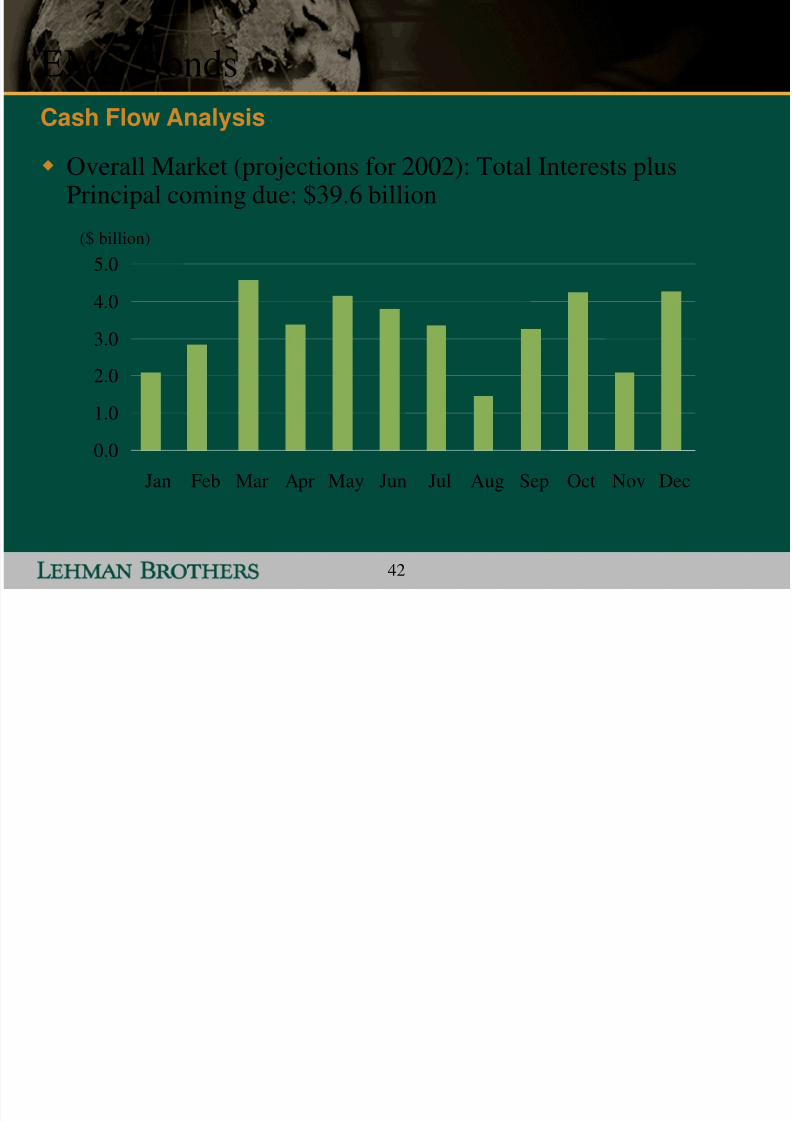
EMG Bonds
Overall Market (projections for 2002): Total Interests plusPrincipal coming due: $39.6 billion
($ billion)
0.01.0
2.0
3.0
4.0
5.0
Jan Feb Mar Apr May Jun Jul Aug Sep Oct Nov Dec
Cash Flow Analysis
7/31/2019 Lehman Brothers Strategy
http://slidepdf.com/reader/full/lehman-brothers-strategy 43/47
43
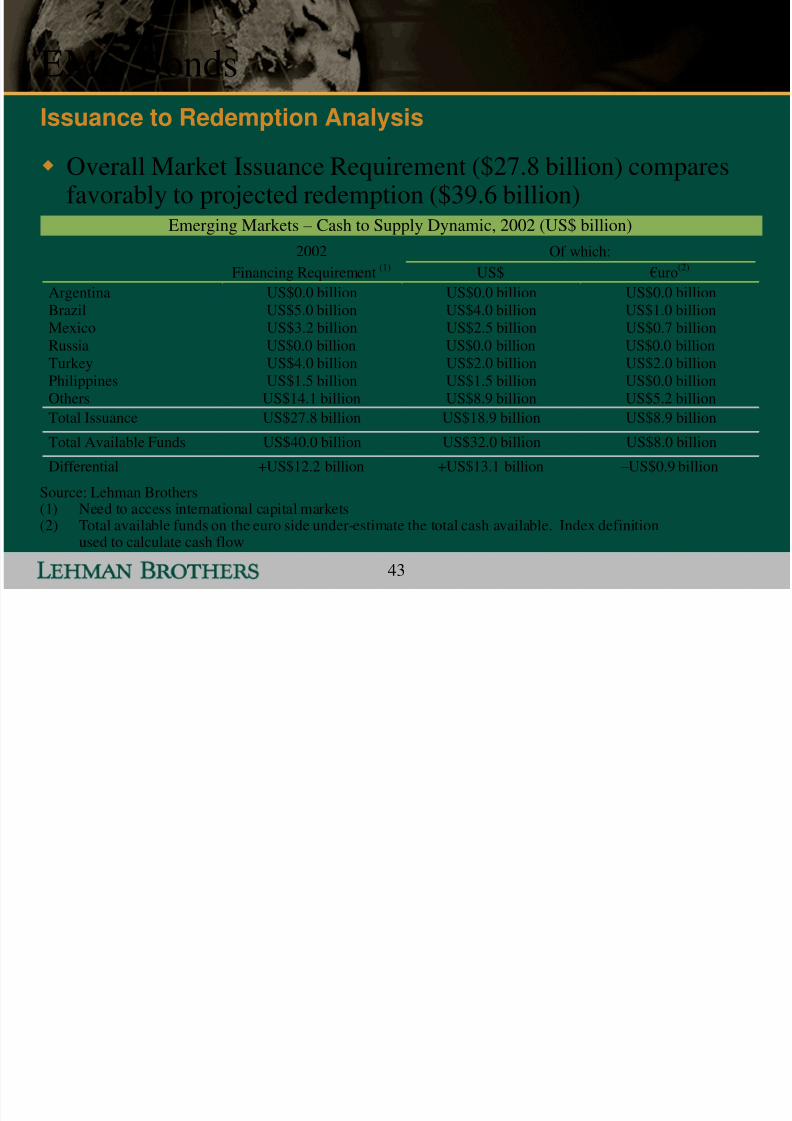
EMG Bonds
Overall Market Issuance Requirement ($27.8 billion) comparesfavorably to projected redemption ($39.6 billion)
Issuance to Redemption Analysis
Emerging Markets – Cash to Supply Dynamic, 2002 (US$ billion)
2002 Of which:
Financing Requirement (1) US$ €uro(2)
Argentina US$0.0 billion US$0.0 billion US$0.0 billionBrazil US$5.0 billion US$4.0 billion US$1.0 billionMexico US$3.2 billion US$2.5 billion US$0.7 billionRussia US$0.0 billion US$0.0 billion US$0.0 billionTurkey US$4.0 billion US$2.0 billion US$2.0 billionPhilippines US$1.5 billion US$1.5 billion US$0.0 billionOthers US$14.1 billion US$8.9 billion US$5.2 billion
Total Issuance US$27.8 billion US$18.9 billion US$8.9 billionTotal Available Funds US$40.0 billion US$32.0 billion US$8.0 billion
Differential +US$12.2 billion +US$13.1 billion – US$0.9 billion
Source: Lehman Brothers(1) Need to access international capital markets(2) Total available funds on the euro side under-estimate the total cash available. Index definition
used to calculate cash flow
7/31/2019 Lehman Brothers Strategy
http://slidepdf.com/reader/full/lehman-brothers-strategy 44/47
44
Themes for 2002
4. Argentina: has it decoupled completely?
Recent price action suggests market has decoupled from Argentina
• Potentially more downside for Argentina
• Rest of the market: limited contagion fears
• Only exception: Brazil (potential peso devaluation could put
pressure on the real/interest rates/growth debt dynamics)
Buy opportunities for the rest of the Market
7/31/2019 Lehman Brothers Strategy
http://slidepdf.com/reader/full/lehman-brothers-strategy 45/47
45
Themes for 2002
5. Politics
Geopolitical Considerations
• Security remains of paramount importance
• Attack on Iraq?
• Negative for Turkey, Qatar, Egypt etc.• Political implications for Russia and Turkey
• Conflict between Israel and Palestine: broader implication for theregion and global politics?
Domestic Politics
• Elections in Brazil• Venezuela: The Chavez Drama
• Nothing significant in Asia and Europe
7/31/2019 Lehman Brothers Strategy
http://slidepdf.com/reader/full/lehman-brothers-strategy 46/47
46
An Example of Lehman Analysis
Moral Hazard Trade at Play
Debt rollover and domestic financing gap covered
Positive implications for currency, deposit composition and debtdynamics
It is not about the money, it is all about confidence Currency and deposit switch
Debt dynamics
Rollover flexibility
Confidence and investor sentiment will improve only if authoritiesundertake credible and strong implementation of the reform agenda
Will Turkey Outperform in 2002?

7/31/2019 Lehman Brothers Strategy
http://slidepdf.com/reader/full/lehman-brothers-strategy 47/47
An Example of Lehman Analysis
Risks on the Horizon
Challenging economic environment
Challenging global environment
Domestic political risks
A war with Iraq? Are the spreads too tight?
At 200 bps tight to the overall index and 300 bps to Brazil, Turkeyoffers limited near-term upside
Strong performance since beginning of September (has
outperformed regional peers incl.. Russia) Although attractive from a diversification standpoint, near-term out-
performance is conditional on significant and credible progress onthe reform agenda – especially banking sector
Will Turkey Outperform in 2002?