lecture 2: measured quantities and intro to telescopes
TRANSCRIPT

PHYS 7810: Solar Physics with DKISTLecture 2: Measured Quantities and
Intro to Telescopes Ivan Milic [email protected]

Previous class● We discussed the structure of the Sun very briefly and focused on the fact that the
light that we directly receive comes to us from the atmosphere.● We discussed few physical phenomena that happen in the atmosphere. ● We emphasized that we need specifically designed observations to understand the
phenomena (spectra in case of granulation, spectra/polarization in case of the sunspots, polarization in case of prominences, etc.)
● I stressed (perhaps annoyingly much) the importance of having multiwavelength observations.
● These can be images in different filters (e.g. SDO), or, when we do spectroscopy, 3D datacubes. (two spatial coordinates + wavelength, HINODE, various ground based data).

F. A. Iglesias & A. Feller Techniques in solar polarimetry 3
Wavelength discriminators
Spectroscopic mapping
4
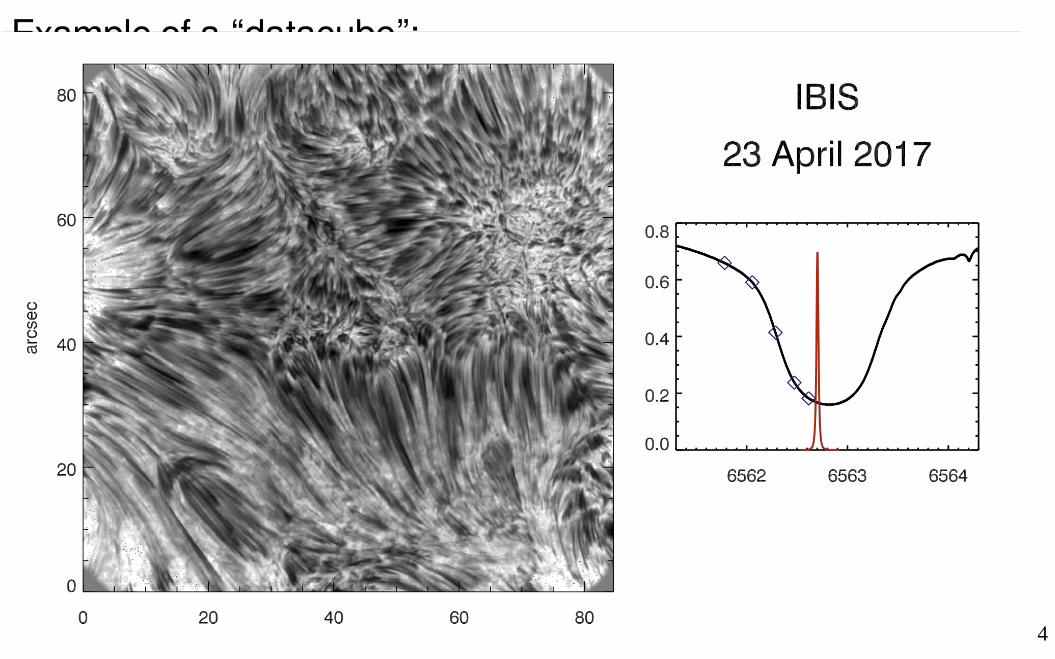
Example of a “datacube”:
Credits : DST/ IBIS
Different wavelengths → different layers of the solar atmosphere

5
Let’s try and infer “something” from this plot:

6
How would you proceed?
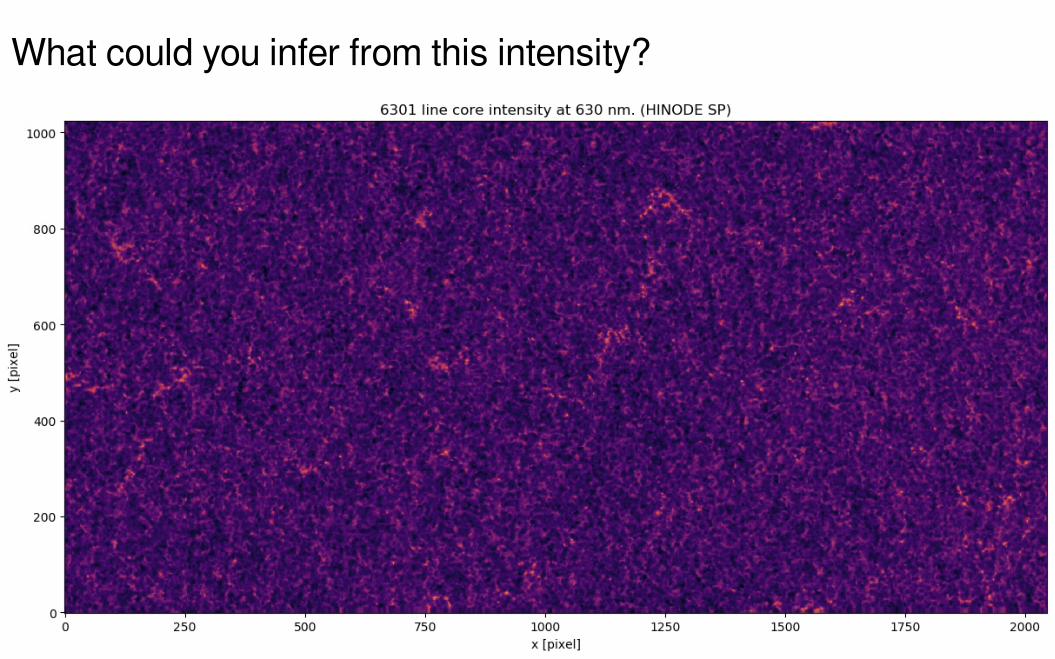
● Zeroth level approximation would be to say the atmosphere radiates as a blackbody.● But how to infer the specific intensity? ● Compare intensity at each pixel to the mean quiet Sun intensity and infer temperature
that way? ● What are the problems of this approach. ● What about looking at this figure at a different wavelength?
7
What could you infer from this intensity?

8
What do we want to measure : Specific monochromatic intensity
● Let’s work out the units for this together and understand what it tells us.
This is the definition:
This is the intensity corresponding to a specific approximation (blackbody)

9
Let’s see if we understand what this means ● Specific monochromatic intensity perpendicular to a given pixel (100 km x 100 km) in
given direction at wavelength of 630 nm is 2E13 in SI units. ● How would you go on about estimating total number of photons leaving that surface in
the given solid angle (say, 5E-22 srad), in a wavelength band 0.01A wide, in one second? (take 5 mins to solve this one)
Right, the result is: ~ 4E8
The reason why I chose these specific numbers will become clear soon ;)

10
How the telescopes work, a rough sketch
● Telescopes have better “resolving power” (can see smaller details, more about this in the next class)
● Telescopes can collect more light. ● We can hook up various instruments to the telescope and measure spectral
distribution and polarization. ● Telescopes have good pointing ;)
Why don’t we use our eyes for solar observations?
Credits : amazing SPACE
11
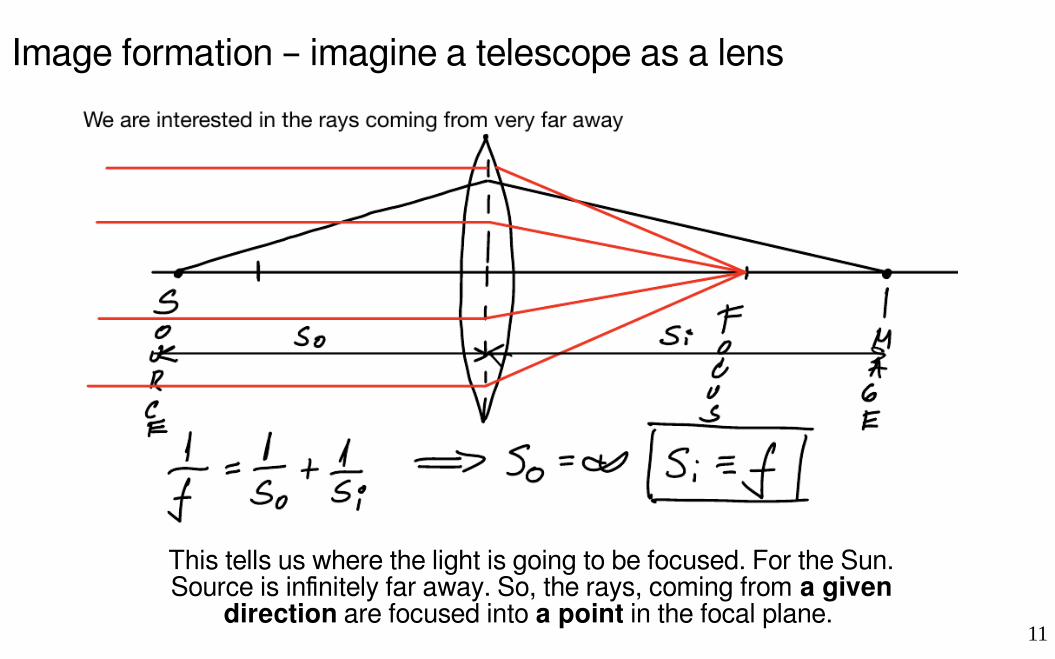
Image formation – imagine a telescope as a lens
This tells us where the light is going to be focused. For the Sun. Source is infinitely far away. So, the rays, coming from a given
direction are focused into a point in the focal plane.

12
Image formation – imagine a telescope as a lensNow, if we have the light coming from two different directions, it is going to be
focused in two different points. (This is how spherical lenses work, convince yourself using symmetry).

13
Image formation – imagine a telescope as a lensSo the image of an finite object very far away (not saying infinite on purpose), is going
to be formed in the focal plane. That is where we put our detector.

14
Differences between points and finite objects● Stellar image (point) brightness scales as D^2, because the source is neverresolved
(D is the diameter of the telescope).● However, for finite objects, size of image scales with the focal length, so, greater f,
smaller image brightness. Scales as (D/f)^2● In photography, we call D/f – aperture ● In astronomy – f-ratio (f/D)● High f-ratio – slow system (needs long exposure, but image is bigger, and less
heating) ● Low f-ratio – fast system (surprise, surprise, allows fast exposure, but image is
smaller, we need to think about limits of our detectors)

15
For slow telescopes, image can be really big:
Credits : McMath Pierce Solar Telescope

16
A telescope we are used to (aperture lens + eyepiece)
Credits : Achim Gandorfer

17
In real telescopes ● Primary telescope focusing elements are mostly mirrors (although for example, SST uses a
lens) ● There is more than one focus (this means we have a system of lenses and mirrors), and the
measurements are not done in the primary focus. (among other things, it would be too hot!) ● Therefore, sketching out the image formation is not as trivial as we did before. ● However, we still can define “effective” focal length, from which we can deduce how is our
image going to look.● It is good to know, at least roughly, how the optics of your telescope works so you can
immediately know if your scientific idea is feasible. ● Examples: we can’t look at small scale reconnection using SDO, but we also can’t look at
large-scale events using DKIST instruments.

18
Ok let’s do a little test ● Does size of the lens influence the size of the image? ● What does? ● Can you estimate the size of the solar disk as seen by a telescope with effective focal
length 5m?● Typical pixel size of a CCD is ~ 10 micrometers. How big CCD we need to fit the
whole Sun? The size of the solar disk in the focal plane is 4.65 cm
We need a 4650 x 4650 pixel camera. Actually, SDO cameras are 4k x 4k. Checks out!
What is the angular coverage of each pixel?
DKIST will have much higher effective focal length, because we want focus on the small regions of the Sun and resolve them.

19
For example, VBI (Visible Broadband Imager) ● Imager → means we are looking
primarily to make images of the solar atmosphere
● Broadband → We focus on wide “bands” in wavelengths. For solar physics, everything over 1 Angstrom is wide :)
● Visible → Means we focus on visible wavelengths (DKIST can also observe in IR, not in UV though)
● Optical field of view – 2 arcminsPhysical (CCD) – 45 arcsec in blue, 69 arcsec in the red
Credits: www.nso.edu

20
From emergent intensity to our detector ● Specific monochromatic intensity: energy transported per oriented unit surface, per unit
solid angle, in unit time, per unit wavelength. ● If we integrate emergent intensity over angle, wavelength, surface and time we are
going to get some energy. This integration depends on sampling. ● Typically, we integrate over small angle, wavelength, surface and time so we can
assume our intensity is constant there. ● Divide that with an energy of a single photon, we get the number of photons. ● These photons eventually get collected by our telescope and detected by our CCD. i.e.
they are turned into digital counts.● (This is the ideal case. Photons are lost in the atmosphere, telescope, instrument +
CCD does not have 100% efficiency).
21
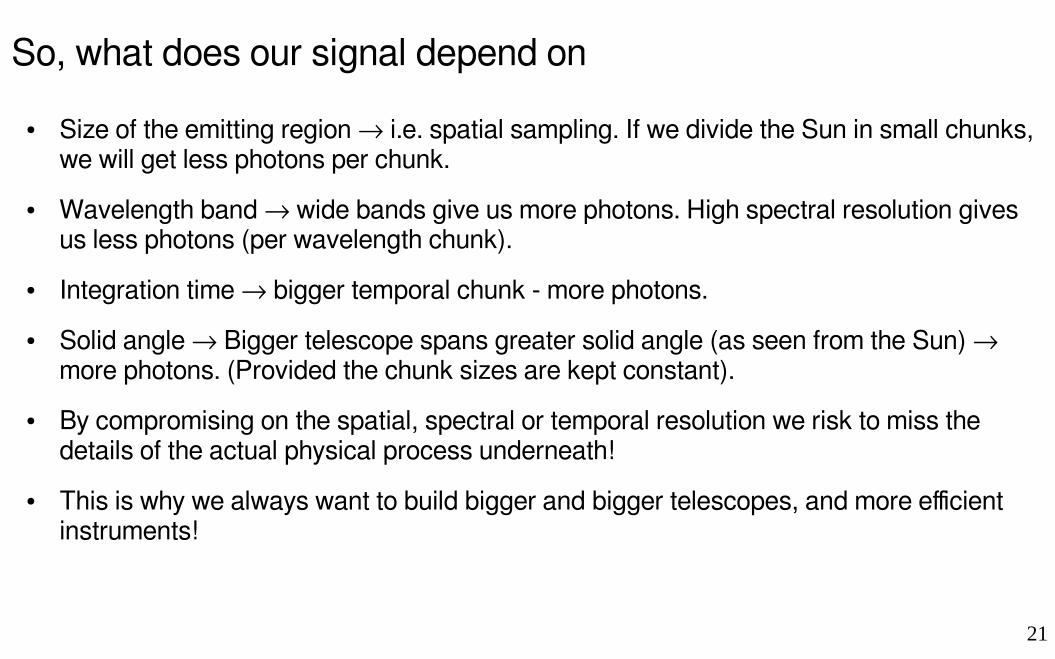
So, what does our signal depend on● Size of the emitting region → i.e. spatial sampling. If we divide the Sun in small chunks,
we will get less photons per chunk. ● Wavelength band → wide bands give us more photons. High spectral resolution gives
us less photons (per wavelength chunk). ● Integration time → bigger temporal chunk - more photons. ● Solid angle → Bigger telescope spans greater solid angle (as seen from the Sun) →
more photons. (Provided the chunk sizes are kept constant). ● By compromising on the spatial, spectral or temporal resolution we risk to miss the
details of the actual physical process underneath!● This is why we always want to build bigger and bigger telescopes, and more efficient
instruments!

22
Some additional photometric quantities (more relevant for stars)
This is the so called (monochromatic) flux
We can call this (monochromatic) luminosity
(i.e. total flux) This would be monochromatic
irradiance. We can measure this.
Let’s spend a moment discussing what are the units here, and how to describe the quantities.
23
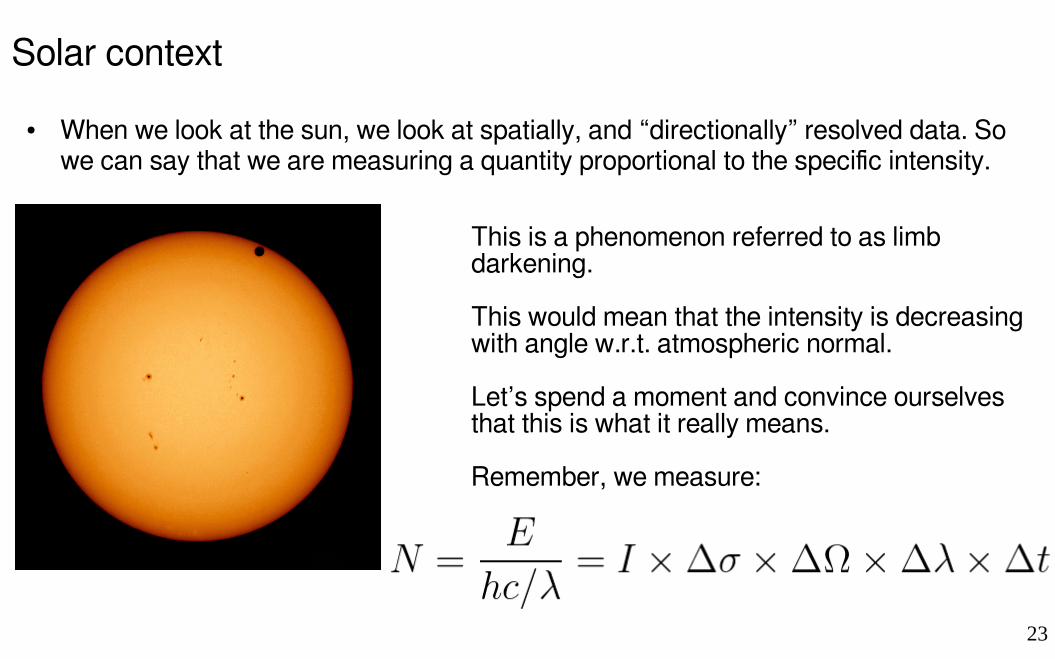
Solar context ● When we look at the sun, we look at spatially, and “directionally” resolved data. So
we can say that we are measuring a quantity proportional to the specific intensity.
This is a phenomenon referred to as limb darkening. This would mean that the intensity is decreasing with angle w.r.t. atmospheric normal.Let’s spend a moment and convince ourselves that this is what it really means. Remember, we measure:

24

25
Sampling ● Sampling refers to the frequency (spatial, temporal, spectral) of, well, taking samples
of the data :) ● Spatial: in how small chunks you divide your image (“How many megapixels does
your mobile camera have???”)● Temporal: How often did we collect the data / how long time interval does the data
cover (cadence) ● Spectral: in how many wavelength “bins” did we divide our data (applies to
spectrographs; Are there gaps between spectral samples for FP) ● Sampling is not “resolution” (But it should follow from it.)● Sampling depends on our detector and process of measuring. Resolution
depends on our optical system / dispersion elements. ● Why can’t these quantities be arbitrary? (E.g. why don’t we take a gazillion pixel
camera and make most amazing images of the Sun? - discuss)

26
So to recoup ● We measure counts on the detector (camera) ● These counts are ultimately related to the specific monochromatic intensity that
leaves the surface of the Sun (that is, the top of the atmosphere) ● We can also measure the degree of polarization (soon more about it) ● There are many instrumental effects modifying what we measure
(part 1 of the course)● Even in the ideal case, if we could measure counts perfectly and infer the intensities
perfectly, we cant measure physical parameters perfectly (part 2 of the course). ● Let’s discuss now a bit, where does the intensity come from?

27
Let’s look at a datacube that can be used for science● Open lites_qs.fits ● Visualize varios “slices” and familiarize yourself with the data● You will need python with matplotlib, numpy and astropy