lecture-2 - · pdf filelecture-2 data and signals- analog signal . 3.2 analog and digital...
TRANSCRIPT

3.1
LECTURE-2
Data and Signals- Analog Signal
3.2
ANALOG AND DIGITAL
Data can be analog or digital. The term analog data
refers to information that is continuous; digital data
refers to information that has discrete states. Analog
data take on continuous values. Digital data take on
discrete values.
• Analog and Digital Data
• Analog and Digital Signals
• Periodic and Nonperiodic Signals
Topics discussed in this section:

3.3
• Analogy: Real number vs. Integer number.
• Analog data example: voice, temperature
captured by analog sensor.
• Data can be analog or digital. Analog data are
continuous and take continuous values.
• Digital data have discrete states and take discrete
values.
ANALOG & DIGITAL DATA

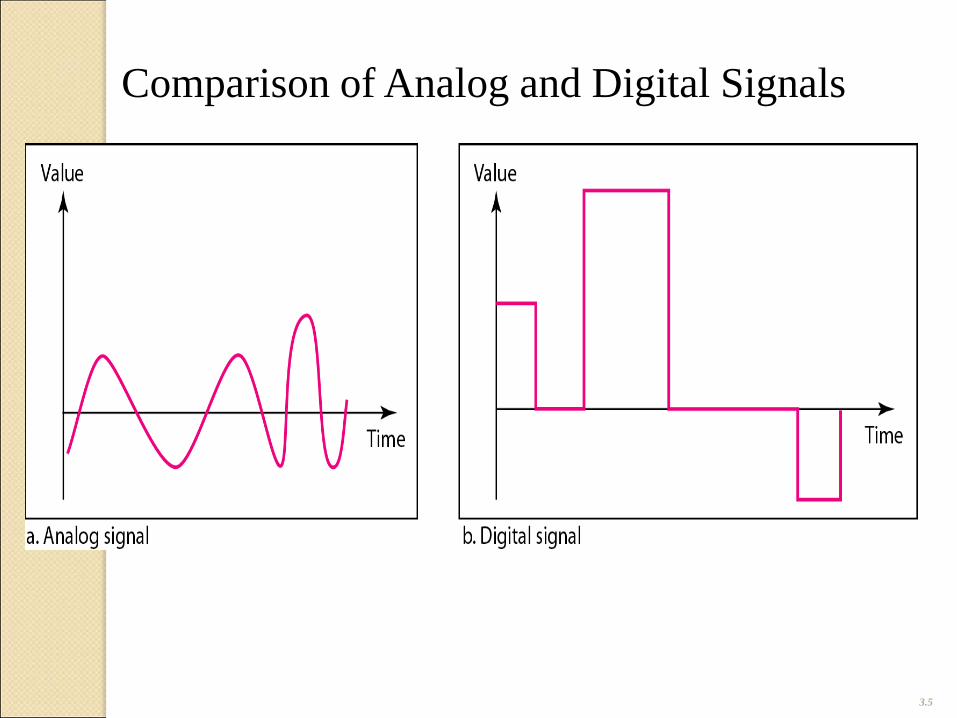
• Signals can be analog or digital.
• Analog signals can have an infinite number of
values in a range.
• Digital signals can have only a limited number
of values.
ANALOG & DIGITAL SIGNAL
3.5
Comparison of Analog and Digital Signals
• In data communications, we commonly use
periodic and non-periodic signals.
• Periodic analog signal is used as data carrier (such
as AM/FM radio)
• Non-Periodic signal for example human voice on
microphone.
Periodic Vs Non-Periodic Signals

Periodic Signals Nonperiodic Signals
3.7

3.8
Periodic Analog Signals
Periodic analog signals can be classified as simple
or composite. A simple periodic analog signal, a
sine wave, cannot be decomposed into simpler
signals. A composite periodic analog signal is
composed of multiple sine waves.
• Sine Wave
• Wavelength
• Time and Frequency Domain
• Composite Signals
• Bandwidth
Topics discussed in this section

3.9
A Sine Wave
T=1/f

Sine Wave Parameters
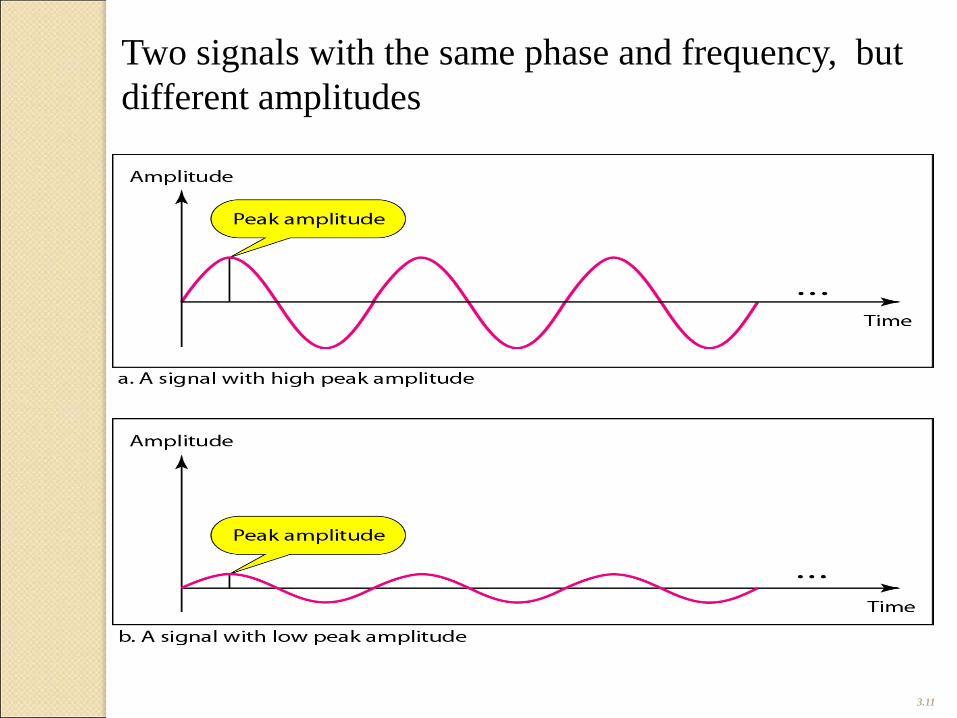
Peak amplitude (A)
◦ maximum strength of signal
◦ volts
Frequency (f)
◦ rate of change of signal
◦ Hertz (Hz) or cycles per second
◦ period = time for one repetition (T)
◦ T = 1/f
Phase ()
◦ relative position in time
3.10
3.11
Two signals with the same phase and frequency, but
different amplitudes

3.12
The voltage of a battery is a constant;
this constant value can be considered a
sine wave, as we will see later.
For example, the peak value of an AA
battery is normally 1.5 V.
Example

Frequency and period are the inverse of
each other.

3.14
Two signals with the same amplitude and phase,
but different frequencies

3.15
Units of Period and Frequency

3.16
The power we use at home has a frequency of 60
Hz. The period of this sine wave can be determined
as follows:
Example

3.17
Express a period of 100 ms in microseconds.
Example
Solution
From the table we find the equivalents of 1 ms (1 ms
is 10−3 s) and 1s (1s is 106 μs). We make the
following substitutions.
3.18
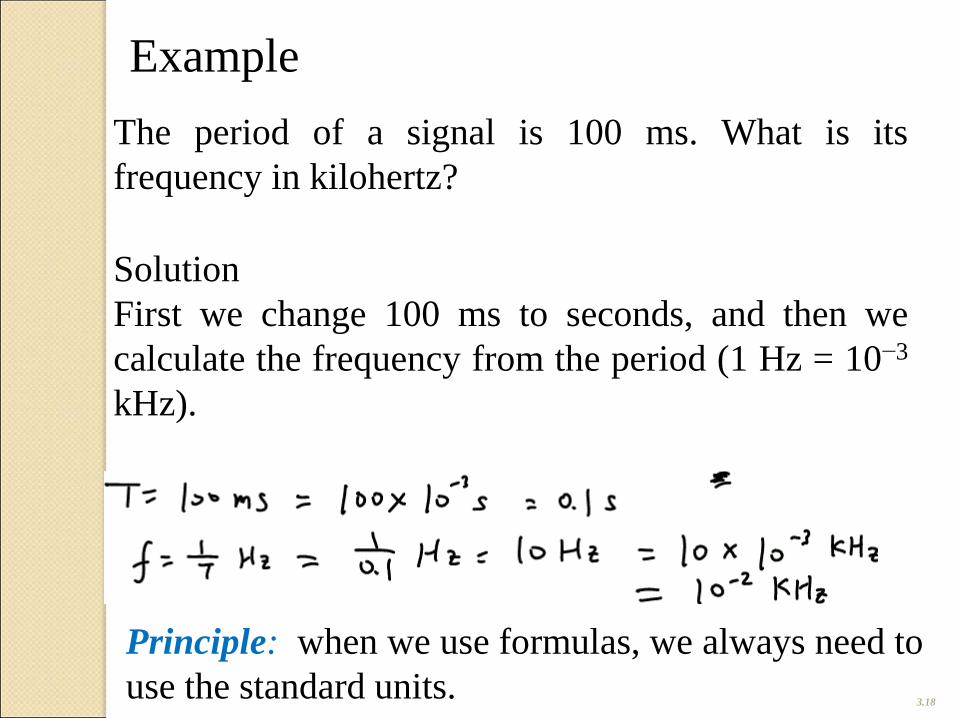
The period of a signal is 100 ms. What is its
frequency in kilohertz?
Example
Solution
First we change 100 ms to seconds, and then we
calculate the frequency from the period (1 Hz = 10−3
kHz).
Principle: when we use formulas, we always need to
use the standard units.
• Frequency is the rate of change with respect to
time.
• Change in a short span of time means high
frequency.
• Change over a long span of time means low
frequency.
• If a signal does not change at all, its frequency is
zero.
General Concepts
• If a signal changes instantaneously, its frequency
is infinite.
• Phase describes the position of the waveform
relative to time 0.
General Concepts…

3.21
Three sine waves with the same amplitude and frequency, but
different phases
π/2 rad
π rad
Phase unit: degree (360o) or radians (2 rad)

3.22
A sine wave is offset 1/6 cycle with respect to time 0.
What is its phase in degrees and radians?
Example
Solution
We know that 1 complete cycle is 360°. Therefore,
1/6 cycle is
Wavelength ()
is distance occupied by one cycle
◦ Another word, distance is a simple signal travels
in one period.
between two points of corresponding phase in two
consecutive cycles.
assuming signal velocity v have = vT
standard unit: meter (m)
3.23

3.24
Wavelength and Period
3.25
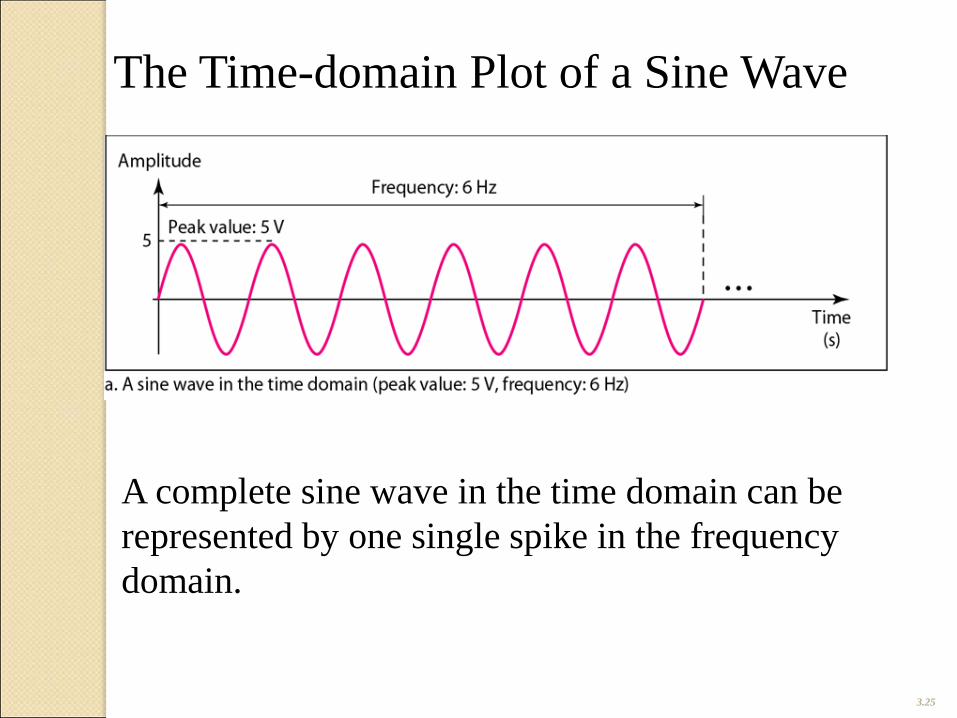
The Time-domain Plot of a Sine Wave
A complete sine wave in the time domain can be
represented by one single spike in the frequency
domain.

The Frequency-domain Plot of a Sine Wave

3.27
The Time Domain and Frequency Domain
of Three Sine Waves
The frequency domain is more compact and useful
when we are dealing with more than one sine wave.
Figure shows three sine waves, each with different
amplitude and frequency. All can be represented by
three spikes in the frequency domain.
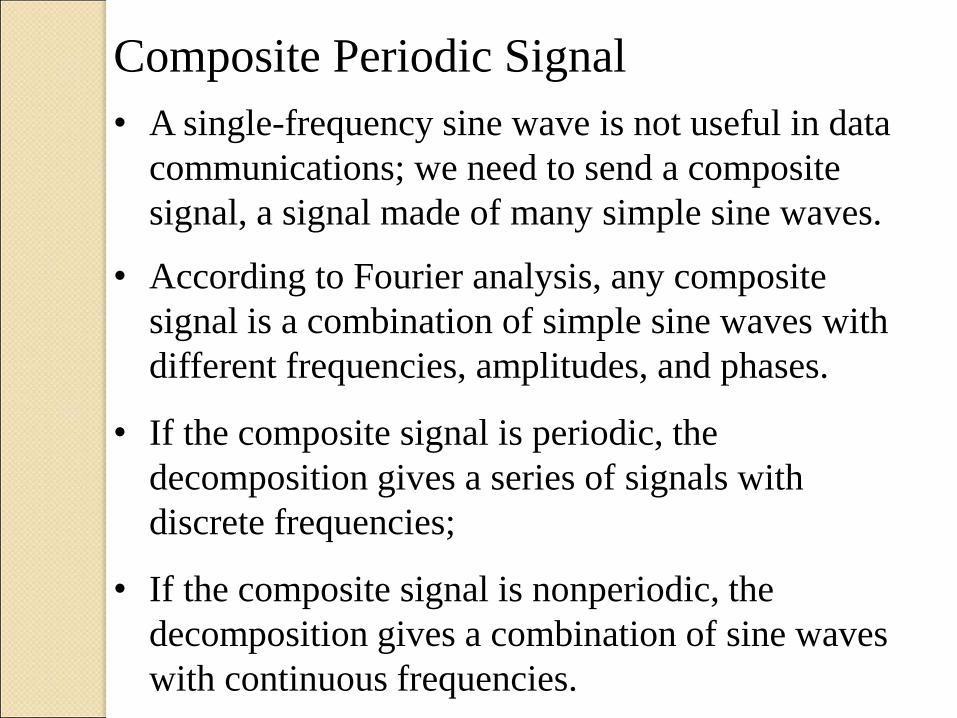
• A single-frequency sine wave is not useful in data
communications; we need to send a composite
signal, a signal made of many simple sine waves.
• According to Fourier analysis, any composite
signal is a combination of simple sine waves with
different frequencies, amplitudes, and phases.
• If the composite signal is periodic, the
decomposition gives a series of signals with
discrete frequencies;
• If the composite signal is nonperiodic, the
decomposition gives a combination of sine waves
with continuous frequencies.
Composite Periodic Signal

Composite Periodic Signal…
Figure shows a periodic composite signal with
frequency f. This type of signal is not typical of
those found in data communications. We can
consider it to be three alarm systems, each with a
different frequency. The analysis of this signal can
give us a good understanding of how to decompose
signals.
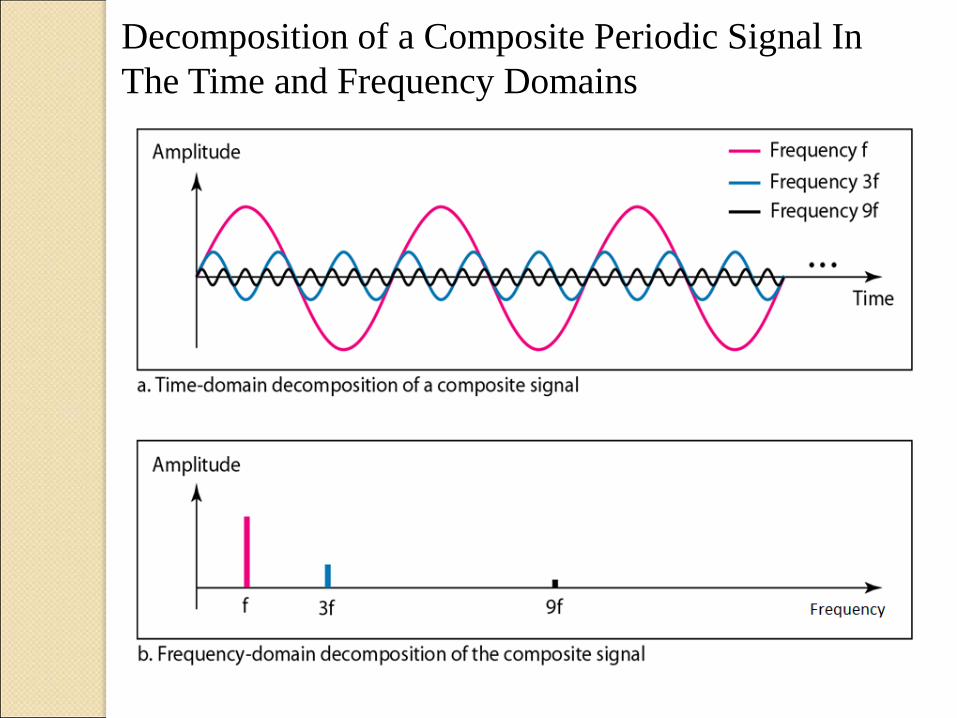
Decomposition of a Composite Periodic Signal In
The Time and Frequency Domains

Composite Signals
f is called fundamental frequency or first
harmonic.
3f and 9f are the third and ninth harmonics of
the composite signal, respectively.
3.32
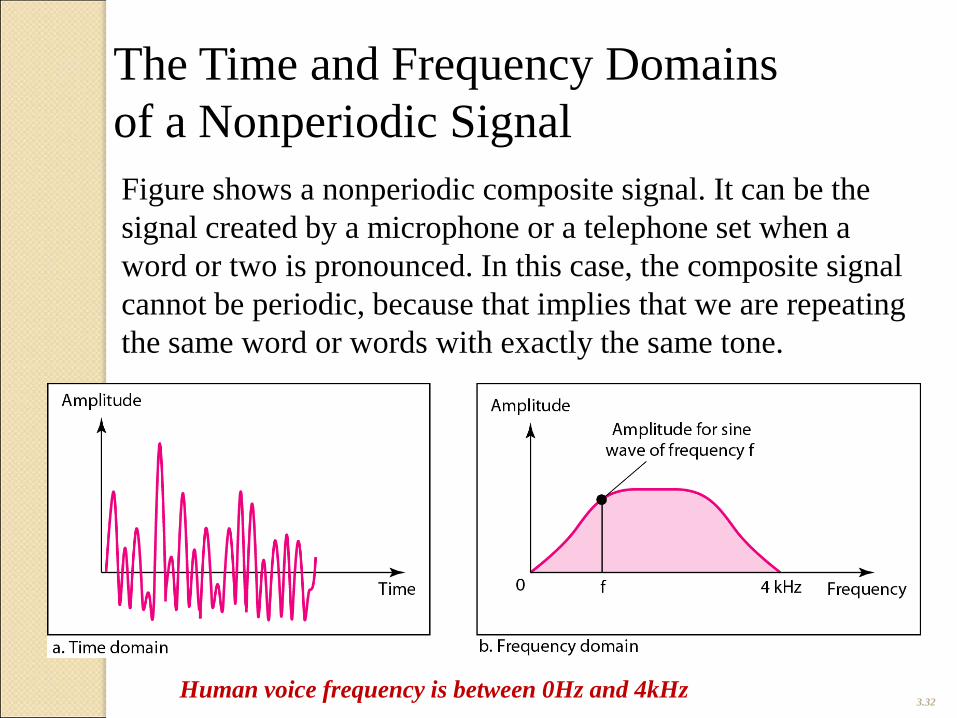
The Time and Frequency Domains
of a Nonperiodic Signal
Human voice frequency is between 0Hz and 4kHz
Figure shows a nonperiodic composite signal. It can be the
signal created by a microphone or a telephone set when a
word or two is pronounced. In this case, the composite signal
cannot be periodic, because that implies that we are repeating
the same word or words with exactly the same tone.
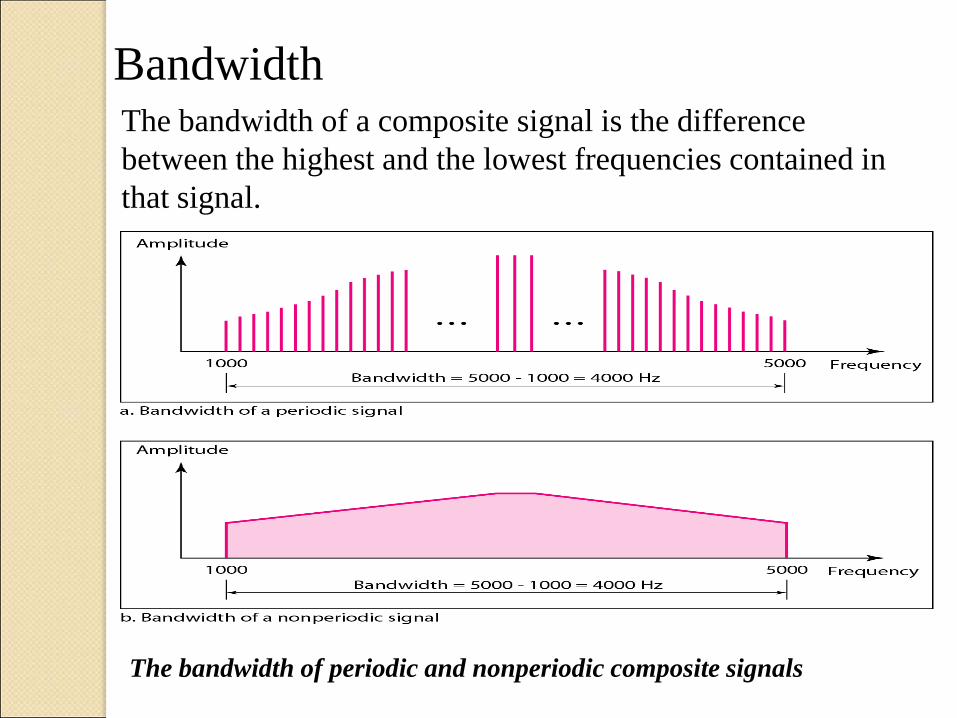
The bandwidth of a composite signal is the difference
between the highest and the lowest frequencies contained in
that signal.
Bandwidth
The bandwidth of periodic and nonperiodic composite signals

3.34
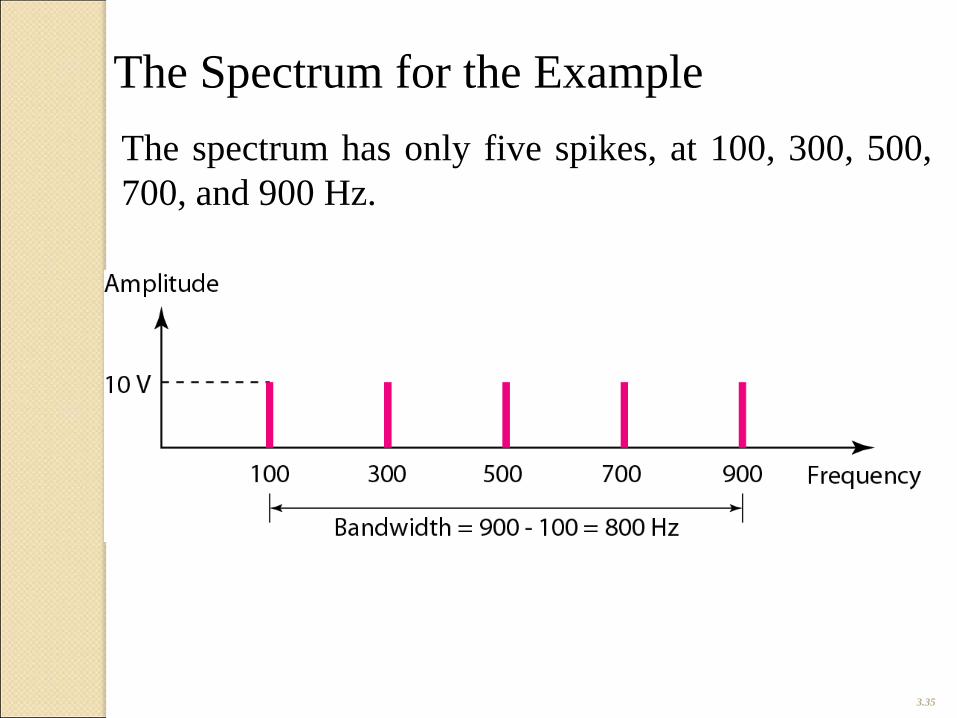
If a periodic signal is decomposed into five sine
waves with frequencies of 100, 300, 500, 700, and
900 Hz, what is its bandwidth?
Draw the spectrum, assuming all components have a
maximum amplitude of 10 V.
Solution
Let fh be the highest frequency, fl the lowest
frequency, and B the bandwidth. Then
Example
3.35
The Spectrum for the Example
The spectrum has only five spikes, at 100, 300, 500,
700, and 900 Hz.

3.36
A periodic signal has a bandwidth of 20 Hz. The
highest frequency is 60 Hz. What is the lowest
frequency? Draw the spectrum if the signal contains
all frequencies of the same amplitude.
Solution
Let fh be the highest frequency, fl the lowest
frequency, and B the bandwidth. Then
The spectrum contains all integer frequencies. We
show this by a series of spikes.
Example

3.37
The Bandwidth Spectrim of Example

3.38
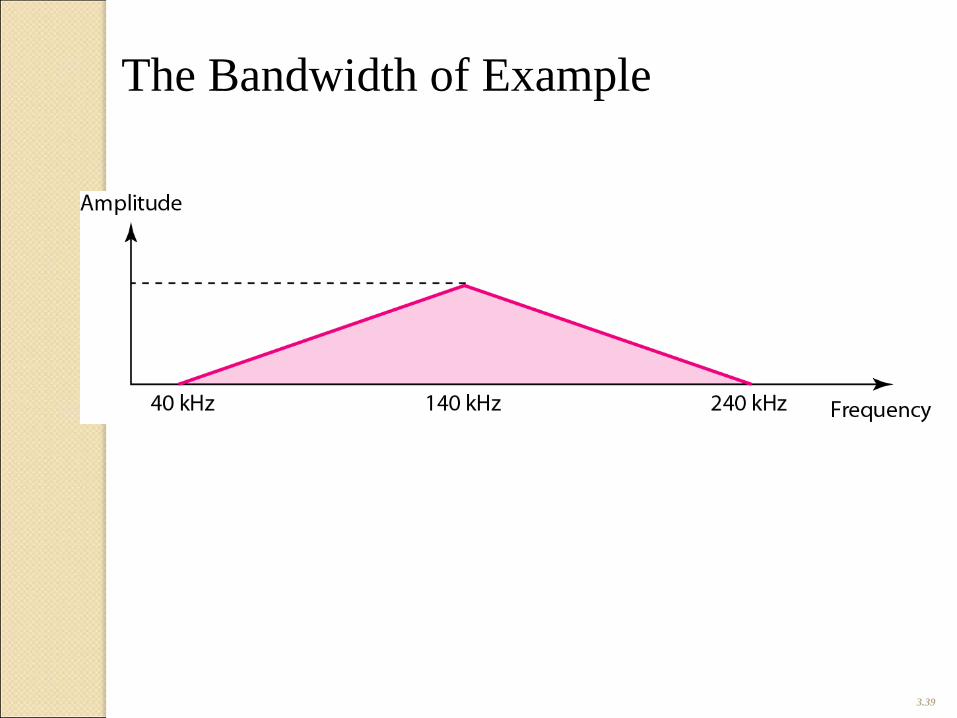
A nonperiodic composite signal has a bandwidth of
200 kHz, with a middle frequency of 140 kHz and
peak amplitude of 20 V. The two extreme frequencies
have an amplitude of 0. From 0v to the 20v, the
spectrum linear increase or decrease. Draw the
frequency domain of the signal.
Solution
The lowest frequency must be at 40 kHz and the
highest at 240 kHz. Figure shows the frequency
domain and the bandwidth.
Example
3.39
The Bandwidth of Example

End Lecture