learning for all: investing in people’s knowledge and...
TRANSCRIPT

World Bank Education Strategy 2020 – draft for comment 1
Learning for all: Investing in people’s knowledge and skills to promote
development
World Bank Education Strategy 2020
PART 1. RATIONALE
Education’s Role in Development
1. People are the real wealth of nations—and education enables them to live healthier,
happier and more productive lives. There is broad agreement, backed by research findings, that
education enhances people‘s ability to make
informed decisions, sustain a livelihood,
adopt new technologies, be better parents,
cope with shocks, and be responsible citizens
and effective stewards of the natural
environment. Indeed, with global economic
growth remaining sluggish despite signs of
recovery from the recent economic crisis, the
shortage of skills in the workforce has taken
on a new urgency across the world. Global
unemployment, estimated at 211.5 million or
6.6 percent in 2009 (International Labor
Organization, 2010) is at an all-time high.—
and young people, particularly vulnerable to
layoffs, have the hardest time finding new
jobs; their unemployment rates are nearly
three times higher than those of adults. These
links between education, jobs and the quality
of people‘s lives are why the Universal
Declaration of Human Rights (1948) and the
United Nations Convention on the Rights of
the Child (1989) recognize everyone‘s right
to education. These links translate also into
benefits beyond the individual and the family,
to economic prosperity, and less poverty and
deprivation. Countries with low levels of
education remain in a trap of technological
stagnation, low growth and low demand for
education (de Ferranti et al., 2003).
2. The statement by the Commission on
Box 1: The Growth Commission Speaks on
Education
The Commission brought together the views of 19
leaders, mostly from developing countries, and of
academic luminaries, to review the evidence on the
factors for growth: ―No country has sustained rapid
growth without also keeping up impressive rates of
public investment—in infrastructure, education, and
health. Far from crowding out private investment, this
spending crowds it in. It paves the way for new
industries to emerge and raises the return to any private
venture that benefits from healthy, educated workers,
passable roads, and reliable electricity. […] Perhaps the
best protections a government can provide are
education, which makes it easier to pick up new skills,
and a strong rate of job creation, which makes it easy to
find new employment.‖ (pp. 5-6)
―Education makes a legitimate claim on public money
for at least two reasons. First, the Commission believes
the social return probably exceeds the private return.
[…] In other words, educated people contribute more to
society than they get back in higher pay, although the
social return is notoriously difficult to measure. […]
Second, some families are credit-constrained and cannot
borrow as much as they would like to spend on
schooling, even if the higher wages a diploma or degree
would fetch could more than repay the loan. Thus public
spending on education is justified on the grounds of
efficiency and equality of opportunity. It corrects the
failure of the market to allocate enough resources to
education, and it also widens access to education beyond
those who can pay for it upfront.‖ (pp. 37-38)
Source: World Bank 2010a

World Bank Education Strategy 2020 – draft for comment 2
Growth and Development1 (2008) on education‘s role in long-term growth and poverty reduction
(Box 1) is supported by a wealth of research in rich and poor countries. One estimate suggests
that a one standard deviation increase in student scores on international assessments of literacy
and mathematics competencies is associated with a 2-percent increase in annual growth rates of
GDP per capita (Hanushek and Woessmann, 2007). Perhaps because of a greater concern by
some countries that their learning outcomes are falling behind those of other countries, more
countries are participating in international tests. For example, the number of countries in PISA
grew from 43 in 2000 to 66 in 2007.
3. Research findings at the country level
demonstrate the role of education in economic
prosperity. Moreover, it is in environments of
rapid technological and economic changes that
education yields the highest benefits because it
enhances the abilities to continue acquiring
knowledge and adopting to new technology. In
China, education increases wages from market
work even though it does not enhance the labor
productivity of routine farm tasks. In Ghana and
Pakistan returns to schooling have been estimated
to be higher in nonfarm than in farm activities. In
India, farmers who have higher skills are better
able to process codified and complex information,
and thus to benefit from a program to the use of
mobile phones for communicating and receiving
on-demand, up-to-date market, production,
transport and meteorological data. This is
consistent with longer-term evidence from India‘s
green revolution during which farmers with more
schooling in states with higher technical change
earned profits that were 40 percent higher than
those earned by farmers with less schooling.
(Yang 1997 for China; Jolliffe, 1998 for Ghana;
Fafchamps and Quisumbing, 1999 for Pakistan;
Jensen, 2007, and Rosenzweig 2010 for India).
4. The benefits from education extend well
beyond work productivity and growth—in terms
of better health; reduced fertility; enhanced ability
to adopt new technologies or to cope with economic shocks; more civic participation; and even
more environmentally friendly behavior. To cite just a few: (a) Health status. Other things
equal, more educated individuals, on average, tend to have healthier practices, perhaps because
they have more information about how to be healthy. For example, the evidence on the effect of
parents‘ education on children‘s health, after controlling for household income, is large. Gakidou
et al. (2010), using 915 censuses and nationally representative surveys, estimate that 51 percent
Box 2: Competitiveness in Brazil
The Brazil Competitiveness Report 2009 (World
Economic Forum 2009) provides an account of
the main impediments and opportunities related
to Brazil‘s economic competitiveness. Using the
―Global Competitiveness Index” (CGI), the
report ranks the country against selected
relevant national and regional comparators. The
GCI classifies countries into three stages of
development: factor-driven, efficiency-driven,
and innovation-driven. Brazil is currently placed
in the efficiency-driven stage, together with
regional neighbors Argentina, Colombia, and
Peru, and with other countries such as South
Africa and Thailand. At this stage, economies
derive their competitiveness from more
advanced production processes that require well-
qualified and trained workers.
Overall, Brazil is ranked 64th among 134
countries in the most recent GCI computation.
Traditionally Brazil has favored investments in
higher education, reflected in a handful of
centers of excellence. But inequalities in access
to high-quality tertiary education, explained
partly by poor quality at lower levels of
education, will limit the country‘s ability to
improve its competitiveness. In order to reach
the innovation-driven stage of development,
Brazil has to invest in the quality of both basic
and higher education. Recently the government
launched an ambitious program to upgrade the
education system.
Source: World Economic Forum 2009

World Bank Education Strategy 2020 – draft for comment 3
Figure 1. Progress towards MDG Targets
50
60
70
80
90
10
0%
1990
1991
1992
1993
1994
1995
1996
1997
1998
1999
2000
2001
2002
2003
2004
2005
2006
2007
2008
Year
Low income Lower middle income
Upper middle income High income
World
Source: UNESCO Institute for Statistics in EdStats, Sep 2010
Primary net enrollment rates by income group
40
50
60
70
80
90
10
0%
1990
1991
1992
1993
1994
1995
1996
1997
1998
1999
2000
2001
2002
2003
2004
2005
2006
2007
2008
Year
Low income Lower middle income
Upper middle income High income
World
Source: UNESCO Institute for Statistics in EdStats, Sep 2010
Primary completion rates by income group
of 8.2 million fewer deaths in children younger than 5 years between 1970 and 2009 could be
attributed to more education among women of reproductive age. One reason for this finding is
that education means more knowledge about the benefits of vaccination and about the strategies
to avoid the transmission of infectious diseases. In Uganda, for example, education has been
shown to be positively related to the adoption of protective measures against HIV (de Walque,
2007). Even in countries with much higher education levels, such as the U.S., more educated
mothers have healthier children than less educated mothers, partly because of better health
behaviors during pregnancy (Currie and Moretti 2003), and better nutritional practices
(Grossman, 2006). (b) Environment. After comparing countries with similar income and weather
conditions, Blankespoor et al. (2010) show that countries with better educated female population
are able to cope with extreme weather events better than countries with low female education. (c)
Coping with economic and other shocks. Households with more education can cope better with
economic shocks than less educated households since they tend to have more resources, more
knowledge about how to cope with income fluctuations, and are more able to exploit new
economic opportunities. In Indonesia and Argentina, for example, more educated households
fared better than less educated households during their respective macroeconomic crises
(Frankenberg et al., 2003; Corbacho et al., 2007).
More schooling, but little learning
5. Compared with two decades ago, more young people are entering school, completing the
primary level, and transitioning to secondary education than ever before. Thanks to a
combination of effective policies and sustained national investments in education, far fewer
children in developing countries are out of school. Governments, non-governmental
organization, communities and private enterprises have built more schools and classrooms and
recruited more teachers at unprecedented levels. Even in the poorest countries, average
enrollment rates at the primary education level surged to upwards of 80 percent and primary
completion rates rose above 60 percent. However, low-income countries as a group are still far
from reaching the basic goal set out as Millennium Development Goals—universal primary

World Bank Education Strategy 2020 – draft for comment 4
education as measured by enrollment rates and by primary completion rates, and gender equality
in primary and secondary education (figure 1). These countries are concentrated in the regions of
Sub-Saharan Africa and South Asia. Moreover, in these countries as well as in middle-income
countries, progress has not been equal across income, gender and other population groups.
Nonetheless, as primary enrollment rates have climbed, pressure is mounting to expand the
capacity of secondary schools and tertiary education institutions, including in low-income
countries. In addition, despite the fact that countries spend a substantial portion of their national
income on education, the results from these investments have been disappointing, especially
when examining learning outcomes rather than enrollment. For these reasons, the education
system in many countries is facing simultaneous challenges of securing basic education for hard-
to-reach or disadvantaged groups, expanding post-basic education to meet greater demand for
employable skills, and ensuring that the education provided is relevant and of good quality. It is
important to say more about these challenges below.
6. Within countries, income poverty is a pervasive barrier to school attendance and learning.
Schooling levels by income groups indicate that children from the poorest families who enter
school drop out early, although at varying rates across countries (figure 2).2 In some countries
such as Pakistan, income poverty manifests its effect on education levels right from the start of
primary school, while in Tanzania and Indonesia, income poverty does not seem to make a
different on the rate at which school-age children enter primary school but do affect the rate at
which they drop out. Research has shown that the responsiveness of school enrollment to the
price of schooling (that is, its price elasticity) is higher for low-income households, so a
eliminating fees or giving a cash subsidy to the household conditioned on children‘s school
enrollment will produce a larger proportional increase in the schooling of children in poorer
Figure 2: Proportion of youth ages 10-19 who have completed a given grade
0
0.2
0.4
0.6
0.8
1
1 2 3 4 5 6 7 8 9
Pakistan 2006-07
0
0.2
0.4
0.6
0.8
1
1 2 3 4 5 6 7 8 9
Tanzania 2007-08
0
0.2
0.4
0.6
0.8
1
1 2 3 4 5 6 7 8 9
Indonesia 2007-08

World Bank Education Strategy 2020 – draft for comment 5
families (Orazem and King, 2009).3
7. Educational progress lags even more for people who face multiple disadvantages due to
poverty, gender, place of residence, disability and ethno-linguistic affiliation. Hall and Patrinos
(2010), Lewis and Lockheed (2008) and the Global Monitoring Report (UNESCO 2010) provide
clear evidence that being female combined with rural residence and minority ethno-linguistic
affiliation means far greater disadvantage than just being female or just being a rural resident.
Demand factors embedded in culture and enshrined in markets and supply constraints, such as a
deficit of learning materials or trained teachers who can teach in a minority language, leave these
children and youth at the fringes of their education system. For them, the solutions are more
complex. Research suggests the following interventions: Schooling demand in rural areas
responds more to changes in income and to the proximity of available schools. In places where
girls receive less schooling than boys (e.g., South Asia and the Middle East, rural areas of many
countries), girls‘ schooling seems for responsive to shifts in income and prices than boys‘
schooling. Demand-side interventions, such as the abolition of school fees and scholarships, cash
transfers to compensate for the opportunity cost of school attendance, and vouchers that enable
poor students to use also privately provided services, have all helped to raise enrollment rates.
Together, these measures account for notable increases in enrollment rates at the primary and
secondary education levels.
8. For too many students, more schooling has not resulted in greater learning. Various
learning assessments document disappointing learning outcomes in many countries. Youth are
leaving school and entering the work force without the knowledge or competencies that will
make them productive and able to adapt continually to a competitive and increasingly globalized
economy. They will need remedial, second-chance, and job training programs in order to acquire
employable skills. At the country level, because of low skills the economy is unlikely to possess
sufficient ―innovative‖ power to respond to business opportunities, create jobs and make the
country competitive in the global economy.
9. Several studies illustrate the seriousness of the learning challenge across a broad range of
country contexts. Early grade reading tests in Mali determined that, at the end of Grade 2, in a
nationally representative sample of public schools, 94 percent of children could not read any
word in the initial line of a grade-appropriate reading passage in French. Children perform
almost as badly when assessed in their mother tongue, in the same grade, and in an equally
appropriate passage (CNE, PHARE and RTI 2009).4 In Pakistan, tests of grade 3 children found
that only 50 percent could answer very basic multiplication questions and 69 percent could not
successfully add a word to complete a sentence (Das, Pande and Zajonc 2006). A study in Peru
found that as few as 25-30 percent of the children in grade 1 and only about 50 percent of the
children in grade 2 could read at all (Crouch 2006). Such low reaching levels mean that it would
take several years of schooling for most students to acquire the skills needed to read a simple
sentence.

World Bank Education Strategy 2020 – draft for comment 6
10. The results from country-based studies correspond with the results from international
tests like TIMMS and PISA, which show low learning levels both in countries likely to achieve
the Millennium Development Goals as well as in those unlikely to do so. Figure 3 illustrates the
wide gulf, between countries and within countries, in international math test scores. The
deficiencies in learning that are revealed by national and international assessments stem from
both lack of access to learning opportunities and deficiencies in the available learning
environments. Unfortunately, to a certain extent national and international tests are just the tip of
the iceberg, as they do not measure deficiencies in learning for those who had dropped out of
school prematurely.
Why a New Education Strategy
11. External and internal changes call for a rethinking of the World Bank‘s education
strategy. Economic and technological changes are redefining the development challenge for all
countries. They punctuate the need for learning opportunities to be relevant to new jobs and
employment, and thus for education systems to adapt to those changes. All things equal,
countries with a more highly skilled and more agile workforce have a clear advantage to adapt to
global change. Within the context of global shifts and internal changes, the new strategy will lay
Figure 3 Wide disparities in math test scores between and within countries
Source: Filmer, based on analysis of TIMSS 2007 database
250
300
350
400
450
500
550
600
650
Gh
an
a
El S
alv
ad
or
Bo
tsw
an
a
Co
lom
bia
Mo
roc
co
Alg
eri
a
Eg
yp
t
Syri
an
Ara
b R
ep
.
Ind
on
es
ia
Ira
n
Ge
org
ia
Tu
nis
ia
Jo
rda
n
Mo
ng
oli
a
Tu
rke
y
Th
ail
an
d
Le
ba
no
n
Bo
sn
ia A
nd
Herz
.
Ro
ma
nia
Ukra
ine
Bu
lga
ria
Ma
lays
ia
Se
rbia
Arm
en
ia
Lit
hu
an
ia
Un
ite
d S
tate
s
Ru
ss
ian
Fe
d.
Ko
rea
, R
ep
. O
f
Richest quintile of students Poorest quintile of students Average score

World Bank Education Strategy 2020 – draft for comment 7
Figure 4 Demographic trends shape demand for
education Population Projections in Low Income Countries 2020
Population Projections in Middle Income Countries 2020
Source: World Bank, Health Nutrition and Population
Stats
100000 50000 0 50000 100000
0-45-9
10-1415-1920-2425-2930-3435-3940-4445-4950-5455-5960-6465-6970-74
75+
Female Male
250000 150000 50000 50000 150000 250000
0-45-9
10-1415-1920-2425-2930-3435-3940-4445-4950-5455-5960-6465-6970-74
75+
Female Male
out new strategic directions, priorities for investments, technical support, and policy assistance
for the World Bank‘s work in education in the next decade.
12. A country‘s demographic landscape shapes the potential demand for education and
continues to shift with changing fertility
rates. Low-income countries have very
young populations; on average, more than
40 percent of their population is under 15
years old (figure 4). There are an estimated
3.1 billion youth worldwide between the
ages of 0 and 24, of whom nearly 90
percent live in the developing world. These
countries must face the challenges of
securing an adequate supply of basic
education while also upgrading the quality
of that education. And success in getting
more children through basic education in
turn creates demand for more spaces also at
higher education levels. In contrast, in
middle-income countries sharp declines in
fertility rates have reduced the pressure on
increasing spaces in primary education,
leaving more resources that should be spent
on quality improvements. The proportion
of 15-24 year olds in their populations is
higher than ever before, and even higher
than in high-income countries. As long as
these youth are equipped with appropriate
skills and know-how when they enter the
workforce and the dependency ratio drops,
the ―youth bulge‖ could translate into
remarkable economic dividends for these
countries. But while middle-income
countries may be better able to afford an
expansion of tertiary education, there are
good reasons to choose fiscally prudent
policies and investments even now. As
many middle-income countries have
already discovered, it is hard to end costly entitlements even when such action could mean more
resources for quality improvements.
13. The emergence of new economic stars among middle-income countries has intensified
the desire of many more countries in the developing world to be more competitive and thus to
have a more highly skilled and more agile workforce. Although the world as a whole is emerging
from the global financial crisis at a modest rate, the economies of China and India are projected

World Bank Education Strategy 2020 – draft for comment 8
to grow at close to 10 percent in the next year, and Brazil at the rate of … Even Sub-Saharan
Africa‘s economy is projected to grow by 5.5 percent in 2011. Indeed, according to the
International Monetary Fund (October 2010), output growth in emerging and developing
economies is expected to be at 6 percent for 2010 and at 6.3 percent by 2011, more than twice
the projected output growth in rich economies.5 Reflecting much higher productivity and population
growth, the economies of the developing world are expected to grow by about 6 percent in all three years
These countries are Anticipating the need to accelerate productivity increases by growing the
skills in their workforce, these countries are …6 While these projections are great news for
developing countries, limited fiscal space means that if official development assistance were to
decline due to the sluggish recovery in rich countries, low-income countries could be forced to
reduce investments, including in education. Developing countries, particularly low-income
countries that rely on official development assistance (ODA) for budgetary support, could come
under severe pressure if the crisis results in reduced aid flows. So far, the crisis has caused
government deficits in low-income countries to increase by an average of 1.3 percent of GDP,
suggesting that many were able to take advantage of relatively good fiscal positions, and ample
reserves going into the crisis to buffer its effects on spending. However, the initial cushions have
been exhausted, and the ability of low-income countries to maintain spending in the face of a
slow recovery is unclear –
especially if, as is likely, ODA
declines in coming years.
14. New information
technologies have transformed –
and continue to transform – how
people live and communicate, how
enterprises do business, what jobs
are available, and what skills are in
greater or lower demand.7 The
growth in number of mobile phone
subscribers has outpaced global
population growth (figure 5).
Mobile telephony has been
adopted even in rural areas of poor
countries. The number of Internet
users grew by an estimated quarter
of a billion people between 2000
and 2005, most of them young
people (OECD, 2010). How can education systems best use these technologies to equip students
with knowledge and skills relevant to a rapidly modernizing context? More systematic
information is needed about whether and how school-based ICT can enhance learning and raise
school completion rates.
15. The international aid architecture has become more crowded and more diverse, making it
even more important for donors to harmonize and align their programs at the country level. The
Paris Declaration and the Accra Plan of Action provide guidelines for how donors should work
Figure 5 Growth in Mobile & Internet subscribers has
outstripped population growth
Sources: http://ddp.worldbank.org, http://databank.worldbank.org
-
1,000
2,000
3,000
4,000
5,000
6,000
7,000
2000 2001 2002 2003 2004 2005 2006 2007 2008
(mil
lio
ns
)
World mobile subscriptions World Population
OECD mobile subscribers EAP mobile subscriptions
SSA mobile subscriptions World Fixed Internet Subscribers

World Bank Education Strategy 2020 – draft for comment 9
together in the service of country priorities. Given the changes in the international aid
community, the Bank needs strategic partnerships based on a shared vision for education. In
2002, the Bank played a pivotal role in the formation of the Education for All–Fast Track
Initiative (FTI), a global compact that aims to help low-income countries achieve the education
MDGs. Since 2004, it has provided support to selected countries through the Catalytic Fund. A
recent external evaluation of FTI concludes that FTI has helped promote aid effectiveness in line
with the Paris and Accra declarations, but recommends major reforms to achieve its goals. The
Bank is taking concrete steps to help address those recommendations. The new education
strategy would provide an opportunity to review the Bank‘s role in the global partnership, and
vice versa.
16. Inside the World Bank, the operating environment has gone through notable changes in
the past decade. Partly, these changes are designed to respond to provide the Bank with a better
structure to respond to the changes in the global environment and aid architecture. First, the
Bank has continued moving its staff to the country offices, both through relocation of
international staff and through the recruitment of more local staff. At the end of FY10, about 40
percent of education staff were located in field offices, with this proportion being higher for staff
working in East and South Asian countries. Second, operational instruments have been changing,
in part to accommodate the shifting nature of the policy dialogue with client countries. For
example, there is increasing demand and interest in lending instruments that incorporate
performance-based approaches, sector-wide financing in the form of direct budget support,
parallel financing, pooled funding, programmatic lending to support medium-term development
goals, and approaches that provide greater flexibility at reduced transaction costs. A number of
middle-income countries are using reimbursable technical assistance in order to tap the Bank‘s
technical expertise in highly specific areas.
PART 2. THE WORLD BANK’S EDUCATION STRATEGY
Framing a new education strategy around Learning for All
17. The World Bank commits to supporting Learning for All as a key contribution to
countries‘ long-term growth and poverty reduction. People acquire new knowledge and
competencies throughout life, but the period between birth and the mid-20s is critical because the
ability to learn that is developed at this time is a foundation for future learning (Box 3). Whether
children and youth actually learn during this time period depends on the learning opportunities
available to them and the quality of those opportunities. The Bank‘s strategy to meet the mission
of learning for all is based on the following premises: (a) Although learning outcomes are
usually measured by reading and numeracy skills, the knowledge and competencies that help
people live healthy, productive, and satisfying lives are much broader. Social, communication,
teamwork, and problem-solving skills are invaluable for people to function well at home, in their
communities and at work. In addition, specific technical or vocational skills related to an
occupation are important in the labor market.8 (b) Learning is not only about schooling.
Investments in the nutritional and health status of very young children as well as cognitive

World Bank Education Strategy 2020 – draft for comment 10
development determine the readiness of children to learn when they reach school age. Likewise,
programs that address hunger, malnutrition and disease among school children can significantly
improve their academic performance. Indeed, learning is the business not only of education
agencies. (c) Youth who drop out of school early are vulnerable to unemployment, poverty, teen
marriage and pregnancy, and delinquency. In addition to dropout prevention programs in
schools, these youth need alternative or second-chance learning opportunities that take into
account the reasons why they are not in school. As discussed above, the main obstacles are often
income poverty and/or other sources of disadvantage that work through demand or supply
factors. The challenges are to consolidate basic knowledge and competencies learned while in
school, and to equip these youth with additional technical or vocational skills. Unfortunately,
relatively few programs have been rigorously tested, so the knowledge base for these programs is
relatively thin. (d) Since learning opportunities do not have to be limited to schools or higher
education institutions, they do not have to be provided by government.

World Bank Education Strategy 2020 – draft for comment 11
Box 3 Learning is a lifelong process
Box Figure 3a illustrates the fact that learning happens throughout life. A person‘s brain starts
growing from conception and continues to do so into adulthood. At each stage of the brain‘s
development, there are opportunities for learning, but learning occurs is affected by the learning
opportunities available to a child or a youth. The ability to learn that is developed at this time
empowers more learning throughout life (Cunha et al., 2006). During infancy, ages 0 to one year, a
child gradually develops sight, hearing, receptive language and speech production. Proper nutrition
and cognitive and psychological stimulation in the home or through caregivers are essential to this
development (Fernald et al. 2009). Mother‘s nutrition and health during pregnancy affect fetal health,
birth weight and, thus, the newborn‘s initial health (Bhutta et al. 2008). The availability of an
integrated system of parenting education, nutrition and health care can have substantial benefits (Engle
et al. 2007). The period between ages 1 and 5 years is one of very fast brain development, during
which children develop executive functions, such as working memory and ability to inhibit responses;
higher cognitive functions like solving puzzles, matching colors and shapes, or understanding
concepts such as more and less; fine motor skills like picking up objects or drawing and writing; and
gross motor skills like walking or running. Children need a stimulating and responsive environment to
develop these abilities; deprivation has profound and long-term consequences for the child. (Fernald et
al. 2009, Walker et al. 2007, Grantham-McGregor et al. 2007, ECD Community of Practice 2010)
Between the ages of 6 and 8, children develop their basic reading and mathematics skills. The extent
to which children are able to do so determines their ability to continue learning beyond this stage.
Nurturing and trained teachers who spend sufficient instructional time using adequate pedagogy are
critical for this development (Abadzi 2010). Beyond the initial primary grades, between the ages of 9
and 12, children continue to acquire reading comprehension and mathematical skills, as well as basic
science skills, and the capacity for language grows considerably, so this is a critical time for learning
grammar, second or third languages and vocabulary expansion. Children from minority ethno-
linguistic groups benefit from the use of mother-tongue instruction, combined with instruction of the
dominant language, until at least the age of 12. (Perez-Brito and Goldstein 2010)
Early adolescence is marked by both emotional immaturity and high cognitive potential among youth
(OECD, 2007). Because neuro-developmental maturation occurs at different ages for them, youth at
this stage may benefit more from a strong general education, with specialized vocational and technical
education deferred until upper secondary. (Jakubowski et al. 2010) For youth in many countries, the
period between ages 16 and 18 is often a time for transition from school to working life. For those
who have dropped out, remedial programs or second-chance options through vocational-technical
education schools can have high returns for later employment. Many more youth, however, are

World Bank Education Strategy 2020 – draft for comment 12
18. The debate on what is an effective learning environment and how to achieve it is still
open, but it is clear that a focus only on inputs will have limited success. One side of the debate
focuses on eliminating the shortages in the academic infrastructure, trained teachers and
instructors, and learning materials as a means to improving learning outcomes. For lack of better
data, for example, teacher-pupil ratio has been used widely as a measure of the quality of
schools. Except perhaps in settings with extreme shortages, however, the evidence for the
learning dividends of supply-side investments has been mixed (Hanushek, 1986, 1996; Kremer
and Holla, 2008). Another argument in the debate places less emphasis on the level of resources
per se allocated to education and more emphasis on the education system‘s ability to transform
those resources efficiently and effectively into learning outcomes. This argument is about the
capacity of the education system for policy formulation, standard setting and quality assurance,
planning, financial management, student assessment, human resource management, and
intergovernmental and external partnerships. It states that, given the same input levels, schools
(or universities or training programs) that are more competently managed and better governed
will realize higher learning results. A third side of the debate highlights something else: the
power of greater autonomy at the provider level and of competition for resources (such as
through the use of performance incentives or vouchers) to generate a strong motivation among
providers for better service delivery (Orazem, Glewwe and Patrinos 2007). The central idea
behind this is that students prefer to attend good schools and universities; consequently, low-
quality, schools and universities would lose enrollment and eventually disappear from the
market. A corollary to this argument is that students (and other stakeholders) also have a political
voice to advocate for more accessible and better learning opportunities.
Directions of the new education strategy
19. In the next decade the World Bank‘s focus in education will be to support reforms at the
country level that strengthen the education system‘s capacity to achieve learning goals, and, as a
global development partner, to help build a high-quality knowledge base in education to
underpin policy, innovations and investments. This education strategy affirms its commitment to
learning for all by increasing the effectiveness of government resources and aid financing for
education, through operational, financial and technical assistance.
Box 3 … continued
Early adolescence is marked by both emotional immaturity and high cognitive potential among
youth (OECD, 2007). Because neuro-developmental maturation occurs at different ages for
them, youth at this stage may benefit more from a strong general education, with specialized
vocational and technical education deferred until upper secondary. (Jakubowski et al. 2010) For
youth in many countries, the period between ages 16 and 18 is often a time for transition from
school to working life. For those who have dropped out, remedial programs or second-chance
options through vocational-technical education schools can have high returns for later
employment. Many more youth, however, are enrolling in upper secondary education and
tertiary education as a means to acquire skills that are valued in the labor market.

World Bank Education Strategy 2020 – draft for comment 13
Strengthening education systems
20. The term ―education system‖ typically refers to the institutions that provide education
services, that is, schools, universities and training institutes. But an ―education system‖ really
pertains to more than these formal institutions or structures. First, it includes, or should include,
the full range of learning opportunities that are available to children, youth and adults, whether
they are provided and/or financed by the state, or by non-state entities such as private
individuals, private enterprises, community organizations, or faith-based organizations. It
includes those that are considered formal programs, as well as non-formal programs. In almost
any country then, an education system encompasses thousands of primary and secondary
schools, tertiary institutions, training institutes, and other learning programs, including their
employees (teachers, trainers, professors), non-academic personnel, and administrators. Most
institutions are state provided and/or financed, but the education system in many countries also
includes privately provided and/or financed
institutions or programs. (More below) In
large countries such as Brazil, Indonesia, or
Nigeria, the education system spans a
dizzyingly large number of structures and
participants, linked together by contractual
and non-contractual relationships around
the delivery of education services.
Secondly, an education system consists also
of its beneficiaries and stakeholders:
students and trainees, their families and
communities, and employers whose
collective choices and ―voice‖ drive the
way the system works. In India, Pakistan
and many other countries, village education
committees or similar community groups
are part of the basic education system,
tasked with a variety of functions such as
monitoring and operational responsibilities
for area schools. In the case of skills
training programs, an interested party might be the employer who is financing the attendance of a
trainee. Thirdly, an education system includes the rules, regulations, and policies—and how they
are enforced and implemented, and who are held accountable—and resources and financing
mechanisms which make the system function. These rules and policies are implemented or
enforced by agencies that have a direct managerial and budgetary link to the government
agencies in charge of education, such as staff of the national testing service and the cadre of
school inspectors. Figure 6 is a very simplified representation of an education system, but it
portrays rightly that an education system is a complex network of participants (government
agencies, public and private providers, individuals, communities, and organizations) concerned
with the provision, financing and regulation of learning services—and the functional and power
relationships and accountability mechanisms that connect them.
Figure 6 A simple diagram of an education system

World Bank Education Strategy 2020 – draft for comment 14
21. To strengthen an education system implies reforming the governance, management,
financing rules and incentive mechanisms in the system so that functions, authority and
relationships of accountability are clear, aligned, measured and monitored, and appropriately
resourced. The challenge is how to make the education system work effectively and efficiently—
that is, how to make it achieve the education goals—within the available levels of financial
resources, administrative and technical capacities, leadership skills, and political capital.
Educational investments that focus on building classrooms and school laboratories, purchasing
learning materials, or financing teacher training programs expand the educational ―architecture,‖
enabling it to have the physical capacity to deliver services to more people, but do not
necessarily help the education system function more effectively or efficiently. The 2004 World
Development Report on service delivery and the Bank‘s Governance and Anti-Corruption
strategy, adopted in 2007, shine a spotlight on the importance of addressing governance issues to
promote effective service delivery. The guidance is clear, if not easy to adhere to: Without well-
defined responsibilities and goals, there is no way to generate the relevant performance
information for managing or assessing an education system. The extent to which policies and
regulations about quality assurance, learning standards, compensatory programs, and budgetary
processes are implemented and enforced, whether implementation is financed, whether
compliance is monitored, and whether non-compliance has consequences—all these together
determine the effectiveness of the system to accomplish its goals (COREHEG 2010). Without
Box 4 A systems perspective in education
Availability of Information
There is no magic bullet to improve learning outcomes, but focusing on results—both on enrollments and on
learning—by making information more available has been shown to lead to progress. In India the school report
cards developed by the District Information System for Education summarize school information in an easy to
read format, allowing parents and stakeholders access to information not previously available to hold schools and
authorities to account. The data from the report cards are available on the Web, promoting local accountability.1
Likewise, in the context of a school management reform in the Punjab province of Pakistan, student and school
report cards were produced and disseminated. By increasing knowledge about quality and empowering parents
with information, the intervention increased learning achievement by between 0.10 and 0.15 standard deviations
in government schools and in lower-quality private schools, and reduced the fees charged at higher-quality
private schools by 21 percent.
School-based Management
School-based management (SBM) aims to empower stakeholders at the local level with greater decision-making
authority and more flexible financing as a way to involve them as partners in heightening the quality and
relevance of education. Past reforms have also increased the participation of parents and the community in
schools since they have incentives to demand an efficient use of resources that will lead to better outcomes. The
relationship between a vision for improved performance and measurable outcomes depends on a careful balance
between three policy instruments at policymakers‘ disposal to influence the behavior of local managers: i) greater
autonomy at the local level; (ii) enforcing relationships of accountability; and (iii) effective assessment systems.
Research on SBM around the world have found that these policies changed the dynamics within the school
because parents got more involved or because teacher behaviors changed. There is evidence that these reforms
reduced repetition, failure, and drop-out rates, but the evidence on learning scores is mixed, with positive results
for El Salvador, Nicaragua, Mexico and Kenya, and no effect found in Brazil and Honduras.
Sources: White 2004, Andrabi et al. 2010, World Bank 2011, World Bank 2010a, Barrera-Osorio et al. 2009.

World Bank Education Strategy 2020 – draft for comment 15
timely information on implementation and performance that is communicated to all stakeholders
in the system, it becomes impossible to create enforceability and discourages responsiveness
(Box 4).9
22. The new strategy explicitly recognizes that learning opportunities go beyond those
offered by the public sector and also beyond traditional formal programs. The past education
strategies have been very much about the Bank‘s role in supporting formal schools that are
funded and/or operated by the government. However, critical learning activities happen outside
formal schooling years, such as before the ―official‖ age of entry into school and also after a
youth has left school. When young people drop out of school too early, many are unlikely to ever
return, and other learning opportunities, such as work skills training, are needed to help them
find employment. Even while children and youth are still in school, they may also be engaged in
supplementary learning activities that are usually outside the purview of government. Such
supplementary tutorial services, often privately provided, are prevalent in many countries,
including in South Korea, Turkey, Bangladesh, and the United States (Dang and Rogers 2008,
Bray 2009). These education services outside the traditional formal programs exist for various
reasons and are also parts of the education system.
23. A systems perspective should include for-profit and not-for-profit learning opportunities
(the ―non-state‖ sector) that function as providers, funders, and innovators in education. In many
countries the non-state sector acts as a provider of learning opportunities, from pre-schools to
primary and secondary
schools, colleges and
universities, and training
programs. Non-state
provision of education
services has increased
dramatically over the last
two decades across the
world, serving all types of
communities (Figure 7).
The share of the private
sector is highest in South
Asia and Latin American
and the Caribbean, and
higher in secondary
education and vocational
and technical programs
than in primary
education. Grouping
countries by per-capita
GDP levels, low-income
countries have a larger share of non-state education. The share of the private sector in other
learning programs outside formal schooling is rarely monitored, so data are generally not
available. In some cases, the cost of providing this education falls on families. Patrinos et al.
Figure 7 Share of enrollment in private schools
Note: UIS (Latest available data)

World Bank Education Strategy 2020 – draft for comment 16
(2009) estimate that private households account for about one-quarter of all education spending
in developing countries. In other cases, governments subsidize or contract the non-state sector to
provide education.
24. Although many assume that the non-state sector serves mainly those learners who can
afford to pay, in practice it is an important provider of education even in the poorest
communities, especially in areas that the national, or even the local, government does not reach.
In a number of countries, the private sector successfully collaborates with the government to
improve the relevance of training. For example, in Grenada private sector businesses are working
with the government to set up a national training system that includes a private sector board vets
standards for a range of technical and vocational occupations, which are used to evaluate
graduates from training schemes financed by the government, but provided by private sector
trainers (TVET Thematic group 2010). The World Bank Group‘s International Finance
Corporation (IFC) has been facilitative private sector investments in emerging economies since
2001. For example, in Brazil, the Anhanguera Educacional Participações project is expanding
education access for low- and middle-income working adults who could not otherwise attend
Brazil‘s public universities, and have reached over 800,000 adults. But in order to ensure
efficiency and coherence in privately-provided education services, it is essential that government
agencies provide appropriate regulation and oversight.
25. In sum, to strengthen an education system means to align governance, management and
financing rules and incentive mechanisms in order to produce learning for all. To reform the
relationships of accountability among actors or participants so they are clear, coordinated,
consistent with functions, measured and monitored. To establish a clear feedback cycle between
aid financing and results. To ensure that resources are allocated effectively, efficiently and
transparently. Operationally, financial and technical aid from the Bank will be increasingly based
on reforms that will help improve learning outcomes and overcome barriers to education for
disadvantaged groups. Investing in stronger education systems means to build national capacity
to govern and manage according to standards of quality and equity, to develop and apply
measures of system performance that are consistent with national education goals, and to ensure
that national and aid resources are used effectively and efficiently. Investing in education data
and knowledge that can support evidence-based policymaking and innovations in partner
countries helps ensure that investments in education are effective and efficient and support
global efforts to monitor progress and measure results and impact.
Building a high-quality knowledge base for education reforms
26. At the global level, the World Bank‘s priority will support the development of a
knowledge base that will support the systems approach: (i) reliable and comparable statistics to
measure learning outcomes and monitor aspects of the performance of education systems, and
(ii) analytical and practical evidence and know-how about programs and policies that can
improve the workings of education systems.
27. Education data have improved tremendously in the past two decades. This is an important
achievement given that reliable, comparable and regular education statistics are essential for

World Bank Education Strategy 2020 – draft for comment 17
planning and for monitoring progress toward education targets. Data on the 283 education
indicators tracked annually across countries were available only at 45 and 46 percent in 1990 and
1995, respectively; by comparison, availability averaged 64 percent during the period 2000–06.
(Porta Pallais and Klein 2010) Despite efforts made by the World Bank, UNESCO‘s Institute of
Statistics, the donor community, and national governments to improve the availability and
quality of education data, however, significant information gaps persist even on important
indicators. During the years 2000-07, the average data availability for the four education MDG
indicators remained at between 49 and 60 percent, crippling efforts to project the likelihood that
some countries will reach the target MDGs by 2015.
28. Three important advances—and remaining challenges--explain the state of education
data. First, more countries have established or improved their Education Monitoring and
Information System (EMIS) which collects and records enrollment data and other information
from schools each academic year. Between 1998 and 2009, 44 percent of World Bank education
projects financed EMIS activities and 11 percent supported school mapping activities (Porta
Pallais and Klein 2010). However, these efforts have been largely isolated, with no clear strategy
for implementing ―best practice‖ approaches or plans for training local technicians in the best use
of the EMIS. Moreover, EMIS databases in developing countries frequently neglect the tertiary
level, non-state providers and non-formal providers of education. The expansion of EMIS to be
more inclusive of all the parts of the education system is clearly an area for reform. Second, an
increase in the number of sample-based household and school surveys fielded in developing
countries, some of them conducted on a fairly regular basis, allows empirical analyses of the
factors that affect education indicators. For example, most of the analyses of disadvantaged
populations‘ access to education are based on individual-level data collected through these
surveys. It is when individual and household information can be linked to the supply of
education services that the obstacles to educational progress have been examined in greater
depth. However, the scope of these surveys is quite narrow, providing only glimpses of the
education services available and of the barriers to learning. Third, more countries are measuring
reading and math competencies of their students through national assessment systems—and
more countries are also participating in regional tests and international tests such as PIRLS,
PISA, and TIMSS, and are benchmarking themselves against other countries. The number of
countries in PISA grew from 43 in 2000 to 66 in 2007, for instance. In this regard, if the
relevance of the education system to the world of work is to be assessed, measures of learning
should go beyond basic competencies. In particular, widely accepted comparable measures of
important skills such as problem-solving, teamwork, and communication skills are still notably
absent.10
29. In the next ten years, the World Bank will advocate for and continue supporting EMIS
systems, support efforts to measure learning outcomes and the performance of education systems
on a regular and systematic manner, and support countries to use these measures to inform
education policies and investments. The Bank will invest in the development of measures for
system functions and learning outcomes (including skills that are commonly measured), data
corresponding to those measures, and analytical work. Far too few countries have the kinds of
policies, structures, practices, and tools that would constitute useful EMIS and assessment
systems. As mentioned above, data on learning outcomes are still rare, sporadic and very much

World Bank Education Strategy 2020 – draft for comment 18
limited in scope. In addition, governments and international agencies are demanding the
development of new indicators of the quality and performance of education systems. One
obvious gap is the availability of periodic and system-wide data on education finance—on both
costs and public and private expenditures. While budgetary data are generally available from
planning and budget documents, the actual flow of resources through the education system and
actual expenditures are often mysteries to the actors within the system. Inability to track resource
flows and spending feeds wasteful misallocation and use of resources as well as corrupt
practices; this is one of the principal messages from the consultations on the strategy. Collecting
and managing data require both technical expertise and financing; many developing countries
need both types of assistance. But just as important will be to promote the effective
dissemination and use of this knowledge base among the stakeholders in the education system.
The Bank will support the broad exchange of policy-relevant knowledge and encourage
international debate on critical issues of educational development. Decision makers at the
country level need capacity and resources to use data and evidence for decision-making
processes.
30. Finally, analytical and practical evidence and know-how about programs and policies are
critical to improving the performance of education systems. Technical and empirical analyses of
development topics are a regular part of the work of Bank staff, but in the past ten years, Bank
staff have engaged in a sizeable number of rigorous impact evaluations, many of them in the
education sector. These evaluations present an opportunity to generate global knowledge and
continually improve its operations and technical advice.11
There are many more impact
evaluations of education interventions than a decade ago, but more needs to be learned about
how to make these efforts be more useful for policy. (See Box 5) In addition, while there is
Box 5 Building the Knowledge Base on Education Systems through Impact Evaluation
To improve the knowledge base in education, the World Bank has worked energetically over the past five years
to expand the portfolio of impact evaluations and systematically harvest their lessons. The approach has been to
integrate rigorous impact evaluations into new or ongoing operations, with technical support from across the
institution. Ideally, the integration takes place at the project design stage; early integration not only allows better
tracking of impacts, but can also improve project design by tracing out expected impact channels. In some cases,
the evaluation design has included a randomized controlled trial, which allows the most straightforward linkage
between intervention and impact, but other rigorous approaches are also used.
Once an evaluation generates findings, those findings can be fed back into operational practice. They provide
real-time feedback that allows improvement of the project being evaluated, and also help to set priorities and
allocate resources in that country over the longer term. Once enough evaluations of related interventions have
been carried out, the findings are also synthesized at a global level and used to guide reforms and inspire
innovations in other countries.
Adoption of the new approach to evaluation knowledge generation has led to substantial changes in the way
operations are designed and implemented, and in the way that lessons are drawn from them. From a baseline of
virtually no rigorous impact evaluations at the World Bank, a recent survey found that currently there are 55
active evaluations in education (20% of all active evaluations), together with 42 already completed (25% of the
total), that evaluated measures to increase the demand for schooling or improve the delivery of education
services. Some of the studies have been carried out by Bank staff, others in collaboration with outside
researchers supported by the Bank. With so many areas to cover, the Bank has started by focusing its evaluation
efforts where they could be most influential—which meant concentrating on clusters of projects that were about
to get underway, and on topics for which there is the most demand from country governments and Bank task
team leaders. One major area of evaluation research has been on interventions to improve accountability for
results in education.
Impact evaluations of accountability-oriented reforms in education have been clustered in four areas: school-
based management, information for accountability, teacher incentives, and leveraging the private sector.
Source: World Bank Results Briefs: "Discovering What Works in Education: Informed Policy Making through
Impact Evaluation."

World Bank Education Strategy 2020 – draft for comment 19
evidence on how direct interventions at the school or classroom level affect learning, there is
much less evidence on what will lead to an effective reform of the education system. Partly, this
has to do with the fact that many school or classroom-based interventions can be evaluated
through impact evaluation techniques, which rely on the existence of a ―comparison group‖ that
is not affected by the intervention to be evaluated. Evaluating system reforms, on the other hand,
is more complex because such reforms tend to involve multiple institutional changes.
Consulting on the new education strategy
31. The development of the new strategy was supported by extensive technical and
consultative work. Internally, three staff working groups discussed the issues and challenges
pertaining to countries with fragile situations, low-income countries and middle-income
countries. Each group contributed three key inputs: (i) the main challenges in education, (ii) the
main actions that the Bank should take, and (iii) the main outcomes for which the Bank should
be accountable. Unsurprisingly, a number of those challenges, actions and outcomes were
Box 6 External Consultations to Develop the Strategy
The Bank consulted a wide array of external stakeholders and actors from the beginning of the strategy
development. The first consultation phase consisted of 17 multi-stakeholder meetings across the world and 17
targeted meetings. Held between February and June 2010, those meetings took place in 24 countries and
included representatives from a total of 69 countries. The multi-stakeholder meetings included representatives
from academia, teacher unions, school management committees, community members (parent-teacher
associations), local and international NGOs, civil society organizations, students, parliamentarians and education
officials, and private and public donor agencies. Designated rapporteurs at each consultation submitted detailed
minutes and a list of the attendees. In addition to the meetings, interested individuals and groups provided
comments on a dedicated web page for the strategy and through and the Bank‘s YouThink website.
An analysis of the feedback indicates that, overall, learning and quality, education management (accountability),
teachers, relevance to the labor market, and education finance (and partnerships) are the priority themes for the
consulted parties and the issues that they think the Bank should be addressing. They recognize education‘s role
in (sustainable) human and economic development, and also that secondary and tertiary education are now a
main concern in addition to primary education. ―Quality‖ encompasses not only the ―visible‖ inputs to the
education process, such as infrastructure and supplies, but also the competence of teachers in imparting
knowledge and skills to their students. Additionally, education systems around the world need to address the
needs of poor and disadvantaged populations, as well as corruption, poor management, and wastage of resources
in order to be successful at fulfilling their mission.
Table 1 : External consultation meetings Phase I: Breakdown by region
Region Number of Countries
Represented
Number of countries that hosted a
consultation meeting
Africa 16 4
South Asia 3 2
East Asia and the Pacific 8 4
Latin America and the Caribbean 11 4
Middle East and North Africa 4 2
East and Central Asia 13 2
Donors 13 6
TOTAL 69 24
Source: World Bank 2010b

World Bank Education Strategy 2020 – draft for comment 20
common across the three types of countries, while others were specific to a country group.
Together with the results from external consultations (Box 6) and from additional technical
inputs from authors of background papers, these inputs formed the basis of the outlined
priorities.
PART 3. IMPLEMENTATION ISSUES
32. If the intense debate in rich countries (e.g., France, U. S., and U. K.) about their own
learning deficits is any indication, achieving learning for all in developing countries is a long,
challenging, and uncertain mission. But within the next decade some success in improving the
enabling environment for more learning in each country can be secured, and the Bank is ready to
help. This section provides first a quick review of the Bank‘s past work in education in order to
distill some lessons; it then discusses the key implementation issues for the strategy.
Results from Past Strategies
33. The new strategy for 2020 is informed by previous World Bank education strategies, the
strategy launched in FY2000 and the update of 2005 (table 1). The 2000 strategy stated the
Bank‘s mission in education to be ―to ensure everyone completes a basic education of adequate
quality, acquires foundation skills—literacy, numeracy, reasoning and social skills such as
teamwork—and has further opportunities to learn advanced skills throughout life, in a range of
post-basic education settings.‖ The strategy update five years later affirmed the Bank‘s
commitment to education for all; indeed, the patterns in the Bank‘s lending over the past decade,
as discussed in the previous section, show the Bank‘s support for universal basic education,
especially in low-income countries. But the 2005 update deviated from the 2000 strategy in
recognizing explicitly the desired outcome of educational progress—a knowledge-driven
economy and a cohesive society—and by replacing the emphasis on basic education with a focus
on developing holistic education systems: ―Our strategic thrust is to help countries integrate
education into national economic strategies and develop holistic education systems responsive to
national socio-economic needs.‖ The apparent change in focus between 2000 and 2005 is
significant. For example, while the objective in 2005 was still education for all, the 2005 update
stated that this was to be done with the development of the whole sector in mind. This focus on a
holistic approach may be why an increasingly larger share of education lending fell under the
category ―general education.‖ Lastly, the intended results orientation has yielded greater
enthusiasm for impact evaluation activities, as discussed in Box 5 above, but the emphasis on
results has not produced a more systematic inclusion of education outcome indicators in all
education projects (as well as in Country Assistance Strategies).
Table 1. The focus of the World Bank’s education strategies
FY2000 2005 For 2020
Objective Quality education for all Education for all and
education for the knowledge
Learning for all

World Bank Education Strategy 2020 – draft for comment 21
economy
Priorities
or themes Basic education (poorest,
girls)
Early interventions (early
child development,
school health)
Innovative delivery
Systemic reform
Integrate education into a
countrywide perspective
Adopt a sector wide or
holistic approach
Become more results
oriented
At the country level, to
strengthen education
systems to achieve results
At the global level, to
develop a high-quality
knowledge base in
education
34. The new education strategy differs from the past strategies in its focus on learning which
may be attained partly by more investments in inputs such as more trained teachers or university
professors, a better curriculum, and more learning materials, but which needs also institutional
changes in the education system. The new strategy emphasizes the importance of getting
governance arrangements, financing, incentives and accountability mechanisms, and
management tools aligned with education goals. It also explicitly recognizes that these
institutions should apply to learning opportunities outside the government sector and outside the
formal services if those education goals are to be achieved.
35. A previous assessment of primary education projects by the World Bank‘s Independent
Evaluation Group (IEG, formerly the Operations Evaluation Department) suggests that past
projects have not been effective in building institutional capacity, at least at the central level,
while system strengthening seems to have been more successful in support of school-level
management activities. The evaluations demonstrate that even though education projects have
long included interventions meant to strengthen the governance and management of the system,
monitoring and performance indicators have focused more on inputs and outputs rather than
outcomes. In addition, projects have generally neglected learning assessment activities and
indicators of governance performance. With respect to the broad priority of helping countries
invest in basic education, the World Bank has been a steadfast supporter.
A historical look at the Bank’s lending for education

World Bank Education Strategy 2020 – draft for comment 22
36. The World Bank has been supporting
educational development for 47 years. The Bank
approved its first education project in September
1962, a project to build secondary schools in
Tunisia. Eugene Black, the Bank‘s president at that
time, justified the support with the following words:
"Nothing is more vital to the economic progress of
underdeveloped countries than the development of
human resources through widespread education."
Since then, the Bank has supported 1,539 education
projects (or projects with education components) for
a total of $68.9 billion (in 2005 constant prices). Its
support for education has increased over time, both
in terms of numbers of projects, total amount of
lending, and as a share of total Bank lending (figure
8). Commitments from both IDA and IBRD
resources trace the rising trend in education lending,
with IBRD lending showing greater volatility over
the years. About 64 percent of the projects were
IDA credits. In 2009 and 2010, in part due to the
global economic downturn which in turn decreased
fiscal resources in many donor and recipient
countries, total education lending reached an all-
time high of $3.4 and $5.0 billion dollars (in current
prices), respectively.
37. In view of the MDGs for 2015 and the fact
that many countries remain far from reaching those
targets, during the 2010 MDG Summit at the United
Nations, the Bank pledged additional aid in IDA
credits to the countries farthest from reaching the
MDGs by 2015. Low- and lower middle-income
countries (as measured by their per-
capita GDP levels) receive the largest
share of the Bank‘s lending (figure 9).
38. Primary education has been
the single largest priority for the
World Bank over the years, and the
1990 Education for All declaration
and the 2000 Millennium
Development Goals declaration
marked higher levels of commitment
to primary education (figure 10).
Figure 9: Distribution of Bank lending for education,
by country income group
0
20
40
60
80
100
19
63
-65
19
66
-70
19
71
-75
19
76
-80
19
81
-85
19
86
-90
19
91
-95
19
96
-20
00
20
01
-05
20
06
-10
HICs
UMCs
LMCs
LICs
Figure 8. Trends in the World Bank’s lending for education, 1963-2010
EF
A
MD
G
02
04
06
08
01
00
Pro
ject
s
1960 1965 1970 1975 1980 1985 1990 1995 2000 2005 2010Year
Total number of projects with education component
EF
A
MD
G
0
10
00
20
00
30
00
40
00
50
00
Mill
ion
US
$
1960 1965 1970 1975 1980 1985 1990 1995 2000 2005 2010Year
IDA IBRD
Commitments to education from IDA, IBRD and total(constant 2005 million US$)
EF
A
MD
G
05
10
15
%
1960 1965 1970 1975 1980 1985 1990 1995 2000 2005 2010Year
Education as % of total World Bank lending

World Bank Education Strategy 2020 – draft for comment 23
Since 2000, the share of education funding for tertiary education and vocational education
declined while the share of ―general education‖ which benefits several education levels
increased. On average, about half of ―general education‖ goes to basic education. Using this
estimate, lending to preprimary and primary education increased from 47 percent during the
decade 1991-2000 to 49 percent the following decade. Moreover, assuming that about half of the
lending for secondary education benefits lower secondary education, the share of basic education
(i.e., pre-primary, primary, and lower secondary education) rose from 53 percent to 58 percent
between the two decades. Compared to the previous decade, lending for tertiary education was
halved during the 2001-2010 decade.
39. Patterns and
trends in the Bank‘s
financial aid become
clearer when taking into
account the
characteristics of
recipient countries. The
Bank‘s lending in a given
year depends not only on
financing available per
country but also on the
specific demand by
countries, their economic
need and fiscal
conditions, and
institutional capacity. An
econometric analysis of
Bank lending for
education from 1963 that
simultaneously takes into
account various factors such as population size, GDP per capita, and world region (using
multiple regression results from ordinary least squares with fixed effects and Tobit estimation)
shows several patterns (King and Nguyen 2010). It confirms that the Bank‘s education lending
indeed rose significantly after 1990 when governments and international organizations, including
the World Bank, made Education For All a commitment, and even more so after 2000 when the
Millennium Development Goals became a global mandate. Bank lending has also been
statistically significantly higher for countries with larger youth populations (ages 0-14) and for
poorer countries as measured by per-capita GDP levels. In addition, given both population size
and per-capita GDP levels, the Bank provided more aid to countries in South Asia and Africa
relative to Eastern Europe and Central Asia. Using also information that a country would later be
eligible for funding from the Fast Track Initiative Catalytic Fund (which began in 2004), the
results indicate that these countries have tended to receive substantially more resources from the
Bank over time (and not only after FTI was created) than non-eligible countries.
Figure 10: Share of Bank lending by Sub-Sector (%)
5.22.1
42.8
9.5
13.4
26.2
0.8
12.4
1.8
38.2
13.4
3.9
29.0
1.3
28.2
3.3
34.8
13.7
4.0
14.8
1.1
24.4
3.3
31.9
19.9
5.3
14.3
0.7
020
40
60
80
10
0%
1991-95 1996-2000 2001-05 2006-10
Adult literacy
Tertiary
Vocational training
Secondary
Primary
Pre-primary
General

World Bank Education Strategy 2020 – draft for comment 24
40. In terms of the IFC‘s involvement in education, investments grew from about $7 million
in 2003 to $170 million in 2010, and these are projected to grow further in the next five years.
Not surprisingly, the distribution of these investments is notably different than the Bank‘s. Close
to two-thirds of investments are in higher education, 22 percent are in vocational and technical
education, and 14 percent are in primary or secondary schools. Nearly one-half of these
investments were made in the Latin American region, one-quarter in Sub-Saharan Africa, and
one-fifth in the Middle East and North Africa. Education is one of five strategic pillars for IFC
and will continue to command available resources.
Contributions to the education knowledge base
41. The Bank‘s investment in education has not only been financial. External aid has been
accompanied by a range of analytical work that has contributed to understanding the education
challenges and policy options that countries face. Between FY01 and FY10, the Bank invested
USD 49 million12
in Economic and Sector Work in education, producing 277 pieces of analytical
work that examine critical issues facing education; these include status reports about countries‘
education indicators and whole-sector or sub-sector analysis of fiscal and structural issues. In
addition, the Bank‘s staff working in other sectors produced 895 pieces of analytical work that
include a discussion of education topics. Indeed, many country reports, such as public
expenditure reviews and poverty assessments, include a chapter on the education sector. Bank-
wide reports such as the yearly World Development Report series too have examined education
issues and challenges as they relate to socioeconomic development, including those on workers
and labor markets (1995), knowledge, information and technology (1998/9), service delivery
(2004), and youth (2007). Bank staff have also been important contributors to the global
knowledge base and policy debates about education through external publications (Box 7). These
knowledge products underpin the Bank‘s lending and policy dialogue in education. They have
also allowed the Bank to provide other types of assistance. Over the past decade, the Bank has
seen a major shift in its analytical work. While the amount of Economic and Sector Work has not
increased, Technical Assistance (TA) has become increasingly prevalent. The Africa region and
the Eastern Europe and Central Asia regions experienced the highest increase in Technical
Assistance, while this type of knowledge product remains rare in the South Asia region.
World Bank Education Strategy 2020 – draft for comment 25
Differentiated Priorities According to Need and Capacity
42. The World Bank‘s global coverage means that it can broker exchanges across regional
borders so that countries that share similar levels of economic and educational development are
able to benefit from each other‘s experiences and policy lessons. While such exchanges already
happen, they do so largely in an ad hoc manner. The new strategy will promote more systematic
cross-regional and cross-country exchanges, based on a grouping of countries by their levels of
economic and educational development. For countries with similar educational development in
very different parts of the world, the components of the education system, and their relations, are
likely to be at the same level of maturity. For example, assessment systems in low income
countries are typically latent, though a few countries do implement large-scale national
examinations; in contrast, middle income countries typically have established assessment
systems that include national examinations as well as participation in international tests.
Therefore, the challenges faced by these two groups of countries in developing their assessment
systems are different. Any of these groupings of countries is not a recommendation for a
reorganization of the World Bank to replace the regional divisions, but a way to organize
knowledge production and exchange among staff, as well as staff assignment and training.
Box 7. World Bank staff have contributed to the global knowledge base in education
Most policymakers have probably heard of the World Development Report. Many have probably read
one. The WDR is, however, just a small part of the World Bank‘s publications, which cover all the
development areas on which Bank staff work, including education, and include books, book chapters,
working papers, and articles in peer-reviewed scholarly journals. Overall and in the education field,
professional journals are the most common vehicle for Bank publications. Around 500 journal articles
on education have been authored by Bank staff, accounting for half of the Bank‘s publications on
education. The rest is split about equally between books, book chapters, and working papers (many of
which end up as book chapters or journal articles). Focusing on just one thematic area, the economics of
education, comparing the Bank with 14 top universities reveals that with respect to the number of
journal articles, the Bank is the world leader—only Harvard University comes close.
What has been achieved as a result of the Bank‘s 1,000 publications on education? One way of
answering this question is to ask how far these publications have influenced development thinking in the
field. This is a reasonable question since the Bank likes to think of itself as the ―knowledge bank‖, and
has aspirations to be a generator of new knowledge, not just a synthesizer of existing knowledge. The
obvious measure of the Bank‘s success as a generator of knowledge is citations. The broadest citation
data today come from Google Scholar which covers not just journal articles but books, book chapters,
working papers, dissertations, and technical reports. Journal articles have a highly skewed citation
distribution: a lot of articles never get cited, or get cited just a few times, while some get cited a lot. The
median citation count for education articles is 13, while that of books is 10. On mean citations, however,
books do better than articles—47 compared to 43. Book chapters get cited very infrequently—a mean of
just 8.5.
Source: Estimates by Wagstaff, based on Ravallion and Wagstaff (2010)
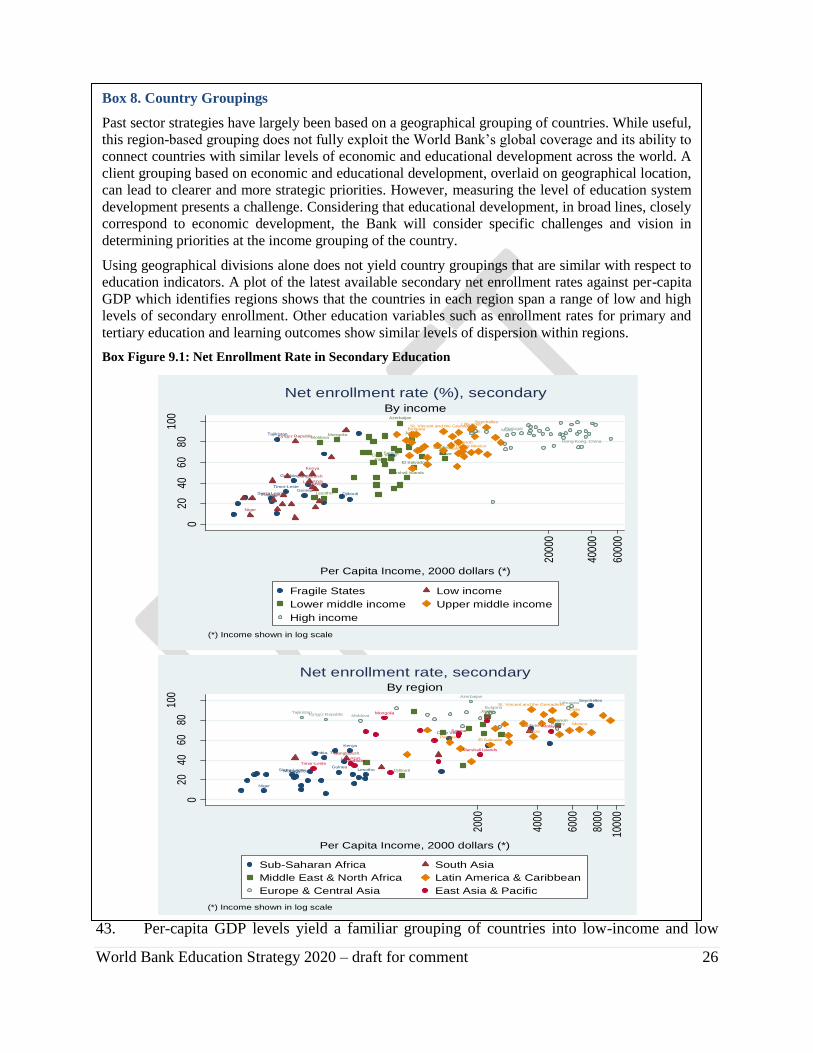
World Bank Education Strategy 2020 – draft for comment 26
43. Per-capita GDP levels yield a familiar grouping of countries into low-income and low
Box 8. Country Groupings
Past sector strategies have largely been based on a geographical grouping of countries. While useful,
this region-based grouping does not fully exploit the World Bank‘s global coverage and its ability to
connect countries with similar levels of economic and educational development across the world. A
client grouping based on economic and educational development, overlaid on geographical location,
can lead to clearer and more strategic priorities. However, measuring the level of education system
development presents a challenge. Considering that educational development, in broad lines, closely
correspond to economic development, the Bank will consider specific challenges and vision in
determining priorities at the income grouping of the country.
Using geographical divisions alone does not yield country groupings that are similar with respect to
education indicators. A plot of the latest available secondary net enrollment rates against per-capita
GDP which identifies regions shows that the countries in each region span a range of low and high
levels of secondary enrollment. Other education variables such as enrollment rates for primary and
tertiary education and learning outcomes show similar levels of dispersion within regions.
Box Figure 9.1: Net Enrollment Rate in Secondary Education
Timor-Leste
Tajikistan
DjiboutiSierra LeoneTogo
Gambia, The
Guinea
Lao PDRCambodia
Kyrgyz Republic
Bangladesh
Madagascar
Niger
Kenya
Samoa
Marshall Islands
MongoliaMoldova
Azerbaijan
Belize
El SalvadorParaguay
Jordan
Maldives
Lesotho
Cape Verde
Fiji
MalaysiaTurkey
Bulgaria
Lithuania
Mexico
St. Vincent and the Grenadines
Chile
Lebanon
Seychelles
Hong Kong, China
PortugalMalta
020
4060
8010
0
Enr
ollm
ent r
ate
2000
0
4000
0
6000
0
Per Capita Income, 2000 dollars (*)
Fragile States Low income
Lower middle income Upper middle income
High income
(*) Income shown in log scale
By income
Net enrollment rate (%), secondary
Sierra LeoneTogo
Gambia, The
GuineaMadagascar
Niger
Kenya
Lesotho
Cape Verde
Seychelles
Bangladesh
Maldives
Djibouti
Jordan
Lebanon
Belize
El SalvadorParaguay
Mexico
St. Vincent and the Grenadines
ChileTajikistan
Kyrgyz Republic Moldova
Azerbaijan
Turkey
Bulgaria
Lithuania
Timor-Leste
Lao PDRCambodia
Samoa
Marshall Islands
MongoliaFiji
Malaysia
020
4060
8010
0
Enr
ollm
ent r
ate
2000
4000
6000
8000
1000
0
Per Capita Income, 2000 dollars (*)
Sub-Saharan Africa South Asia
Middle East & North Africa Latin America & Caribbean
Europe & Central Asia East Asia & Pacific
(*) Income shown in log scale
By region
Net enrollment rate, secondary

World Bank Education Strategy 2020 – draft for comment 27
middle-income and high middle-income countries, but a number of countries have experienced
(or are experiencing) major and long-running conflicts and face a particular set of challenges in
addition to those related to their economic situation. These countries can also be grouped by
whether they experience conflict or fragile situations (Box 8). Armed conflicts, natural disasters
and other catastrophic events threaten education outcomes because they damage school
infrastructure, distract the attention of leaders and communities from service delivery, expose
children and youth to severe physical and mental stress, and interfere directly or indirectly with
school operation and teaching and learning. According to the World Development Report 2010,
―a child of primary school age is 3 times as likely to be out of school if she or he lives in a fragile
or conflict-affected country as would be the case if she or he were born in another developing
country or one of the BRICs. Likewise, a child in a country recovering from conflict or fragility
is 1.5 times as likely to be out of school than a child in a developing country not affected by
conflict‖ (World Bank 2010c). Youth who participated directly in armed conflict may have
missed the crucial period in which they should have built social and human capital skills.
(Blattman and Annan 2010, Gilligan et al. 2010) In countries experiencing fragile situations,
education has the potential to be a powerful and cost effective tool to speed up social and
economic recovery. The priorities for the Bank‘s education work in those countries would be a
place-dependent mix of the relevant categories.13
44. The strategy thus takes the approach of grouping countries by whether they are low-
income countries, middle-income countries, or countries with fragile situations. This grouping
differentiates countries by level of economic development and also by institutional capacity.
Although nearly all the countries in fragile situations are low-income countries, they differ from
other low-income countries in that their institutional context, the ―ecosystem‖ for any
educational reform, is fraught with additional political challenges. This proposed grouping of
countries does not imply a reorganization of the World Bank to replace the regional divisions,
but instead proposes a way to organize knowledge production and exchange as well as staff
assignment and training within the current regional setup. Despite differences between them, the
three groups of countries share common challenges which are best addressed globally through a
set of cross-cutting priorities, such as how to improve the efficiency and effectiveness of the use
of resources in the education system and how to improve learning outcomes; however, the
specific solutions to these challenges are likely to take different shapes and timing. Briefly, the
differentiated priorities for the Bank‘s education work for these country groups are:
45. Countries with fragile situations. The main challenge in these countries is to address
short-term needs without undermining the long-term development of the system. Given this
challenge, the priorities of the Bank‘s education sector in fragile states are to (i) assess the
system; (ii) keep the system running, using local stakeholders as leaders of institutional change
and transition; and (iii) promote learning and equality from the outset. In other to achieve this,
the Bank will support equitable cost-effective and sustainable modalities of service delivery to
respond in a timely basis to reactivating learning needs in difficult contexts. At the same time, it
will advise on teacher and paraprofessional selection and management and promote the use of
learning assessments to build the capacity of the education sector and a solid institutional
structure.

World Bank Education Strategy 2020 – draft for comment 28
46. Low-income countries. The main challenge in these countries is to support the balanced
expansion of opportunities to learn at all levels with adequate quality, including universalizing
basic education of 8-10 years, including out-of-school children and youth, and early childhood
development. To address this challenge, the Bank will prioritize (i) enhancing access to and
performance of the education system; (ii) supporting adequate finance of education in the context
of expansion of access; and (iii) more specifically, for those countries that have not met the
MDGs, providing additional US$750m in grants and zero-interest loans for basic education over
the next five years.. To this end, the Bank will identify and support innovative strategies for
serving underserved populations and increasing completion rates and addressing access barriers
from the demand side. It will also invest in quality assurance systems for all providers, through
learning assessment systems and improved regulatory frameworks.
47. Middle-income countries. The main challenge in these countries is to ensure equity of
learning opportunities and to invest in skills that contribute to the economy‘s competitiveness.
Therefore, the Bank‘s priorities in those countries will be to (i) enhance the education system for
quality and relevance, in order to improve links with the labor market and school-to-work
transition, and respond to a growing demand for flexible skill acquisition programs; (ii) promote
policy frameworks for ensuring the quality of privately provided services; (iii) improve the
efficiency of the education system; (iv) promote equity of opportunities for disadvantages
populations; and (v) support sensible financing mechanisms for tertiary education. Therefore, the
Bank will advise on the development of flexible skill acquisition systems, regulatory frameworks
for private provider participation, national qualification frameworks, and quality assurance
systems in order to enhance the quality and relevance of education and match the supply and
demand for skills.
Implementation Levers
48. The Bank‘s contributes to development in three ways: knowledge generation and
diffusion and policy debate, financial and technical support to countries, and partnerships. These
are the broad implementation levers for the new strategy, and under each are specific actions in
the next ten years. Among those broad challenges, consider: (a) financing for results. (b)
Teacher policies for learning. The effectiveness of teacher policies (e.g., training, hiring,
compensation, deployment, supervision) is critical to an education system‘s performance; this is
one area that typically needs a major overhaul in order to motivate and support teachers. These
reforms have to be consistent with a quality assurance framework.
Knowledge generation and policy debate
49. System diagnostics, results measurement and benchmarking. In support of
implementing a systems perspective, the World Bank launched a multi-year program called
Benchmarking Education Systems for Results (BESR). The program is developing a
comprehensive tool for system diagnostics to assess the characteristics and effectiveness of
education systems and their component sub-systems against global standards, best practice, and
performance of comparator countries. This knowledge program will fill a major gap in the

World Bank Education Strategy 2020 – draft for comment 29
availability of institutional data about education systems. The country diagnostics and
performance reports produced under the program (in collaboration with national researchers and
decision-makers and other actors) will make it possible for all parties with a stake in the
performance of their education system to have a simple, objective, up-to-date snapshot of how
their systems function and how well they are performing and what countries can do concretely to
get measurably better results (Box 9). To improve aid effectiveness, a culture of results
monitoring and assessment should pervade the work in the sector. When budgetary resources and
staffing are constrained, knowing which interventions produce the desired outcomes most
efficiently and effectively is crucial.
50. Increasing learning assessment and other education data. The World Bank has
partnered with UNESCO‘s Institute of Statistics to improve global education data on enrollment
and completion rates, among other indicators. The Bank will continue to help countries improve
their EMIS systems. At this time, there is no international consensus on best practices for EMIS
systems, and countries have vastly different systems that are often built from the ground up
without benefitting from the experience of other countries, so the Bank will identify best practice
for country EMIS systems, produce best practice guidelines and develop the appropriate training
modules for staff. Information technologies can be used to facilitate education-related data
collection and processing efforts in ways previously not possible (EduTech Group 2010).
51. Adopting a systems perspective and results orientation is possible only if countries have a
sufficiently strong framework of data collection, analysis and usage, so in the next decade, the
World Bank will support also efforts to expand the availability of learning data and skills
measures. It will support also the development of a program of regular assessments in partner
countries and the mechanisms that will use and feed back the results of such assessments to
administrators, policymakers and other stakeholders. In this, it will be joining governments as
well as other international organizations in collecting learning data. Second, the Bank will
support the development or improvement of learning assessment systems. Previous experience
with assessment systems through Bank projects has been mixed. The 2004 IEG report flagged
that only half of student assessment activities in projects were fully fulfilled, and only 57 percent
were at least partly fulfilled. This failure may be due to a lack of systemic approach to student
assessment. (Box 10) In addition to national assessment systems, the Bank will promote country
participation in international and/or regional assessments as a means to build the global database
Box 9. Benchmarking Education Systems for Results (BESR)
The BESR program takes a systems approach to examine the core functions and sub-systems of the education
system, understand how they are connected with one another, and identify potential leverage points for policy
makers to improve system performance and results. The program is developing diagnostic tools to:
(i) collect data on the policies and performance of core education sub-systems in a given country or jurisdiction,
including the teacher system, learning assessment system, financial management system, equity and inclusion
system, and the quality assurance system, and each of these subsystems has specific functions;
(ii) analyze the data to identify and describe the key functions, rules and regulations, and incentive mechanisms
within the system, its challenges and good practices; and
(iii) help countries use the data and analytical findings to inform policy decisions and investments.

World Bank Education Strategy 2020 – draft for comment 30
on learning gains. More and more countries have shown interest in benchmarking their learning
outcomes against the outcomes of other countries.
52. Analytical and evaluative research. As discussed above, the World Bank has made
large contributions to education knowledge creation and diffusion. When the social returns to
these activities exceed the private returns, it makes sense to subsidize them. Even country-
specific or project-specific research adds value to the global market for knowledge and
experience. Governments, international agencies and individual researchers are devoting more
attention to examining which policies and programs yield measurable results and are most cost-
effective. Establishing the impact of policies and programs requires an understanding of the
incentives and constraints faced by all parties involved, the school providers, the parents and the
learners. Increasingly, evaluative research is making use of experimental methods to estimate the
impact of policy reforms and investments, but most of these studies pertain to specific inputs
such as an increase in the number of teachers in a school or to policy reforms such as the
abolition of fees. With the new strategy, more research is needed on the impact of institutional
change, such as the establishment of a national learning assessment, a national accreditation
mechanism for private schools and universities, or decentralization of education finance.
Institutional change is likely to be more unwieldy for designing an impact evaluation as defining
the appropriate counterfactual would be more difficult.
Box 10. ABCs of a Learning Assessment System
Assessment is the process of gathering and evaluating information on what students know, understand, and can
do in order to make an informed decision about what to do next in the educational process. An assessment system
is a group of policies, structures, practices, and tools for generating and using information on student learning.
Countries may be in four stages of assessment system—mature (best practice), established (desirable standard),
emerging (on the way to meeting standard) and latent (at the beginning stages of building the assessment system).
A system may be at different stages of development in relation to different types of assessment activity – i.e., a
system may be Established in the area of examinations, but Emerging in the area of surveys, and vice versa. The
main factor that characterizes systems that make the shift from Emerging to Established is a concerted focus on
reforms, inputs, and practices that strengthen the enabling environment for assessment.
Types of assessments are classroom assessments (they provide real-time information to support teaching and
learning in individual classrooms), examination (provide information about individual student‘s progress through
the education system), and large-scale assessments (for monitoring and providing policy- and practitioner-
relevant information on overall performance levels in the system, changes in those levels, and related or
contributing factors.)
There are three main drivers of information value/quality in an assessment system: enabling environment (it
refers to the broader context in which the assessment activity takes place and the extent to which that context is
conducive to, or supportive of, the assessment); system alignment (it refers to the extent to which the assessment
system is aligned with the rest of the education system), and technical quality (it refers to the psychometric
quality of the instruments, processes and procedures used for the assessment activity).
Source: Clarke 2010

World Bank Education Strategy 2020 – draft for comment 31
Technical and financial support for countries
53. In order to help strengthen education systems, the World Bank will adopt three priorities
for its operations. First, the Bank will establish a feedback cycle between financing and results to
implement a systems perspective that focuses on learning goals. Operationally, this means that
financial aid from the World Bank to governments will be increasingly geared towards and based
on the achievement of improvements in the education system that will lead to learning outcomes.
The presumption, of course, is that aid agencies have the same objective as countries (or at least,
their policymakers) (Steiner-Khamsi, 2006).14
Second, it will pay a high degree of attention to
teacher issues given their key role in learning and the very large share of spending in education
to pay for teachers‘ salaries. To improve the teaching force, policies must provide teachers the
incentives for good performance besides establishing and enforcing proper qualifications
(through pre- and in-service training and support services, in which most teacher-related
investments are focused on). Third, the Bank will respond to opportunities for multisectoral
approach to building knowledge and skills.
54. Financing for results. The Bank will support country programs to reform their funding
arrangements and resource allocations so that they are aligned with goals, functions and
accountability mechanisms. The Bank will support the strengthening of fiscal controls and
provide the tools and resources for assessing the performance of the education system, and will
pursue innovative results-based financing schemes in education. To be able to work from a
system perspective, it is important to understand the financing conditions that countries face. In
education systems throughout the world, central governments play a major role in the provision
and/or finance of education, usually, but not exclusively, for basic education. Despite increased
trends towards decentralized education systems, in many developing countries the central
government continues to control a large share of education financing and to make a majority of
decisions regarding the allocation of education budgets. These include the level of education
spending, the revenue sources, the allocation mechanisms, the explicit and implicit relationships
between institutions that determine incentives, accountability and power, and finally what
instruments exist for fiscal control and capacity building.
55. Adopting a systems perspective implies that the Bank would seek to strengthen the link
between financing and results, through what is sometimes referred to as ―results-based
financing.‖ Overall, the goals of education financing should be to ensure adequacy, promote
equity, and improve efficiency (Alderman and Vegas 2010). Results-based financing can be seen
as an omnibus term for various mechanisms that link financing to results which can be defined as
behaviors, services, outputs or outcomes. A useful starting definition is the one used by the
Bank‘s health sector: Results-Based Financing is ―a cash payment or non-monetary transfer
made to a national or sub-national government, manager, provider, payer or consumer of health
services after predefined results have been attained and verified. Payment is conditional on
measurable actions being undertaken.‖

World Bank Education Strategy 2020 – draft for comment 32
56. The education sector has piloted a number of results-based loans/credits in which
government financing to providers is conditioned on quantity and/or quality of service or
outputs. This type of agreement mirrors interventions in the health sector, where a large number
of RBF mechanisms allow the government to reward health service providers. For example, the
2010 Vietnam Education Project pilots an output-based subsidy to semi-public schools and
private schools to increase access to upper secondary education for poor students. The
performance-based nature of the project is expected to provide incentives for providing quality
education. However, sometimes the results-based financing is directly between governments and
recipients. For example, Conditional Cash Transfers (or CCT‘s) are a much-used multi-sectoral
approach whereby the government rewards recipients for certain output like increased school
attendance. In some instances, direct financing to students is combined with financing to teachers
and institutions, such as in the Bangladesh Secondary Education and Access Project (2008)
which provides monetary incentives to encourage rural students, teachers and institutions to
reach and maintain higher enrollments, better attendance rates and higher levels of achievement.
In addition, the education sector has also spearheaded a number of loans/credits that include
results-based agreements between the government and the Bank (e.g. Jamaica Early Childhood
Development Project (2008), Sindh and Punjab Education Sector Projects (2009)). (See Box 11.)
Box 11. Results-based Financing in the Punjab and Sindh Education Sector Projects
Two Pakistan education operations illustrate the potential benefits of tying financing more closely to
results. They (i) conditioned disbursements on implementation progress and performance targets
(referred to as Disbursement Linked Indicators-DLIs) in the government‘s reform program; (ii)
supported initiatives to improve governance and accountability; (iii) supported improvements in
budget and fiscal management, fiduciary management, and environmental safeguards that have broad
implications; and (iv) upgraded government monitoring and evaluation systems. Approved in June
2009, the projects provided retroactive financing of implementation targets met by the government
over FY2008/09. Because the government met all ten FY2008/09 DLIs and nine out of the ten
FY2009/10 DLIs in both projects, over 60% of the financing was disbursed within the first year of
implementation. The projects are in compliance with fiduciary and safeguard requirements and have
additionally leveraged improvements in fiduciary management, fiscal and budget management and
environmental safeguards. Some lessons that may prove beneficial for future results-based operations
are:
i. The DLIs, coupled with dialogue and client engagement, promote a results focus, and puts
pressure on government to act on politically-difficult but potentially-beneficial governance
initiatives supported by reform-minded stakeholders.
ii. The verification of DLIs also supports improvements in monitoring and evaluation practices.
iii. The DLIs help sustain the implementation of programs, consistent with the program design. This
is conducive to attaching impact evaluations which require that programs are implemented per
their design and on schedule in order to efficiently administer baseline and end line surveys.
iv. Where possible, spreading the timing of expected DLIs and their verification over the fiscal year
can ease the administrative and supervision burden on the government and the task teams.
v. There is presently sufficient internal flexibility to adjust disbursements to unanticipated crises
(e.g. floods in Pakistan) while preserving the high-powered incentives for achieving results.
vi. Supervision demands are likely to be high. Sufficient resources will have to be mobilized to
support the required level and quality of supervision.

World Bank Education Strategy 2020 – draft for comment 33
Under this setup, the event and amount of disbursements from the loan/credit are tied to pre-
specified annual implementation progress and performance targets, referred to as Disbursement
Linked Indicators (DLIs). The funds are disbursed against pre-determined budget line items that
do not necessarily correspond with the budget lines that were used for buying the inputs and
services needed to achieve the targets. The approach moves away from financing inputs and
disbursing against proof of government expenditures. Instead, it finances outputs and results, and
disburses against achievement of targets.
57. The Bank‘s proposed systems approach lends itself quite naturally to results-based
financing. Bearing in mind that the systems approach seeks to improve the institutions,
relationships of power and accountability and incentive structures within education,
disbursements of proceeds from Bank loans to governments could be linked to:
- Products: for example, completing a critical study of the private sector in education,
completing a round of national learning assessment, participating in an international test,
- Changes in institutions: for example, improvements in teacher management procedures,
establishment of a national certification board, development of a quality assurance
process for universities
- Changes in incentive structures: for example, conditioning financing at the sub-national
level on a measure of performance of secondary schools,
- Changes in policies: for example, improvements in teacher recruitment policies;
promotion of academic autonomy for universities.
58. Teacher policies. Addressing teacher shortages, quality, and performance is a cross-
cutting priority in all three country groups for primary and secondary education and even for
vocational and technical education. Teacher shortages, sometimes stemming from the poor
deployment of teachers rather than from low numbers, continue to block progress in some
countries. Teacher presence and effectiveness in the classroom are, of course, critical for
learning. The 2005 education strategy emphasized the importance of teacher recruitment,
assignment, compensation, and career development as key to teacher effectiveness and noted the
usefulness of community involvement in recruiting teachers and curbing absenteeism. The new
strategy adds a systemic view of teacher reforms in which policy goals relate to setting clear
expectations for teachers, ensuring that pay and benefits are competitive so as to attract the best
into the teaching profession, prepare teachers through both pre-service training and classroom
practice, monitoring the performance of teachers, as well as supporting and motivating them as
needed. Connecting these policy goals require that teacher training must be aligned with the
curriculum and with monitoring and assessment system. Countries in each country group may
focus on a particular aspect of these teacher policies. In low-income countries, for instance, the
critical issue might be to train teachers fast enough and effectively enough in order to address
severe shortages in hard-to-staff areas and schools, while in middle-income countries, the critical
issue might be to offer sufficient incentives to attract the best graduates into teaching and away
from other jobs in a relatively dynamic labor market.

World Bank Education Strategy 2020 – draft for comment 34
59. The Bank will support the implementation of teacher reform programs through financing
and analytical work. In particular, the Bank‘s knowledge agenda will: (i) build evidence and
develop best practice guidelines on teacher selection, management, incentives for performance,
pedagogical practices, professional development, and alignment with the curriculum and
assessment systems. (ii) develop diagnostic tools to assess teacher policies and inform reforms;
and (iii) build the knowledge base on the political economy of education reform, including
teacher reforms. (Box 12). Over the next three years the Bank will take on the following actions
to implement priorities in this area: (i) Build access to expertise on teacher quality and
performance issues through a combination of expert database, staff training, and hiring. (ii) Train
staff on topics including: i) effective practices for teacher selection, management and incentives;
ii) effective pedagogical practices and professional development; iii) analysis of political
economy of education reform. (iii) Pilot analysis of political economy of teacher reform during
project preparation.
60. Multisectoral approach. Using a multisectoral approach repeats a theme from the 2005
strategy update. While the Bank‘s involvement in education should be strategic and selective, the
Bank‘s engagement in a country must reflect a broad understanding of the whole education
system (e.g., the country‘s learning needs for growth and poverty reduction, the range of
available public and private services) as well its linkages to other sectors such as health,
nutrition, agriculture and industry, water and transport, and environment. For example, children
need to be healthy and well-nourished so they are physically able to attend school and learn
Box 12. Political Economy of Reform in Education
Theoretical research and (limited) empirical evidence suggest that there are windows of opportunity for
introducing education reforms. Reforms are more likely to be introduced when (i) there is an observable sector
crisis; (ii) there is a new government; (iii) the costs of reform are dispersed among groups that have little
political power and its benefits are concentrated on a powerful group; (iv) powerful groups that bear the costs of
reform can be compensated; (v) demands for reform come from a group with relatively homogeneous interests
and preferences; (vi) few players have influence on the decision-making process; (vii) education reform is
combined with other reforms (e.g., efficiency in public expenditure, poverty reduction); (viii) reform is
introduced incrementally rather than all at once; and (ix) political agreements and commitments can be sustained
over time. Identifying windows of opportunity requires TTLs to be constantly aware of the sector‘s political
context. This context is dynamic; understanding and operating within it requires a day-to-day monitoring of the
political scenario, to inform project design, implementation and supervision, rather than a one-time in-depth
analysis. In turn, monitoring the political context requires a conceptual framework –preferably, one that is
simple, straightforward and adapted to the particularities of the education sector.
There is a tendency to approach education reform in a sequential form: first access, then quality. Some countries
had followed this approach, gaining support for education reforms by increasing the based of educated people.
However, access reforms can create powerful groups that subsequently oppose and hinder quality reforms.
Quality reforms will be difficult to introduce because on one hand, the main beneficiaries are students, who are
usually not organized, and who will not see any tangible benefits in the short term; and on the other hand, the
reform will likely entail a cost to one or more powerful players, in the form of higher efficiency in the education
sector, accountability measures of teachers, or more selective criteria to become a teacher, with implications for
the power of the Ministry of Education and its employees, individual teachers and teacher organizations. In
contrast to students, these players do have an organized way to express their interests, and can be expected to do
so if a potential reform threatens their power base or interests.
Source: Barrera-Osorio, Paglayan and Jorrat (2010).

World Bank Education Strategy 2020 – draft for comment 35
(SHN 2010, ECD Community of Practice 2010). The availability of roads and transport facilities
determines the burden of getting to school every day for both students and teachers. Civil service
rules often determine just how easy or difficult it would be to implement teacher management
reforms. Another example of the benefits of a multisectoral approach is that educational progress
can be better understood using analyses of both the supply of learning opportunities and the
economy and its labor markets. But a multisectoral approach serves not only as a lens for
analyzing the role of education policy; it should serve also as a business model for choosing the
best policies and investments to bring about more learning. Thus, investments in early childhood
nutrition, water and sanitation facilities in schools, or shifts in labor regulations might induce
more educational progress than a change in an education policy. To practice a multisectoral
approach is to be open to promising reforms outside the realm of familiar education
interventions. The challenge to date has been to implement this approach and to provide Bank
staff with the right incentives, tools, and skills to work across sectors. It requires both that
education staff are knowledgeable about the issues and impact of other sectors on education and
that budgetary and administrative arrangements provide the appropriate framework for education
staff to work with staff in other sectors. In FY09 more than 40 percent of new lending for
education sector was made jointly with Bank staff working in another sector.15
Strategic partnerships
61. The global challenge of improving education is immense. The World Bank Group
partners with multilateral and bilateral agencies on knowledge products, investment operations
and programmatic initiatives. Collaboration with a host of development partners, in particular
with UN agencies such as UNESCO and UNICEF, promotes global commitment towards the
achievement of the MDGs and learning goals. There are also close ongoing partnerships with
Box 13. Regional and Bilateral Education Strategies
Most development agencies share the goal of helping partner countries attain universal access to basic education,
and prioritize efforts to improve the quality of services and equal opportunities to access them. Similarly, most
donors recognize the linkages between education and economic growth and increasingly focus on strengthening
post-basic education levels. Through lending operations and analytical work, regional development banks prioritize
different areas to support countries in meeting these goals, thus responding to particular regional and country-
specific challenges. For example, the Asian Development Bank is increasingly focusing on raising the quality of
technical and vocational education, while the Inter-American Development Bank is focusing its efforts on early
childhood development, teacher quality, and the transition from school to the work place. The African
Development Bank, on the other hand, emphasizes the reform of higher education and enhancing math and science
teaching at the secondary level.
Bilateral development agencies follow targeted approaches to support particular aspects of education systems,
within a larger framework of poverty reduction and inclusive growth, mainly through budget support, grants and
analytical work. For instance, the UK Department for International Development‘s priority is to support quality
education for all by focusing on teachers and learning assessments with special attention to Fragile States. The
Alliance Francaise de Developpement focuses on strengthening the management of education systems, curriculum
and training of teachers and managers, and analysis of demand problems in access and student retention, while the
Danish Development Agency works to ensure that girls and women gain access to education. In Asia-Pacific
countries, the Australian Agency for International Development aims to reach the disadvantaged and marginalized
to complete basic education and progress to higher levels while improving the relevance and quality of vocational
and technical education. Most of the bilateral development agencies have been actively involved in supporting the
Fast Track Initiative that works towards accelerating the process to meet universal primary education by 2015.

World Bank Education Strategy 2020 – draft for comment 36
bilateral organizations and with private foundations, local and global technical institutions, and
civil society groups. These partnerships will continue to be crucial for mobilizing resources for
education and for improving policymaking within countries. (Box 13) A system‘s approach takes
into consideration the role of private donors including philanthropic foundations, corporations,
and business networks that play an important role in funding education investments and
providing expertise. In many cases, private donors work outside governmental structures and
primarily cooperate with civil society organizations because they see themselves as ―problem-
solvers;‖ in others they partner with governments to support policy reforms.
Performance and impact indicators
62. The success of the new strategy will be measured by a number of key measurable
performance and impact indicators. Table 2 lists eight performance indicators which reflect
specific Bank actions and achievements towards helping countries strengthen their education
systems, and five impact indicators which measure the combined effect of Bank action and
country-led polices and interventions. In a detailed results framework, each performance
indicator is produced by specific actions taken by the Bank. Those specific actions will differ
depending on the country‘s particular circumstances and capacity. In the first three years of the
implementation of the strategy, it will be critical to undertake the knowledge activities and staff
capacity development needed to support technical and financial aid to partner countries.
63. Performance Indicators. Regarding the Knowledge generation & exchange,
performance indicators include the generation of the diagnostic tools of education sub-systems
(such as teachers or assessment); analytical work and research, including impact evaluation; and
the development of tools to measure skills. Performance indicators concerning Bank organization
are the development of staff training and development regarding system approaches to education
and the generation of system-oriented staff practice groups. The performance indicators of Bank
products are the number of operations with a result-based financing approach; loans/credit that
has (systemic) learning assessments component; the number of countries that participate in
regional or international assessments; and the number of countries further from the goal of
MDG‘s in 2010 that have receive financial and technical assistance.
64. In turn, the impact indicators of this work are the number of countries with system
diagnosis; number of countries that apply and use the skills tools; number of loans/credits with
satisfactory outcomes and that uses a multisectoral approach; and finally the number of countries
with significant progress towards the MDGs.

World Bank Education Strategy 2020 – draft for comment 37
Table 2 Performance and Impact Indicators for the 2020 Education Strategy
Implementation
Levers Performance Indicators
Impact Indicators
Knowledge
generation &
exchange
1. Availability of diagnostic tools for
education sub-systems (e.g., teacher
recruitment, compensation & promotion;
school inspection; higher education
financing)
2. Number of analytical and evaluative
research pertaining to policies and
interventions that use a systems approach
3. Development of skills measurement tool
beyond measures of literacy & numeracy
1. Number of countries that have
applied system diagnostic tool,
collected and used system data
2. Number of countries that have
applied skills measurement tool,
collected and used skills data
Bank organization
4. Development of staff development
program around the systems approach,
and number of staff trained
5. Development of system-oriented staff
practice groups 3. Number of loans/credits with
satisfactory outcomes
4. Number of loans/credits that have
used a multisectoral approach
Bank products
6. Number of loans/credits that have used
results-based financing
7. Number of loans/credits that supported
countries to carry out learning
assessments and/or participate in regional
or international assessments
8. Number of countries furthest from the
education MDGs in 2010 that have
received financial and technical assistance
from the Bank
5. Number of assisted countries that
have progressed significantly
towards MDGs

World Bank Education Strategy 2020 – draft for comment 38
REFERENCES
Abadzi, H. (2010) ―How to Integrate Quality in the 2020 Sector Strategy?: The Promise of a new
Science-Based Framework,‖ Background Paper for the Education Sector Strategy 2020, The
World Bank, Washington, DC.
Alderman, A. and E. Vegas. (2010) ―Education Strategy 2020: Background Note on Education
Finance,‖ Background Paper for the Education Sector Strategy 2020, The World Bank,
Washington, DC
Andrabi, Tahir, Jishnu Das, and Asim Ijaz Khwaja. 2008. ―Report Cards: The Impact of
Providing School and Child Test-scores on Educational Markets”.
http://www.hks.harvard.edu/fs/akhwaja/papers/RC_14Nov08.pdf .
Appia, E. and W. McMahon. (2002) ―The Social Outcomes of Education and Feedbacks on
Growth in Africa,‖Journal of Development Studies, Vol. 38 (4), pp. 27-68.
Autor, D., F. Levy, and R. Murnane. (2003) ―The Skill Content of Recent Technological
Change: An empirical exploration,‖ Quarterly Journal of Economics, Vol. 118(4), pp. 1279-
1333.
Banerjee, A., R. Banerji, E. Duflo, R. Glennester and S. Khemani. (2008) ―Pitfalls of
Participatory Programs: Evidence from a Randomized Evaluation in Education in India,‖
Policy Research Paper Series, Nr. 4584, The World Bank, Washington, DC.
Banerjee, A., S. Cole, E. Duflo and L. Linden. (2007) ―Remedying Education: Evidence from
Two Randomized Experiments in India,‖ Quarterly Journal of Economics, Vol. 122, Nr. 3,
pp. 1235-64.
Barrera-Osorio, F., T. Fasih and H. Patrinos. (2009) Decentralized Decision-Making in Schools:
The Theory and Evidence of School-Based Management, The World Bank, Washington, DC.
Barrera-Osorio, F., A. Paglayan and D. Jorrat. (2010) ―Political Economy of Education:
Background Note for the Education Sector Strategy 2020,‖ Background Paper for the
Education Sector Strategy 2020, The World Bank, Washington, DC.
Behrman, J. and N. Birdsall. (1983) ―The Quality of Schooling: Quantity Alone is Misleading,‖
The American Economic Review, Vol. 73, No. 5, pp. 928-946.
Berk, D. (2002) Tertiary Education: Lessons from a Decade of Lending, FY1990-2000.
Operations Evaluation Department, The World Bank, Washington, DC.
Bhutta, Z., T. Ahmed, R. Black, S. Cousens, K. Dewey, E. Giugliani, B. Haider, B. Kirkwood, S.
Morris, H. Sachdev, M. Shekar, for the Maternal and Child Undernutrition Study Group.
(2008) ―Maternal and Child Undernutrition 3. What works? Interventions for maternal and
child undernutrition and survival,‖ The Lancet, Vol. 371(9610), pp. 417-40.
Blankespoor, B., S. Dasgupta, B. Laplante and D. Wheeler. (2010) ―Adaptation to Climate
Extremes in Developing Countries: The Role of Education,‖ Policy Research Working Paper
Series, Nr. 5342, The World Bank, Washington, DC.
Blattman, C. and J. Annan. (2009) ―The Consequences of Child Soldiering,‖ Review of
Economics and Statistics, Forthcoming.
Brahmbhatt, M. and L. Pereira da Silva. (2009) ―The Global Financial Crisis: Comparisons with
the Great Depression and Scenarios for Recovery,‖ PREM Note, Nr. 141, The World Bank,
Washington, DC.

World Bank Education Strategy 2020 – draft for comment 39
Bray, M. (2009) ―Confronting the Shadow Education System: What Government Policies for
What Private Tutoring?‖ Unesco International Institute for Educational Planning, Paris.
Bundy, D. and T. O'Connell. (2010) ―School Health, Nutrition, School Feeding and HIV Work
Program: Background Note for Education Sector Strategy 2010,‖ Background Paper for the
Education Sector Strategy 2020, The World Bank, Washington, DC.
Chaudhury, N. and D. Parajuli. (2010) ―Giving it Back: Evaluating the Impact of Devolution of
School Management to Communities in Nepal,‖ Mimeo, World Bank, Washington, DC.
Chen, S. and M. Ravallion. (2008). ―New Global Poverty Estimates,‖ World Bank Research
Digest, Vol. 3(1, Fall): 4.
Chowdhury, M., R. Botlero, M. Koblinsky, S. Saha, G. Dieltiens and C. Ronsmans. (2007)
―Determinants of Reduction in Maternal Mortality in Matlab, Bangladesh: a 30-year Cohort
Study,‖ The Lancet, Vol. 370, pp. 1320–28.
Clarke, M. (2010) ―Framework for Building an Effective Assessment System,‖ Background
Paper for the Education Sector Strategy 2020, The World Bank, Washington, DC.
Commission on Growth and Development. (2008) The Growth Report: Strategies for Sustained
Growth and Inclusive Development, The World Bank, Washington, DC.
Corbacho, A., M, Garcia-Escribano and G. Inchauste. (2007) ―Argentina: Macroeconomic Crisis
and Household Vulnerability,‖ Review of Development Economics, Vol. 11(1), pp. 92–106.
COREHEG. (2010) ―Education Sector Strategy 2020: Tertiary Education,‖ Background Paper
for the Education Sector Strategy 2020, The World Bank, Washington, DC.
Crouch, L. (2006) "Education Sector: Standards, Accountability, and Support." In Daniel
Cotlear, (eds.), A New Social Contract for Peru: An Agenda for Improving Education, Health
Care, and the Social Safety Net, The World Bank, Washington, DC.
Cunha, F., J. Heckman, L. Lochner, and D. V. Masterov. (2006) ―Interpreting the Evidence on
Life Cycle Skill Formation,‖ Chapter 12, Handbook of the Economics of Education, E. A.
Hanushek and F. Welch (eds.), Elsevier North Holland.
Currie J. and E. Moretti. (2003) ―Mother's Education and The Intergenerational Transmission Of
Human Capital: Evidence From College Openings,‖ The Quarterly Journal of Economics,
Vol. 118(4), pp.1495-1532.
Dang, H. and H. Rogers. (2008) ―How to interpret the growing phenomenon of private tutoring:
human capital deepening, inequality increasing, or waste of resources?‖ Policy Research
Working Paper Series, Nr. 4530, The World Bank, Washington, DC.
Das, J., P. Pandey, and T. Zajonc. (2006) ―Learning Levels and Gaps in Pakistan,‖ World Bank
Policy Research Working Paper Series, Nr. 4067, The World Bank, Washington, DC..
Da Silva, H. and D. Ratnadiwakara. (2008) ―Using ICT to reduce transaction costs in agriculture
through better communication: a case-study from Sri Lanka‖ Unpublished Manuscript,
LIRNEasia, Colombo, Sri Lanka.
Dee T. (2004) ―Are there civic returns to education?‖ Journal of Public Economics, Vol. 88, pp.
1697– 1720.
De Walque, D. (2007) ―How Does the Impact of an HIV/AIDS Information Campaign Vary with
Educational Attainment? Evidence from Rural Uganda,‖ Policy Research Working Paper
Series, Nr. 3289, The World Bank, Washington, DC.

World Bank Education Strategy 2020 – draft for comment 40
Di Gropello, E. and J. Marshall. (2005) ―Teacher Effort and Schooling Outcomes in Rural
Honduras.‖ In Incentives to Improve Teaching: Lessons from Latin America, ed. E. Vegas,
pp. 307–58, The World Bank, Washington, DC.
Duflo, E., P. Dupas and M. Kremer. (2007) ―Peer Effects, Pupil-Teacher Ratios, and Teacher
Incentives: Evidence from a Randomization Evaluation in Kenya,‖ Unpublished manuscript,
Poverty Action Lab, Massachusetts Institute of Technology, Cambridge, MA.
ECD Community of Practice. (2010) ―Education Sector Strategy 2020: Background Paper on
Early Child Development (ECD),‖ Background Paper for the Education Sector Strategy
2020, The World Bank, Washington, DC.
EduTech Group. (2010) ―ICTs & Education: Issues and Opportunities,‖ Background Paper for
the Education Sector Strategy 2020, The World Bank, Washington, DC.
Engle, P., M. Black, J. Behrman, M. Cabral de Mello, P. Gertler, L. Kapiriri et al. (2007)
―Strategies to Avoid the Loss of Developmental Potential in More than 200 Million Children
in the Developing World,‖ The Lancet, Vol. 369(9557), pp. 229-242.
Fafchamps, M. and A. R. Quisumbing. (1999) ―Human Capital, Productivity, and Labor
Allocation in Rural Pakistan,‖ Journal of Human Resources, Vol. 34(2), pp. 369-406.
Fernald, L., P. Kariger, P. Engle and A. Raikes. (2009) ―Examining Early Child Development in
Low-Income Countries: A Toolkit for the Assessment of Children in the First Five Years of
Life,‖ The World Bank, Washington, DC.
Filmer, D. (2008) ―Disability, Poverty, and Schooling in Developing Countries: Results from 14
Household Surveys,‖ World Bank Economic Review, Vol. 22, Nr. 1, pp. 141-163.
Filmer, D. and L. Pritchett. (1999) ―The Effect of Household Wealth on Educational Attainment:
Evidence from 35 Countries,‖ Population and Development Review, Vol. 25, Nr. 1, pp. 85-120. Filmer, D., Hasan, A. and L. Pritchett. (2006) ―A Millennium Learning Goal: Measuring Real
Progress in Education,‖ Center for Global Development Working Paper Series, Nr. 97,
Washington, DC.
Fiszbein, A. and N. Schady. (2009) Conditional Cash Transfers: Reduction Present and Future
Poverty, Policy Research Report, The World Bank, Washington, DC.
Frankenberg, E., J. Smith and D. Thomas, 2003, ―Economic Shocks, Wealth, and Welfare,‖ The
Journal of Human Resources, Vol. 38, Nr. 2, pp. 280-321.
Gakidou, E., K. Cowling, R. Lozano and C. Murray. (2010) ―Increased Educational Attainment
and its Effect on Child Mortality in 175 Countries between 1970 and 2009: a Systematic
Analysis,‖ The Lancet, Vol. 376, Nr. 9745, pp. 959-74.
Gertler, P., M. Rubio-Codina and H. Patrinos. (2006) ―Empowering Parents to Improve
Education. Evidence from Rural Mexico,‖ Policy Research Working Paper Series, Nr. 3935,
The World Bank, Washington, DC.
Gilligan, M., E. Mvukiyehe and C. Samii (2010) ―Reintegrating Rebels into Civilian Life: Quasi-
experimental Evidence from Burundi,‖ Mimeo.
Glaeser, E., G. Ponzetto and A. Shleifer. (2006) ―Why Does Democracy Need Education?‖
NBER Working Paper Series, Nr. 12128, Cambridge, MA.
Grantham-McGregor, S., Y. Cheung, S. Cueto, P. Glewwe, L. Richter, B. Strupp at al. (2007)
―Developmental Potential in the First 5 Years for Children in Developing Countries,‖ The
Lancet, 369(9555), pp. 60-70.

World Bank Education Strategy 2020 – draft for comment 41
Grindle, M. (2004) Despite the Odds: The Contentious Politics of Education Reform, Princeton
University Press, Princeton, NJ.
Grossman, M. (2006) Education and Nonmarket Outcomes, In Handbook of the Economics of
Education, Vol. 1, ed. E. Hanushek and F. Welch, Elsevier BV.
Guernsey, K., M. Nicoli and A. Ninio. (2007) ―Convention on the Rights of Persons with
Disabilities: Its implementation and relevance for the World Bank,‖ Social Protection
Discussion Paper Series, Nr. 0712, The World Bank, Washington, DC.
Gunnarsson, V., P. Orazem, M. Sanchez and A. Verdisco. (2004) ―Does School Decentralization
Raise Student Outcomes? Theory and Evidence on the Roles of School Autonomy and
Community Participation,‖ Unpublished Manuscript, Iowa State University, Ames, Iowa.
Hanushek, E. and L. Woessmann. (2008) ―The Role of Cognitive Skills in Economic
Development,‖ Journal of Economic Literature, 46(3), pp. 607-668.
Haugh, D. and A. Redonda. (2009) “Pedal to the Metal: Structural Reforms to Boost Long-Term
Growth in Mexico and Spur Recovery from the Crisis,‖ Economics Department Working
Paper, No. 733, Organization for Economic Co-Operation and Development, Paris.
International Labor Organization. (2010) Global Employment Trends January 2010. Geneva.
Jakubowski, M., H. Patrinos, E. Porta and J. Wisniewski. (2010), ―The Impact of the 1999
Education Reform in Poland,‖ Policy Research Working Paper Series, Nr. 5263, The World
Bank, Washington, DC.
Jensen, R. (2007) ―The Digital Divide: Information (Technology), Market Performance and
Welfare in the South India Fisheries Sector,‖ Quarterly Journal of Economics Vol. 122, Nr.
3, pp. 879-924.
Jimenez, E. and Y. Sawada (1999) ―Do Community-Managed Schools Work? An Evaluation of
El Salvador‘s EDUCO Program,‖ World Bank Economic Review, Vol. 13 (3), pp. 415–41.
Jimenez, E. and Y. Sawada. (2003) ―Does Community Management Help Keep Kids in Schools?
Evidence Using Panel Data from El Salvador‘s EDUCO Program,‖ Discussion Paper, Center
for International Research on the Japanese Economy, University of Tokyo.
Jonsson, T. and Wiman, R. (2001) ―Education, Poverty and Disability in Developing Countries:
A Technical Note Prepared for the Poverty Reduction Sourcebook,‖ The World Bank,
Washington, DC.
Jollife, D. (1998) ―Skills, Schooling, and Household Income in Ghana,‖ The World Bank
Economic Review, Vol. 12 (1), pp. 81-104.
King, E. and V. Nguyen. (2010) World Bank Education Portfolio Review, Background Paper for
the Education Strategy, The World Bank, Washington, DC.
King, E. and B. Özler. (1998) ―What‘s Decentralization Got to Do with Learning? The Case of
Nicaragua‘s School Autonomy Reform,‖ Unpublished manuscript, Development Research
Group, World Bank, Washington, DC.
Kremer, M. and A. Holla. (2008) ―Pricing and Access: Lessons from Randomized Evaluations in
Education and Health‖ mimeo, Harvard University, Cambridge, MA.
Lam, D. and S. Duryea. (1999) ―Effects of Schooling on Fertility, Labor Supply, and
Investments in Children, with Evidence from Brazil,‖ The Journal of Human Resources, Vol.
XXXiV, I, pp.160-192.
Lavy, V. (2007) ―Using Performance-Based Pay to Improve the Quality of Teachers,‖ Future of
Children, Vol. 17(1, Spring), pp. 87-110.

World Bank Education Strategy 2020 – draft for comment 42
Lewis, M. and M. Lockheed, (2009) Inexcusable Absence: Why 60 Million Girls Still Aren’t in
School and What to Do About It, Center for Global Development, Washington DC.
Lleras-Muney, A. (2005) ―The relationship between education and adult mortality in the United
States,‖ Review of Economic Studies, Vol. 72, pp. 189-221
Lochner, L and E. Moretti. (2004) ―The Effect of Education on Crime: Evidence from Prison
Inmates, Arrests and Self-Reports,‖ American Economic Review, Vol. 94, Nr. 1, pp. 155-89.
Lopez-Calva, L. and L. Espinosa. (2006) ―Efectos diferenciales de los programas
compensatorios del CONAFE en el aprovechamiento escolar.‖ In Efectos del Impulso a la
Participación de los Padres de Familia en la Escuela (Effects of Parental Participation in the
School), ed. A. Blanco Lerín, Consejo Nacional de Fomento Educativo, Mexico City.
Orazem, P. and E. M. King. (2008) ―Schooling in Developing Countries: The Roles of Supply,
Demand and Government Policy,‖ In Handbook of Development Economics, eds. T. P.
Schultz and J. Strauss, Vol. 4, Elsevier BV.
Orazem, Peter & Glewwe, Paul & Patrinos, Harry, 2007. "The Benefits and Costs of Alternative
Strategies to Improve Educational Outcomes," Staff General Research Papers 12853, Iowa
State University, Department of Economics.
Organization for Economic Cooperation and Development (OECD). (2007) Understanding the
Brain: The Birth of a Learning Science, Paris.
Organization for Economic Co-Operation and Development (OECD) (2009) Economic Policy
Reforms. Going for Growth. Paris.
Paes de Barros, R. and R. Mendonça. (1998) ―The Impact of Three Institutional Innovations in
Brazilian Education.‖ In Organization Matters: Agency Problems in Health and Education in
Latin America, ed. William D. Savedoff, pp. 75–130, Inter-American Development Bank,
Washington, DC.
Patrinos, H., F. Barrera-Osorio and J. Guaqueta. (2009) The Role and Impact of Public-Private
Partnerships in Education, The World Bank, Washington, DC.
Perez-Brito, C. and N. Goldstein (2010) ―Mother Tongue Instruction and Bilingual Education in
the World Bank‘s Education Sector Strategy 2020,‖ Background Paper for the Education
Sector Strategy 2020, The World Bank, Washington, DC.
Perkins, G. (2004) ―Rationales and Results in Secondary Education Investments: A Review of
the World Bank‘s Portfolio, 1990-2001.‖ Operations Evaluation Department, The World
Bank, Washington, DC.
Porta Pallais, E. and J. Klein. (2010) ―Increasing Education Data Availability for Knowledge
Generation,‖ Background Paper for the Education Sector Strategy 2020. The World Bank,
Washington, DC.
RESULTS Educational Fund. (2010), World Bank Financing for Education: Less or More for
the Poor in IDA 16?, Washington, DC.
Rosenzweig, M. and T. P. Schultz. (1989) ―Schooling, Information and NonMarket Productivity:
Contraceptive Use and its Effectiveness‖, International Economic Review, Vol. 30. No. 2,
pp. 457-477.
Samoff, J. (2004) ―From funding projects to supporting sectors? Observation on the aid
relationship in Burkina Faso,‖International Journal of Educational Development 24(4): 397-
427

World Bank Education Strategy 2020 – draft for comment 43
Sawada, Y. and A. Ragatz. (2005) ―Decentralization of Education, Teacher Behavior and
Outcomes: The Case of El Salvador‘s EDUCO Program.‖ In Incentives to Improve
Teaching: Lessons from Latin America, ed. E. Vegas, pp. 255–306, The World Bank,
Washington, DC.
SHN. (2010). School Health, Nutrition, School Feeding and HIV Work Program: Background
Note for Education Sector Strategy 2010
Skills/TVET Community of Practice. (2010) ―Education Sector Strategy 2020: Skills/Voc-Tech
Education,‖ Background Paper for the Education Sector Strategy 2020, The World Bank,
Washington, DC.
Skoufias. E. and J. Shapiro. (2006) ―Evaluating the Impact of Mexico's Quality Schools
Program: The Pitfalls of Using Nonexperimental Data,‖ World Bank Policy Research
Working Paper Series, Nr. 4036, The World Bank, Washington, DC.
Steiner-Khamsi, G. (2006) ―The economics of policy borrowing and lending: a study of late
adopters,‖ Oxford Review of Education 32(5): 665-678
Strauss, J. and D. Thomas. (1995) ―Human Resources: Empirical Modeling of Household and
Family Decisions,‖ Chapter 34, Handbook of Development Economics, Volume III, J.
Behrman and T.N. Srinivasan, Elsevier Science.
Thomas, D., K. Beegle, E. Frankenberg, B. Sikoki, J. Strauss and G. Teruel. (2003) ―Education
in a Crisis,‖ Journal of Development Economics, Vol. 74(1), pp. 53-85.
TVET Thematic Group. (2010). ―Education Sector Strategy 2020: Background Note on
Technical and Vocational Education and Training.‖ Background Paper for the Education
Sector Strategy 2020, The World Bank, Washington, DC.
UNESCO. (2010) Education For All - Global Monitoring Report 2010, Paris.
United Nations. (1989) Convention on the Rights of the Child, Geneva.
Walker S., E., Wachs, J. Fardner, B. Lozoff, G. Wasserman, E. Pollitt et al. (2007) ―Child
Development: Risk Factors for Adverse Outcomes in Developing Countries,‖ The Lancet,
Vol. 369(9556), pp. 145-157.
Wantchekon L. and C. Vermeersch (2005) ―Information, Social Networks and the Demand for
Public Goods: Experimental Evidence from Benin,‖ NYU Manuscript, New York, NY.
White, H. (2004) Books, buildings, and learning outcomes, The World Bank, Washington, DC.
World Bank. (1999) Education Sector Strategy, Washington, DC.
World Bank. (2004) ―Primary Education Portfolio Review,‖ Background Paper or the Evaluation
of the World Bank‘s Support to Primary Education, Operations Evaluation Department,
Washington, DC.
World Bank. (2005) ―Education Sector Strategy Update. Achieving Education for All,
Broadening Our Perspective, Maximizing our Effectiveness,‖ Final draft paper, Washington,
DC.
World Bank. (2007a) World Development Report 2007. Development and the Next Generation.
Washington, DC.
World Bank. (2007b) Governance and Anti-Corruption Strategy, Washington, DC.
World Bank. (2009) Global Monitoring Report 2009: A Development Emergency, Washington,
DC.
World Bank. (2010a) Stepping up Skills for More Jobs and Higher Productivity, Washington,
DC.

World Bank Education Strategy 2020 – draft for comment 44
World Bank. (2010b) Report of Phase I External Consultations, Washington, DC.
World Bank (2010c) World Development Report 2010, Washington, DC.
World Bank. (2010d). A Review of the Bulgaria School Autonomy Reforms, Europe and Central
Asia Region, Human Development Network, Washington, DC.
World Economic Forum. (2009) The Brazil Competitiveness Report 2009, Geneva.
Yang, D. (1997) ―Education and Off-Farm Work,‖ Economic Development and Cultural
Change, Vol. 45(3), pp. 613-32.
Annex xx. Education priorities of development partners, according to their latest
education strategies Development Agency Priorities in Education Strategy
Asian Development Bank
(ADB) Increasingly direct its attention to raising the quality of technical and vocational
education and training
Continue to support expanded, higher-quality, more accessible basic and secondary
education in poorer countries
Inter-American
Development Bank
(IADB)
Focus its work on three main areas over the next three years:
Early Childhood Development, School to Work Transition, and Teacher Quality.
African Development
Bank Group
(AfDB)
Reforming and transforming higher education systems in Africa by:
Strengthening national and regional centres of excellence for training in selected
priority areas
Building and/or rehabilitating the existing science and technology infrastructure
Linking higher education to the productive sector.
UK Department for
International Development
(DFID)
Strategic priorities will help realize the vision of quality education for all are:
Access to a basic cycle of primary and lower secondary education with emphasis on
fragile states.
Quality of teaching and learning, particularly for basic literacy and numeracy;
Skills so that young people benefit from opportunities, jobs and growth.
Alliance Francaise de
Developpement (AFD) Complete universal enrollment by 2015 and to achieve equity between boys and girls.
Access to productive and decent employment and adaptability to changing needs in
labor market through apprenticeships
Capacity building and technical assistance to governments
Danish Development
Policy
Access to education improves women‘s economic opportunities with emphasis on
attaining stability on fragile states
Australian Agency for
Internatinal Development
(AUSAID)
Improve the functioning of national education systems to enable more girls and boys to
complete primary school and progress to higher levels of education
Improve the relevance and quality of education, including in vocational and technical
education
New Zealand Aid
(NZAID)
• Assisting core bilateral partner countries to achieve the Education For All goals
• Post-basic and tertiary education with a particular emphasis on achieving gender
equality at these levels of education by 2015.
US Agency for
International Development
(USAID)
Focus its education programs on: promoting equitable access to quality basic education
and enhancing knowledge and skills for productivity

World Bank Education Strategy 2020 – draft for comment 45
1 The Commission‘s report brings together the views of 19 leaders, mostly from developing countries, and of
internationally known academics, and draws upon the discussions in workshops that featured papers presented by
more than 300 distinguished academics. 2 Poor people are less able than non-poor people to maintain their consumption in the face of income shocks. For
example, during the East Asian crisis in the late 1990s, poorer households in Indonesia resorted to taking their
children out of school (Thomas et al. 2003). 3 See Filmer (2008) for findings on the negative impact of disability on schooling attainment.
4 The assessment was carefully adapted to the Malian context by local and international experts, using locally-
developed passages and word lists (not translations from an English assessment). It has to be noted that French is
not a mother tongue in Mali, and Grade 2 is a very early grade in which to test in a language that is not the mother
tongue. See Centre National de l‘Education (CNE), Programme Harmonisé d‘Appui au Renforcement de
l‘Education (PHARE), and RTI International. 2009. ―Evaluation initiale des competences fondamentales en lecture
ecriture basee sur l‘utilisation de l‘outil ‗EGRA‘ adapté et completé en français et en arabe au Mali;‖ and RTI
International and CEPROCIDE. 2009. ―Evaluation des Compétences Fondamentales en Lecture des Elèves de 2ème
Année des Ecoles Bamanankan, Bomu, Fulfuldé Et Songhoï du Premier Cycle de L‘Enseignement Fondamental‖. 5 The damage of the global financial crisis that struck in 2008 has weakened the growth prospects of the rich
countries in the near future, as they reduce excessive current account imbalances and unwind stimulus policies, and
as households pay off debt and rebuild their net worth (Brahmbhatt and Pereira da Silva, 2009; Global Economic
Prospects Report, World Bank 2010). 6 The same call is being made in OECD countries (OECD, Going for Growth, 2009): ―Early education helps to
broaden opportunity and stimulate subsequent learning, while secondary and tertiary education improves workforce
skills and enhances absorptive capacity. …Policies to improve higher education performance and output are a
priority for Austria, the Czech Republic, Finland, France, Germany, Greece, Hungary, Ireland, Italy, Poland, the
Slovak Republic, Sweden, Switzerland and Turkey.‖ 7 Autor, Levy and Murnane (2003) conclude that within industries in the U.S., computerization is associated with
reduced labor input of routine manual and routine cognitive tasks and increased labor input of non-routine cognitive
tasks. 8 ―Knowledge … includes the codified knowledge that can be set out in books, blueprints, and manuals, but also the
tacit knowhow acquired through experience. … It extends from abstract ideas, such as scientific formulae, to
eminently practical ones, such as the traffic circle or roundabout. … Knowledge does not only consist of ideas for
making more things, cheaper things, or new things. It includes the accumulated wisdom of human and social
experience—as historians and social scientists interpret and reinterpret it. For example, the ―invention‖ of the
separation of powers between three branches of government, and the checks and balances it ensures, is possibly one
of the most creative and influential innovations of the last few centuries. Many other institutional innovations have
been tried and refined through trial and error, and have helped achieve economic and social goals more efficiently
and fairly. (Commission on Growth and Development, 2008, 41) 9 For additional references, see King and Özler 1998; Jimenez and Sawada 1999; Gunnarsson et al. 2004; Duflo,
Dupas and Kremer 2007; Paes de Barros and Mendonça 1998; Jimenez and Sawada 2003; di Gropello and Marshall
2005; Gertler, Rubio-Codina, and Patrinos 2006; Skoufias and Shapiro 2006; Sawada and Ragatz 2005; Lopez-
Calva and Espinosa 2006. 10
A strong criticism of the sector in this regard is found in the Growth Commission‘s report: ―Researchers in this
field have settled on ―years of schooling‖ as a convenient, summary indicator of education. This is the measure they
most often cite in debate, and it is much envied by their counterparts in health policy, who lack a single, ―vulgar‖
measure (to use their term) in their field. … But years of schooling is only an input to education. The output—
knowledge, cognitive abilities, and probably also social skills and other noncognitive skills—is often not captured.
When it is measured, the results are often quite worrying. … We still need to know much more about education—
how to get the most out of the government‘s budget, and how to get the best out of teachers and their students. We
recommend this as a high priority for policy research. One place to start is measurement. The abilities of students—
their literacy and numeracy—need to be gauged far more widely around the world.‖ (Commission on Growth and
Development 2008, p. 38, 40)

World Bank Education Strategy 2020 – draft for comment 46
11
Examples are demand-side interventions, such as conditional cash transfers, implemented mostly in middle-
income countries with the aim of reaching children not in school as well as keeping children in school. This type of
intervention is spreading also to low-income countries (Fiszbein and Schady 2009). On the supply side, examples
include public-private partnerships (Patrinos et al. 2009), school-based management reforms (Barrera-Osorio et al.
2009), providing parents or the community with information about the quality of the institution (Duflo et al. 2008),
and different incentives to teachers (Lavy 2007). 12
This figure includes both funding from the Bank‘s own resources (BB) and Trust Fund sources. 13
As of 2009, the countries with fragile situations were Afghanistan, Angola, Burundi, Cameroon, Central African
Republic, Chad, Comoros, Democratic Republic of the Congo, Republic of Congo, Côte d'Ivoire, Djibouti, Eritrea,
The Gambia, Guinea, Guinea-Bissau, Haiti, Kiribati, Kosovo, Liberia, Myanmar, São Tomé and Principe, Sierra
Leone, Solomon Islands, Somalia, Sudan, Tajikistan, Timor-Leste, Togo, Tonga, West Bank and Gaza, Republic of
Yemen, and Zimbabwe. 14
Steiner-Khamsi (2006) warns that ―[T]oo often, policy transfer is framed in terms of coercion and imposition with
little critical analysis of why and how decision-makers in Third-World countries actively borrow reforms, both for
political and economic reasons, from elsewhere.‖ 15
The World Bank Group‘s International Finance Corporation has emerged as an increasingly strong investor in
private sector education since 2000. Working with IFC to identify joint projects and opportunities for public private
partnerships will provide new opportunities to meet national education goals.