lean thinking - provincial health services authority · lean thinking: less is more a spaghetti...
TRANSCRIPT

LEAN THINKINGFostering innovation in BC
OCTOBER 2012

“Every system isperfectly designed to achieve the results it gets.”
Edward Demming
ABOuT THE PROvINCIAL HEALTH SERvICES AuTHORITy (PHSA)
How we serve BCThe first organization of its kind in Canada, PHSA plans, manages and evaluates specialty and province-wide health care services across BC. Collaborating with the five geographic health authorities, PHSA works to ensure that everyone in the province has access to the kind of specialized health services they need, when they need them, wherever they happen to live. PHSA achieves this goal by providing leadership to agencies, services and projects under its jurisdiction.
PHSA Agencies• BC Cancer Agency• BC Centre for Disease Control• BC Children’s Hospital & Sunny
Hill Health Centre for Children• BC Mental Health & Addiction
Services• BC Provincial Renal Agency • BC Transplant• BC Women’s Hospital & Health
Centre• Cardiac Services BC• Perinatal Services BC
PHSA Divisions• BC Emergency Health Services• Health Shared Services BC
PHSA provides a number of pro-grams and services directly, includ-ing the BC Autism Assessment Network, and the BC Early Hearing Program. Through the Lower Main-land Service Consolidation Initiative, PHSA has assumed accountability for Interpreting Services and Pathol-ogy & Laboratory Services across the Lower Mainland, and Information Management & Information Technol-ogy Services for Vancouver Coastal Health and Providence Health Care.
PHSA also plans, coordinates, evaluates and, in some cases, funds specialized services delivered by the regional health authorities, including thoracic surgery, to ensure accessi-bility, quality, efficiency and effective-ness of province-wide delivery.
1
Edward Demming

2
Lean Thinking
Health expenditures have grown at a rate more than twice the rate of growth of GDP over the past 20 years and at nearly quadruple inflation rates in this decade. Increasing demand for services coupled with waiting lists and budget constraints are threatening the sustainability of our health care system and creating stressful work environments. At the same time, health care is under increasing scrutiny from the public and politicians to increase its focus on the quality and safety of patient care.
There is a growing realization in Canada that in order for the system to stabilize and become sustainable, the focus needs to be on value, defined as health care outcomes per dollar spent and the balance between cost and equality, rather than focusing solely on the numerator or the denominator, like many past attempts at health care reform. Or, to state it in its simplest terms, we need to specify value from a patient’s perspective.
In a patient-centric system, sometimes, more value means “less”. For example, the Lean case studies like those above that cut wait times enabled PHSA to increase the numbers of patients who receive service, using the same resource base.
THE HEALTH SySTEm – SHIFTING TO A LEANER PARAdIGm
Lean means more. More quality outcomes, a more engaged workforce, more focus on client needs, more effectiveness, more sustainable processes.
Lean means less. Less human effort, less inventory, less processing time, less space, less cost, less waste.
3
An 84% reduction in the time a patient with an eating disorder waits from referral to receive treatment; 86 days to 14 days.
A 78% reduction in wait time at the Cardiac Services Pre-admission Clinic (which prepares/assesses a person’s ability to withstand surgery) from 71 to 15 minutes.
A 32% reduction in the length of time a sick child spends in BC Children’s Pediatric Intensive Care Unit (PICU) from an average of 5.5 to 3.7 days.

Quality improvement research has proven that the average large organization wastes 70 – 90% of its available resources.
LEAN THINKING: LESS IS mORE
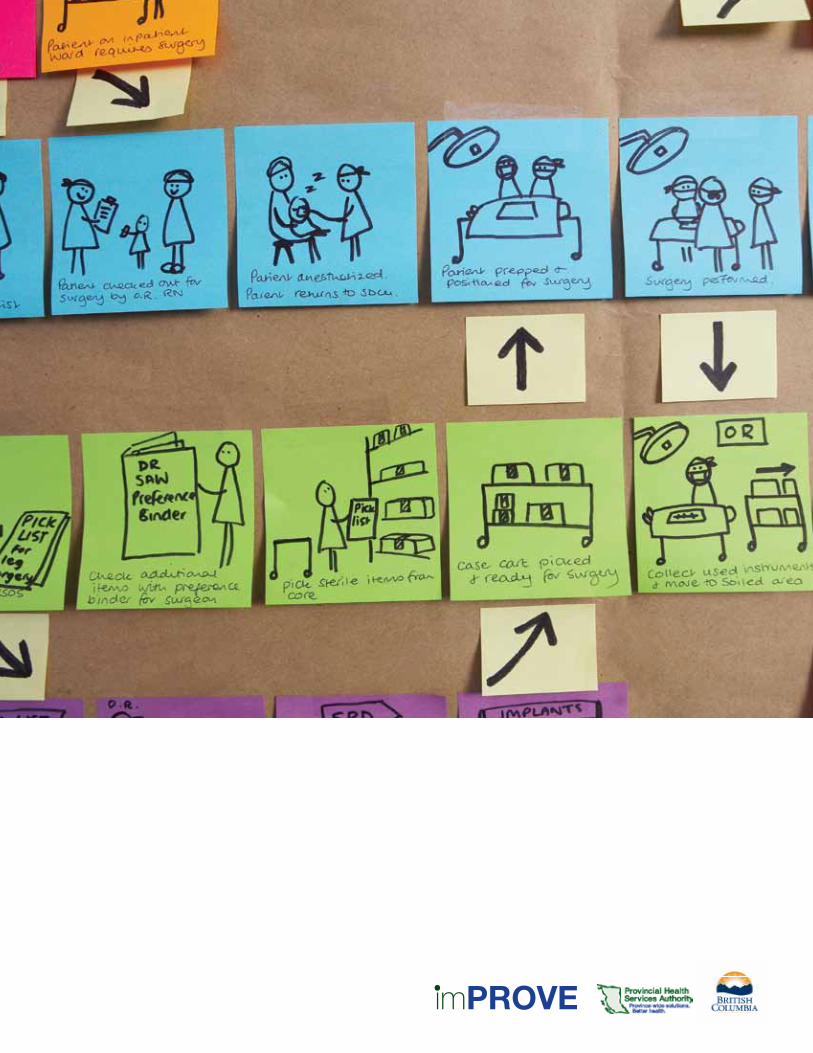
A spaghetti diagram is a simple tool commonly used in Lean methodology to trace the “flow of medicine”; for example, flow of patient, providers, supplies, equipment, information, food during the course of a work process. This visual representation can be quite revealing often resulting in a streamlined work flow that cuts wasted time and energy and allows people to work “smarter”.
4
Before
After

LEAN 101: wHAT IS IT?
“Lean thinking” is derived from the Toyota Production System. It is an innovative approach to the systematic elimination of waste in every process in an organization. Its goal is to be highly responsive to customer needs and demand by enhancing the quality of products or services (i.e. ‘outputs’, or outcomes in health care terms) and providing them in the most cost-effective manner possible with less human effort, less inventory, less processing time, and less space (i.e. less ‘inputs’). Lean has been widely adopted in the manufacturing industry over the past two decades and more recently across other industries. It has transformed organizations having a dramatic effect on quality, productivity, and cost.
best practices in health careThe application of Lean principles to health care is relatively new and showing great promise as an innovative approach to addressing the challenges and increasing pressures facing the health care industry. Lean examines every component in the patient’s journey focusing on those that add value to the care process and eliminating
those that do not. Standardization and minimization of variance in the value-added components are key themes in Lean that, when applied to health care, lead to improvements in the quality and safety of care.
Lean promotes the evaluation, uptake and dissemination of best practices and standards so that patients receive safe, high quality care and the best health outcome possible. Through the elimination of non-value added components, i.e. ‘waste’ from workflow, such as waiting, inventory, overproduction, etc. Lean redirects time and energy not only sustaining but also enhancing programs and services while managing within a fiscally-constrained environment.
Furthermore, Lean creates improvements by putting problem solving into the hands of those who do the work and encouraging teams to work together in a collaborative way to find solutions. Having staff and physicians meaningfully involved in the improvement of the system not only taps their intelligence and expertise, it also the increases morale by creating a more engaged workforce thereby enabling better retention and attraction of scarce health human resources.
Lean examines every component in the patient’s journey focusing on those that add value to the care process and eliminating those that do not.
Lean creates improvements by putting problem solving into the hands of those who do the work.
5

6
Lean 201

phsa pioneers leanPHSA was one of the first health organizations to adopt Lean as the “way we do business”. The Lean journey began in 2005, when Lean was first introduced as a process improvement methodology. The greater potential to make a significant difference within the health system was soon recognized. In early 2007, PHSA made a bold commitment to adopt Lean thinking as a key organizational strategy. The name “imPROVE” was adopted to reflect PHSA’s unique approach to Lean. It is an acronym based on the organizational values which have guided the implementation:
• Patients first• Results matter • Open to possibilities• Best value• Excellence through knowledge
imPROVE is a management system that empowers employees at all levels to remove waste and maximize value for the patient. Over the past five years, Lean has been strategically and systematically implemented throughout the PHSA not only to improve organizational performance, but also to foster a culture of innovation and continuous improvement throughout the organization.
LEAN 201: PuTTING LEAN INTO ACTION
7
A 75% improvement in the turnaround time in accessioning in labs at BC Children’s Hospital and BC Women’s Hospital – from 96 hours to 24 hours, meaning that specialty physicians in the hospital receive information they need to make critical diagnoses 3 days earlier.
An 83% improvement in the turnaround time from referral to the booking of an appointment at the BC Cancer Hereditary Cancer program. Wait time for a patient visit went from 42 days to 7 days.
A 65% reduction in the time from court referral to admission in the Forensic Psychiatric Hospital, which went from 10 days to 3.5 days.
A 50% reduction in the time a patient waits to get a diagnostic breast image after a referral (from 14 to 7 days) while at the same time increasing the capacity/ number of patients seen by 30%.
a 30% increase in the capacity at the TB clinic (from 250 to 325 patients) at the BC Center for Disease Control.

8
imPROVE

LEAN 201: THE imPROvE PROGRAm AT PHSA
patients FirstThe first step in Lean is to specify value from the patient’s perspective. This is done by mapping the patient journey through the health care system. A ‘value stream’ mapping exercise examines not only our own care and processes but also studies the interfaces with our care partners so that an integrated system is created along the continuum of care. This process creates inter-disciplinary, cross functional teams who discover previously unexplored synergies and solutions.
best ValueOnce the patient journey or value stream has been mapped, the components are analyzed to identify those that add value to the patient care process and those that don’t, to eliminate waste from workflow. This is the basic premise of Lean – better efficiency and therefore stewardship of taxpayers’ dollars, by optimizing value within available resources.
Waste is eliminated through rapid cycles of improvement, one week in duration (“Rapid Process Improvement Workshops”, or RPIWs”) that deliver tangible results, where staff are empowered to seek improvement by redesigning, testing and implementing the new process within that week. Similar, but smaller in scope are “Kaizen” events that last 2-4 days and focus on a smaller process.
excellence through KnowledgeThe RPIWs are led by leaders within PHSA with the greater purpose of creating a culture shift where doing things better, faster and without error becomes the only performance standard – in other words, a way of life. In order to support this, PHSA has created an extensive Lean education program comprised of a technical component and an applied component that requires leaders to become certified in lean thinking.
results MatterThe key to Lean transformation is its management system that provides infrastructure and standard work to regularly track key metrics, improvement progress, and staff
suggestions all aimed at providing the safest and best possible care. At PHSA, Performance Walls are being established where leaders review progress in achieving the value stream and associated RPIW goals in weekly stand-up meetings. Formal quarterly reports are presented to the agency executive teams to track progress and identify areas needing support to adjust course.
open to possibilitiesA Lean culture means that the organization encourages employees to actively seek and act on solutions to problems; that it’s open to possibilities and to challenging the status quo. Since the goal of Lean is to uncover problems and inefficiencies in the current system, people can often feel that their job security is threatened. To give staff the space and security to think differently and encourage innovative ideas, PHSA has made an Employee Promise that no one will lose employment as a result of participating in lean and creating “efficiencies”.
imPROVE is framed by the organizational values at PHSA.
9
10
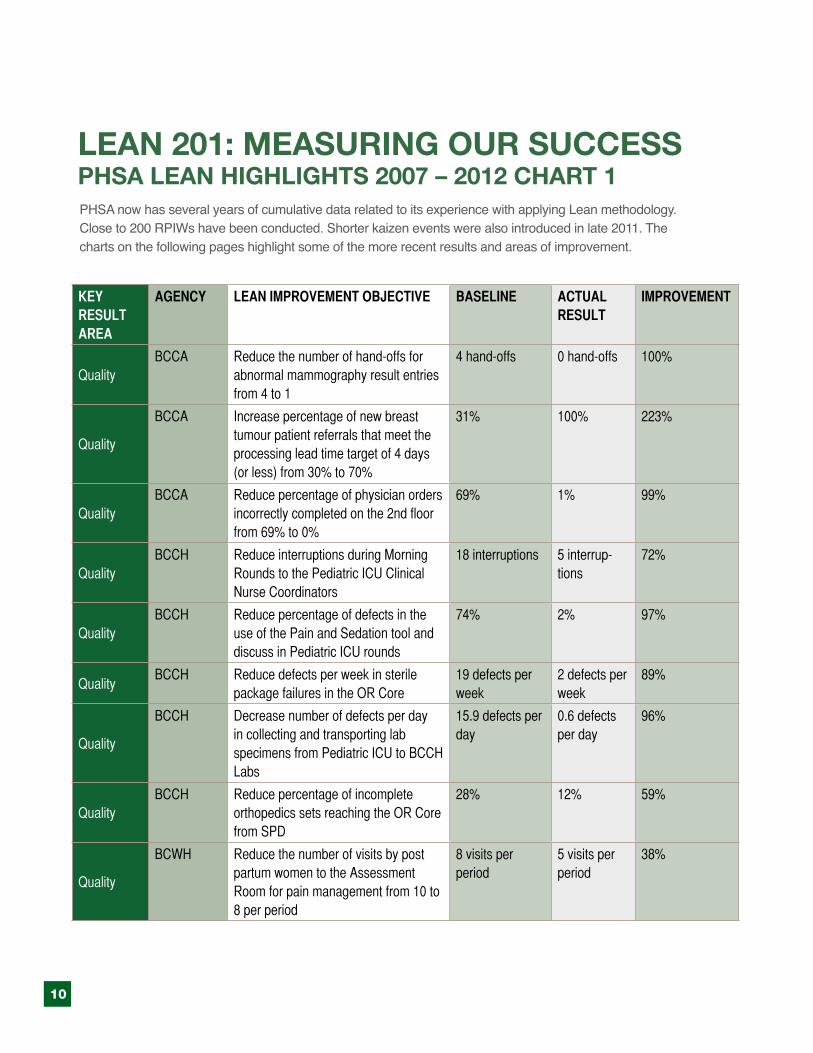
LEAN 201: mEASuRING OuR SuCCESSPHSA LEAN HIGHLIGHTS 2007 – 2012 CHART 1 PHSA now has several years of cumulative data related to its experience with applying Lean methodology. Close to 200 RPIWs have been conducted. Shorter kaizen events were also introduced in late 2011. The charts on the following pages highlight some of the more recent results and areas of improvement.
Key Result AReA
Agency leAn ImpRovement objectIve bAselIne ActuAl Result
ImpRovement
QualityBCCA Reduce the number of hand-offs for
abnormal mammography result entries from 4 to 1
4 hand-offs 0 hand-offs 100%
Quality
BCCA Increase percentage of new breast tumour patient referrals that meet the processing lead time target of 4 days (or less) from 30% to 70%
31% 100% 223%
QualityBCCA Reduce percentage of physician orders
incorrectly completed on the 2nd floor from 69% to 0%
69% 1% 99%
QualityBCCH Reduce interruptions during Morning
Rounds to the Pediatric ICU Clinical Nurse Coordinators
18 interruptions 5 interrup-tions
72%
QualityBCCH Reduce percentage of defects in the
use of the Pain and Sedation tool and discuss in Pediatric ICU rounds
74% 2% 97%
QualityBCCH Reduce defects per week in sterile
package failures in the OR Core19 defects per week
2 defects per week
89%
Quality
BCCH Decrease number of defects per day in collecting and transporting lab specimens from Pediatric ICU to BCCH Labs
15.9 defects per day
0.6 defects per day
96%
QualityBCCH Reduce percentage of incomplete
orthopedics sets reaching the OR Core from SPD
28% 12% 59%
Quality
BCWH Reduce the number of visits by post partum women to the Assessment Room for pain management from 10 to 8 per period
8 visits per period
5 visits per period
38%

11
LEAN 201: mEASuRING OuR SuCCESSPHSA LEAN HIGHLIGHTS 2007 – 2012 CHART 2
QualityBCWH Reduce lead time (hours) for results
received to clinician for review in Medi-cal Genetics Clinic
80 hours 28 hours 65%
QualityBCWH Reduce percentage of untabbed results
in Medical Genetics charts100% 16% 84%
QualityBCWH Reduce time for routine basic IV
change by two RNs from 27 minutes to 8 minutes in the Neonatal ICU
27 mins 9 mins 67%
QualityBCWH Reduce percentage of defects (missing
information) at Diagnostic Ultrasound patient visit from 25% to 0%
25% 8% 68%
QualityBCMHAS Reduce percentage of PreSentence
Reports not completed within five days of court date
10% 8% 20%
QualityBCMHAS Reduce defects in compliance with
guidelines for content of PreSentence Reports
18% 6% 67%
QualityBCMHAS Reduce defects in the Eating Disorder
Care Paths being utilized for inpatients100% 2% 99%
QualityLabs Decrease Quality Control failure rate
for Serology Labcell5% 1% 80%
QualityBCCDC Decrease defect rate for contact tracing
of an index case and all related Type 1 contacts from 100% to 35%
100% 29% 71%
QualityBCCDC Decrease defect rate (% of required
items completed on time during orien-tation period) from 48% to 10%
48% 24% 50%
SafetyBCCA Reduce defect rate for medication
reconciliation at discharge100% 0% 100%
SafetyBCCA Decrease patient wait time in the Am-
bulatory Care Unit from 14 minutes to 7 minutes for patients on active treatment
14 mins 5 mins 64%
Key Result AReA
Agency leAn ImpRovement objectIve bAselIne ActuAl Result
ImpRovement
12
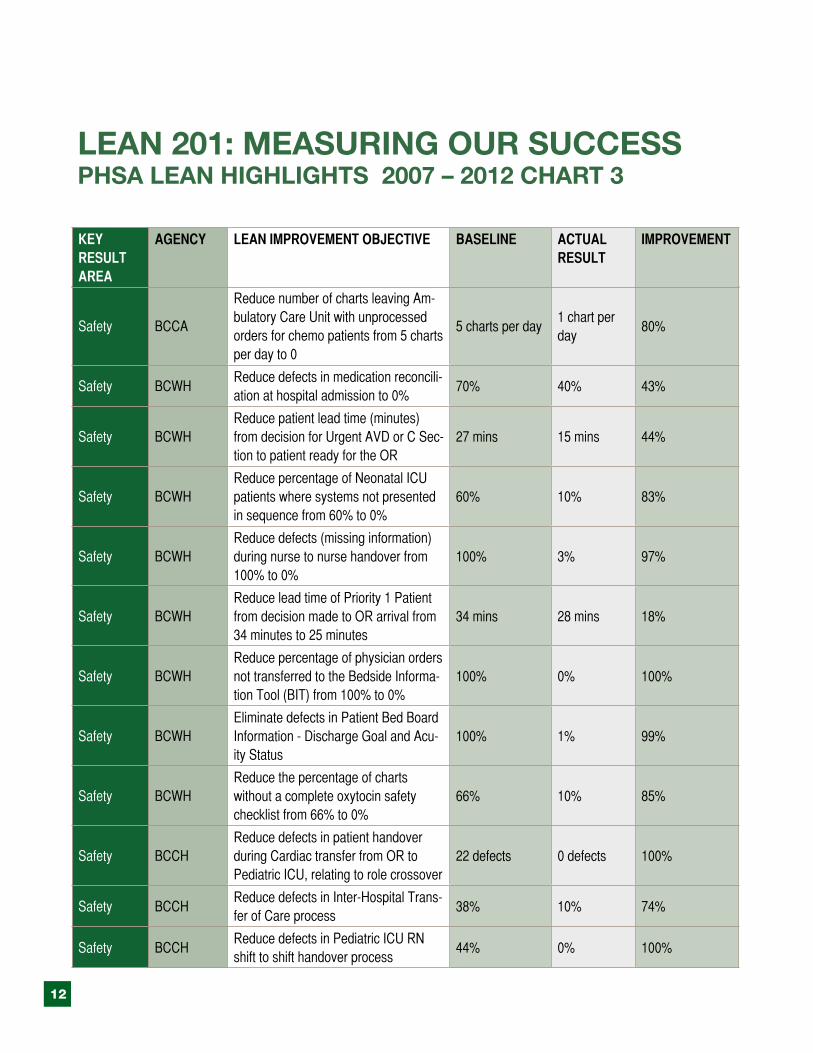
LEAN 201: mEASuRING OuR SuCCESSPHSA LEAN HIGHLIGHTS 2007 – 2012 CHART 3
Safety BCCA
Reduce number of charts leaving Am-bulatory Care Unit with unprocessed orders for chemo patients from 5 charts per day to 0
5 charts per day1 chart per day
80%
Safety BCWHReduce defects in medication reconcili-ation at hospital admission to 0%
70% 40% 43%
Safety BCWHReduce patient lead time (minutes) from decision for Urgent AVD or C Sec-tion to patient ready for the OR
27 mins 15 mins 44%
Safety BCWHReduce percentage of Neonatal ICU patients where systems not presented in sequence from 60% to 0%
60% 10% 83%
Safety BCWHReduce defects (missing information) during nurse to nurse handover from 100% to 0%
100% 3% 97%
Safety BCWHReduce lead time of Priority 1 Patient from decision made to OR arrival from 34 minutes to 25 minutes
34 mins 28 mins 18%
Safety BCWHReduce percentage of physician orders not transferred to the Bedside Informa-tion Tool (BIT) from 100% to 0%
100% 0% 100%
Safety BCWHEliminate defects in Patient Bed Board Information - Discharge Goal and Acu-ity Status
100% 1% 99%
Safety BCWHReduce the percentage of charts without a complete oxytocin safety checklist from 66% to 0%
66% 10% 85%
Safety BCCHReduce defects in patient handover during Cardiac transfer from OR to Pediatric ICU, relating to role crossover
22 defects 0 defects 100%
Safety BCCHReduce defects in Inter-Hospital Trans-fer of Care process
38% 10% 74%
Safety BCCHReduce defects in Pediatric ICU RN shift to shift handover process
44% 0% 100%
Key Result AReA
Agency leAn ImpRovement objectIve bAselIne ActuAl Result
ImpRovement
13
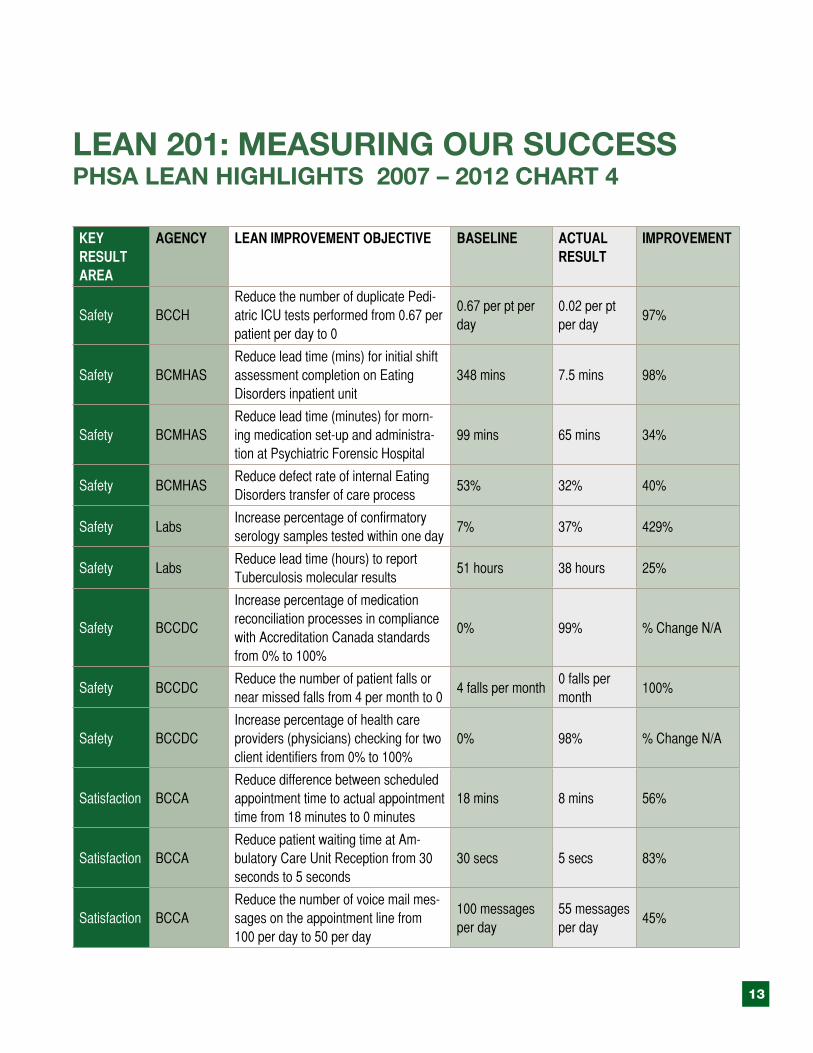
LEAN 201: mEASuRING OuR SuCCESSPHSA LEAN HIGHLIGHTS 2007 – 2012 CHART 4
Safety BCCHReduce the number of duplicate Pedi-atric ICU tests performed from 0.67 per patient per day to 0
0.67 per pt per day
0.02 per pt per day
97%
Safety BCMHASReduce lead time (mins) for initial shift assessment completion on Eating Disorders inpatient unit
348 mins 7.5 mins 98%
Safety BCMHASReduce lead time (minutes) for morn-ing medication set-up and administra-tion at Psychiatric Forensic Hospital
99 mins 65 mins 34%
Safety BCMHASReduce defect rate of internal Eating Disorders transfer of care process
53% 32% 40%
Safety LabsIncrease percentage of confirmatory serology samples tested within one day
7% 37% 429%
Safety LabsReduce lead time (hours) to report Tuberculosis molecular results
51 hours 38 hours 25%
Safety BCCDC
Increase percentage of medication reconciliation processes in compliance with Accreditation Canada standards from 0% to 100%
0% 99% % Change N/A
Safety BCCDCReduce the number of patient falls or near missed falls from 4 per month to 0
4 falls per month0 falls per month
100%
Safety BCCDCIncrease percentage of health care providers (physicians) checking for two client identifiers from 0% to 100%
0% 98% % Change N/A
Satisfaction BCCAReduce difference between scheduled appointment time to actual appointment time from 18 minutes to 0 minutes
18 mins 8 mins 56%
Satisfaction BCCAReduce patient waiting time at Am-bulatory Care Unit Reception from 30 seconds to 5 seconds
30 secs 5 secs 83%
Satisfaction BCCAReduce the number of voice mail mes-sages on the appointment line from 100 per day to 50 per day
100 messages per day
55 messages per day
45%
Key Result AReA
Agency leAn ImpRovement objectIve bAselIne ActuAl Result
ImpRovement
14
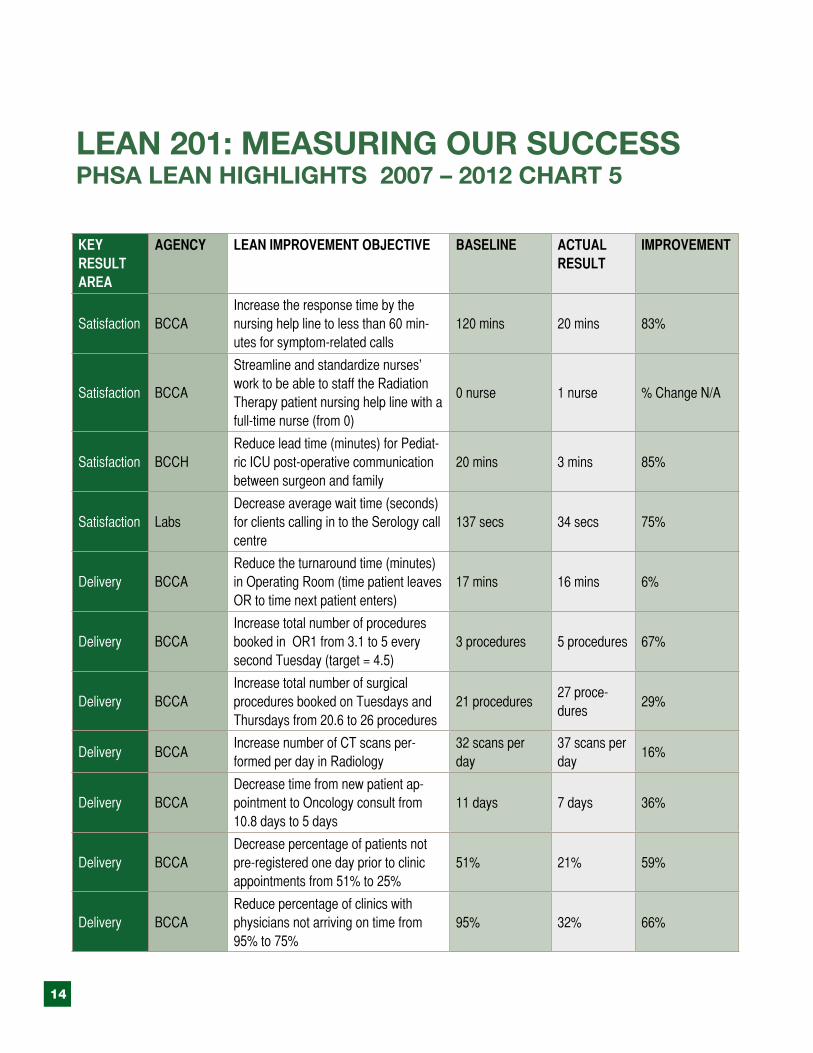
LEAN 201: mEASuRING OuR SuCCESSPHSA LEAN HIGHLIGHTS 2007 – 2012 CHART 5
Satisfaction BCCAIncrease the response time by the nursing help line to less than 60 min-utes for symptom-related calls
120 mins 20 mins 83%
Satisfaction BCCA
Streamline and standardize nurses’ work to be able to staff the Radiation Therapy patient nursing help line with a full-time nurse (from 0)
0 nurse 1 nurse % Change N/A
Satisfaction BCCHReduce lead time (minutes) for Pediat-ric ICU post-operative communication between surgeon and family
20 mins 3 mins 85%
Satisfaction LabsDecrease average wait time (seconds) for clients calling in to the Serology call centre
137 secs 34 secs 75%
Delivery BCCAReduce the turnaround time (minutes) in Operating Room (time patient leaves OR to time next patient enters)
17 mins 16 mins 6%
Delivery BCCAIncrease total number of procedures booked in OR1 from 3.1 to 5 every second Tuesday (target = 4.5)
3 procedures 5 procedures 67%
Delivery BCCAIncrease total number of surgical procedures booked on Tuesdays and Thursdays from 20.6 to 26 procedures
21 procedures27 proce-dures
29%
Delivery BCCAIncrease number of CT scans per-formed per day in Radiology
32 scans per day
37 scans per day
16%
Delivery BCCADecrease time from new patient ap-pointment to Oncology consult from 10.8 days to 5 days
11 days 7 days 36%
Delivery BCCADecrease percentage of patients not pre-registered one day prior to clinic appointments from 51% to 25%
51% 21% 59%
Delivery BCCAReduce percentage of clinics with physicians not arriving on time from 95% to 75%
95% 32% 66%
Key Result AReA
Agency leAn ImpRovement objectIve bAselIne ActuAl Result
ImpRovement

15
LEAN 201: mEASuRING OuR SuCCESSPHSA LEAN HIGHLIGHTS 2007 – 2012 CHART 6
Delivery BCCAIncrease percentage of physicians’ leave with more than 90 days notice from 34% to 90%
34% 59% 74%
Delivery BCWH
Reduce Post Partum patient wait time (minutes) for discharge from when nurse deems patient ready to leave to actual discharge time
30 mins 24 mins 20%
Delivery BCWHReduce lead time (minutes) for booked C Section patient preparation
133 mins 88 mins 34%
Delivery BCWHReduce lead time (minutes) within As-sessment Room
136 mins 30 mins 78%
Delivery BCWHReduce lead time (minutes) for non-laboring APH patients < 32 weeks in the Assessment Room
176 mins 125 mins 29%
Delivery BCWH
Reduce patient admissions per day shift to Assessment Room for fetal as-sessment by improving utilization and capacity in the DAP NST clinic.
11 admissions per day
4 admissions per day
64%
Delivery BCWHIncrease labouring patient admissions per day to Single Room Maternity Clinic from 5 to 7.
5 admissions per day
6.6 admis-sions per day
32%
Delivery BCWHReduce percentage of defects of patients not being flagged for discharge from 100% to 0%
100% 1% 99%
Delivery BCWHReduce Neonatal ICU patient lead time (from bed availability to call ITT) on day of discharge from 180 minutes to 90
180 mins 78 mins 57%
Delivery BCCHIncrease 5S score for Pediatric ICU large storage room
1.26 3.5 178%
Delivery BCCHReduce percentage of first case delays in Operating Room due to Pediatric ICU reasons
20% 0% 100%
Key Result AReA
Agency leAn ImpRovement objectIve bAselIne ActuAl Result
ImpRovement
16
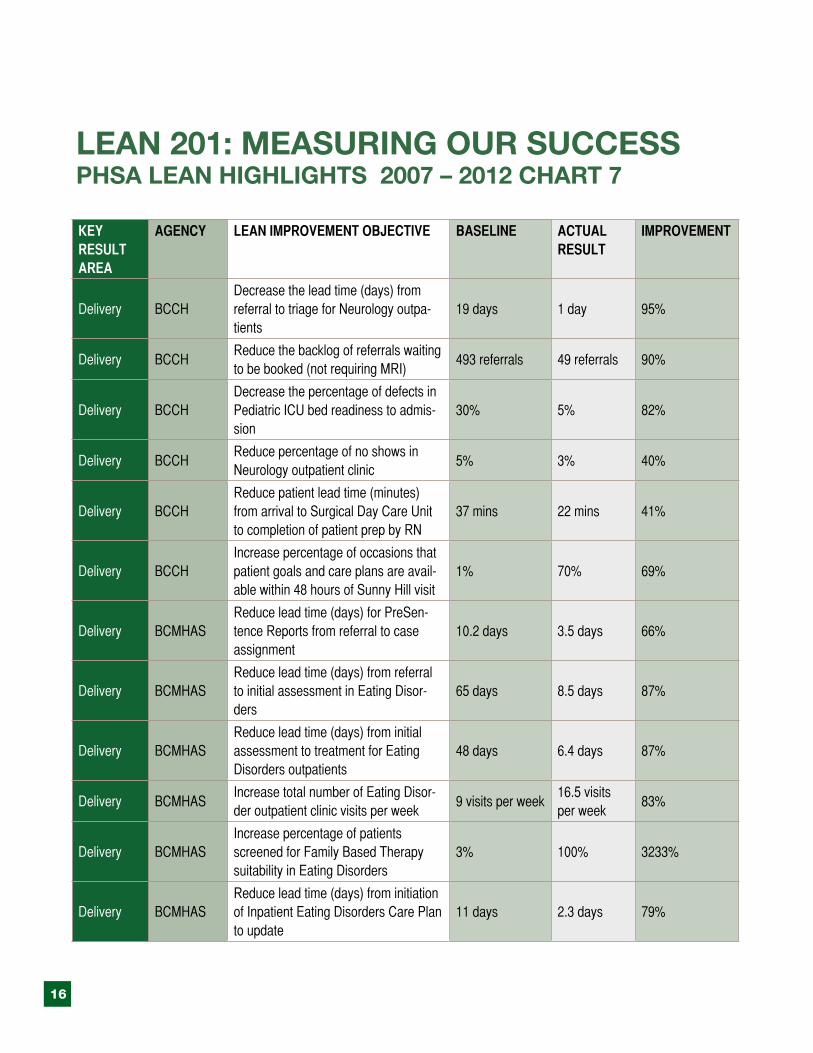
LEAN 201: mEASuRING OuR SuCCESSPHSA LEAN HIGHLIGHTS 2007 – 2012 CHART 7
Delivery BCCHDecrease the lead time (days) from referral to triage for Neurology outpa-tients
19 days 1 day 95%
Delivery BCCHReduce the backlog of referrals waiting to be booked (not requiring MRI)
493 referrals 49 referrals 90%
Delivery BCCHDecrease the percentage of defects in Pediatric ICU bed readiness to admis-sion
30% 5% 82%
Delivery BCCHReduce percentage of no shows in Neurology outpatient clinic
5% 3% 40%
Delivery BCCHReduce patient lead time (minutes) from arrival to Surgical Day Care Unit to completion of patient prep by RN
37 mins 22 mins 41%
Delivery BCCHIncrease percentage of occasions that patient goals and care plans are avail-able within 48 hours of Sunny Hill visit
1% 70% 69%
Delivery BCMHASReduce lead time (days) for PreSen-tence Reports from referral to case assignment
10.2 days 3.5 days 66%
Delivery BCMHASReduce lead time (days) from referral to initial assessment in Eating Disor-ders
65 days 8.5 days 87%
Delivery BCMHASReduce lead time (days) from initial assessment to treatment for Eating Disorders outpatients
48 days 6.4 days 87%
Delivery BCMHASIncrease total number of Eating Disor-der outpatient clinic visits per week
9 visits per week16.5 visits per week
83%
Delivery BCMHASIncrease percentage of patients screened for Family Based Therapy suitability in Eating Disorders
3% 100% 3233%
Delivery BCMHASReduce lead time (days) from initiation of Inpatient Eating Disorders Care Plan to update
11 days 2.3 days 79%
Key Result AReA
Agency leAn ImpRovement objectIve bAselIne ActuAl Result
ImpRovement
17
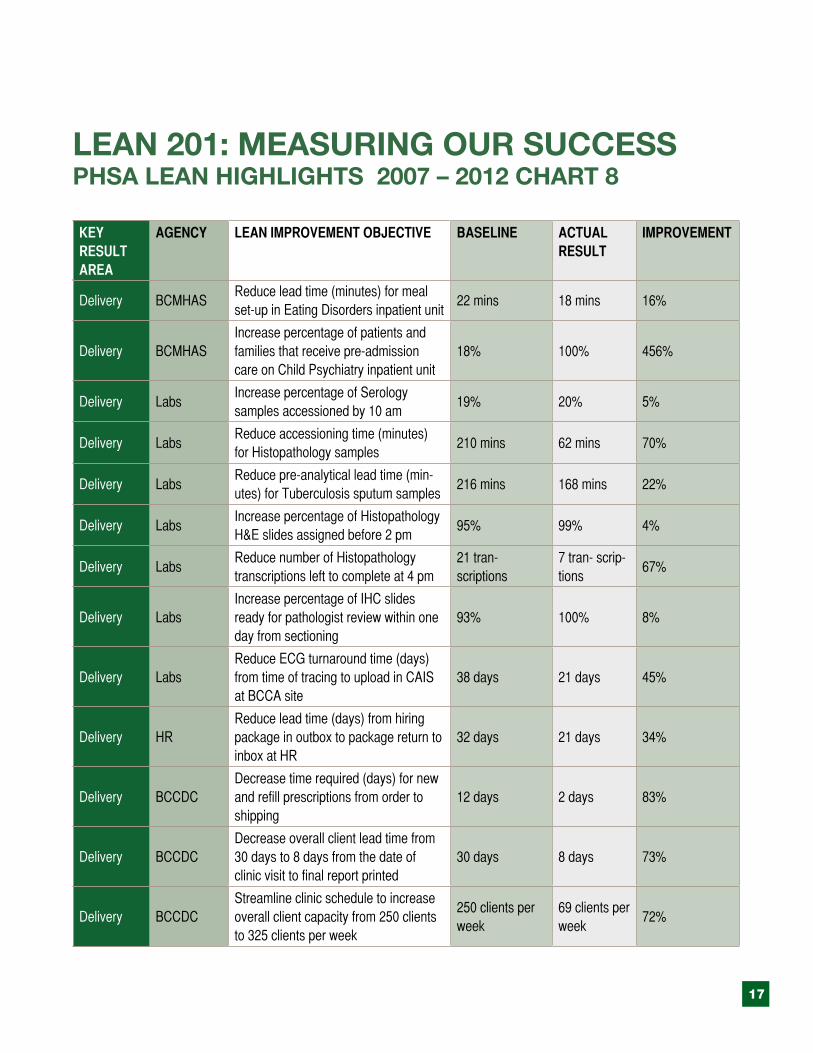
LEAN 201: mEASuRING OuR SuCCESSPHSA LEAN HIGHLIGHTS 2007 – 2012 CHART 8
Delivery BCMHASReduce lead time (minutes) for meal set-up in Eating Disorders inpatient unit
22 mins 18 mins 16%
Delivery BCMHASIncrease percentage of patients and families that receive pre-admission care on Child Psychiatry inpatient unit
18% 100% 456%
Delivery LabsIncrease percentage of Serology samples accessioned by 10 am
19% 20% 5%
Delivery LabsReduce accessioning time (minutes) for Histopathology samples
210 mins 62 mins 70%
Delivery LabsReduce pre-analytical lead time (min-utes) for Tuberculosis sputum samples
216 mins 168 mins 22%
Delivery LabsIncrease percentage of Histopathology H&E slides assigned before 2 pm
95% 99% 4%
Delivery LabsReduce number of Histopathology transcriptions left to complete at 4 pm
21 tran- scriptions
7 tran- scrip-tions
67%
Delivery LabsIncrease percentage of IHC slides ready for pathologist review within one day from sectioning
93% 100% 8%
Delivery LabsReduce ECG turnaround time (days) from time of tracing to upload in CAIS at BCCA site
38 days 21 days 45%
Delivery HRReduce lead time (days) from hiring package in outbox to package return to inbox at HR
32 days 21 days 34%
Delivery BCCDCDecrease time required (days) for new and refill prescriptions from order to shipping
12 days 2 days 83%
Delivery BCCDCDecrease overall client lead time from 30 days to 8 days from the date of clinic visit to final report printed
30 days 8 days 73%
Delivery BCCDCStreamline clinic schedule to increase overall client capacity from 250 clients to 325 clients per week
250 clients per week
69 clients per week
72%
Key Result AReA
Agency leAn ImpRovement objectIve bAselIne ActuAl Result
ImpRovement

18
LEAN 201: mEASuRING OuR SuCCESSPHSA LEAN HIGHLIGHTS 2007 – 2012 CHART 9
Delivery BCCDCDecrease Pharmacy processing time for dispensing TB Field Operations medication from 3 days to 1 day
3 days 1 day 67%
Delivery BCCDCIncrease percentage of reports accu-rately completed and returned on time
75% 95% 27%
Delivery BCCDCIncrease Tuberculosis Clinic capacity from 300 clients per day to 325 clients per day
300 clients per day
325 clients per day
8%
Delivery BCCDCReduce number of unknown Tubercu-losis patients arriving at TB Clinic from VGH from 2 per week to 0
2 patients per week
0 patients per week
100%
Cost BCCHDecrease percentage of direct pur-chase items ordered by OR staff instead of Supply Chain
30% 4% 87%
Cost BCCHReduce percentage of overstocked locations within the OR Core
51% 16% 69%
Cost BCWHReduce set-up time to increase capac-ity for one additional surgery per day from 24 minutes to 20
20 mins 17 mins 15%
Cost BCWHReduce number of interruptions per hour in Oak Tree Clinic
9 interruptions0 interrup-tions
100%
Cost BCWHReduce number of Unit Clerk trips to the bedside to deliver lab results from 70 to 24 per day shift.
70 trips per day shift
17 trips per day shift
76%
Cost BCWHReduce lead time for Neonatal ICU patient Ward Rounds from 180 minutes to 150 minutes
180 mins 86 mins 52%
Cost BCWH
Reduce Sonographer cycle time (from patient chart pick-up to patient dis-charge) from 58 to 40 minutes in DAP Ultrasound
58 mins 21 mins 64%
Key Result AReA
Agency leAn ImpRovement objectIve bAselIne ActuAl Result
ImpRovement

19
LEAN 201: mEASuRING OuR SuCCESSPHSA LEAN HIGHLIGHTS 2007 – 2012 CHART 10
Cost LabsDecrease lead time (minutes) from Serology sample open and match to build to batch
240 mins 20 mins 92%
Cost HISReduce number of loose filing pieces per day produced by Balsam Unit
3 pieces per day0 pieces per day
100%
Cost HISImprove accuracy of Winrecs (da-tabase) to decrease search time for charts by HIS staff
69% 85% 23%
Cost HISDecrease number of charts per day left in Return Cart at 8 am by Neurology Clinic from 10 charts to 0
10 charts per day
2 charts per day
80%
Cost HISReduce pieces of loose filing per day filed by HIS Clerks
14 pieces per day
0 pieces per day
100%
Cost BCCDCIncrease number of IGRA blood tests collected in Vancouver TB Clinic from 5 to 25 per week without adding staff
5 blood tests per week
22 blood tests per week
340%
Key Result AReA
Agency leAn ImpRovement objectIve bAselIne ActuAl Result
ImpRovement
20
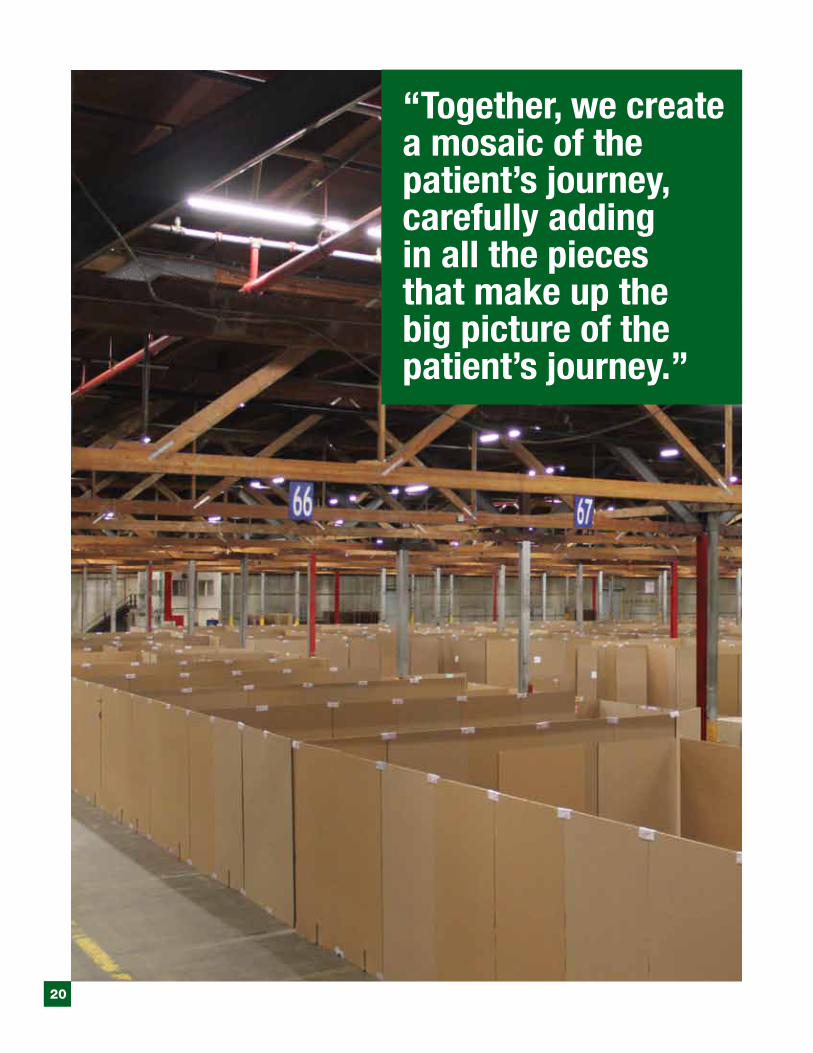
“Together, we create a mosaic of the patient’s journey, carefully adding in all the pieces that make up the big picture of the patient’s journey.”

PHSA is also learning to apply Lean to facilities design with the site redevelopment of BC Children’s and BC Women’s Hospitals. This is the first health care organization in Canada to take on this approach to a major capital project.
Instead of the traditional approach to building design that has architects create concepts and renderings based on our assumptions at the outset of the project, we are using Lean principles and tools to assess our current state and reinvent our services. This new concept is a fiscally responsible use of tax dollars in that operating costs are 30 times higher than capital costs. Once a facility is built, 80% of the workflow is set and unlikely to be changed in the future.
The first of these tools is the “3P” workshop (production, preparation, process) that identifies ideal, efficient and waste free flows for our patients and their families, providers and staff, medications, supplies, equipment, and information.
The second is “Integrated Facility Design” (IFD). Using a massive, 140,000 square foot warehouse space, staff and patient representatives test several patient care scenarios and provider flows using full-floor mock-ups of the acute care centre. Spaces are created using eight-foot high cardboard walls which help teams better understand the physical space and bring two-dimensional drawings to life. Hands-on exercises allow event participants to rapidly lay out physical spaces, eliminate barriers and make adjustments to flows with the goal of continually improving the patient care experience. The new facility is scheduled for completion in 2017.
MoVing ForWard
As a learning organization, PHSA is committed to imPROVE /Lean as an innovative way to strive for and achieve organizational excellence in keeping with our values. Adopting this long-term, core management strategy requires both education
and a cultural shift that takes place year over year. We are moving toward adopting a formal Lean Management System (LMS). Our goal is to promote a culture where people are empowered as problem-solvers, working within teams with managers as on-site coaches, so we have added a coaching component as a co-requisite to Lean Leader Certification.
Components of LMS include “strategy deployment” to focus business goals and breakthrough objectives for improvements to care by ensuring they are actionable and understandable by all levels of staff; “cross functional management” for moving priorities horizontally across PHSA and encouraging systems-thinking; and “daily management,” to shift operations from fire fighting, to a systematic, fact-based, goal oriented style of leadership that works with staff to manage, sustain, and improve daily operational performance.
In doing so, we empower health care professionals to become increasingly patient-centric while driving waste from the system and making the best use of our scarce resources.
LEAN 301: FOSTERING INNOvATION IN BC
seven Flows of Medicine• flow of patient• flow of providers• materials• flow of information• flow of equipment• flow of process
engineering• flow of nutrition
21