lean manufacturing: context, practice bundles, and …assets.csom.umn.edu/assets/101192.pdf · 2...
TRANSCRIPT

Lean Manufacturing: Context, Practice Bundles, and Performance
Rachna Shah Carlson School of Management
University of Minnesota Minneapolis, MN 55455
E-mail: [email protected]
Peter T. Ward* Fisher College of Business The Ohio State University
Columbus, OH 43221 (614) 292-5294
E-mail: [email protected]
*corresponding author
August 2002
Copyright©2002
1
Lean Manufacturing: Context, Practice Bundles, and Performance
Abstract:
Management literature has suggested that contextual factors may present strong inertial forces within organizations that inhibit implementations that appear technically rational (Nelson and Winter, 1982). This paper examines the effects of three contextual factors, plant size, plant age and unionization status, on the likelihood of implementing twenty-two manufacturing practices that are key facets of lean production systems. Further, we postulate four “bundles” of interrelated and internally consistent practices; these are Just-in-Time, Total Quality Management, Total Preventive Maintenance, and Human Resource Management. We empirically validate our bundles and investigate their effects on operational performance. The study sample uses data from IndustryWeek’s Census of Manufacturers. The evidence provides strong support for the influence of plant size on lean implementation, whereas the influence of unionization and plant age is less pervasive than conventional wisdom suggests. The results also indicate that lean bundles contribute substantially to the operating performance of plants, and explain about 23 percent of the variation in operational performance after accounting for the effects of industry and contextual factors. Keywords: contextual factors, lean manufacturing practices, lean bundles, operational performance.

2
Lean Manufacturing: Context, Practice Bundles, and Performance
1. Introduction
Heightened challenges from global competitors during the past two decades have
prompted many US manufacturing firms to adopt new manufacturing approaches (Hall,
1987; Meredith and McTavish, 1992). Particularly salient among these is the concept of
lean production (Womack and Jones, 1996, Womack, Jones, and Roos, 1990). Lean
production is a multi-dimensional approach that encompasses a wide variety of
management practices, including just in time, quality systems, work teams, cellular
manufacturing, supplier management, etc. in an integrated system. The core thrust of lean
production is that these practices can work synergistically to create a streamlined, high
quality system that produces finished products at the pace of customer demand with little
or no waste. Anecdotal evidence suggests that several organizational factors may enable
or inhibit the implementation of lean practices among manufacturing plants. With the
notable exception of White et al., (1999), there is relatively little published empirical
evidence about the implementation of lean practices and the factors that may influence
implementation.
A majority of articles on the topic of lean production system focus on the
relationship between implementation of lean and performance. While most of these
studies have focused on a single aspect of lean and its performance implications (e.g.
Hackman and Wageman, 1995; Samson and Terziovski, 1995; McKone et al., 2001), a
few studies have explored the implementation and performance relationship with two
aspects of lean (e.g. Flynn et al., 1995; McKone et al., 2001). Even fewer studies have
Deleted: construct

3
investigated the simultaneous synergistic effects of multiple aspects of lean
implementation and performance implication. A noteworthy exception is Cua et al.’s,
(2001) investigation of implementation of practices related to Just-in-Time (JIT), Total
Quality Management (TQM), and Total Preventive Maintenance (TPM) programs and
their impact on operational performance. However, conceptual research continues to
stress the importance of empirically examining the effect of multiple dimensions of lean
production programs simultaneously.
We examine the relationship between contextual factors and extent of
implementation of a number of manufacturing practices that are key facets of lean
systems. These contextual factors have been suggested as possible impediments to
implementing lean production systems. Specifically, we focus on three contextual
factors, plant size, plant age, and extent of unionization. Further, we extend Osterman
(1994) and MacDuffie’s (1995) notion of “bundles” from human resource practices to a
larger set of manufacturing practices. Specifically, we postulate four “bundles” of
interrelated and internally consistent practices; these are Just-in-Time (JIT), Total Quality
Management (TQM), Total Preventive Maintenance (TPM), and Human Resource
Management (HRM). We empirically validate our bundles and further investigate their
simultaneous and synergistic effects on operational performance.
2. Literature and Propositions
2.1 Lean practices and lean bundles
In the last several years, scholarly journals have published a number of articles
that focus on the content of lean production or comprise of case studies that concentrate

4
on individual firm experiences. A review of this literature reveals a number of
manufacturing practices that are commonly associated with lean production. Table 1
summarizes our review by cross listing key practices identified with references.
Table 1 about here
Table 1 links substantive literature on high performance, lean manufacturing with
each of the lean practices addressed in our research. As can be seen, there is varying
degree of frequency that each of the items selected is considered in the studies reviewed.
JIT/Continuous flow production and quick changeover methods are included most
frequently, while safety improvement methods are referenced least frequently in the
literature. The practices shown in Table 1 emerge from a fairly extensive literature
review and provide a representative view of the components comprising lean production.
Our discussion and measurement of lean production is necessarily related to the
manufacturing practices that are commonly observed in the literature describing high
performance, lean manufacturers. This literature is also rich with descriptions of values
and philosophy associated with lean production that are less readily measured than
practices. For example, lean production philosophy focuses on avoiding seven cardinal
wastes and on respecting customers, employees and suppliers (Schonberger, 1986).
Although we do not directly address such philosophical positions, we recognize that they
are important and believe that they are reflected in the implementation of the lean
practices that we do address.

5
There are multiple ways to combine the individual practices to represent the
multi-dimensional nature of lean manufacturing. In combining these practices, the
researcher has to contend with the method used to combine and the actual content of the
combinations. The dominant method in operations management literature has been to use
exploratory or confirmatory factor analysis to combine individual practices in a
multiplicative function to form orthogonal and unidimensional factors (Flynn et al., 1995;
Cua et al., 2001). A review of research from organization theory, and labor and human
resource management shows less reliance on factor analysis and offers multiple ways for
combining individual practices and creating an index. One such method is the additive
index used by Osterman (1994) and MacDuffie (1995) in developing “bundles” of inter-
related human-resource management practices. We used the additive index method for
developing our lean bundles.
There is general agreement within operations management literature that Just In
Time (JIT), Total Preventive Maintenance (TPM), Total Quality Management (TQM),
and Human Resource Management (HRM) are conceptually, theoretically, and
empirically well established (Ahire et al., 1996, Samson and Terziovski, 1999, Davy,
1992; Cua, 2000; Flynn et al., 1994; Flynn et al., 1995; McKone and Weiss, 1999;
McKone et al., 1999; McLachlin, 1997; Sakakibara et al., 1997; Schroeder and Flynn,
2001, Osterman, 1994; Pil and MacDuffie, 1996; Ichniowski et al., 1994). We selected
inter-related practices to combine into four practice bundles associated with JIT, TPM,
TQM and HRM.
We use individual practices to investigate the association between contextual
factors and the pattern of implementation because we are interested in the pattern of

6
implementation among the twenty-two manufacturing practices. We use the four bundles
in examining the relationship between implementation and operational performance
because we are interested in evaluating the synergistic effects of implementation of all
complementary facets of lean.
2.2. Implementation and Contextual Variables
In general, the success of implementation of any particular management practice
frequently depends upon organizational characteristics, and not all organizations can or
should implement the same set of practices (Galbraith, 1977). Consideration of
organizational contexts has been noticeably lacking in research on implementation of JIT
and TQM programs or other lean manufacturing practices. Perhaps because of the failure
to consider organizational context, evidence on the impact of JIT and TQM programs on
organizational performance has been mixed (Adam Jr., 1994; Powell, 1995; Samson and
Terziovski, 1999).
In this study, we examine three organizational context characteristics –
unionization, plant age and plant size – that may influence the implementation of
manufacturing practices. A limited number of empirical studies suggest that
implementation or adoption of a manufacturing practice is contingent upon specific
organizational characteristics (White et al., 1999; McKone et al., 1999). For example,
White et al. (1999) found significant evidence that large US manufacturers adopted JIT
practices more frequently than small manufacturers. While the role of plant size in
implementation process has been studied previously, plant age and unionization status
7
remains comparatively unexplored. There is not only a lack of empirical attention given
to contextual factors’ relationship with lean practices, but there is also a paucity of theory
to guide our expectations about the direction of possible effects. Because of the
exploratory nature of this research, we develop a set of propositions rather than formal
hypotheses.
Unionization: It is often assumed that because implementation of most manufacturing
practices requires negotiating changes in work organization, unionized facilities will
resist adopting lean practices and thus lag behind non-unionized facilities. Drucker
(1987) discussed the problems of existing union work rules and job classifications in the
implementation of JIT systems. In a similar vein, the business press has often asserted
that unionization prevents the adoption of some “Japanese” manufacturing practices in
US manufacturers. Further, there are also instances in which unions have been
cooperative and helpful in the implementation process (Katz, 1985; Cappelli and Sherer,
1989).
While there is some evidence that unionization is negatively associated with
organizational performance (Machin, 1995; Meador and Walters, 1994; Bronars, Deere
and Tracy, 1994), empirical evidence linking unionization with adoption and
implementation of manufacturing practices is scant. For instance, Ahmed et al., (1991)
found that in a sample of 177 manufacturing firms, union’s attitude towards flexibility
was not significantly related to JIT usage. In the investigation of influence of unions on
human resource management practices, Ng and Maki (1994) concluded that the impact of
union varies, depending upon the nature of the practice. In manufacturing firms,
8
Osterman (1994) found no empirical support for association between unionization and
four innovative work practices. Unionization seems to be an important factor for
implementation although the direction is not exactly clear. In addition, it hasn’t been
empirically investigated in association with a wider set of lean manufacturing practices.
Thus, the net effect is an empirical question, which we propose to test as follows:
Proposition 1: Unionized plants are less likely to implement lean manufacturing
practices than non- unionized or partially unionized plants.
Age of the plant: Plant age may imply either a tendency toward resistance to change or a
liability of newness. The “resistance to change” view is supported by the organizational
sociology literature which suggests that the age of an establishment should inversely
influence the rate of adoption of innovations, because organizational forms tend to be
“frozen” at birth (Stinchcombe, 1965). Evolutionary economics provides additional
support for this view (Aldrich, 1979; Nelson and Winter, 1982). The evolutionary
perspective suggests that organizations develop a set of organizational routines
(manufacturing practices) over a period of time and these practices change infrequently.
Further, the longer an organization has experience with the practices, even if the results
are inferior relative to the new practices, the harder it is for the organization to replace the
older, inferior practices (Pil and MacDuffie, 1996). So, an older organization finds
implementing new practice(s) more challenging. Organizational ecologists espouse the
same view as “liability of newness.” This perspective suggests that older organizations
have an advantage over younger ones because it is easier to continue existing routines
9
than to create or borrow new ones, even if the new routines are inherently superior.
(Nelson and Winter, 1982; Hannan and Freeman, 1984).
Thus irrespective of the theoretical perspective, plant age is found to impede
adoption and implementation of new, innovative work practices. However, empirical
evidence from industrial and labor relation literature indicates that age of an
establishment is not a significant determinant of adoption of work practices. Specifically,
Osterman (1994) using data from 694 US manufacturing establishments found that age
was not associated with the adoption of innovative work practices such as teams, job-
rotation, quality circles, and total quality management. Osterman (1994) study was
limited to innovative work practices related to human resource management.
We study a wider set of manufacturing practices related not only to human
resources but also workflow in production, preventive maintenance and quality
management programs. In this regard, anecdotal evidence suggests that newer plants
have a natural advantage in implementing new lean practices because of a younger,
arguably less cynical workforce and also because of fewer physical barriers to lean
practices such as set up time reduction. This implies that plant age has a negative impact
on the likelihood of implementation of lean manufacturing practices. Thus, we propose
the following with regards to age of the plant:
Proposition 2: Older plants are less likely to implement lean manufacturing practices
than newer plants.

10
Size of the Plant: Several authors (e.g. Chandler, 1962; Child, 1972) have noted that
since any administrative task tends to be more complicated in large firms, managers may
not even attempt to change, instead they may allow existing systems to linger. This is
equally true of implementation of new operational practices. That is, large organizations
suffer from structural inertial forces (Hannan and Freeman, 1984) that negatively effect
the implementation of lean manufacturing practices. Further, inertial effects of size are
more prevalent in manufacturing industry than in service industry (Gopalakrishnan and
Damanpour, 1997). However, large size also implies the availability of both capital and
human resources that facilitate adoption and implementation of lean practices as well as
returns to scale for investments associated with lean practices. The influence of size is
pervasive and has been identified in relation to technology practices (Germain et al.,
1994) and manufacturing practices (White et al., 1999), across industries as diverse as
hospitals (Moch, 1976), education (Baldrige and Burnham, 1975), as well as
manufacturing (Ahmed et al., 1991). Thus, while theoretical arguments can be made
both in support of a positive and a negative association between large size and
implementation of lean practices, empirical evidence overwhelmingly supports a positive
relationship. That is, despite the inertial effects, large firms are more likely to implement
lean practices than their smaller counterparts. So, we propose the following with regard
to firm size and implementation:
Proposition 3: Large manufacturers are more likely to implement lean practices than
small manufacturers.

11
Each of these issues has the same underlying theme – strong inertial forces within
organizations that prevent even implementations that appear technically rational from
manifesting themselves in practice (Nelson and Winter, 1982) balanced against a
competitive imperative of continuous improvement. Thus, organizational context may
significantly impact the implementation of lean manufacturing practices.
2.3. Bundles of Lean manufacturing practices and Operational Performance.
Lean practices are generally shown to be associated with high performance in a
number of studies of world-class manufacturing (e.g., Sakakibara et al., 1997; Giffi et al.,
1990). Overall, review of related research indicates that implementation of lean practices
is frequently associated with improvements in operational performance measures. The
most commonly cited benefits related to lean practices are improvement in labor
productivity and quality, along with reduction in customer lead time, cycle time, and
manufacturing costs (Schonberger, 1982; White et al., 1999).
Most of the empirical studies focusing on the impact of lean implementation on
operational performance are constrained to one or two facets of lean, often JIT or TQM.
Improved operational performance associated with JIT practices (Koufteros et al. 1998;
Sakakibara et al., 1997; Im and Lee, 1989; White et al., 1999) has been shown to
outweigh the results associated with TQM practices (Samson and Terziovski, 1999;
Powell, 1995). In a study of JIT and TQM, Flynn et al., (1995) found incremental
performance effects attributed to JIT and infra-structural practices common to both JIT
and TQM, but not specific TQM practices. In case of TQM practices by themselves,
while Choi and Eboch (1998), and Samson and Terziovski (1999) found a significant

12
direct impact of TQM practices on operational performance, Adam Jr., (1994) and Powell
(1995) found little impact of TQM practices on operational and other measures of
performance. Powell (1995) found positive support for only 3 out of 12 TQM practices
that he studied.
Despite variable evidence regarding performance improvements related to these
lean practices, relatively little empirical research exists to gauge the extent of
performance improvements. Further, an empirical investigation of simultaneous use of
several manufacturing programs representing multiple facets of lean is also lacking in the
literature. We seek to address this apparent gap in literature by examining the
performance implications of implementing lean practices after controlling for the effects
assigned to industry differences and the contextual factors.
Many researchers argue that a lean production system is an integrated
manufacturing system requiring implementation of a diverse set of manufacturing
practices (e.g. Womack and Jones, 1996). Further, they also suggest that concurrent
application of these various practices should result in higher operational performance
because the practices, although diverse, are complementary and inter-related to each
other. For instance, reduction in work-in-process inventory goes hand in hand with
development of human resource capability in the form of empowered/self-directed work
teams capable of solving problems. Thus, the problem solving capabilities that arise as a
result of empowered work teams can help boost performance by identifying root causes
of quality problems, by helping to improve workflow, and by improving equipment
efficiency. Thus, we posit that simultaneous application of multiple aspects of lean
manufacturing will have a significant positive impact on operational performance:

13
Proposition 4: Implementation of lean bundles, each representing groups of related lean
practices, will have a positive impact on operational performance.
3. Methods
3.1. Instrument Development and Data Collection
Penton Media Inc., publishers of IndustryWeek and other manufacturing related
publications, conduct an annual survey of manufacturing managers and made their 1999
data available to the authors. IndustryWeek (IW) is an industrial magazine targeted at
executives and managers of U.S. manufacturing firms. Penton Media Inc. and
PricewaterhouseCoopers jointly developed a mail survey with input from a number of
manufacturing experts external to both firms. The survey included four pages of
questions related to human resource management, quality issues, customer and supplier
relations, and technology.
The study sample consists of approximately 28,000 subscribers to Penton Media
Inc.’s manufacturing-related publications, and includes managers of plants belonging to
manufacturing firms. Survey recipients hold titles such as plant manager, plant leader,
and manufacturing manager. The unit of analysis in the present study is the
manufacturing plant and the respondents characterize activities with suppliers and
customers from that perspective. Each individual in the sample was sent a letter
describing the survey, a survey form, a business reply envelope, and a separate
participation card to ensure anonymity of responses. The questionnaires were mailed in
mid-April 1999 and completed questionnaires were accepted through early June 1999. A

14
total of 1757 completed surveys were received corresponding to a response rate of
approximately 6.7 percent. While the response rate is smaller than many empirical
studies, it compares favorably with large sample operations surveys (e.g. Roth and van
der Velde, 1991, Stock et al., 2000). In light of the low response rate, non-response bias
was assessed by comparing the proportion of respondent firms to proportion of total
mailed surveys for each SIC code. The data indicate no significant difference (χ2 = 12.3,
df = 19, p = .83).
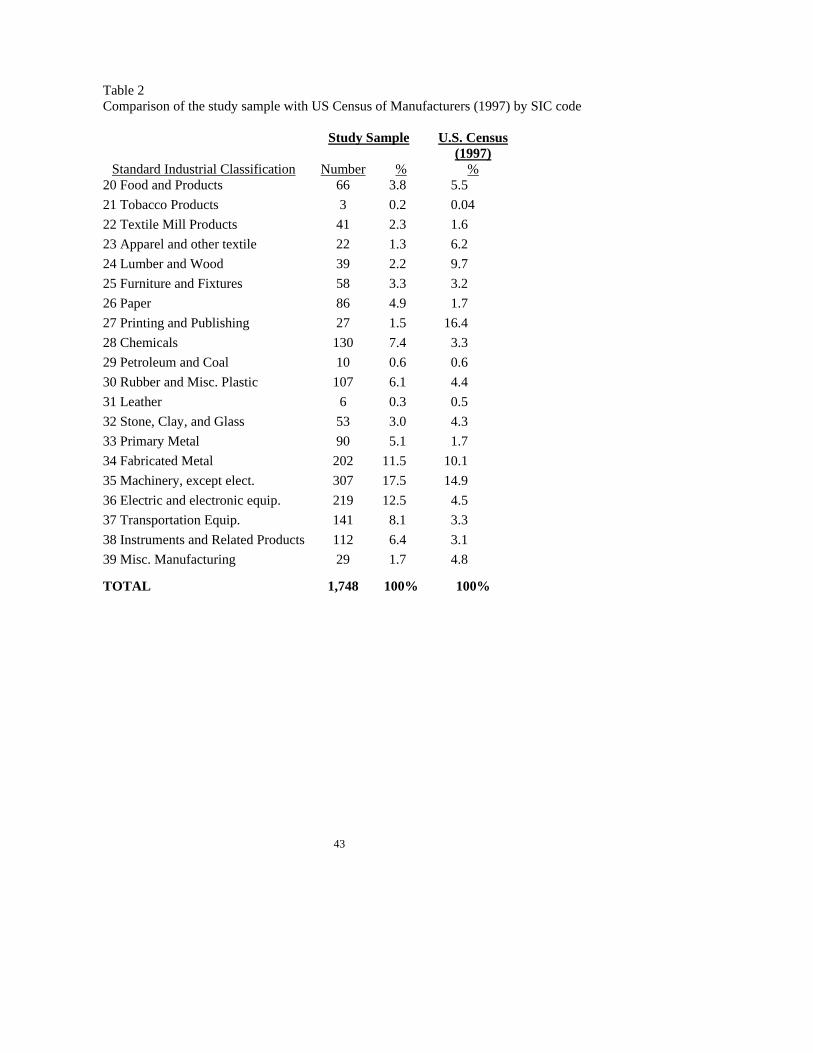
3.1.1. Sample Characteristics: The sample resembles the population profile reported by
US Census of Manufacturers (1997) and is not unlike those for similar studies of US
manufacturers (e.g. Im and Lee, 1989; White et al., 1999). A comparison of the number
of establishments in the IW sample with the population profile reported by US Census of
Manufacturers (1997) is shown in Table 2. The comparison indicates that compared to
the population as a whole, the IW sample is somewhat biased in favor of paper,
chemicals, primary metal, electric and electronic equipment and transportation
equipment. Despite the differences from the US population’s industry composition, the
sample provides diverse and fairly representative industrial coverage. Survey items
appear in appendix A.
Table 2 about here
The manufacturers included in the sample represent a wide variety of industries.
Although implementing lean practices is usually associated primarily with discrete part

15
manufacturers, pervasiveness of practices across the industrial spectrum is unknown. For
this reason, we include respondents from all manufacturing industries (SIC 20 to 39) in
the sample. We report the analysis related to industry effects in our findings. A majority
of plants included in the sample have a non-union production environment (65 percent),
are more than 20 years old (72 percent), and are relatively small in size, having fewer
than 250 employees (52 percent). The sixty-five percent of respondent plants that are not
unionized corresponds to an estimated fifty-nine percent of all manufacturing plants that
are not unionized as reported in the most recent economic census (US census of
manufacturers, 1997). All of the manufacturers included in the sample have implemented
at least one lean practice.
3.1.2. Contextual Variables: Each of the contextual variables is recoded into three
categories. When a union represents none of the plant’s production workforce, we
classify it as “non-unionized” plant, instances of 100 percent unionization are classified
as “unionized” plants, and plants within these two extremes are classified as “partly
unionized” plants. Guidelines for classifying plants on the basis of age are scant.
IndustryWeek suggests categorizing plants less than 10 years old as “new” plants and
more than 20 years old as “old” plants. We use these criteria for our study. In addition,
we classify plants between the age of 10 and 20 years as “adolescent” plants. Size is
recoded into small, medium and large plants. We designate plants with fewer than 250
employees as “small” following Adams and Ponthieu, (1978, pp. 2) and plants with more
than 1000 employees as “large” following White et al (1999) and the plants between 250-
999 as medium sized plants.

16
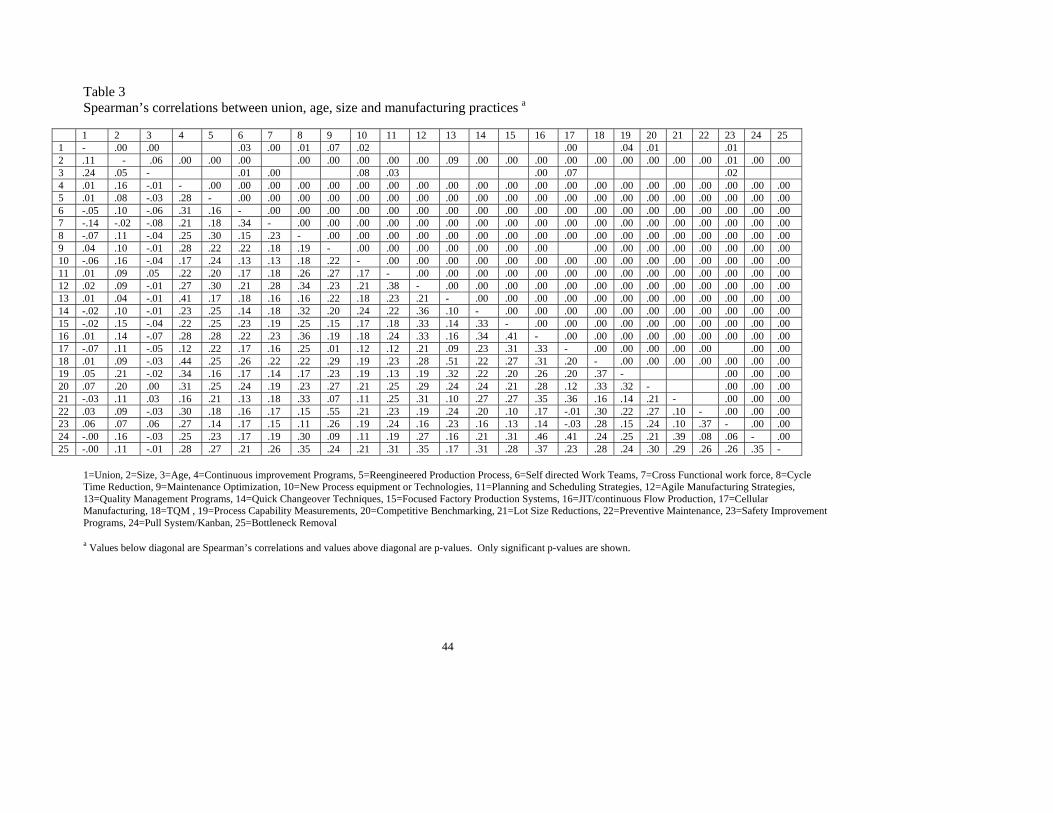
3.1.3. Lean Manufacturing Practices: Lean manufacturing practices are measured on a
three-point scale (1=no implementation; 2=some implementation; 3=extensive
implementation). Scale length has been the focus of considerable discussion in the
survey methods literature. While some research shows that reliability increases with
scale length (Lissitz and Green, 1975; Jenkins and Taber, 1977), there is no clear-cut
relationship between validity and scale length (Smith, 1994; Smith and Peterson, 1985).
Specifically, Morrison (1972) shows that 3-point scales capture most real information
about construct relationships and are thus considered adequate. A correlation matrix for
each of the contextual variables and lean practice included in the analysis is shown in
Table 3.
Table 3 about here
3.1.4. Lean Bundles: The 22 individual lean practices were combined into four lean
bundles. For instance, all practices related to production flow were combined to form the
JIT bundle. The underlying rationale is that JIT is a manufacturing program with the
primary goal of continuously reducing, and ultimately eliminating all forms of waste
(Sugimori et al., 1977). Two major forms of waste are Work-In-Process (WIP) inventory
and unnecessary delays in flow time. Both can be reduced by implementing practices
related to production flow such as lot size reduction, cycle time reduction, quick
changeover techniques to reduce WIP inventory and by implementing cellular layout,

17
reengineering production processes, and bottleneck removal to reduce unnecessary delays
in the production process.
Practices related to continuous improvement and sustainability of quality products
and process were combined to form the TQM bundle. It includes practices such as
quality management programs, formal continuous improvement programs and process
capability measurement capability.
The TPM bundle includes practices primarily designed to maximize equipment
effectiveness through planned predictive and preventive maintenance of the equipment
and using maintenance optimization techniques. More generally, emphasis on
maintenance may also be reflected by the emphasis given to new process equipment or
technology acquisition (Cua et al., 2001).
The HRM bundle has significant theoretical and empirical support. The most
commonly cited practices are job rotation, job design, job enlargement, formal training
programs, cross training programs, work teams, problems solving groups, and employee
involvement (Ichniowski et al., 1994; MacDuffie, 1995; Osterman, 1996). We include
two practices in the HRM bundle – flexible, cross-functional work force, and self-
directed work teams. Flexible, cross-functional work force, and self-directed work teams
are higher-level practices that include many lower level practices. Conceptually, in order
for an organization to have a flexible cross-functional work force, it needs to have a job-
rotation program, it needs to consider job design, and formal, cross functional training
programs have to be in place. Similarly, self-directed work teams require that employees
are organized in work teams and involved in problem solving groups. Boyer and Pagell
(2000) have suggested eliminating lower level variables when these are included in

18
higher-level constructs. Thus, we combine these two practices into HRM bundle to
represent a much wider set of underlying HRM practices.
Each of the bundles was formed by adding the scores for each of the practices
included in the bundle for each responding plant. The bundles were empirically validated
using reliability analysis (Cronbach Coefficient Alpha) and principal components
analysis with varimax rotation. All 22 lean practices were entered for principal
component analysis (PCA). Varimax rotation was used to extract orthogonal factors (see
Table 4) and four factors were extracted. The factors conform almost perfectly to the
conceptual bundles with the sole exception of “competitive benchmarking.”
Competitive benchmarking is conceptually linked to TQM practices and we had included
it in the TQM bundle. The rotated component matrix results indicate that it has a higher
loading on the TPM (.364) factor compared to TQM (.361). However, because the
difference in the loadings is not statistically significant we opted to include it in the TQM
factor.
Table 4 about here
The results were replicated using oblique rotation as a check for orthogonality and
the extracted factors were identical. Further, we checked the unidimensionality of each
of the factors by conducting PCA at the factor level. More specifically, we entered only
the items that load on one factor to ensure that they do indeed load on one factor. All
four factors are unidimensional. Cronbach’s coefficient alpha is above the acceptable
limit except for Human Resource Management Bundle., which is a two item factor. The

19
value of Cronbach alpha depends upon the number of items in the scale and the average
inter-item correlation (Carmines and Zeller, 1979, pp.45). Thus, keeping the average
inter-item correlation constant, as the number of items increase, the value of alpha also
increases. In this instance, if the number of items in the HRM practice bundle were
increased from 2 to 4 while keeping the average inter-item correlation constant at .51, the
Cronbach alpha value will increase to above .79.
3.1.5. Operational Performance: A six-item scale is used to measure the operational
performance of a manufacturing plant. The items include 5-year changes in
manufacturing cycle time, scrap and rework costs, labor productivity, unit manufacturing
costs, first pass yield, and customer lead time. A scale was constructed for operational
performance measure based on principal components analysis of these items and the
factor scores were used as the dependent variable. As shown in Table 5, all six items
load on one factor, with an eigenvalue of 2.37 explaining almost 40 percent of the
variation. Cronbach’s coefficient alpha is 0.69.
Table 5 about here
The construct validity issue of whether operational performance is unidimensional
in a conceptual sense is a separate question from the empirical issue. Two competing and
equally valid conceptual views on performance are the tradeoff view and the production
competence view popularized by Skinner (1978) and Vickery (1991) respectively. We
argue that firms are capable of developing multiple internal competences. Further, global

20
competition requires that firms develop and possess these multiple competences in order
to succeed. Our measure focuses on three underlying aspects that are highly related:
lead-time, cost, and conformance quality. The very basis of JIT is that manufacturing
processes that are faster and more precise with regard to first-time-through quality are
also inherently less costly. Thus, we contend that these six measures are conceptually
and empirically related and represent a single dimension of operational performance.
4. Results
4.1. Context and Implementation of Lean Practices
We use likelihood ratio chi-square test statistic to evaluate the relationship of
association between contextual factors and implementation of lean practices. For
example, for plant size and cellular manufacturing, the 3X3 (small/medium/large size X
no/some/extensive implementation) matrix is decomposed into 3 separate 2X2
component matrices. The likelihood ratios are then compared to evaluate the direction of
the overall association. We first computed a likelihood ratio chi-square statistic for each
of the 22 lean manufacturing practices and each individual contextual factor. The results
are discussed below for each of the contextual factors.
4.1.1. Union Representation.
Of the 22 lean manufacturing practices, six are significantly associated with
unionization. These practices are cellular manufacturing, cross functional work force,
cycle time reduction, maintenance optimization, process capability measurements, and
self directed work teams. The evaluation of 2X2 matrices for each of the six practices
21
indicates that unionization is negatively related to implementation. This suggests that
unionized plants are less likely to implement these six practices. It is interesting to note
that both practices related to managing work force (i.e. cross functional work force and
self directed work teams) are negatively related to unionization. No statistically
significant relationship was found for the other 16 practices. Contrary to popular belief,
the results show that unionization status does not have a significant impact on extensive
implementation of most lean practices. This result is somewhat surprising in light of
conventional wisdom about the difficulty of implementing improvement programs in a
unionized environment. However, the findings do lend support to observations about the
difficulty of changing work force rules in a union environment.
Table 6 about here
4.1.2. Age of Plant
The likelihood ratio chi-square indicates that eight out of the 22 lean practices are
significantly influenced by age of the plant. Five of the eight have a significant negative
association between age of plant and implementation of the practice, implying that old
plants are less likely to implement these practices than newer plants. These five practices
include cross-functional work force, cycle time reduction, JIT / continuous flow
production, maintenance optimization, reengineered production process and self-directed
work teams. Three lean practices, planning and scheduling strategies, safety
improvement programs, and total quality management programs have significant positive
association with age of plant. This implies that old plants are more likely to implement
22
these practices relative to new plants. The results are consistent with the debate in the
literature about “liability of newness” and “liability of obsolescence” (Hannan and
Freeman, 1984; Baum, 1989). No significant relationship was found between plant age
and implementation in 14 other instances. These results indicate that although plant age
has some impact on the implementation of lean practices, the direction of the effect is not
always as predicted.
4.1.3. Size of the Plant
Of the 22 lean practices examined, plant size significantly impacts all but two
practices. No significant relationship was found between size and implementation of two
practices: cross-functional work force, quality management programs. As predicted all
the effected practices have a significant positive association between plant size and
implementation. This suggests that large plants are likely to implement the twenty
practices more extensively compared to small plants. The findings with respect to size
are generally consistent with the findings of White et al (1999).
4.1.4 Evaluation of Propositions 1-3
Likelihood ratio chi-square statistic and the individual 2X2 matrix analyses
provide unambiguous support for proposition 3 that large size has a significant impact in
the implementation of 20 out of 22 lean practices. However, the evidence is not as
apparent for proposition 1 (implementation is negatively related to unionization status)
and for proposition 2 (implementation is negatively related to age of the plant).
Unionized plants are less likely to implement only six of the twenty-two practices
23
compared to non-unionized plants. Otherwise, unionization has no significant effect on
likelihood of implementing any other lean practices. Similarly, proposition 2 suggests
that plant age is negatively associated with implementation. We find mixed support for
it. Our analyses indicate that five of twenty-two lean practices are less likely to be
implemented in older plants. However, three additional practices are found to be
significant but not in the predicted direction.
To show that our findings do not result merely from chance, we calculate the
probability of obtaining our specific results. For instance, large size has a significant
impact on implementation 20 out of 22 times. Thus, we wish to calculate the probability
of twenty significant results by calculating the probability of 20 Type I errors, assuming
there is no size effect. A general Ho can be stated as:
Ho: Organizational context has no impact on implementation status of a lean
practice.
We use a binomial probability distribution and calculate p(x), the probability of
“x” (number of) Type I errors for each of the contextual variables. The probability of
getting 20 significant results by chance [p(20) Type I errors] is almost zero. Thus, we
can say with nearly complete confidence that large size makes a significant impact on
implementation status of lean practices. Similarly, six lean practices were more likely to
be implemented by non-unionized facilities. The probability of getting six significant
results by chance [p(6) Type I errors] is almost 0.00008. Impact of plant age can be
evaluated by examining the results of a trinomial distribution. Because five lean

24
practices are more likely to be implemented by newer plants, we look at the probability of
obtaining these results by chance. The probability of getting five significant results by
chance [p(5) Type I errors] is almost 0.00003 while the probability of obtaining three
significant results is 0.006, indicating that one can be slightly more than 99 percent
certain that plant age influences implementation of lean practices.
4.2. Context, Lean Bundles, and Performance
A hierarchical regression model is used to test the incremental effect of the lean
practices on operational performance (Cohen and Cohen, 1975; Boyer et al., 1997). We
use this technique to assess the incremental effects of lean bundles by controlling for the
effects of industry, production process type, and organizational context. Operational
performance is the dependent variable in each of the regression models.
First, 19 dummies for 2 digit SIC codes are entered as the regressor into the
regression model to represent 20 industries present in the dataset. Various authors have
noted the effect of industry on performance (Mauri and Michaels, 1998; McGahan and
Porter, 1997; Dess, Ireland and Hitt, 1990). Therefore, this allows us to evaluate the
incremental effect of organizational context and lean manufacturing practice independent
of industry effects. Second, plant size, plant age, and unionization are entered into the
regression model as regressors. This model establishes a baseline to serve as an effective
control for the effects of context on performance. Finally, the factor scores for the four
bundles are entered into the regression equation to establish their direct and incremental
effect on operational performance after industry and context has been considered. We

25
conducted the hierarchical regression analysis using the additive scores for the bundles as
well, with almost identical results.
4.2.1
4.2.2 Hierarchical Regression with Operational Performance as the Dependent
Variable.
Table 7 shows the results of a hierarchical regression with operational
performance as the dependent variable and industry effects, contextual variables, and lean
practices entered in the sequential manner described above. Industry effects account for a
small but significant amount of variance (adjusted R2 = 0.024, p < 0.001). This result is
in conformance with McGahan and Porter (1997), who also found that the industry
effects accounted for a relatively smaller portion of profit variance in manufacturing.
Contextual variables as a group also account for a significant but small amount of
variance (incremental R2 = 0.006, p < 0.051), and plant age is found to have a significant
negative impact on operational performance.
The inclusion of bundles representing lean practices (model 3) results in a change
in R2 of 0.231, which is significant (p < 0.000). Overall, the model explains 27.7 percent
of the variance in operational performance, with an associated significance at p < 0.000
as indicated by the p-value of the F test statistic. We also ran a fourth model, not shown,
that included all 2- way interactions between all pairs of contextual variables and lean
bundles. These interaction terms were not significant.
Table 7 about here

26
4.2.2 Evaluation of Proposition 4
The analysis suggests that proposition 4, that lean bundles are associated with
higher performance, is supported. Each of the four bundles is positively associated with
operational performance. As a group, they explain about 23 percent of the variation in
operational performance even after accounting for the effects of industry and
organizational context. The signs of all significant coefficients are positive, as expected.
This provides support for the synergistic effects of implementing practices representing
multiple aspects of lean manufacturing.
We also find no effect from unionization on performance after accounting for the
effects of industry. This means that being unionized is unrelated to achieving superior
values on the cost, time and quality measures that constitute operational performance.
Plant age, on the other hand is negatively associated with operational performance, so
that older plants do appear to be at a performance disadvantage.
We find that in model 3 (all variables included), plant size is negatively associated
with operational performance. The size coefficient was not significant in model 2 (lean
bundles not included). There is no evidence that size is collinear with other regressors.
This finding indicates that large size does not translate into an advantage in operational
performance and when the effects of lean bundles are considered, large size is actually a
disadvantage with respect to operational performance.
Tolerance values, which are used to indicate the degree of multicollinearity, can
range from zero to one with values near one indicating the presence of a high degree of
collinearity. The tolerance values of the contextual factors with lean bundles in the
27
model range from 0.833 to 0.907 indicating that some degree of multicollinearity affects
these variables. To assess if multicollinearity between variables could cause potential
problems in attributing performance effects to individual regressors, we calculated
Variance Inflation Factors (VIF) for all coefficients (26 in all) in the regression equation
for Model 3 to determine the existence of multicollinearity. Some experts in the field
suggest that values below five indicate that multicollinearity problems do not affect the
coefficient (Freund and Littell, 1986; Neter, Wasserman, & Kutner, 1990). VIF for four
coefficients, Dummy34, Dummy35, Dummy36, and Dummy37 (fabricated metal,
machinery, electronics, and transportation equipment) exceeded the value of five, and
VIF for all other coefficients was found to be below five. Thus, the overall regression
model allows us to attribute performance effects to individual variables except for the
four industry dummies noted above.
4.3 The effect of industry
The popular roots of lean manufacturing lie in the Toyota Production System and
its many imitators in discrete part manufacturers around the world. However, lean
practices clearly exist in every industry at least, in isolated pockets (Womack and Jones,
1996). The question of the extent of implementation of lean practices across industries
has not been explored empirically. The question is salient in this research because it
would not be productive to investigate industries where lean practices are not
implemented or are only implemented to a limited extent.
We address the issue of extent of implementation of lean practices across
industries by selecting two sets of industries, one that is representative of discrete

28
manufacturing and the other that is largely process manufacturing. We then compare
mean values of each of the four lean bundles for the two industry groups. Results of the
comparison are reported in Table 8.
Table 8 about here
Significant differences between process and discrete industries are found in two
of the four bundles. As might be expected, plants in discrete industries are more likely to
implement JIT than those in the process industries where kanbans and small production
lots are hard to imagine. Interestingly, TPM practices are more likely to be implemented
by plants in process industries than in discrete industries. The mean values of TPM
bundle between discrete and process industry are almost a perfect mirror image of mean
values of JIT bundle. This finding makes sense when one considers the high degree of
importance placed on capacity utilization in process industries (Hayes and Wheelwright,
1984). The remaining two bundles, TQM and HRM, present no significant differences
between discrete and process industries.
Our conclusion is that bundles of lean practices are implemented across the
industrial landscape. JIT practices are implemented more commonly in discrete
industries but are fairly commonly implemented in process industries as well. The
opposite relationship exists between TPM and industry type. TQM and HRM are
implemented to about the same extent across both discrete and process manufacturing.
These findings suggest that lean practices are prevalent in all industries and that studies
29
of lean manufacturing need not be restricted to industries associated with discrete part
manufacturing.
5. Conclusion
This research suggests two major findings. First, organizational context, i.e.,
plant size, unionization and plant age, matters with regard to implementation of lean
practices, although not all aspects matter to the same extent. Second, applying
synergistic bundles of lean practices concurrently appears to make a substantial
contribution to operational performance over and above the small but significant effects
of context. We discuss each of these findings in turn.
5.1 The Importance of Context
Each of the contextual variables under study is associated with a significant lore
about their impact on the ability of manufacturers to implement various lean
manufacturing practices. The conventional wisdom associated with unionization is that it
is encumbering; that progress toward lean production is very difficult in the presence of
unionized work force. Our findings do not bear out this contention. In fact, for 16 out of
22 lean practices there was no significant difference in the likelihood of implementation
between union and non-union plants. However, the six practices that unionized plants are
less likely to implement include “cross-functional workforce,” a particularly thorny issue
for plants with inflexible work rules imposed by collective bargaining agreements.
Although the findings that we report suggest that having a unionized workforce is

30
generally not a good reason for neglecting lean practices, certain practices are observed
less frequently in a union environment.
Similar to the case of unionization, the expectation is that older plants, often
employing older workforces, are more resistant to the changes required to implement lean
practices. Again, the findings do not fully substantiate this contention. Our findings
suggest that older plants are less likely to implement only five practices relative to newer
plants. Included in this list are such important elements of a lean production system as
cross-functional work force, cycle time reduction, JIT / continuous flow production,
maintenance optimization, reengineered production process and self-directed work teams.
However, likelihood of implementation of 14 of the lean practices is unaffected by plant
age, and older plants are actually more likely to implement three practices relative to
newer plants. Thus, the evidence is mixed. The data indicate that plant age is a more
important inhibitor to implementing lean practices than is unionization, but the findings
do not provide much cover for managers of older plants seeking a reason why lean
practices cannot work in their plant. In fact, for many lean practices plant age is just not
a significant factor.
More evidence exists supporting the idea that large plants are more likely to
possess the resources to implement lean practices than smaller plants. These findings are
consistent with the literature (e.g., White et al., 1999). Larger plants are more likely than
smaller plants to extensively implement all but five of the lean practices under study.
Interestingly, no differences in implementation likelihood were found for either cross-
functional workforce or quality management programs. An explanation may be that both
31
of these practices are extremely important to achieving economies in smaller, high mix,
plants and therefore these practices receive high level of attention in smaller plants.
We also find that implementation of lean bundles is ubiquitous across industries
with reasonable high level of implementation of each of the lean bundles occurring in
both process and discrete part industries. Although plants in discrete parts industries are
somewhat more likely to implement JIT and plants in process industries are somewhat
more likely to implement TPM, both types of plants implement both practice bundles.
TQM and HRM bundles were about as likely in process or discrete parts plants.
Overall, the evidence presented here suggests that the organizational context
significantly affects the likelihood of implementing lean practices. In particular, the
influence of plant size appears to be substantial across a wide mix of practices. The
influence of unionization and plant age, however, appear to be less pervasive than
conventional wisdom suggests.
5.2 Lean bundles and operational performance.
The results suggest that implementation of each of the bundles of lean practices
under study contribute substantially to the operating performance of plants. Proponents
of lean production frequently point out that lean practices should be considered together
as a system and that benefits accrue from all of the practices (e.g., Womack and Jones,
1996). Taking this point of view, consider the impact of all four bundles under study.
These bundles explain about 23 percent of the variation in operational performance after
controlling for the effects of industry and accounting for the effects of plant size, plant
age, and unionization. It is also notable that both size and age exert a negative influence

32
on performance when lean bundles are considered. Unionization, on the other hand, has
no such negative influence.
Each of the individual lean practice bundles also contributes to performance (p <
.0001). This means that a separate and identifiable incremental effect can be attributed to
the four major lean practices areas that we have termed lean bundles.
A contribution of this research is that we identify four specific practice bundles
from the literature, we validate the bundles empirically by extracting orthogonal factors
consistent with the literature and we show that all four bundles are significantly related to
performance.
Although the finding that each of the bundles contributes to performance may
seem intuitive, such a result has not been reported previously in the literature. In fact,
Flynn et al. (1995) report that JIT and common infrastructural practices have a positive
effect on performance but that TQM has no significant effect. On the other hand,
McKone et al., (2001) find that JIT, TQM and TPM all contribute to their weighted
performance index.
These findings provide unambiguous evidence that the synergistic effects of all
lean practices are associated with better manufacturing performance. The implication for
managers of plants that are not implementing lean practices is also fairly clear. To not
implement lean bundles is likely to put plants at a performance disadvantage compared to
plants that do implement, regardless of size, age or level of unionization of the plant in
question.
5.3 Limitations and Future Research

33
This research is carried out using secondary data made available by Penton
Publishing. Although the data present a great opportunity, they also present some
limitations. In particular, the low response rate allows the representativeness of the
sample to be called into question despite the large sample size. There are also issues with
self-reported performance data and possible single respondent bias. Despite these
limitations, the data provide a rich picture of the manufacturing practices across many
companies.
Based on the findings reported above, future research related to lean
manufacturing clearly should control for the effects of size and industry. The positive
findings with respect to the impact of context on the implementation of lean practices
suggest that other environmental measures should also be considered in future research.
Specifically, the effects of environmental dynamism, complexity and munificence might
be considered in future research on lean manufacturing in context. Separate industry
level analysis will also provide interesting insights, although lean practices are found in
plants in all industries.
Acknowledgements
The authors would like to thank three anonymous reviewers for thoughtful,
constructive suggestions that greatly improved this paper. We also thank the Center for
Excellence in Manufacturing Management (CEMM) and Fisher College of Business,
both at Ohio State University, for financial support. We are grateful to Penton Media,
publishers of IndustryWeek, for allowing access to their data.

34
Appendix A: Survey items
Contextual variables: How many employees are at this location? (Less than 100; 100-250; 250-499; 500-999; 1,000 or more) How many years has it been since plant start-up? (Less than 5 years; 5-10 years; 11-20 years; More than 20 years) Approximately what percent of plant production workers is represented by a union (s)? (None; 1-25%; 26-50%; 51-75%; 76-99%; 100%) Operational Performance: How has the following changed over the past five years? Finished-product first-pass quality yield (reverse coded): (Improved more than 40%; Improved 21-40%; Improved 1-20%; Stayed the same; Declined 1-20%; Declined more than 20%) Scrap and rework costs: (Increased more than 20%; Increased 1-20%; Stayed the same; Decreased 1-20%; Decreased 21-40%; Decreased more than 40%) Productivity, defined as dollar volume of shipments per employee (reverse coded): (Increased more than 80%; Increased 41-80%; Increased 21-40%; Increased 11-20%; Increased 1-20%; Stayed the same; Decreased 1-10%; Decreased more than 10%) Per unit manufacturing costs, excluding purchased material: (Increased more than 20%; Increased 11-20%; Increased 1-10%; Stayed the same; Decreased 1-20%; Decreased more than 20%) Manufacturing cycle time: (No reduction; Decreased 1-10%; Decreased 11-20%; Decreased 21-50%; Decreased 51-75%; Decreased more than 75%) Customer lead-time: (Increased more than 20%; Increased 1-20%; Stayed the same; Decreased 1-20%; Decreased 21-40%; Decreased more than 40%)
35
References
Adam Jr., E. E., 1994. Alternative quality improvement practices and organization performance. Journal of Operations Management, 12(1), 331-347. Adams, S., Ponthieu, L. D., 1978. Administrative Policy and Strategy: A casebook. 2nd ed. Grid Inc., Columbus, OH. Ahire, S. L., Goldhar, D. Y., Waller, M.A., 1996. Development and validation of TQM implementation constructs. Decision Sciences, 27 (1), 23-56. Ahmed, N U., Tunc, E. A., Montagno, R. V., 1991. A comparative study of US manufacturing firms at various stages of just-in-time implementation. International Journal of Production Research, 29 (4), 787-802. Aldrich, H. 1979. Organizations and environments. Englewood Cliffs, NJ: Prentice Hall. Baldrige, V. A., Burnham, R. A., 1975. Organization Innovation: Individual, Organizational, and Environmental Impacts. Administrative Science Quarterly, 20(2), 165-176. Baum, J. A. C., 1989. Liabilities of newness, adolescence, and obsolescence: The dissolution of organizational relationships and organizations. Proceedings of the Administrative Science Association of Canada, 10 (5), 1 –10. Bicheno, J. R., 1989. Cause and effect of JIT: a pocket guide. Buckingham, U.K: PICSIE Books. Boyer, K.K., Leong, G.K., Ward, P., Krajewski, L., 1997. Unlocking the Potential of Advanced Manufacturing Technologies. Journal of Operations Management, 15 (1), 331-347. Boyer, K.K., Pagell, M., 2000. Measurement issues in empirical research: Improving measures of operations strategy and advanced manufacturing strategy. Journal of Operations Management, 18 (3), 361-374 Bronars, S. G., Deere, D. R., Tracy, J. S., 1994. The effects of unions on firm behavior: An empirical analysis using firm-level data. Industrial Relations, 33 (4), 426-451. Cappelli, P., Scherer, P. D., 1989. Spanning the union/nonunion boundary. Industrial Relations, 28 (2), 188-205. Carmines, E.C., Zeller, R.A. 1979. Reliability and Validity Assessment. Beverly Hills, CA: Sage Publications.
36
Chan, J. S., Samson, D. A., Sohal, A. S., 1990. An integrative model of Japanese manufacturing techniques. International Journal of Operations and Production Management, 10 (9), 37-56. Chandler Jr., A. D., 1962. Strategy and structure: chapters in the history of the industrial enterpise. M.I.T. Press, Cambridge, MA. Child, J., 1972. Organization structure and strategies of control – A replication of the Aston Study. Administrative Science Quarterly, 17 (2), 163-177. Choi, T., Eboch, K., 1998. The TQM Paradox: Relations among TQM practices, plant performance, and customer satisfaction. Journal of Operations Management, 17 (1), 59-75. Cohen J., Cohen P., 1975. Applied Multiple Regression/Correlation Analysis for the Behavioral Sciences. Wiley and Sons, Hillsdale, NJ. Cua, K. O., McKone, K. E., Schroeder, R. G., 2001. Relationships between implementation of TQM, JIT, and TPM and manufacturing performance. Journal of Operations Management, 19 (2), 675-694. Davy, J. A., White, R. E., Merritt, N. J., Gritzmacher, K., 1992. A derivation of the underlying constructs of Just-In-Time management systems. Academy of Management Journal, 35 (3), 653-670. Dess, G. G., Ireland, R. D., Hitt, M. A., 1990. Industry effects and strategic management research. Journal of management, 16(1), 7-27. Drucker, P. F., 1987. Workers hands bound by tradition. Wall Street Journal, Aug. 2, pp. 18. Finch, B. J., Cox, J. F., 1986. An examination of just-in-time management for the small manufacturer with an illustration. International Journal of Production Research, 24 (2), 329-342. Flynn, B. B., Sakakibara, S., Schroeder, R. G., 1995. Relationship between JIT and TQM: Practices and performance. Academy of Management Journal, 38 (5), 1325-1360. Flynn, B. B., Schroeder, R.G., Flynn, E. J., 1999. World Class Manufacturing: an investigation of Hayes and Wheelwright’s Foundation. Journal of Operations Management, 17 (2), 249-269. Flynn, B. B., Schroeder, R. G., Sakakibara, S., 1994. A framework for quality management research and an associated measurement instrument. Journal of Operations Management, 11 (4), 339-366.
37
Freund, R. J., & Littell, R. C. (1986). SAS System for Regression. Cary, NC: SAS Institute Inc. Galbraith, J. R., 1977. Organization Design. Addison Wesley Publishing Company, Phillipines. Germain, R., Droge, C., Daugherty, P. J., 1994. A cost and impact typology of logistics technology and the effects of its adoption on organizational practice. Journal of Business Logistics, 15 (2), 227-248. Giffi, C., Roth, A. V., Seal, G. M., 1990. Competing in world-class manufacturing: America’s 21st century challenge. Business One Irwin, Homewood, IL. Gopalakrishnan, S., Damanpour, F., 1997. A review of Innovation Research in Economics, sociology, and technology management. Omega, 25 (1), 15-28. Hackman, J. R., Wageman, R., 1995. Total Quality Management: empirical, conceptual, and practical issues. Administrative Science Quarterly, 40 (2), 309-342. Hall, R. W., 1987. Attaining manufacturing excellence: just-in-time, total quality, total people involvement. Dow Jones-Irwin, Homewood, IL. Hannan, M. T., Freeman, J., 1984. “Structural inertia and organizational change.” American Sociological Review, 49 (2), 149-164. Hay, E. J. 1988. The just-in-time breakthrough: Implementing the new manufacturing basics. John Wiley, New York. Hayes, R. H., Wheelwright, S. C., 1984. Restoring our competitive edge: Competing through manufacturing. John Wiley, New York. Im, J. H., Lee, S. M, 1989. Implementation of JIT systems in US manufacturing firms. International Journal of Operations and Production Management, 9(1), 5-14. Ichniowski, C., Shaw, K., Prennushi, G., 1994. The effect of Human Resource Management on productivity. Working paper, Columbia University. Jenkins, G.D., Taber, T. D., 1977. A Monte-Carlo study of factors affecting three indices of composite scale reliability. Journal of Applied Psychology, 62 (4), 292-298. Katz, H., 1985. Shifting Gears: Changing labor relations in the U. S. Auto Industry. MIT Press, Cambridge, Mass. Koufteros, X. A., Vonderembse, M. A., Doll, W. J., 1998. Developing measures of time based manufacturing. Journal of Operations Management, 16(1), 21-41.

38
Lee, S. M., Ebrahimpour, M., 1984. Just-in-time production system: Some requirements for implementation. International Journal of Operations and Production Management, 4 (4), 3-15. Lissitz, R.W., Green, S. B., 1975. Effect of the number of scale points on reliability: A Monte Carlo approach. Journal of Applied Psychology, 60 (1), 10-13. MacDuffie, J. P., 1995. Human resource bundles and manufacturing performance: Organizational logic and flexible production systems in the world auto industry. Industrial and Labor Relations Review, 48 (2), 197-221. Machin, S., 1995. Plant Closures and unionization in British Establishments. British Journal of Industrial Relations, 33 (1), 55-68. Mauri, A. J., Michaels, M. P., 1998. Firm and industry effects within strategic management: An empirical examination. Strategic Management Journal, 19 (2), 211-219. McGahan, A. M., Porter, M. E., 1997. How much does industry matter, really? Strategic Management Journal, 18 (6-7), 15-30. McKone, K. E., Schroeder, R. G., Cua, K. O., 2001. The impact of Total Productive Maintenance on manufacturing performance. Journal of Operations Management, 19 (1), 39-58. McKone, K.E., Schroeder, R. G., Cua, K. O., 1999. Total productive maintenance: A contextual view. Journal of Operations Management, 17 (2), 123-144. McKone, K.E., Weiss, E. N., 1999. Total Productive Maintenance: Bridging the gap between practice and research. Production and Operations Management, 7 (4), 335-351. McLachlin, R., 1997. Management initiatives and just-in-time manufacturing. Journal of Operations Management, 15 (4), 271-292. Meador, M. W., Walters J. K., 1994. Unions and Productivity: Evidence from academe. Journal of Labor Research, 15 (4), 373-386. Meredith, J. R., McTavish, R., 1992. Organized manufacturing for superior market performance. Long Range Planning, 25 (6), 63-71. Moch, M. K., 1976. Structure and Organizational Resource Allocation. Administrative Science Quarterly, 21 (4), 661-674. Monden, Y., 1981. What makes the Toyota production system really tick? Industrial Engineering, 13 (1), 13-16.

39
Morrison, D.G., 1972. Regression with discrete dependent variables: The effect on R2. Journal of Marketing Research, 9 (3), 338-340. Nelson R. R., Winter, S. G., 1982. An evolutionary theory of economic change. Harvard University Press, Cambridge, MA. Neter, J., Wasserman, W., Kutner, M. H., 1990. Applied Linear Statistical Models, 3rd ed. Irwin, Homewood, IL. Ng, I., Maki, D., 1994. Trade union influence on human resource management practices. Industrial Relations, 33 (1), 121-135. Osterman, P., 1994. How common is workplace transformation and who adopts it? Industrial and Labor Relations Review, 47 (2), 173-188. Pegels, C. C., 1984. The Toyota production system: Lessons for American management. International Journal of Operations and Production Management, 4(1), 3-11. Pil, F. K., MacDuffie, J. P., 1996. The adoption of high-involvement work practices. Industrial Relations, 35 (3), 423-455. Piper, C. J., McLachlin, R. D., 1990. Just-in-time Production: Eleven achievable dimensions. Operations Management Review, 7 (3-4), 1-8. Powell, T. C., 1995. Total quality management as competitive advantage: A review and empirical study. Strategic Management Journal, 16(1), 15-27. Roth, A. V., van der Velde, M., 1991. Operations as Marketing: A competitive Service Strategy. Journal of Operations Management, 10 (3), 303-328. Sakakibara, S., Flynn, B. B., Schroeder, R. G., Morris, W. T., 1997. The impact of just-in-time manufacturing and its infrastructure on manufacturing performance. Management Science, 43 (9), 1246-1257. Samson, D., Terziovski, M., 1999. The Relationship between Total Quality Management Practices and Operational Performance. Journal of Operations Management, 17 (5), 393-409. Schonberger, R. J., 1982. Japanese Manufacturing Techniques: Nine hidden lessons in simplicity. The Free Press, New York. Schonberger, R. J., 1986. World Class Manufacturing: The Lessons of Simplicity Applied. The Free Press, New York. Schroeder, R. G., Flynn, B. B., 2001. High Performance Manufacturing: Global perspectives. John Wiley, New York.
40
Shingo Prize Guidelines, 1996. Richey, D., The Shingo Prize for excellence in manufacturing. Journal for Quality and Participation, 19 (4), 28-31. Skinner, W., 1969. Manufacturing – missing link in corporate strategy. Harvard Business Review, 50 (1), 136-145. Smith, T. W., 1994. A comparison or two confidence intervals. GSS Methodological Report No. 80, National Opinion Research Center, Chicago, IL. Smith, T. W., Peterson, B. L., 1985. The impact of number of response categories on inter-item associations: Experimental and simulated studies. Presented at American Sociological Association Meetings, Washington, D.C. Stinchcombe, A., 1965. Social structure and organizations. In: March, J. (Eds.), Handbook of industrial organization, Rand McNally, Chicago, IL, pp. 142-193. Stock, G. N., Greis, N. P., Kasarda, J. D., 2000. Enterprise logistics and supply chain structure. Journal of Operations Management, 18 (5), 531-547. Sugimori, Y., Kusunoki, F., Cho, F., Uchikawa, S., 1977. Toyota production system and kanban system: Materialization of just-in-time and respect for human systems. International Journal of Production Research, 15 (6), 553-564. Suzaki, K., 1985. Japanese Manufacturing Techniques: their importance to US manufacturers. Journal of Business Strategy, 5 (3), 10-19. Tushman, M. L., Anderson, P., 1986. Technological discontinuities and organizational environments. Administrative Science Quarterly, 31 (3), 439-465. U. S. Census of Manufacturers, 1997, http://www.census.gov/ Vickery, S. K., 1991. A Theory of Production Competence Revisited. Decision Sciences, 22 (3), 635-643. Voss, C. A., Robinson, S. J., 1987. Application of just-in-time manufacturing techniques in the United Kingdom. International Journal of Operations and Production Management, 7 (4), 46-52. Wantuck, K. A., 1983. The Japanese approach to productivity, In: Chase, R., Aquilano (Eds.). Production and Operations Management: A life cycle approach. 6th ed. Irwin, Homewood, IL. White, R. E., 1993. An empirical assessment of JIT in US manufacturers. Production and Inventory Management Journal, 34 (2), 38-42.

41
White, R. E., Pearson, J. N., Wilson, J. R., 1999. JIT Manufacturing: A survey of implementation in small and large US manufacturers. Management Science, 45 (1), 1-15. Womack, J. P., Jones, D. T., 1996. Lean Thinking: Banish waste and create wealth in your corporation. Simon & Schuster, New York. Womack, J. P., Jones, D. T., Roos, D., 1990. The machine that changed the world. Harper Perennial: New York.

42
Table 1 Lean practices and their appearance in key references (adapted from McLachlin, 1997) Sources
Sugi
mor
i et a
l., 1
977;
M
onde
n, 1
981;
Peg
els,
1984
W
antu
ck, 1
983
Lee
and
Ebra
him
pour
, 198
4
Suza
ki, 1
985
Finc
h an
d C
ox, 1
986
Vos
s and
Rob
inso
n, 1
987
Hay
, 198
8
Bic
heno
, 198
9
Cha
n et
al.,
199
0
Pipe
r and
McL
achl
in, 1
990
Whi
te, 1
993
Shin
go P
rize
Gui
delin
es, 1
996
Saka
kiba
ra e
t al.,
199
7
Kou
ftero
s et a
l., 1
998
Flyn
n et
al.,
199
9
Whi
te e
t al.,
199
9
Bottleneck removal (production smoothing)
Cellular manufacturing * * * * * *
Competitive Benchmarking Continuous improvement programs
* * * * * * * * * * *
Cross functional work force * * * * * * * * * * * Cycle time reductions * * * * * Focused factory production * * * * * * * JIT/ continuous flow production
* * * * * * * * * * * * * * * *
Lot size reductions * * * * * * * * * * * * * * Maintenance optimization New process equipment/technologies
* * *
Planning and scheduling strategies
Preventive maintenance * * * * * * * * * * * Process capability measurements
* * * * *
Pull System/Kanban * * * * * * * * * * * * * * * * Quality Management Programs * Quick changeover techniques * * * * * * * * * * * * * * * *
Reengineered production process
Safety improvement programs * * * Self directed work teams * * * * * * * * * * Total quality management * * * * * * * * * * *
43
Table 2 Comparison of the study sample with US Census of Manufacturers (1997) by SIC code
Study Sample U.S. Census (1997)
Standard Industrial Classification Number % % 20 Food and Products 66 3.8 5.5 21 Tobacco Products 3 0.2 0.04 22 Textile Mill Products 41 2.3 1.6 23 Apparel and other textile 22 1.3 6.2 24 Lumber and Wood 39 2.2 9.7 25 Furniture and Fixtures 58 3.3 3.2 26 Paper 86 4.9 1.7 27 Printing and Publishing 27 1.5 16.4 28 Chemicals 130 7.4 3.3 29 Petroleum and Coal 10 0.6 0.6 30 Rubber and Misc. Plastic 107 6.1 4.4 31 Leather 6 0.3 0.5 32 Stone, Clay, and Glass 53 3.0 4.3 33 Primary Metal 90 5.1 1.7 34 Fabricated Metal 202 11.5 10.1 35 Machinery, except elect. 307 17.5 14.9 36 Electric and electronic equip. 219 12.5 4.5 37 Transportation Equip. 141 8.1 3.3 38 Instruments and Related Products 112 6.4 3.1 39 Misc. Manufacturing 29 1.7 4.8
TOTAL 1,748 100% 100%
44
Table 3 Spearman’s correlations between union, age, size and manufacturing practices a
1 2 3 4 5 6 7 8 9 10 11 12 13 14 15 16 17 18 19 20 21 22 23 24 25 1 - .00 .00 .03 .00 .01 .07 .02 .00 .04 .01 .01 2 .11 - .06 .00 .00 .00 .00 .00 .00 .00 .00 .09 .00 .00 .00 .00 .00 .00 .00 .00 .00 .01 .00 .00 3 .24 .05 - .01 .00 .08 .03 .00 .07 .02 4 .01 .16 -.01 - .00 .00 .00 .00 .00 .00 .00 .00 .00 .00 .00 .00 .00 .00 .00 .00 .00 .00 .00 .00 .00 5 .01 .08 -.03 .28 - .00 .00 .00 .00 .00 .00 .00 .00 .00 .00 .00 .00 .00 .00 .00 .00 .00 .00 .00 .00 6 -.05 .10 -.06 .31 .16 - .00 .00 .00 .00 .00 .00 .00 .00 .00 .00 .00 .00 .00 .00 .00 .00 .00 .00 .00 7 -.14 -.02 -.08 .21 .18 .34 - .00 .00 .00 .00 .00 .00 .00 .00 .00 .00 .00 .00 .00 .00 .00 .00 .00 .00 8 -.07 .11 -.04 .25 .30 .15 .23 - .00 .00 .00 .00 .00 .00 .00 .00 .00 .00 .00 .00 .00 .00 .00 .00 .00 9 .04 .10 -.01 .28 .22 .22 .18 .19 - .00 .00 .00 .00 .00 .00 .00 .00 .00 .00 .00 .00 .00 .00 .00 10 -.06 .16 -.04 .17 .24 .13 .13 .18 .22 - .00 .00 .00 .00 .00 .00 .00 .00 .00 .00 .00 .00 .00 .00 .00 11 .01 .09 .05 .22 .20 .17 .18 .26 .27 .17 - .00 .00 .00 .00 .00 .00 .00 .00 .00 .00 .00 .00 .00 .00 12 .02 .09 -.01 .27 .30 .21 .28 .34 .23 .21 .38 - .00 .00 .00 .00 .00 .00 .00 .00 .00 .00 .00 .00 .00 13 .01 .04 -.01 .41 .17 .18 .16 .16 .22 .18 .23 .21 - .00 .00 .00 .00 .00 .00 .00 .00 .00 .00 .00 .00 14 -.02 .10 -.01 .23 .25 .14 .18 .32 .20 .24 .22 .36 .10 - .00 .00 .00 .00 .00 .00 .00 .00 .00 .00 .00 15 -.02 .15 -.04 .22 .25 .23 .19 .25 .15 .17 .18 .33 .14 .33 - .00 .00 .00 .00 .00 .00 .00 .00 .00 .00 16 .01 .14 -.07 .28 .28 .22 .23 .36 .19 .18 .24 .33 .16 .34 .41 - .00 .00 .00 .00 .00 .00 .00 .00 .00 17 -.07 .11 -.05 .12 .22 .17 .16 .25 .01 .12 .12 .21 .09 .23 .31 .33 - .00 .00 .00 .00 .00 .00 .00 18 .01 .09 -.03 .44 .25 .26 .22 .22 .29 .19 .23 .28 .51 .22 .27 .31 .20 - .00 .00 .00 .00 .00 .00 .00 19 .05 .21 -.02 .34 .16 .17 .14 .17 .23 .19 .13 .19 .32 .22 .20 .26 .20 .37 - .00 .00 .00 20 .07 .20 .00 .31 .25 .24 .19 .23 .27 .21 .25 .29 .24 .24 .21 .28 .12 .33 .32 - .00 .00 .00 21 -.03 .11 .03 .16 .21 .13 .18 .33 .07 .11 .25 .31 .10 .27 .27 .35 .36 .16 .14 .21 - .00 .00 .00 22 .03 .09 -.03 .30 .18 .16 .17 .15 .55 .21 .23 .19 .24 .20 .10 .17 -.01 .30 .22 .27 .10 - .00 .00 .00 23 .06 .07 .06 .27 .14 .17 .15 .11 .26 .19 .24 .16 .23 .16 .13 .14 -.03 .28 .15 .24 .10 .37 - .00 .00 24 -.00 .16 -.03 .25 .23 .17 .19 .30 .09 .11 .19 .27 .16 .21 .31 .46 .41 .24 .25 .21 .39 .08 .06 - .00 25 -.00 .11 -.01 .28 .27 .21 .26 .35 .24 .21 .31 .35 .17 .31 .28 .37 .23 .28 .24 .30 .29 .26 .26 .35 -
1=Union, 2=Size, 3=Age, 4=Continuous improvement Programs, 5=Reengineered Production Process, 6=Self directed Work Teams, 7=Cross Functional work force, 8=Cycle Time Reduction, 9=Maintenance Optimization, 10=New Process equipment or Technologies, 11=Planning and Scheduling Strategies, 12=Agile Manufacturing Strategies, 13=Quality Management Programs, 14=Quick Changeover Techniques, 15=Focused Factory Production Systems, 16=JIT/continuous Flow Production, 17=Cellular Manufacturing, 18=TQM , 19=Process Capability Measurements, 20=Competitive Benchmarking, 21=Lot Size Reductions, 22=Preventive Maintenance, 23=Safety Improvement Programs, 24=Pull System/Kanban, 25=Bottleneck Removal a Values below diagonal are Spearman’s correlations and values above diagonal are p-values. Only significant p-values are shown.

Table 4: Exploratory Factor Analysis to validate lean bundles -- Rotated Component Matrix Factor Loadings
JIT TPM TQM HRM Lot-size reductions .659 .062 .007 .031 JIT/continuous-flow production .649 .081 .213 .116 Pull system .647 -.147 .256 .118 Cellular manufacturing .631 -.234 .180 .105 Cycle-time reductions .586 .248 .014 .054 Focused-factory production systems .562 .051 .170 .164 Agile manufacturing strategies .552 .327 .075 .146 Quick changeover techniques .537 .336 .030 -.064 Bottleneck/constraint removal .501 .349 .126 .151 Reengineered production processes .440 .288 .138 .023 Predictive or preventive maintenance -.001 .715 .198 .116 Maintenance optimization .038 .681 .168 .176 Safety improvement programs .012 .552 .240 .089 Planning and scheduling strategies .314 .458 .050 .141 New process equipment or technologies .248 .418 .147 -.197 Competitive benchmarking .256 .364 .361 .073 Quality management programs .024 .178 .741 .079 Total Quality Management .177 .219 .705 .160 Process capability measurements .211 .101 .660 -.079 Formal continuous improvement program
.179 .271 .605 .206
Self-directed work teams .138 .128 .208 .758 Flexible, cross-functional workforce .259 .177 .042 .710 Eigenvalue 5.88 1.98 1.25 1.05 Initial Percent of Variance Explained 26.74 9.01 5.67 4.72 Rotation Sum of Squared Loadings (Total)
3.79 2.58 2.39 1.39
Percent of Variance Explained 17.23 11.74 10.85 6.33 Cronbach Alpha (sample N) .81 (1508) .74 (1579) .74 (1588) .51 (1709) Extraction Method: Principal Component Analysis. Rotation Method: Varimax with Kaiser Normalization.

46
Table 5 Operational Performance: Factor loading, means, standard deviation and Spearman correlation.
Five
Yea
r Cha
nge
in:
Fact
or L
oadi
ng o
n Fi
rst
Fact
or
Mea
n
Stan
dard
Dev
iatio
n
Scra
p an
d re
wor
k co
sts
Man
ufac
turin
g cy
cle
time
Firs
t Pas
s Yie
ld
Labo
r Pro
duct
ivity
Uni
t Man
ufac
turin
g C
ost
Cus
tom
er L
ead
Tim
e
Scrap and rework costs .71 3.77 1.06 -
Manufacturing cycle time .70 2.65 1.25 0.32 -
First Pass Yield .61 4.10 0.93 0.50 0.28 -
Labor Productivity .61 4.67 1.42 0.27 0.33 0.23 -
Unit Manufacturing Cost .58 4.52 1.46 0.31 0.30 0.17 0.35 -
Customer Lead-time .53 4.05 1.11 0.22 0.40 0.18 0.18 0.19 -
Eigenvalue (Variance Explained) 2.36 (39.26%)
Cronbach Alpha 0.69
*Pairwise deletion method used, sample size differs for each bi-variate pair. All correlations are significant at 0.01 level (2-tailed).

47
Table 6 Pearson’s chi-square to test for association between contextual variables and implementation of lean practices. a Unionization Age Size Agile Manufacturing Strategies 2.85 .92 14.30** Bottleneck Removal .01 1.39 20.73*** Cellular Manufacturing (17.89)*** 8.18 23.86*** Competitive Benchmarking 7.62 1.32 70.32*** Continuous Improvement Programs 6.24 8.54 44.32*** Cross Functional work force (39.99)*** (18.07)*** .50 Cycle Time Reduction (10.68)* 7.23 21.86*** Focused Factory Production Systems .85 8.35 40.10*** JIT/continuous Flow Production 1.37 (12.69)* 35.44*** Lot Size Reductions 2.72 2.58 18.96*** Maintenance Optimization (13.75)** (10.75)* 22.35*** New Process equipment or Technologies 7.24 4.35 48.73*** Planning and Scheduling Strategies 5.13 13.03** 13.04** Preventive Maintenance 3.24 6.72 33.19*** Process Capability Measurements (11.06)* 6.44 75.06*** Pull System/Kanban 4.78 7.70 42.52*** Quality Management Programs 1.56 6.04 6.75 Quick Changeover Techniques 2.53 5.07 22.54*** Reengineered Production Process .88 (10.72)** 16.34** Safety Improvement Programs 8.61 13.92** 25.90*** Self directed Work Teams (18.50)*** (15.87)** 20.74*** Total Quality Management 6.50 12.00* 13.72** *p < .05; **p < .01; ***p < .001 a All significant associations are positive except for those in parentheses, which indicate negative association.

48
Table 7 Results from Hierarchical Regression Analysis – dependent variable is factor score for operational performance Standardized Beta Coefficients Model 1 Model 2 Model 3 Dummy 20 -.120 -.123* -.065 Dummy 22 -.009 -.013 .009 Dummy 23 -.029 -.035 -.023 Dummy 24 -.116** -.120** -.070 Dummy 25 -.045 -.046 -.034 Dummy 26 -.065 -.068 -.026 Dummy 27 -.024 -.025 .014 Dummy 28 -.070 -.074 -.029 Dummy 29 -.037 -.039 -.023 Dummy 30 -.049 -.051 -.027 Dummy 31 -.068* -.071* -.035 Dummy 32 -.056 -.055 -.014 Dummy 33 -.010 -.017 .026 Dummy 34a -.007 -.003 -.013 Dummy 35 a -.091 -.096 -.058 Dummy 36 a .023 .015 .017 Dummy 37 a -.028 -.046 -.097 Dummy 38 .003 -.003 .023 Union .017 .027 Size .026 -.068* Age -.079** -.072** JIT .431*** TPM .176*** TQM .190** HRM .097** R2 .040 .046 .277 Adjusted R2 .024 .028 .261 Change in R2 .040 .006 .231 p-value of F Statistic .001 .051 .000 p-value of overall model .001 .001 .000 *p < .05; **p < .01; ***p < .000 a The Variance Inflation Factor is greater than five for each of these variables in each of the models indicating multi-collinearity.
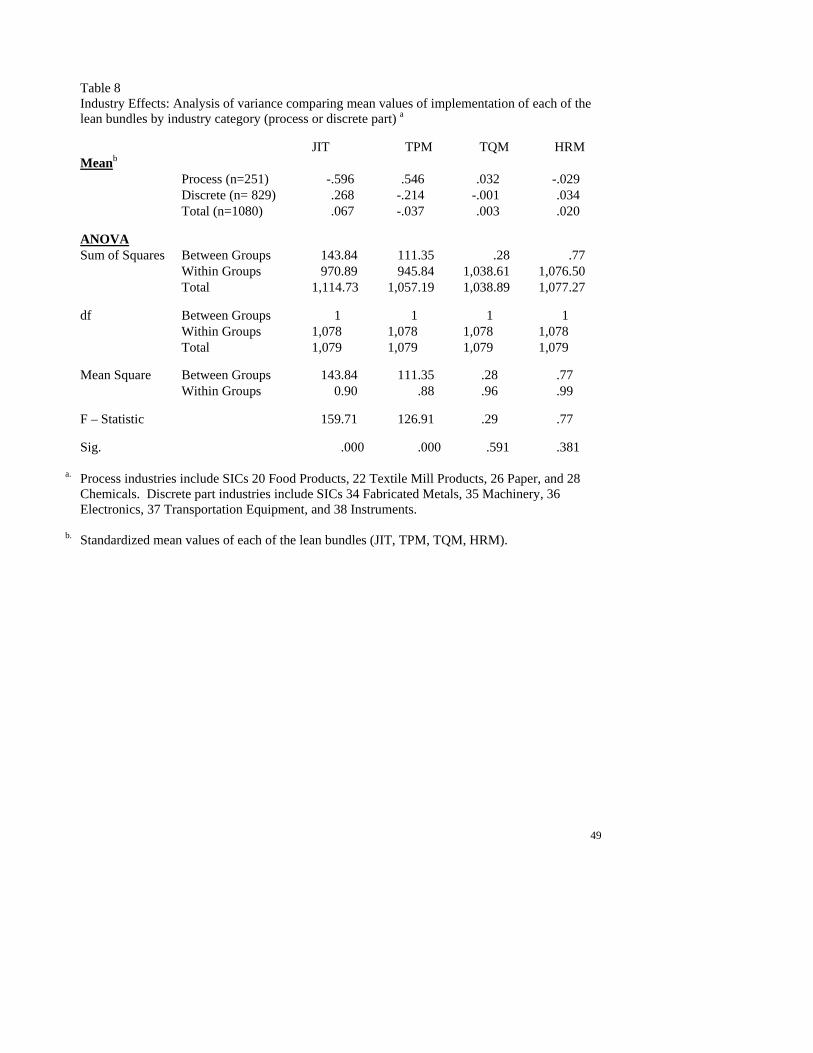
49
Table 8 Industry Effects: Analysis of variance comparing mean values of implementation of each of the lean bundles by industry category (process or discrete part) a
JIT TPM TQM HRM Meanb Process (n=251) -.596 .546 .032 -.029 Discrete (n= 829) .268 -.214 -.001 .034 Total (n=1080) .067 -.037 .003 .020
ANOVA Sum of Squares Between Groups 143.84 111.35 .28 .77 Within Groups 970.89 945.84 1,038.61 1,076.50 Total 1,114.73 1,057.19 1,038.89 1,077.27
df Between Groups 1 1 1 1 Within Groups 1,078 1,078 1,078 1,078 Total 1,079 1,079 1,079 1,079
Mean Square Between Groups 143.84 111.35 .28 .77 Within Groups 0.90 .88 .96 .99
F – Statistic 159.71 126.91 .29 .77
Sig. .000 .000 .591 .381
a. Process industries include SICs 20 Food Products, 22 Textile Mill Products, 26 Paper, and 28 Chemicals. Discrete part industries include SICs 34 Fabricated Metals, 35 Machinery, 36 Electronics, 37 Transportation Equipment, and 38 Instruments.
b. Standardized mean values of each of the lean bundles (JIT, TPM, TQM, HRM).