lattice boltzmann simulation of...
TRANSCRIPT

LATTICE BOLTZMANN SIMULATION OF RESISTANCECOEFFICIENT OF THE OIL AND WATER MIGRATION
IN POROUS MEDIA
by
Han-Bing QI a,b, Dong-Hai LI a, Wei WEI a, Xin-Hao HU a,Dong LI a,b*, Guo-Zhong WU a, and Xiao-Yan LIU a
a School of Civil and Ar chi tec tural En gi neer ing, North east Pe tro leum Uni ver sity,Heilongjiang Prov ince, Heilongjiang, China
bHeilongjiang Key Lab o ra tory of Pe tro leum and Pet ro chem i cal Multiphase Treat ment and Pol lu tionPre ven tion, Heilongjiang Prov ince, Heilongjiang, China
Orig i nal sci en tific pa perhttps://doi.org/10.2298/TSCI171011039Q
The co ef fi cients of oil and wa ter trans fer re sis tance in po rous me dia are the ba sis of nu mer i cal study on the mi gra tion of con tam i na tion in the pipe line, soil clean ing,oil field wa ter flood ing, and oil field wa ter treat ment. Based on the quar tet struc turegen er a tion set, the po rous me dia with ran dom dis tri bu tion are con structed. The lat -tice Boltzmann method is used to sim u late the mesoscopic mi gra tion of oil and wa -ter in po rous me dia. Then the dis tri bu tion law of oil and wa ter ve loc ity and pres sure in po rous me dia is an a lyzed, and the fit ting equa tions of oil and wa ter re sis tanceco ef fi cients are ob tained un der dif fer ent po ros ity. The re sults show that when theoil and wa ter mi grate in po rous me dia, the vis cous re sis tance co ef fi cient is largerthan the in er tia re sis tance fac tor, and the vis cos ity re sis tance co ef fi cient of wa ter isob vi ously higher than that of oil, while the co ef fi cient of in er tia re sis tance of oil and wa ter is nearly same.
Key words: po rous me dia, mesoscopic mi gra tion, re sis tance co ef fi cient,lat tice Boltzmann model
In tro duc tion
The co ef fi cients of vis cous drag and in er tia re sis tance are the key pa ram e ters for theflow of liq uid me dium in po rous me dia, such as leak ing pol lut ant mi gra tion of oil pipe line in soil [1], con tam i nated soil clean ing [2], oil field flood ing [3], and oil field wa ter treat ment [4].
A large num ber of stud ies on the flow of fluid in po rous me dia have been car ried out,and cor re spond ing com pu ta tional mod els have also been de vel oped. For ex am ple, the re sis tance char ac ter is tics of po rous me dia were sim u lated by us ing glass ball [5]. The sim u la tion oftwo-phase flow in po rous me dia was in ves ti gated by us ing the sim u la tion method, based on thepo rous me dia the ory and the cap il lary hysteretic in ter nal vari able mode [6]. A chan nel model ofpar ti cle filled po rous me dia was es tab lished, and the re sis tance char ac ter is tics of sin gle-phasewa ter adi a batic flow were nu mer i cally sim u lated [7]. Boltzmann sim u la tion method was moresuit able for the re al iza tion and re search of mi cro-struc ture of po rous struc ture [8-12]. For ex am -
Qi, H.-B., et al.: Lattice Boltzmann Simulation of Resistance Coefficient of the Oil ...THERMAL SCIENCE: Year 2018, Vol. 22, Suppl. 2, pp. S547-S556 S547
*Corresponding author, e-mail: [email protected]

ple, per me abil ity of po rous me dia was cal cu lated us ing Boltzmann model [13], and a lat ticeBoltzmann method was used to sim u late the bound ary be tween the po rous struc ture of the solidand the fluid [14]. The stated stud ies show that the re sis tance co ef fi cient of po rous me dia is veryim por tant for the study of the flow of spheres in po rous me dia, how ever, there are few lit er a tures about the re la tion ship be tween the co ef fi cients of oil and wa ter mi gra tion re sis tance in po rousmedia.
In this pa per, the flow re sis tance char ac ter is tics of oil and wa ter in po rous me dia werestud ied, and po rous me dia were con structed by Quar tet Struc ture Gen er a tion Set. Based on theBoltzmann method, mesoscopic sim u la tion of oil and wa ter me dium flow in po rous me dia withdif fer ent po ros ity un der dif fer ent driv ing pres sure was car ried out. In the later stage, the re sis -tance co ef fi cients of po rous me dia with dif fer ent po ros ity were ob tained by fit ting the driv ingpres sure with the flow av er age ve loc ity. The curves of the vis cous re sis tance co ef fi cient and thein er tia re sis tance co ef fi cient with the po ros ity were fit ted, and the cor re spond ing equa tions were ob tained. Fi nally, the vari a tion law of the re sis tance co ef fi cient was an a lyzed.
Method
Phys i cal and math e mat i cal mod els
A small area (0.002 mm × 0.002 mm) in a po rous me -dium is se lected. The 2-D phys i cal model of oil and wa -ter mi gra tion in po rous me dia is shown in fig. 1. Amongthem, the ADEH re gion is the com pu ta tional area (lat tice num ber 200 × 200). The left bound ary AH is high con -cen tra tion bound ary. The right bound ary DE is the lowcon cen tra tion bound ary, and bound aries EH and AD areim per me able. The BCFG re gion is filled with po rousme dia, and the ABGH and CDEF zones are buff ers.Where W is the width of the buffer, e is the po rous me diapo ros ity was put in front of the di rec tion of oil and wa ter
mi gra tion is from left to right in po rous me dia. Sim u la tion con di tions are shown in tab. 1. The stan dard col li sion
mi gra tion rules and lat ticeunits are em ployed in thissim u la tion. At the sametime, the time step and thegrid step length are both 1,¶t = ¶x = ¶y = 1. As can be
seen from the con di tions, the den sity of the grid is equal to 1. Sim u la tion con di tions of re gional bound ary set ting are: up per boundar u = 0, lower
bound ary u = 0, left bound ary U = 0.001, P = Pin, right bound ary P = Pout, solid bound ary of po -rous me dia ¶u/¶n = 0.
Lat tice Boltzmann model
The lat tice Boltzmann model is em ployed in the D2G9 model [15]. The evo lu tionequa tion of the den sity dis tri bu tion func tion is:
f r e t t t f r t f r t f r ti i if
i i( , ) ( , ) [ ( , ) ( , )]+ + - = - -D D
1
teq (1)
Qi, H.-B., et al.: Lattice Boltzmann Simulation of Resistance Coefficient of the Oil ...
S548 THERMAL SCIENCE: Year 2018, Vol. 22, Suppl. 2, pp. S547-S556
Figure 1. Physical model
Ta ble 1. Sim u la tion con di tions
L M W Z Pin Pout e U
200 200 5 190 1.001/1.01/1.05/1.1 1 0.5/0.6/0.7/0.8/0.9 0.001

where ei ap plies the dis crete ve loc ity model of D2Q9, tf – the dimensionless time, and fieq – the
den sity equi lib rium dis tri bu tion func tion. The cal cu la tion pa ram e ters are given:
f
dp
cS u i
dp
cS u i
dp
cS
i
i
i
i
eq =
- + =
+ =
+
4 0
12 3 4
0 2
1 2
2 2
( )
( ) , , ,
(u i) , , ,=
ì
í
ïïï
î
ïïï
5 6 7 8
(2)
S ue u
c
e u
c
u
cii i
i
s
i
s s
( )( )
, , , , ,= + -é
ëê
ù
ûú =w
2
2
4
2
22 21 2 3 4 5 6 7 8, , (3)
where c is the lat tice ve loc ity, u – the fluid ve loc ity, P – the pres sure, and d0, d1, d2 must meetd1 + d2 = d0 and d1 + 2 d2 = 1/2. As sumed d0 = 5/12, d1=1/3, d2 = 1/12.
e
i=
i i c ii = - - =
( , )
(cos[( ) / , sin[( ) / ]) , , ,
0 0 0
1 2 1 2 1 2 3 4
2
p p
(cos[( ) / / ], sin[( ) / / ]) , , ,i i c i- + - + =
ì
íï
5 2 4 5 2 4 5 6 7 8p p p pîï
(4)
where ei is the dis crete ve loc ity, the weight co ef fi cients are w0 = 4/9, w1-4 = 1/9, w5-8 = 1/36, cs2 =
=.c2/3. The ve loc ity and pres sure of a fluid are cal cu lated:
u e fi ii= å (5)
Pc
df s uii= +å ¹r0
2
000
4[ ( )] (6)
The mac ro scopic gov ern ing equa tions of fluid can be de rived as
Ñ =u 0 (7)
u
uuu
Pv u+ Ñ = -
Ñ+ Ñ( )
r0
2 (8)
v cs f t= -æ
èç
ö
ø÷2 1
2t d (9)
The model's four bound aries are treated with the non-equi lib rium ex trap o la tion schemeand two or der ac cu racy pro posed by [16]. Then the bound ary of solid par ti cles in po rous me dia re -gion adopts the re bound scheme pro posed by [17]. The con ver gence cri te rion is given:
uu i j t u i j t u i j t ux t x y t y
error =+ - + + -{[ ( , , ) ( , , )] [ ( , , )d d2 ( , , )] }
[ ( , , )] [ ( , , )]
,
,
i j t
u i j t u i j t
i j
x t y ti j
2
2 2
å
+ + +å<
d dh (10)
where h is a small amount which is 10–6.
Re sis tance co ef fi cient ac qui si tion model
For the limit in high ve loc ity flow, it is nec es sary to ex tend Darcy's law. The vis cousre sis tance and the in er tia re sis tance should be con sid ered in the ex pan sion. The co ef fi cient of re -sis tance is ob tained by us ing the bi no mial law of seep age.
Qi, H.-B., et al.: Lattice Boltzmann Simulation of Resistance Coefficient of the Oil ...THERMAL SCIENCE: Year 2018, Vol. 22, Suppl. 2, pp. S547-S556 S549

DP a v a v= +1 22 (11)
D
D
P
nS i= - (12)
1 1
a
a
m=
Ñn(13)
Cn
222
=Ñ
a
r(14)
where DP is the pres sure drop for a fluid pass ing through a po rous me dium, v – the flow ve loc ity, a1 and a2 are the fit ting co ef fi cient, Dn – the thick ness of the po rous me dium, 1/a – the co ef fi -cient of vis cous re sis tance, and C2 – the co ef fi cient of in er tia re sis tance.
Re sults and dis cus sion
Ran dom dis tri bu tion po rous me dia with po ros ity 0.5/0.6/0.7/0.8/0.9 are con structed.The sim u la tion is car ried out when the pres sure dif fer ence is 0.001/0.01/0.05/0.1. The oil andwa ter den sity are 838.8 and 998.2 kg/m3, re spec tively. The vis cos ity of oil and wa ter is0.008832 and 0.001003, kgm/s, re spec tively.
Po rous me dium
The po rous me dia are gen er ated by the ran dom Quar tet Struc ture Gen er a tion Set [18].The growth rate of solid growth nu cle ation is se lected 0.01, and growth ker nel dis tri bu tion is0.01. Fig ure 2 shows po rous me dia struc ture di a gram with po ros ity of 0.5/0.6/0.7/0.8/0.9.
Mesoscopic mi gra tion char ac ter is tics of oil and wa ter
Po rous me dia po ros ity 0.5/0.6/0.7/0.8/0.9 and the sim u lated drive pres sure dif fer ence0.001/0.01/0.05/0.1 are se lected. Through the trans for ma tion be tween the grid unit and the phys i -cal unit, wa ter mi gra tion phys i cal pres sure is 0.362801797/3.628017971/18.14008986/36.28017971, Pa, and oil mi gra tion phys i cal pres sure is 33.47686864/334.7686864/1673.843432/3347.686864, Pa. In this pa per, the ve loc ity pro files and pres sure pro files of po rousme dia and stream line pro files are used to com pare the re sults of oil and wa ter.
Fig ure 3 shows the ve loc ity pro files of oil and wa ter mi gra tion in po rous me dia, whenthe pres sure dif fer ence is 0.001/0.01/0.05/0.1 and the po ros ity is 0.6. The blue re gion is the solid
Qi, H.-B., et al.: Lattice Boltzmann Simulation of Resistance Coefficient of the Oil ...
S550 THERMAL SCIENCE: Year 2018, Vol. 22, Suppl. 2, pp. S547-S556
Figure 2. Porous media structure diagram; A – 0.5, B – 0.6, C – 0.7, D – 0.8, E – 0.9(for color image see journal web site)
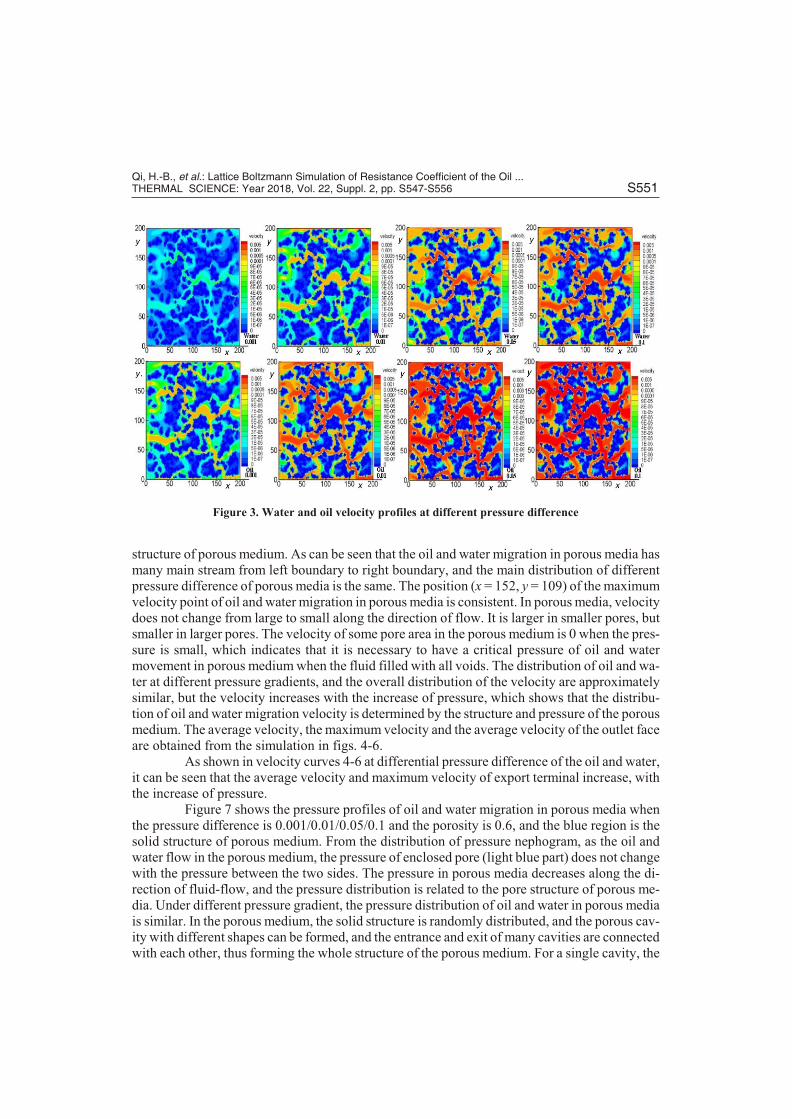
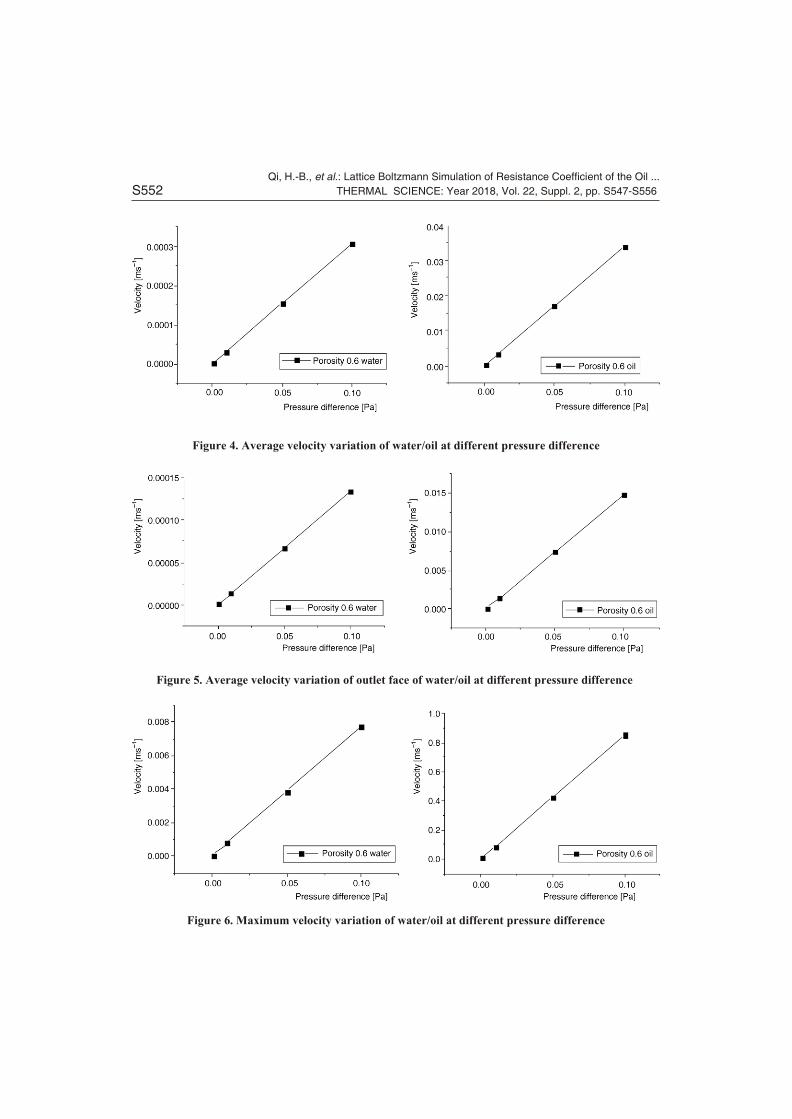
struc ture of po rous me dium. As can be seen that the oil and wa ter mi gra tion in po rous me dia hasmany main stream from left bound ary to right bound ary, and the main dis tri bu tion of dif fer entpres sure dif fer ence of po rous me dia is the same. The po si tion (x = 152, y = 109) of the max i mumve loc ity point of oil and wa ter mi gra tion in po rous me dia is con sis tent. In po rous me dia, ve loc ity does not change from large to small along the di rec tion of flow. It is larger in smaller pores, butsmaller in larger pores. The ve loc ity of some pore area in the po rous me dium is 0 when the pres -sure is small, which in di cates that it is nec es sary to have a crit i cal pres sure of oil and wa termove ment in po rous me dium when the fluid filled with all voids. The dis tri bu tion of oil and wa -ter at dif fer ent pres sure gra di ents, and the over all dis tri bu tion of the ve loc ity are ap prox i matelysim i lar, but the ve loc ity in creases with the in crease of pres sure, which shows that the dis tri bu -tion of oil and wa ter mi gra tion ve loc ity is de ter mined by the struc ture and pres sure of the po rousme dium. The av er age ve loc ity, the max i mum ve loc ity and the av er age ve loc ity of the out let face are ob tained from the sim u la tion in figs. 4-6.
As shown in ve loc ity curves 4-6 at dif fer en tial pres sure dif fer ence of the oil and wa ter,it can be seen that the av er age ve loc ity and max i mum ve loc ity of ex port ter mi nal in crease, withthe in crease of pres sure.
Fig ure 7 shows the pres sure pro files of oil and wa ter mi gra tion in po rous me dia whenthe pres sure dif fer ence is 0.001/0.01/0.05/0.1 and the po ros ity is 0.6, and the blue re gion is thesolid struc ture of po rous me dium. From the dis tri bu tion of pres sure nephogram, as the oil andwa ter flow in the po rous me dium, the pres sure of en closed pore (light blue part) does not changewith the pres sure be tween the two sides. The pres sure in po rous me dia de creases along the di -rec tion of fluid-flow, and the pres sure dis tri bu tion is re lated to the pore struc ture of po rous me -dia. Un der dif fer ent pres sure gra di ent, the pres sure dis tri bu tion of oil and wa ter in po rous me diais sim i lar. In the po rous me dium, the solid struc ture is ran domly dis trib uted, and the po rous cav -ity with dif fer ent shapes can be formed, and the en trance and exit of many cav i ties are con nected with each other, thus form ing the whole struc ture of the po rous me dium. For a sin gle cav ity, the
Qi, H.-B., et al.: Lattice Boltzmann Simulation of Resistance Coefficient of the Oil ...THERMAL SCIENCE: Year 2018, Vol. 22, Suppl. 2, pp. S547-S556 S551
Figure 3. Water and oil velocity profiles at different pressure difference(for color image see journal web site)
Qi, H.-B., et al.: Lattice Boltzmann Simulation of Resistance Coefficient of the Oil ...
S552 THERMAL SCIENCE: Year 2018, Vol. 22, Suppl. 2, pp. S547-S556
Figure 4. Average velocity variation of water/oil at different pressure difference
Figure 5. Average velocity variation of outlet face of water/oil at different pressure difference
Figure 6. Maximum velocity variation of water/oil at different pressure difference
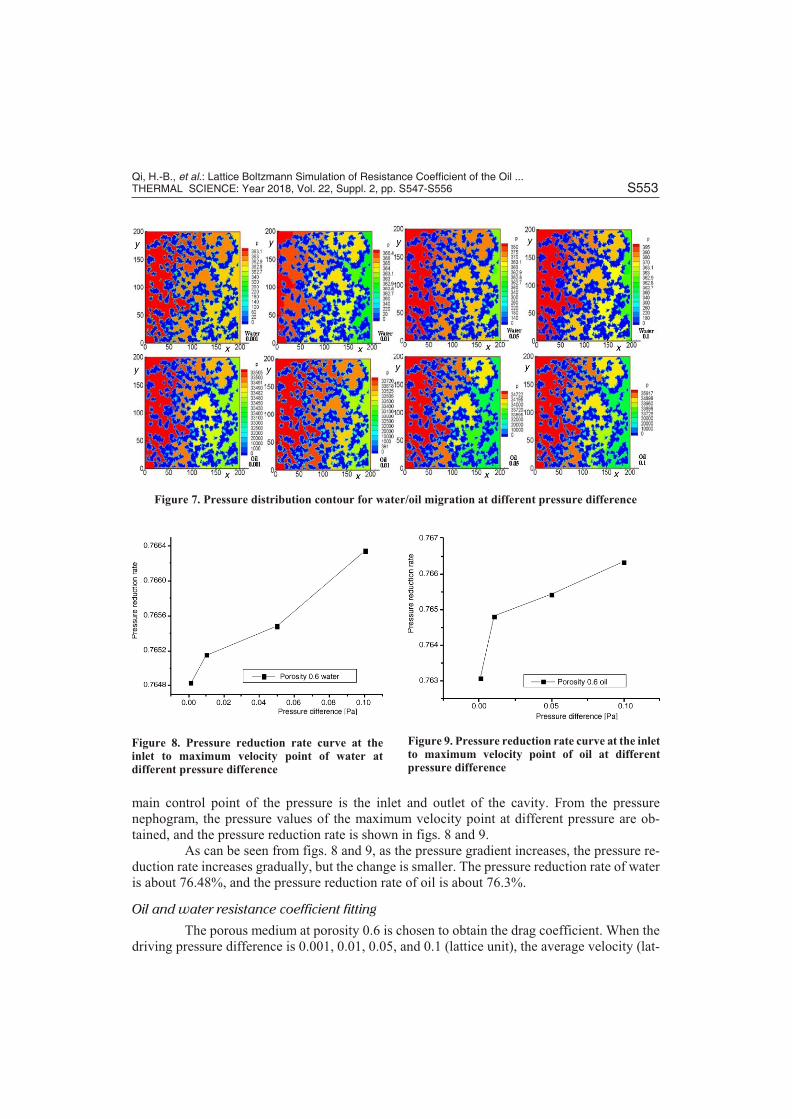
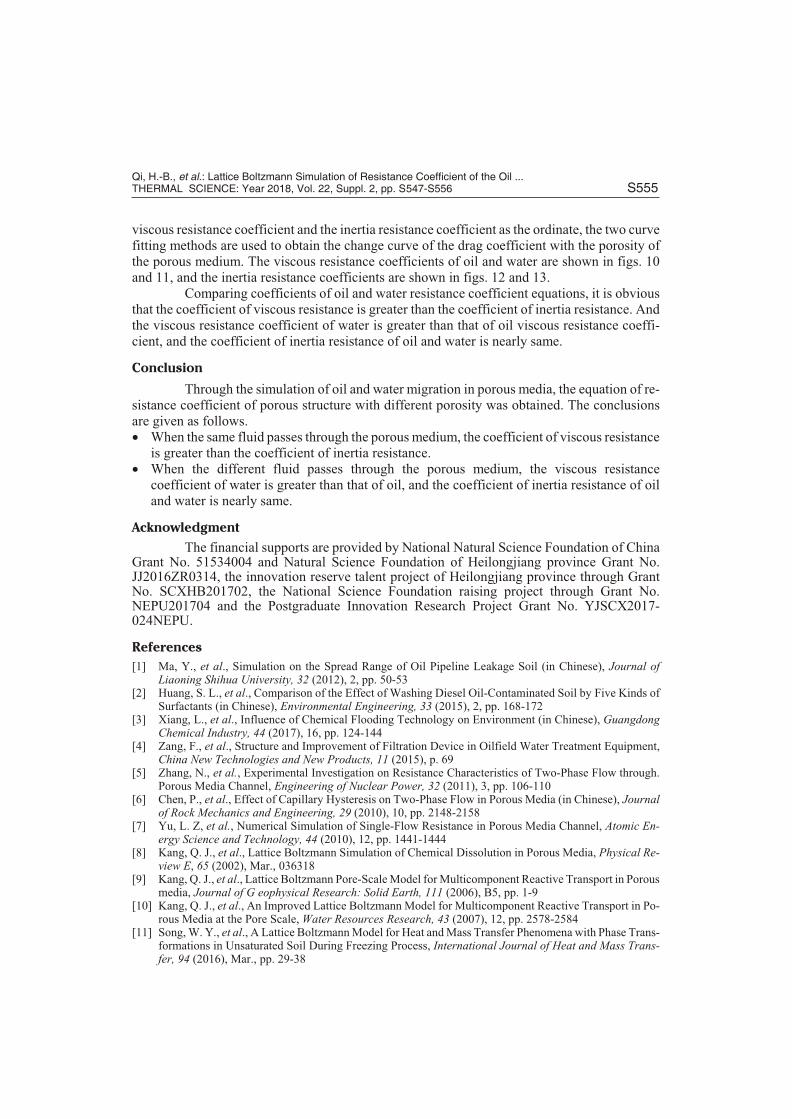
main con trol point of the pres sure is the in let and out let of the cav ity. From the pres surenephogram, the pres sure val ues of the max i mum ve loc ity point at dif fer ent pres sure are ob -tained, and the pres sure re duc tion rate is shown in figs. 8 and 9.
As can be seen from figs. 8 and 9, as the pres sure gra di ent in creases, the pres sure re -duc tion rate in creases grad u ally, but the change is smaller. The pres sure re duc tion rate of wa teris about 76.48%, and the pres sure re duc tion rate of oil is about 76.3%.
Oil and wa ter re sis tance co ef fi cient fit ting
The po rous me dium at po ros ity 0.6 is cho sen to ob tain the drag co ef fi cient. When thedriv ing pres sure dif fer ence is 0.001, 0.01, 0.05, and 0.1 (lat tice unit), the av er age ve loc ity (lat -
Qi, H.-B., et al.: Lattice Boltzmann Simulation of Resistance Coefficient of the Oil ...THERMAL SCIENCE: Year 2018, Vol. 22, Suppl. 2, pp. S547-S556 S553
Figure 7. Pressure distribution contour for water/oil migration at different pressure difference(for color image see journal web site)
Figure 8. Pressure reduction rate curve at theinlet to maximum velocity point of water atdifferent pressure difference
Figure 9. Pressure reduction rate curve at the inlet to maximum velocity point of oil at differentpressure difference

tice unit) of fluid in po rous me dia is ob tained. Then the lat tice units are trans formed into mac ro -scopic phys i cal units. Ac cord ing to the re sis tance co ef fi cient ac qui si tion model, tak ing the mean ve loc ity of fluid in po rous me dium (mac ro scopic phys i cal unit) as ab scissa, the pres sure (mac ro -scopic phys i cal unit) of unit length in left and right di rec tion as or di nate, two time curves andequa tions are fit ted. Ac cord ing to eqs. (13) and (14), the co ef fi cients of vis cous re sis tance andin er tia re sis tance of po rous me dium are ob tained.
When the fluid is wa ter in po rous me dium, and a1, a2 are the co ef fi cients of equa tion ob -tained by two time curve fit ting method, and a1 is 0.24×10⁷, a2 is 5.88×10⁷. Ac cord ing to eqs. (13) and (14), the vis cous re sis tance co ef fi cient and the in er tia re sis tance co ef fi cient of po rous me -dium are ob tained, and the vis cous re sis tance co ef fi cient is 2406779661, the in er tia re sis tanceco ef fi cient is 117810.06. When the fluid is oil, and a1 is 0.0023×10⁷, a2 is 4.94×10⁷, and the vis -cous re sis tance co ef fi cient is 2604166.67, the in er tia re sis tance co ef fi cient is 117811.16.
The re sis tance co ef fi cients of po rous me dia with dif fer ent po ros ity are ob tained ac cord ing to the method of ob tain ing the re sis tance co ef fi cient. Tak ing the po ros ity as the ab scissa, and the
Qi, H.-B., et al.: Lattice Boltzmann Simulation of Resistance Coefficient of the Oil ...
S554 THERMAL SCIENCE: Year 2018, Vol. 22, Suppl. 2, pp. S547-S556
Figure 10. Distribution curve of water viscousresistance coefficient with porosity(for color image see journal web site)
Figure 11. Distribution curve of oil viscousresistance coefficient with porosity(for color image see journal web site)
Figure 12. Distribution curve of water inertiaresistance coefficient with porosity(for color image see journal web site)
Figure 13. Distribution curve of oil inertiaresistance coefficient with porosity(for color image see journal web site)
vis cous re sis tance co ef fi cient and the in er tia re sis tance co ef fi cient as the or di nate, the two curvefit ting meth ods are used to ob tain the change curve of the drag co ef fi cient with the po ros ity ofthe po rous me dium. The vis cous re sis tance co ef fi cients of oil and wa ter are shown in figs. 10and 11, and the in er tia re sis tance co ef fi cients are shown in figs. 12 and 13.
Com par ing co ef fi cients of oil and wa ter re sis tance co ef fi cient equa tions, it is ob vi ousthat the co ef fi cient of vis cous re sis tance is greater than the co ef fi cient of in er tia re sis tance. Andthe vis cous re sis tance co ef fi cient of wa ter is greater than that of oil vis cous re sis tance co ef fi -cient, and the co ef fi cient of in er tia re sis tance of oil and wa ter is nearly same.
Con clu sion
Through the sim u la tion of oil and wa ter mi gra tion in po rous me dia, the equa tion of re -sis tance co ef fi cient of po rous struc ture with dif fer ent po ros ity was ob tained. The con clu sionsare given as fol lows.· When the same fluid passes through the po rous me dium, the co ef fi cient of vis cous re sis tance
is greater than the co ef fi cient of in er tia re sis tance.· When the dif fer ent fluid passes through the po rous me dium, the vis cous re sis tance
co ef fi cient of wa ter is greater than that of oil, and the co ef fi cient of in er tia re sis tance of oiland wa ter is nearly same.
Ac knowl edg ment
The fi nan cial sup ports are pro vided by Na tional Nat u ral Sci ence Foun da tion of ChinaGrant No. 51534004 and Nat u ral Sci ence Foun da tion of Heilongjiang prov ince Grant No.JJ2016ZR0314, the in no va tion re serve tal ent pro ject of Heilongjiang prov ince through GrantNo. SCXHB201702, the Na tional Sci ence Foun da tion rais ing pro ject through Grant No.NEPU201704 and the Post grad u ate In no va tion Re search Pro ject Grant No. YJSCX2017-024NEPU.
Ref er ences
[1] Ma, Y., et al., Sim u la tion on the Spread Range of Oil Pipe line Leak age Soil (in Chi nese), Jour nal ofLiaoning Shihua Uni ver sity, 32 (2012), 2, pp. 50-53
[2] Huang, S. L., et al., Com par i son of the Ef fect of Wash ing Die sel Oil-Con tam i nated Soil by Five Kinds ofSur fac tants (in Chi nese), En vi ron men tal En gi neer ing, 33 (2015), 2, pp. 168-172
[3] Xiang, L., et al., In flu ence of Chem i cal Flood ing Tech nol ogy on En vi ron ment (in Chi nese), GuangdongChem i cal In dus try, 44 (2017), 16, pp. 124-144
[4] Zang, F., et al., Struc ture and Im prove ment of Fil tra tion De vice in Oil field Wa ter Treat ment Equip ment,China New Tech nol o gies and New Prod ucts, 11 (2015), p. 69
[5] Zhang, N., et al., Ex per i men tal In ves ti ga tion on Re sis tance Char ac ter is tics of Two-Phase Flow through.Po rous Me dia Chan nel, En gi neer ing of Nu clear Power, 32 (2011), 3, pp. 106-110
[6] Chen, P., et al., Ef fect of Cap il lary Hys ter esis on Two-Phase Flow in Po rous Me dia (in Chi nese), Jour nalof Rock Me chan ics and En gi neer ing, 29 (2010), 10, pp. 2148-2158
[7] Yu, L. Z, et al., Nu mer i cal Sim u la tion of Sin gle-Flow Re sis tance in Po rous Me dia Chan nel, Atomic En -ergy Sci ence and Tech nol ogy, 44 (2010), 12, pp. 1441-1444
[8] Kang, Q. J., et al., Lat tice Boltzmann Sim u la tion of Chem i cal Dis so lu tion in Po rous Me dia, Phys i cal Re -view E, 65 (2002), Mar., 036318
[9] Kang, Q. J., et al., Lat tice Boltzmann Pore-Scale Model for Multicomponent Re ac tive Trans port in Po rous me dia, Jour nal of G eophysical Re search: Solid Earth, 111 (2006), B5, pp. 1-9
[10] Kang, Q. J., et al., An Im proved Lat tice Boltzmann Model for Multicomponent Re ac tive Trans port in Po -rous Me dia at the Pore Scale, Wa ter Re sources Re search, 43 (2007), 12, pp. 2578-2584
[11] Song, W. Y., et al., A Lat tice Boltzmann Model for Heat and Mass Trans fer Phe nom ena with Phase Trans -for ma tions in Un sat u rated Soil Dur ing Freez ing Pro cess, In ter na tional Jour nal of Heat and Mass Trans -fer, 94 (2016), Mar., pp. 29-38
Qi, H.-B., et al.: Lattice Boltzmann Simulation of Resistance Coefficient of the Oil ...THERMAL SCIENCE: Year 2018, Vol. 22, Suppl. 2, pp. S547-S556 S555

[12] Song, W. Y., et al., Mac ro scopic Lat tice Boltzmann Model for Heat and Mois ture Trans fer Pro cess withPhase Trans for ma tion in Un sat u rated Po rous Me dia dur ing Freez ing Pro cess, Open Phys ics, 15 (2017), 1,pp. 379-393
[13] Bayat, M., et al., The Ap pli ca tion of Lat tice Boltzmann Method for Per me abil ity Pre dic tion of Po rous Me -dia: In ves ti gat ing the Ef fects of Vis cos ity and Grid Res o lu tion, Pe tro leum Sci ence and Tech nol ogy, 30(2012), 13, pp. 1324-1334
[14] Britta, N., et al., Com bined Lat tice Boltzmann and Phase-Field Sim u la tions for In com press ible Fluid Flow in Po rous Me dia, Math e mat ics and Com put ers in Sim u la tion, 80 (2010), 7, pp. 1458-1468
[15] Guo, Z., et al., A Cou pled Lat tice BGK Model for the Boussinesq Equa tions, In ter na tional Jour nal for Nu -mer i cal Meth ods in Flu ids, 39 (2002), 4, pp. 325-342
[16] Guo, Z. L., et al., Non-Equi lib rium Ex trap o la tion Method for Ve loc ity and Pres sure Bound ary Con di tionsin the Lat tice Boltzmann Method, Chi nese Phys ics, 11 (2002), 4, pp. 366-374
[17] Chen, S., et al., On Bound ary Con di tions in Lat tice Boltzmann Meth ods, Phys ics of Flu ids, 8 (1996), 9, pp. 2527-2536
[18] Wang, M., et al., Mesoscopic Pre dic tions of the Ef fec tive Ther mal Con duc tiv ity of Miroscale Ran dom Po -rous Me dia, Phys i cal Re view E, 75 (2007), 3, pp. 1324-1334
Paper submitted: October 11, 2017 © 2018 Society of Thermal Engineers of Serbia.Pa per re vised: November 12, 2017 Pub lished by the Vin~a Institute of Nuclear Sciences, Bel grade, Ser bia.Pa per ac cepted: November 13, 2017 This is an open ac cess ar ti cle dis trib uted un der the CC BY-NC-ND 4.0 terms and con di tions.
Qi, H.-B., et al.: Lattice Boltzmann Simulation of Resistance Coefficient of the Oil ...
S556 THERMAL SCIENCE: Year 2018, Vol. 22, Suppl. 2, pp. S547-S556