laser assisted decay spectroscopy at the cris beam line · pdf filelaser assisted decay...
TRANSCRIPT
Laser assisted decay spectroscopy at the CRIS beam line at ISOLDE
This article has been downloaded from IOPscience. Please scroll down to see the full text article.
2012 J. Phys.: Conf. Ser. 381 012128
(http://iopscience.iop.org/1742-6596/381/1/012128)
Download details:
IP Address: 134.58.253.57
The article was downloaded on 11/12/2012 at 11:37
Please note that terms and conditions apply.
View the table of contents for this issue, or go to the journal homepage for more
Home Search Collections Journals About Contact us My IOPscience

Laser assisted decay spectroscopy at the CRIS beam
line at ISOLDE
K M Lynch1,2, M M Rajabali3, H Aghaei-Khozani2,4, J Billowes1, ML Bissell3, F Le Blanc5, B Cheal1, T E Cocolios2, S De Schepper3, KDewolf3, K T Flanagan1, M Hori4, T Kobayashi6, B A Marsh7, GNeyens3, J Papuga3, T J Procter1, S Rothe7,8, G Simpson9, A JSmith1, H H Stroke10 and K Wendt8.1 The University of Manchester, Manchester, UK2 PH Department, CERN, Geneva, Switzerland3 KU Leuven, Leuven, Belgium4 Max-Planck-Institut fur Quantenoptik, Garching, Germany5 IPN Orsay, Orsay Cedex, France6 The University of Tokyo, Tokyo, Japan7 EN Department, CERN, Geneva, Switzerland8 Johannes Gutenberg Universitat, Mainz, Germany9 LPSC, Grenoble, France10 New York University, New York, USA
E-mail: [email protected]
Abstract. A new collinear resonant ionization spectroscopy (Cris) beam line has recentlybeen installed at Isolde, Cern utilising lasers to combine collinear laser spectroscopy andresonant ionization spectroscopy. The combined technique offers the ability to purify an ionbeam that is heavily contaminated with radioactive isobars, including the ground state of anisotope from its isomer, allowing sensitive secondary experiments to be performed. A newprogramme aiming to use the Cris technique for the separation of nuclear isomeric states fordecay spectroscopy will commence in 2011. A decay spectroscopy station, consisting of a rotatingwheel implantation system for alpha decay spectroscopy, and three high purity germaniumdetectors around the implantation site for gamma-ray detection, has been developed for thispurpose. This paper will report the current status of the laser assisted decay spectroscopy set-upfor the Cris beam line.
1. IntroductionMany experiments in nuclear physics are unable to study rare isotopes due to the presenceof large isobaric contaminations. Of particular interest are the low lying isomers of less than40 keV that cannot easily be distinguished from their ground state. Mass measurements [1]of 80Ga missed the long lived isomer that was discovered with collinear laser spectroscopy [2].Gamma ray spectroscopy provides higher resolution, but cannot distinguish between ground andisomeric states that both decay, such as 80Ga, or those that are too long lived. Furthermore, theresolution may be insufficient to distinguish the states, for example in 73Ga where the 3/2 and1/2 ground state doublet are within <1 keV of each other [3]. Initial decay spectroscopy of 202Frand 204Fr could not differentiate the alpha decay of the isomeric states from those of the ground
Rutherford Centennial Conference on Nuclear Physics IOP PublishingJournal of Physics: Conference Series 381 (2012) 012128 doi:10.1088/1742-6596/381/1/012128
Published under licence by IOP Publishing Ltd 1

state [4]. However, later measurements [5] revealed the low lying structure of these isotopes, butthe tentative spin-parity assignments of these isomers are based on feeding patterns in β+/ECdecay and on systematics. The predicted isomer in 229Th (with an energy of 5.5 eV [6]) has beeninferred [7, 8] and is under investigation [9], but its existence has yet to be proven conclusively.
Isomer identification has already been achieved with in-source laser spectroscopy [10], forexample 68,70Cu. Following this selection, secondary experiments such as Coulomb excitation [11]and mass measurements [12] have been performed on these isomeric beams. However, theseexperiments suffered from the isobaric contamination of surface ionized gallium, as well assignificant ground state contamination due to the Doppler broadening of the hyperfine resonancesof each isomer [13].
The new collinear resonant ionization spectroscopy experiment at Isolde has been developedfor hyperfine structure measurements [14]. Laser radiation is used to step-wise excite andionize an atomic beam using its characteristic hyperfine structure. In addition to hyperfinemeasurements, this technique offers the ability to purify an ion beam that is heavilycontaminated with radioactive isobars, including the ground state of an isotope from itsisomer [15], allowing sensitive secondary experiments to be performed. A decay spectroscopystation is due to be installed at the end of the Cris beam line to take advantage of the selectivityof collinear laser spectroscopy to perform decay measurements on these rare isotopes.
2. Collinear resonant ionization spectroscopy for decay studiesThe status of radioactive ion beam experiments is such that high resolution laser spectroscopymeasurements cannot, in general, currently be performed on short-lived isotopes with yields lessthan 102 ions per second. The Cris technique [16] provides a combination of high detectionefficiency, high resolution and ultra-low background, allowing measurements to be performed onisotopes with yields down to 1 ion per second.
The collinear geometry of the set-up gives a reduction in thermal Doppler broadeningby a factor of ≈ 103, thus the selectivity of the state of interest is greatly increased. Asshown in Equation 1, the product of the velocity and velocity spread remains constant underacceleration. By collinearly overlapping the accelerated ion beam with the laser, a narrowervelocity distribution of the ion beam is probed by the laser, decreasing the Doppler broadenedline width of the hyperfine transition to below its natural width in most cases.
∆E = δ(12mv2) ≈ mvδv = constant (1)
This is apparent in Figure 1(a). The simulated plot shows the hyperfine spectrum of 80g,mGaobtained using in-source and collinear laser spectroscopy. The narrower line widths of thehyperfine transitions produced by the collinear geometry lead to a greater degree of selectivitybetween the ground state and isomeric state of the isotope.
For resonant ionization spectroscopy, the maximum selectivity S is given by Equation 2:
S =(∆ωAB
Γ
)2=∏
Sn (2)
where Γ is the radiation line width and ∆ωAB is the difference in frequency between thetwo absorption lines due to the isomer shift, schematically shown in Figure 1(b). Additionalselectivity can be gained due to the kinematic shift of the isotopes caused by the collineargeometry. The total selectivity of a resonant ionization process is given by the product of theindividual selectivities. Thus increasing the number of resonant transitions in the ionizationscheme will greatly increase the selectivity of the process [13], as can be seen in Figure 1(c).
Techniques such as mass spectrometry do not have the energy resolution to distinguishbetween two low lying states, or they saturate due to the abundance of the ground state
Rutherford Centennial Conference on Nuclear Physics IOP PublishingJournal of Physics: Conference Series 381 (2012) 012128 doi:10.1088/1742-6596/381/1/012128
2
compared to the isomeric state, making measurements of nuclear parameters problematic. Withthe combination of collinear laser spectroscopy and resonant ionization available at Cris, decayspectroscopy can be performed on pure isomeric states, with a suppression of the ground stateby a factor of at least 104 per resonant transition. Indeed, by using a three step ionizationscheme (instead of two) the suppression would increase to 108.
(a)
Ground stateGS
E1
E2
IP
S1
S2
Isomer
Ground state Isomer
(b)
Ground stateGS
E1
E2
IP
S1
S2
Isomer
Ground state Isomer
(c)
Figure 1. [Colour online] (a) A simulated scan of the hyperfine structure of 80g,mGa thatwould be obtained using in-source [dashed blue] and collinear [solid blue and dashed red] laserspectroscopy. A Doppler broadened line width of 100 MHz is assumed, with the data for 80g,mGataken from [3]. (b) The difference in frequency ∆ωAB between two absorption lines, due to theisomer shift. (c) The number of resonant transitions increases the selectivity of the process.
3. Nuclear measurements with laser and decay spectroscopyLaser spectroscopy of an isotope’s hyperfine structure provides model independent measurementsof nuclear observables: nuclear spin, magnetic dipole and electric quadrupole moments, and thechange in mean square charge radii between isotopes. Using the selectivity of resonant ionization,isobaric contaminants are suppressed, allowing decay spectroscopy to be performed. Decayspectroscopy provides complementary information on the nuclear level structure of the daughternucleus. The combination of the two complementary techniques present at the Cris beam lineallows a wealth of information to be obtained on the isotope under investigation.
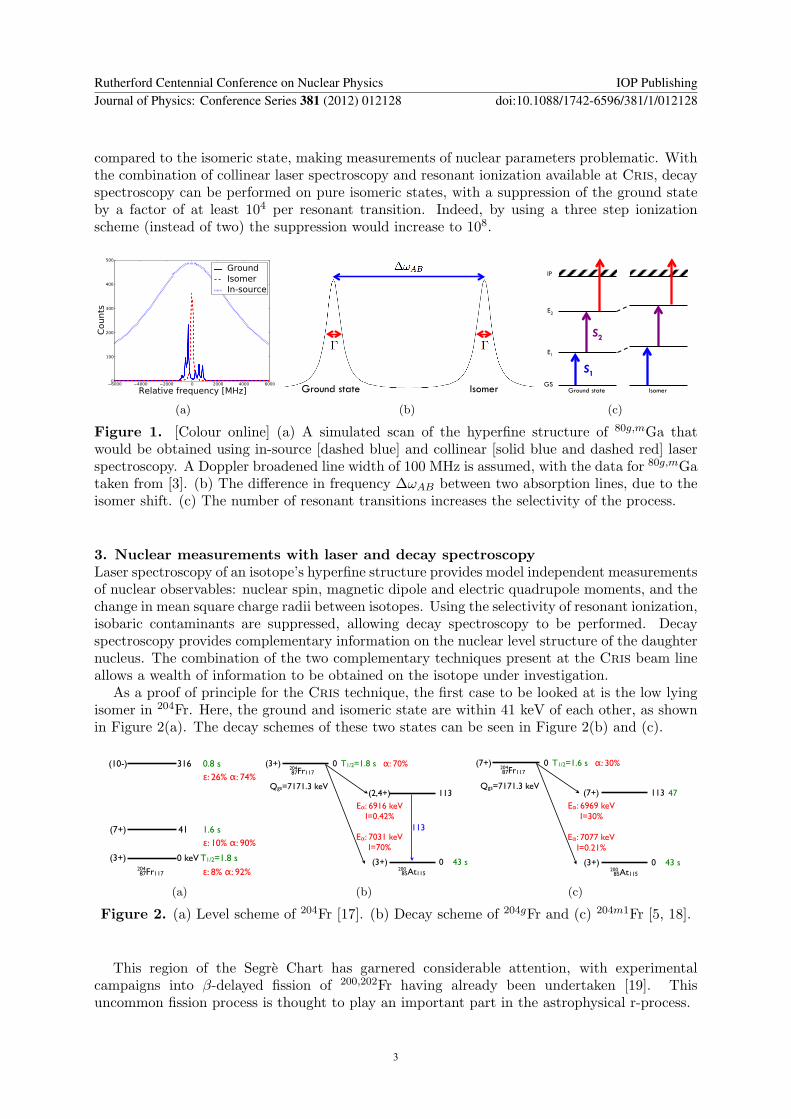
As a proof of principle for the Cris technique, the first case to be looked at is the low lyingisomer in 204Fr. Here, the ground and isomeric state are within 41 keV of each other, as shownin Figure 2(a). The decay schemes of these two states can be seen in Figure 2(b) and (c).
(3+)
(7+)
(10-)
0 keV
41
316
T1/2=1.8 s
1.6 s
0.8 s
87Fr117204 ε: 8% α: 92%
ε: 10% α: 90%
ε: 26% α: 74%
(a)
(3+) 0 T1/2=1.8 s87Fr117
204α: 70%
113
085At115
200
(2,4+)
(3+)
Eα: 6916 keVI=0.42%
Qgs=7171.3 keV
43 s
Eα: 7031 keVI=70%
113
(b)
(7+) 0 T1/2=1.6 s87Fr117
204α: 30%
113
085At115
200
(7+)
(3+)
Eα: 6969 keVI=30%
Qgs=7171.3 keV
43 s
Eα: 7077 keVI=0.21%
47
(c)
Figure 2. (a) Level scheme of 204Fr [17]. (b) Decay scheme of 204gFr and (c) 204m1Fr [5, 18].
This region of the Segre Chart has garnered considerable attention, with experimentalcampaigns into β-delayed fission of 200,202Fr having already been undertaken [19]. Thisuncommon fission process is thought to play an important part in the astrophysical r-process.
Rutherford Centennial Conference on Nuclear Physics IOP PublishingJournal of Physics: Conference Series 381 (2012) 012128 doi:10.1088/1742-6596/381/1/012128
3
The different spins and moments result in hyperfine structures that will significantly differin magnitude, allowing the isomers and ground state to be distinguished. The provisionalassignments of the 3+ ground state and 7+, 10− isomeric states will result in different hyperfinespectra. In addition, the three states will display spectra with an isomer shift due totheir different distribution of charge. Predictions for magnetic moments based on systematicmeasurements in the region can give insight into where the hyperfine resonances will occur.
By locking the laser onto resonance with a characteristic hyperfine transition, decayspectroscopy measurements can be conducted on pure beams, allowing the energies of thealpha particles and gamma rays emitted, and the lifetime of the states, to be unambiguouslydetermined. From hyperfine structure measurements, unequivocal values for the spin of thestates will be determined, furthering the work previously done in this area [5].
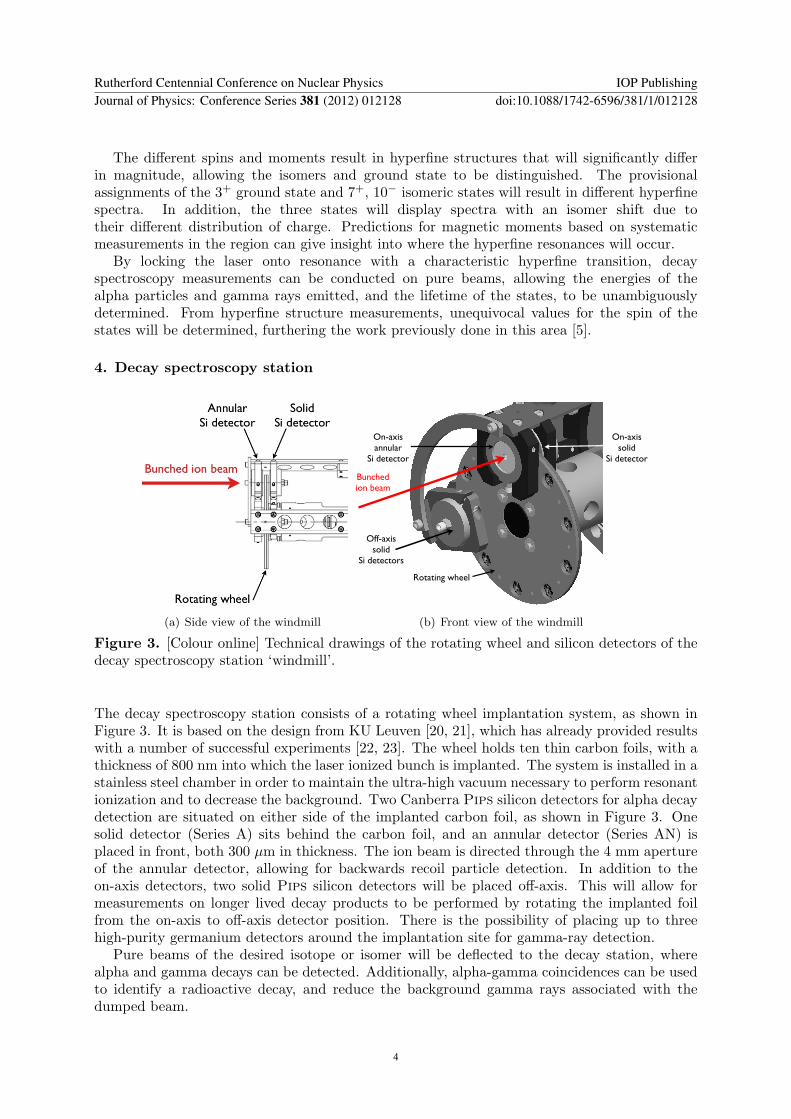
4. Decay spectroscopy station
(a) Side view of the windmill
Bunched ion beam
Annular Si detector
Solid Si detector
Rotating wheel
On-axis annular
Si detector
On-axis solid
Si detector
Off-axis solid
Si detectors
(b) Front view of the windmill
Figure 3. [Colour online] Technical drawings of the rotating wheel and silicon detectors of thedecay spectroscopy station ‘windmill’.
The decay spectroscopy station consists of a rotating wheel implantation system, as shown inFigure 3. It is based on the design from KU Leuven [20, 21], which has already provided resultswith a number of successful experiments [22, 23]. The wheel holds ten thin carbon foils, with athickness of 800 nm into which the laser ionized bunch is implanted. The system is installed in astainless steel chamber in order to maintain the ultra-high vacuum necessary to perform resonantionization and to decrease the background. Two Canberra Pips silicon detectors for alpha decaydetection are situated on either side of the implanted carbon foil, as shown in Figure 3. Onesolid detector (Series A) sits behind the carbon foil, and an annular detector (Series AN) isplaced in front, both 300 µm in thickness. The ion beam is directed through the 4 mm apertureof the annular detector, allowing for backwards recoil particle detection. In addition to theon-axis detectors, two solid Pips silicon detectors will be placed off-axis. This will allow formeasurements on longer lived decay products to be performed by rotating the implanted foilfrom the on-axis to off-axis detector position. There is the possibility of placing up to threehigh-purity germanium detectors around the implantation site for gamma-ray detection.
Pure beams of the desired isotope or isomer will be deflected to the decay station, wherealpha and gamma decays can be detected. Additionally, alpha-gamma coincidences can be usedto identify a radioactive decay, and reduce the background gamma rays associated with thedumped beam.
Rutherford Centennial Conference on Nuclear Physics IOP PublishingJournal of Physics: Conference Series 381 (2012) 012128 doi:10.1088/1742-6596/381/1/012128
4

Measurements of the attenuation of the steel chamber and the steel windmill were carriedout using a 70% GC7020 Canberra High purity germanium detector. The percentage of thegamma rays attenuated by the steel wall of the decay spectroscopy station chamber is shown inFigure 4. This was calculated by measuring the gamma rays of several sources (241Am, 152Euand 60Co) at a given distance, first with the source inside the steel chamber and then in freespace. As can be seen in Figure 4, more than 92% of the 59 keV gamma rays were attenuatedby the steel walls, and 52% of the 123 keV gamma rays. At energies higher than 591 keV, nomore than 18% of the gamma rays are stopped by the steel.
Figure 4. The percentage of gamma rays attenuated by the steel wall of the decay spectroscopystation chamber. Lower energy gamma rays are almost completely stopped by the steel chamberwall, but higher energy rays are only partially attenuated.
(a) Gamma spectrum (b) The 60Co lines
Figure 5. [Colour online] The attenuation of the gamma rays due to the steel windmill. Theblue spectrum shows a 60Co source in front of the germanium detector and a 152Eu source at120◦ to it. The red spectrum shows the 152Eu source in front, and 60Co at 120◦.
The attenuation of the gamma rays by the steel windmill itself was investigated. Two sources,60Co and 152Eu, were attached to the rotating windmill, with 120◦ separating the two sources,and a gamma spectrum was taken at the two different positions. The blue spectrum shows the60Co source directly in front of the germanium detector and the 152Eu source at 120◦ to it.In contrast, the red spectrum shows the 152Eu source in front of the detector and the 60Co at120◦ to it. From Figure 5(b), it can be seen that the characteristic 60Co lines are significantlydecreased when the 60Co source is rotated away from the germanium detector, indicating thatthe steel windmill attenuates the gamma rays that are produced off-axis by a factor of 10.
Energy resolution tests were performed on the solid Canberra Pips silicon detector. A 4 kBqquadruple-alpha source, containing the radioactive isotopes 148Gd, 239Pu, 241Am and 244Cm
Rutherford Centennial Conference on Nuclear Physics IOP PublishingJournal of Physics: Conference Series 381 (2012) 012128 doi:10.1088/1742-6596/381/1/012128
5

was used, attached in the position of a carbon foil. At 5.485 MeV, the energy resolution wasdetermined to be 17.77 ± 0.18 keV, agreeing favourably with the manufacturer’s resolution of18 keV. Figure 6 shows the alpha spectrum obtained from these tests on the solid silicon detector.
Figure 6. Alpha spectrum of a quadruple-alpha source for the solid silicon detector.
5. OutlookThe current set-up uses analogue electronics and an ADC for data acquisition. A digital dataacquisition system is due to be implemented, using DGF modules and a dedicated acquisitionprogramme. The first experiment will study neutron-deficient francium isotopes, and futurecampaigns will involve isotopes previously hidden because of large isobaric contaminations.
AcknowledgmentsMeasurements were performed on the decay spectroscopy station by two students from KULeuven, S De Schepper and K Dewolf, as part of their Bachelor’s Project. We thank theIsolde technical group and the KU Leuven technical staff for their support and assistanceduring this work.
References[1] Hakala J et al. 2008 Phys. Rev. Lett. 101(5) 052502[2] Cheal B et al. 2010 Phys. Rev. C 82(5) 051302[3] Cheal B et al. 2010 Phys. Rev. Lett. 104(25) 252502[4] Hornshoj P, Hansen P and Jonson B 1974 Nucl. Phys. A 230 380 – 392[5] Huyse M et al. 1992 Phys. Rev. C 46(4) 1209–1217[6] Guimaraes Filho Z O and Helene O 2005 Phys. Rev. C 71(4) 044303[7] Kroger L and Reich C 1976 Nucl. Phys. A 259 29 – 60[8] Burke D G et al. 1990 Phys. Rev. C 42(2) R499–R501[9] Tordoff B et al. 2006 Hyperfine Interact. 171(1) 197–201
[10] Weissman L et al. 2002 Phys. Rev. C 65(2) 024315[11] Stefanescu I et al. 2007 Phys. Rev. Lett. 98(12) 122701[12] Van Roosbroeck J et al. 2004 Phys. Rev. Lett. 92(11) 112501[13] Cheal B and Flanagan K T 2010 J. Phys. G 37 113101[14] Billowes J et al. 2008 CERN-INTC-2008-010. INTC-P-240 CERN Geneva[15] Letokhov V 1973 Opt. Commun. 7 59 – 60[16] Procter T 2011 Rutherford conference proceedings[17] Chiara C and Kondev F 2010 Nuclear Data Sheets 111 141 – 274[18] Uusitalo J et al. 2005 Phys. Rev. C 71(2) 024306[19] Andreyev A N et al. 2008 CERN-INTC-2008-001, INTC-P-235 CERN Geneva[20] Dendooven P 1992 Ph.D. Thesis Katholieke Universiteit Leuven[21] Cocolios T E 2010 Ph.D. Thesis Katholieke Universiteit Leuven[22] Andreyev A N et al. 2010 Phys. Rev. Lett. 105(25) 252502[23] Cocolios T E et al. 2010 J. Phys. G 37 125103
Rutherford Centennial Conference on Nuclear Physics IOP PublishingJournal of Physics: Conference Series 381 (2012) 012128 doi:10.1088/1742-6596/381/1/012128
6