land development risk analysis for multimodal transportation
TRANSCRIPT

VIRGINIA CENTER FOR TRANSPORTATION INNOVATION AND RESEARCH
530 Edgemont Road, Charlottesville, VA 22903-2454
www. VTRC.net
Land Development Risk Analysisfor Multimodal TransportationCorridorshttp://www.virginiadot.org/vtrc/main/online_reports/pdf/12-r7.pdf
JAMES H. LAMBERT, Ph.D., P.E.Associate Director, Center for Risk Management of Engineering SystemsandResearch Associate Professor of Systems and Information Engineering
Graduate Research Assistant
Graduate Research Assistant
Center for Risk Management of Engineering SystemsUniversity of Virginia
SHITAL A. THEKDI
QIAN ZHOU
Final Report VCTIR 12-R7

Standard Title Page - Report on Federally Funded Project 1. Report No.: 2. Government Accession No.: 3. Recipient’s Catalog No.: FHWA/VCTIR 12-R7
4. Title and Subtitle: 5. Report Date: Land Development Risk Analysis for Multimodal Transportation Corridors December 2011
6. Performing Organization Code:
7. Author(s): James H. Lambert, Ph.D., P.E. Shital A. Thekdi, and Qian Zhou
8. Performing Organization Report No.: VCTIR 12-R7
9. Performing Organization and Address: Virginia Center for Transportation Innovation and Research 530 Edgemont Road Charlottesville, VA 22903
10. Work Unit No. (TRAIS): 11. Contract or Grant No.: 95105/95129
12. Sponsoring Agencies’ Name and Address: 13. Type of Report and Period Covered: Virginia Department of Transportation 1401 E. Broad Street Richmond, VA 23219
Federal Highway Administration 400 North 8th Street, Room 750 Richmond, VA 23219-4825
Final Contract 14. Sponsoring Agency Code:
15. Supplementary Notes: 16. Abstract: Adjacent land development can compromise the performance of multimodal transportation facilities and increase the costs of maintaining or increasing capacities. There is an increasing need for jurisdictions to focus scarce funding on the corridors with the highest risk of land development and greatest potential for excess cost and regret. Escalating land values along with uncertainties in cost and public perception require that the agency proactively address future development along multimodal corridors to avoid surprise, regret, and belated action. This study integrated several risk and reliability models in order to predict land development and suggest priorities for risk management on the 5,700-mile multimodal system known as the Virginia Statewide Mobility System (SMS). Access point densities were counted and analyzed along the SMS, the related Corridors of Statewide Significance, and several parallel corridors. The access point analysis along with expert evidence was used to quantify consequences related to corridor protection.
The study used more than 40 GIS data layers obtained from federal, state, and commercial entities including the Virginia Department of Transportation, U.S. Census Bureau, National Land Cover Database satellite imagery, and others. The study aggregated the layers in several expert perspectives to suggest priority corridor sections for risk management. No single perspective would be adequate. The analysis included eliciting factors most influencing land development; identifying key combinations of factors; quantifying the relative potential for volatile development of individual corridor sections; testing sensitivity of results to scenarios, assumptions, and emergent conditions; estimating a time to development; and describing strategic actions to minimize regret or excess cost. The result is an evidence-based method that will enable state planners to compare, prioritize, and benchmark needs for risk management over adjacent lands for thousands of miles of corridor. 17 Key Words: 18. Distribution Statement: Transportation, corridors, development, vulnerable, protection No restrictions. This document is available to the public
through NTIS, Springfield, VA 22161.
19. Security Classif. (of this report): 20. Security Classif. (of this page): 21. No. of Pages: 22. Price: Unclassified Unclassified 74
Form DOT F 1700.7 (8-72) Reproduction of completed page authorized

FINAL REPORT
LAND DEVELOPMENT RISK ANALYSIS FOR MULTIMODAL TRANSPORTATION CORRIDORS
James H. Lambert, Ph.D., P.E. Associate Director
Center for Risk Management of Engineering Systems and
Research Associate Professor of Systems and Information Engineering
Shital A. Thekdi Graduate Research Assistant
Qian Zhou
Graduate Research Assistant
Center for Risk Management of Engineering Systems University of Virginia
VCTIR Project Manager John S. Miller, Ph.D., P.E.
Virginia Center for Transportation Innovation and Research
In Cooperation with the U.S. Department of Transportation Federal Highway Administration
Virginia Center for Transportation Innovation and Research (A partnership of the Virginia Department of Transportation
and the University of Virginia since 1948)
Charlottesville, Virginia
December 2011 VCTIR 12-R7

ii
DISCLAIMER
The project that is the subject of this report was done under contract for the Virginia Department of Transportation, Virginia Center for Transportation Innovation and Research. The contents of this report reflect the views of the author(s), who is responsible for the facts and the accuracy of the data presented herein. The contents do not necessarily reflect the official views or policies of the Virginia Department of Transportation, the Commonwealth Transportation Board, or the Federal Highway Administration. This report does not constitute a standard, specification, or regulation. Any inclusion of manufacturer names, trade names, or trademarks is for identification purposes only and is not to be considered an endorsement.
Each contract report is peer reviewed and accepted for publication by staff of Virginia
Center for Transportation Innovation and Research with expertise in related technical areas. Final editing and proofreading of the report are performed by the contractor.
Copyright 2011 by the Commonwealth of Virginia. All rights reserved.

iii
ABSTRACT
Adjacent land development can compromise the performance of multimodal transportation facilities and increase the costs of maintaining or increasing capacities. There is an increasing need for jurisdictions to focus scarce funding on the corridors with the highest risk of land development and greatest potential for excess cost and regret. Escalating land values along with uncertainties in cost and public perception require that the agency proactively address future development along multimodal corridors to avoid surprise, regret, and belated action.
This study integrated several risk and reliability models in order to predict land development and suggest priorities for risk management on the 5,700-mile multimodal system known as the Virginia Statewide Mobility System (SMS). Access point densities were counted and analyzed along the SMS, the related Corridors of Statewide Significance, and several parallel corridors. The access point analysis along with expert evidence was used to quantify consequences related to corridor protection.
The study used more than 40 GIS data layers obtained from federal, state, and commercial
entities including the Virginia Department of Transportation, U.S. Census Bureau, National Land Cover Database satellite imagery, and others. The study aggregated the layers in several expert perspectives to suggest priority corridor sections for risk management. No single perspective would be adequate. The analysis included eliciting factors most influencing land development; identifying key combinations of factors; quantifying the relative potential for volatile development of individual corridor sections; testing sensitivity of results to scenarios, assumptions, and emergent conditions; estimating a time to development; and describing strategic actions to minimize regret or excess cost. The result is an evidence-based method that will enable state planners to compare, prioritize, and benchmark needs for risk management over adjacent lands for thousands of miles of corridor.

1
FINAL REPORT
LAND DEVELOPMENT RISK ANALYSIS FOR MULTIMODAL TRANSPORTATION CORRIDORS
James H. Lambert, Ph.D., P.E.
Associate Director Center for Risk Management of Engineering Systems
and Research Associate Professor of Systems and Information Engineering
Shital A. Thekdi
Graduate Research Assistant
Qian Zhou Graduate Research Assistant
Center for Risk Management of Engineering Systems
University of Virginia
INTRODUCTION
Multimodal transportation facilities and plans are increasingly affected by land development along rapidly evolving corridors. The land development process on transportation corridors involves preparation of future land use and transportation plan components of the locality comprehensive plan, rezoning of land, review of site plans for commercial development, review of subdivision plats for residential development, points of interest, real estate data, public utilities, right of way, managing access to the corridor, acceptance of new facilities to the statewide secondary system, and the transportation facilities themselves. It is critical that planners anticipate future development to avoid surprise, regret, and belated action. With many thousands of miles of undeveloped corridors across Virginia, state agencies and regional planners need to prioritize the corridors and corridor sections most in need of immediate attention. Timely action includes coordination among the state, regions, localities and developers to identify and protect vulnerable corridor sections for future road, pedestrian and bicycle facilities, and intermodal facilities.
The Virginia Department of Transportation (VDOT) in particular can provide localities with valuable assistance in understanding how land development can impact transportation corridors. The harmful impacts include the creation of congestion, increasing traffic crash rates, and costly retrofits. VDOT can advise localities on what measures can be taken to prevent such impacts. However, impediments could exist to VDOT’s involvement if localities have out-of-date comprehensive plans, lack proper zoning and subdivision regulations, not share their future land use and transportation plans for developing corridors with VDOT, or not forward land

2
development proposals to VDOT to review and advise on the transportation impacts. Additionally, impediments could exist if localities do not take advantage of opportunities to advise land development applicants during the rezoning, site plan, and subdivision plat approval process of the necessary spacing for entrances to meet the access management regulations as authorized in § 33.1-198.1 of the Code of Virginia. This could lead to developer confusion and resistance to making changes when VDOT reviews entrance permit applications and to developers requesting exceptions to the access management entrance spacing standards.
The uncertainties in the benefits and costs of protection suggest a risk-based prioritization
of land development that could be most consequential for the infrastructure. A risk-based approach could address uncertainties in time and location of land development, high costs of legal fees if land must be purchased, costly retrofits, uncertainties in costs to purchase additional land, political and social costs, as well as increased consumption of time and resources in fiscally constrained agencies. Past efforts developed forecasts of the risk of land-development to transportation assets for the primary systems in several Virginia counties.1 VDOT and the statewide multimodal planning process (VTrans) have focused on land use and access management in corridor analyses with 2- and 20-year horizons, with less attention to the 5-to-10-year horizon. In a compatible direction, the policy neutral risk-based approach described in this report furthers initiatives of the Partnership for Sustainable Communities, a partnership among the U.S. Department of Housing and Urban Development (HUD), U.S. Department of Transportation (DOT), and U.S. Environmental Protection Agency (EPA) by working to lower transportation costs, promote reliable access to employment, and leverage federal policies.
To ensure safety, minimize congestion, and extend the useful life of existing infrastructure,
VDOT is working to establish a comprehensive access management program that includes corridor protection. At present, right-of-way purchases are managed in the project development process of VDOT’s Six-Year Improvement Program2 and State Transportation Improvement Program (STIP).3 Furthermore, the enactment of the Secondary Street Acceptance Requirements (SSAR) in 2009 requires local governments to provide additional land development planning information to VDOT. The SSAR includes new requirements for the acceptance of streets into the secondary system of state highways. Because Virginia is a geographically and socially diverse state, these requirements vary, based upon the area type within which a development is located. Since some area type boundaries are based upon local planning boundaries that information must be provided to VDOT, which is then required to publish it so that the state’s citizens can determine what area type’s requirements apply to a particular development.
Land use has been a required consideration for the past 50 years through federal legislation
including the 1962 Federal-Aid Highway Act, ISTEA, TEA-21, and SAFETEA-LU requiring states and metropolitan planning organizations (MPOs) to focus on the relationships between transportation and land use. The Code of Virginia requires localities to maintain a comprehensive plan and include a transportation plan that functionally classifies roads as part of the comprehensive plan. Chapter 527 of the 2006 Acts of Assembly (§ 15.2-221.1) directs VDOT to promulgate regulations for the implementation of these requirements. The Code of Virginia legislation included the following specific goals:

3
§ 15.2-2223 Code of Virginia: Comprehensive plan to be prepared and adopted; scope and purpose.4
§ 15.2-2222.1 Code of Virginia: Coordination of state and local transportation planning. This section also requires localities to submit traffic impact statements along with proposed rezonings, site plans, subdivision plats, and subdivision development plans that will substantially affect transportation on state-controlled highways to VDOT for comment by the agency.5
§ 15.2-2223.1 Code of Virginia: Comprehensive plan to include urban development areas.6
It is possible that Chapter 527 legislation will be limited in its effectiveness without soon achieving (1) a 5-to-10-year forecast and action horizon, and (2) appropriate benchmarking across a statewide system. Current approaches are ad hoc lacking quantitative methods and based on variable intuition and knowledge of local jurisdictions.
The Dulles Metrorail project in Washington, D.C., is an example of the impacts of adjacent land development to the costs of developing and maintaining infrastructure systems. This 23-mile extension of the Metrorail system operated by the Washington Metropolitan Area Transit Authority is being constructed through two of the largest employment centers in Virginia. A large cost portion of this $5.25 billion project could have been avoided through proactive planning and risk management, such as that described in this report.7
With the stated motivation, this study investigated whether a parametric model integrating
diverse sources of currently available data can forecast development with a 10-year horizon on a statewide scale. Thus, this report demonstrates the coordination of multiple layers of modeling to address the risks of land development adjacent to the multimodal corridors of Virginia, specifically the Statewide Mobility System (SMS) and the Corridors of Statewide Significance (CoSS). The report provides a method that can support strategic decisions in the planning process, reduced costs to localities, and long-range action plans that are coordinated among agencies and developers. This report describes activities that are unique in the nation to address access management in a risk-based process, where the following is addressed through systemic modeling: What are the sources of land-development risk to the transportation system? What are the relative likelihoods? What are the potential consequences and horizons? What can be done? What is most effective balancing costs, benefits, and risks? What are the impacts of current actions (or inaction) to the future options?
There were seven objectives of this study: (1) review of the literature; (2) development of
a predictive model of land development adjacent to corridors; (3) application to selected corridors of the SMS; (4) inventory of existing access points; (5) analysis of data layers in support of land development initiatives and programs; (6) recommendations developed with VDOT and regions; and (7) training materials, presentations, and technology transfer.

4
PURPOSE AND SCOPE
There is a critical need for methods to forecast incipient land development for the 5,700-mile SMS and CoSS on a horizon of 5 to 10 years. This includes the need to identify for the SMS the corridor database for the process of acceptance of new secondary roads to the state-maintained system. The interested agencies and entities are VDOT’s Transportation and Mobility Planning Division (TMPD), the Virginia Center for Transportation Innovation and Research, and Virginia MPOs and planning district commissions.
The purpose of this study was to develop a risk-based methodology to identify and
prioritize sections of statewide transportation corridor that are vulnerable to adjacent land development in the 10-year time horizon. The components of the purpose are:
Develop a risk-based methodology to forecast land development adjacent to the SMS and CoSS and prioritize corridor segments for investment.
Determine where to commission detailed corridor studies, fund specific access management activities, seek proffers from owners and developers, locate urban development areas, and seek improved subdivision ordinances.
Enable results to be correlated to project selection and programming (STIP and
VDOT’s Six-Year Improvement Program) discussions and decision making
Demonstrate the model and facilitate application by VDOT and other transportation agencies into the future.
The geographic scope of effort is transportation corridors within Virginia as shown in
Table 1. The SMS consists of a 5,700-mile collection of National Highway System (NHS) corridors, hurricane evacuation routes, multilane primaries providing regional connectivity, and other vital links between jurisdictions. Specific corridors included in the SMS are listed in Appendix A. The SMS borders five states (Maryland, West Virginia, Kentucky, Tennessee, and North Carolina) and joins 95 counties and 39 independent cities. Additionally, over 43,000 census blocks are adjacent to the SMS. The SMS accounts for 8% of Virginia highway miles but accounts for 66% of vehicle miles traveled.8
Table 1. Statewide Mobility System corridor types
Corridor Type Miles
Eisenhower Interstate 1,110
Intermodal Connector 35
Major Strategic Highway Network Connector 69
Not Part of NHS 2,368
Other Principal Arterial 1,797
Strategic Highway Network (STRAHNET) 482
Total Miles 5,860

5
In parallel, the geographic scope of the study includes the CoSS of Virginia’s multimodal planning effort VTrans. The CoSS are composed of 11 corridors.9 These multimodal corridors include highways, rail lines, transit services, port facilities, and airports. The CoSS are:
Washington to North Carolina Corridor Crescent Corridor East-West Corridor Northern Virginia Connector Western Mountain Corridor Heartland Corridor Seminole Corridor Southside Corridor Northern Neck Corridor Eastern Shore Corridor North Carolina to West Virginia Corridor.
METHODS
Overview
A risk-based methodology to support the identification, prioritization, and protection of transportation corridor sections in Virginia that could face significant development in 10 years was developed in this study. The tasks of the developed methodology were as follows:
Task 1: Identify factors to comprise a predictive model. Task 2: Create the land development model. Task 3: Understand strategic actions that minimize regret. Task 4: Sensitivity of results to scenarios, assumptions, and emergent conditions. Task 5: Create access point data set and analysis.
Detail of Methods
The methodology was applied to a case study of the SMS and CoSS. The details of each task are as follows.
Task 1: Identify Factors to Comprise a Predictive Model This effort developed a predictive model combining diverse data of population and employment, conservation and preservation, facilities and geometries, real-estate transactions, and others. The developed predictive model includes the following subtasks:
Definition of scope

6
Elicitation of factors most influencing land development Combinations of factors influencing land development.
Definition of Scope
Answering several questions helped to focus the research effort and shape the remainder of the steps in the methodology. These questions are as follows:
What is the analysis trying to determine/identify? Who are the stakeholders and what are their interests? What is the geographical scale and study area? How will the results be analyzed?
The investigation was focused to aid corridor preservation strategies in areas not intensely developed but those expected to experience pressure to develop within the next 10 years. The corridors for analysis were chosen because of (1) multimodal significance, (2) critical evacuation routes, (3) key links between jurisdictions, and (4) federal importance. Elicitation of Factors Most Influencing Land Development
The first step in the risk assessment of this problem is defining factors that most influence adjacent land development. The effort located multiple sources of accurate, consistent, and digitalized data covering large regional areas. The data sources were studied and possible relevant factors were noted for discussion. With many large-scale data options available, the determination of the most relevant or most useful factors is performed through eliciting large lists of factors and filtering to determine the most important factors.
In situations involving uncertainty of a system with limited data, expert elicitation is a
valuable resource to gain insight on the fundamental mechanisms of the system.10 The expert elicitation used consists of gathering expert planners and economic development officials to discuss the relevant factors, costs, and opportunities in the system being modeled. The experts need to be knowledgeable about substantive issues and probability elicitation, but do not require extensive knowledge of the probability concepts discussed in this report. The expert elicitation occurred with the project steering committee including senior VDOT TMPD planners, VDOT information specialists, and multimodal strategic planning committee members. Color coded maps of individual factors and combinations of factors for census blocks surrounding SMS corridors were printed and evaluated with the steering committee. Table 2 shows a comprehensive list of relevant factors. The relevant factors as determined through expert elicitation included property values; population and projected population; jobs housing ratio; federal lands, schools and protected areas; historically underutilized business zones; past land use change (as determined by satellite imagery); parcels under restriction—public trust, historic sites, agricultural and forestall districts, parcels under conservation easement, wetlands, public infrastructure, contaminated sites, and federal, state, and county parks; Historically Underutilized Business Zones (HUBZones); and parcels Economically Suitable for Development. Use of zoning data, often a major determinant of development, was considered for inclusion in the analysis but was omitted for several reasons.

7
First, zoning layers are not uniformly available statewide. One of the central goals of this research was to develop a general methodology based on data available in all counties statewide so that it would easily be repeatable.
Filtering of influential factors is done through modeling the factors in a scenario-based
influence diagram. An influence diagram graphically represents a probabilistic model with a set of random variables and their conditional interdependencies. The use of influence diagrams simplifies discussion with experts by focusing the discussion around particular states of factors facilitated by a graphical format without use of mathematical analysis. Expert elicitation included a discussion of each potential factor and the roles of each factor in land use change along transportation corridors specifically within Virginia.
Table 2. Inventory of data collected for predictive model of land development Factor Source Population U.S. Census Bureau Population forecast Virginia Workforce Connection Unemployment Bureau of Labor Statistics Land value City-data.com Suburban urban rural classification Virginia Department of Transportation Federal lands Virginia Department of Conservation and Recreation Protected lands Virginia Department of Conservation and Recreation Slope U.S. Geological Survey National Land Cover Database Named Streams and Rivers, Drainage Systems, Bridges, Landmarks, Parks, Institutions, Cemeteries, Railroads, Utilities, Legislative districts, Planning districts
Public sources and University of Virginia Library (Scholars Lab)
Farm density U.S. Census Bureau Urban areas U.S. Census Bureau Personal Income Bureau of Economic Analysis Residential construction building permits
Department of Housing and Urban Development
HUBZones Department of Housing and Urban Development Jobs Virginia Employment Commission Housing units U.S. Census Bureau
Figure 1 shows identification of the influential factors. It can been seen that the time to development is most influenced by population, population forecast, employment centers, land values, and undervalued land, while several interdependencies of these factors exist. Decisions involving management of access points, access to public transportation, and other steps in infrastructure management have the greatest influence on the financial costs and opportunities in this study. The costs for protection are mostly influenced by costs of right of way, legal fees, necessary operational changes, and access management.

8
Figure 1. Factors contributing to transportation infrastructure vulnerable to adjacent land development
The several perspectives of the factor-level influence of land development are: Demographic factors: population density, population forecast, unemployment Economic factors: jobs housing ratio, employment forecast, historically underutilized
business zones Land-use factors: land value, suburban urban rural classification Suitability-for-development factors: federal lands, protected lands, slope.
Combinations of Factors Influencing Land Development
Reliability analysis, which aims to reduce the probability of an adverse event, clarifies combinations of factors leading to maximum regret. Regret is defined by financial consequences that could have been avoided through access management, right of way acquisition, or other proactive actions. Fault tree analysis is particularly useful by linking the system failure event (unforeseen land development) with the failure events through logic gates. As the fault tree expands, important filtered factors from the previous step are identified at the bottom of the diagram. Cut sets are identified by defining unique combinations of factors that combine for regret to occur. Minimal cut sets identify the minimum number of factors that cause the regret. Algorithms and other mathematical methods exist to define the minimal cut set in order to reduce the number of failure modes to those that must occur for maximum regret.
Figure 2 shows the causes of development as combinations of one or more of the factor
groups of economic, environmental, and political causes. Each type of factor was then further analyzed using “or” gates to signify one or more causes of regret-causing events. For example,

9
political causes include the impact of tax incentives to promote commercial activity, property tax regulations, or the effects of other types of government regulated policy. Environmental causes include the factors of climate/land and transportation access. Access to water, soil quality, slope, conservation issues, or others may greatly influence development. Transportation access can include the impacts of road quality, road usage, community access to public transportation, or the cost of the public transportation. The economic impact includes the number of employments, employment and population growth forecasts, land values, or others. Minimal cut sets were then determined to reduce the number of failure modes to those that must occur for maximum regret.
Figure 2. How selected factors can combine to result in maximum regret for transportation infrastructure vulnerable to adjacent land development Task 2: Create the Land Development Model The developed land development model includes the following subtasks:
Quantification of potential for development Conceptual modeling of time to development.
Quantification of Potential for Development
Given the scarcity of the necessary quality of data covering large regional areas over long periods of time, traditional time series and regression models are inappropriate for large-scale studies. For example, although population records are easily available with data prepared every 10 years, other types of data are not. Land values may not be located in existing statewide databases which furthermore may contain only current values, thereby not allowing for trend analyses.

10
A baseline scenario for likelihood of land development along each block of land adjacent to a particular corridor is computed using elicited relative influences between factors to compute probability parameters. Using this information, rule-based modeling aids in the quantification of the elicited probabilities. This method enables analysts and experts to clearly communicate the relationships between factors and elicited probabilities through direct if-then type statements. For example, a statement such as
IF Population Forecast = High AND Access to Transportation = High, THEN Likelihood of Development = High
clearly states the relationship in natural language. In order to perform the rule-based modeling, the data for each influential factor requires the assignment of none, low, medium, or high influence values. The data values for some factors require transformation to emulate the expert elicited relative influence. For example, average land values near a particular “sweet spot” could be most influential, thereby requiring transformation in order to assign the highest influence to values near the sweet spot. However, final data files do not reflect land value transformation.
Figure 3 shows the estimated likelihood in the baseline scenario of land development along the corridors of the Virginia SMS. The darker areas have the highest likelihood of development within 1 mile of the corridor while the lighter areas have the lowest likelihood. Using the data and influence diagram output described above, spatial analysis is used to estimate likelihood of land development for relatively small sections of corridor and create graphical scalable outputs.
Figure 3. Likelihood of land development along transportation infrastructure vulnerable to adjacent land development for the Virginia Statewide Mobility System

11
Conceptual Modeling of Time to Development
Figure 4 shows a use of state-transition models in understanding of the transitioning of states leading to regret from adjacent land development. It is assumed that at any given time, the corridor adjacent to a given block of land is either functioning normally or in a failed state. A normally functioning corridor is any corridor in which there is no current regret. The states are defined as the following: A block developed with no protection, undeveloped with no protection, undeveloped with protection, and developed with protection. The failed state of regret occurs when a block is developed with no protection. The approach considers that corridor protection restores land to a condition of no regret. For example, although the state of developed with protection can be reached from undeveloped with protection and developed with no protection, the time spent in developed with protection will not be dependent on the previous state. The transition diagram can be further reduced to two states signifying a normal state and a failed state. Transition probabilities and times between states are estimated based on the values of qualitative and quantitative factors as described in the likelihood of development section.
Figure 4. Transition diagram of development states for transportation infrastructure vulnerable to land development
This conceptual model is similar to the Pontis model that is used widely to describe conditions of highway bridges. Parameter values in Pontis are estimated across a large inventory of existing facilities. In the case of land development the parameter values could differ from region to region, to be explored in future effort. The statistical properties of the state diagram model enable a steady state probability to be computed. The steady state probability was determined to occur when the change in potential for development with respect to time approached a value of zero. Finally, the mean time for land to develop, 1/λ can be different for any section of corridor of interest.

12
Task 3: Understand Strategic Actions That Minimize Regret
Figure 5 shows a weighting of costs, benefits, and likelihoods to determine prioritization of corridors for investment using decision tree analysis. The actions are split into three groups which encompass the major decision makers: The state and federal planning agencies, localities, and private developers. Planning agencies are generally responsible for planning actions such as surveying of the land and budgetary planning for investment. The localities are primarily responsible for the actual protective measures to be taken. These protective measures include right of way purchasing, access management implementation, and other operational changes in the transportation infrastructure. The private developers also take responsibility in corridor protection through decisions regarding where, when, and how development occurs. Developers may choose to locate development near particular corridor locations and within a far enough distance from the roadway to enable corridor capacity improvements.
Figure 5. Decision analysis for risk management of land development adjacent to multimodal transportation corridors

13
The analysis characterizes both costs and opportunities, which differ based on geographical and corridor specific qualities. For each type of section, the following characteristics are important:
The costs to taxpayers include salaries and overhead for planning, financial resources
for planning, land purchasing costs, costs for construction or operational changes to the physical layout infrastructure, and other applicable costs.
The opportunities to taxpayers including per-unit savings from greater economies of scale and cost justification of facilities that can make maintenance more cost effective.
Task 4: Sensitivity of Results to Scenarios, Assumptions, and Emergent Conditions
The impacts of economic upturns, economic downturns, climate change, and others can be considered. Experts were asked to share how the potential for development model changes given the stated scenarios. Scenario planning can help answer questions such as how does time-to-development change under various scenarios; how does the network topography change as a result of the scenarios; what scenarios and assumptions matter the most; how do the probabilities change under various scenarios; what geographic sub-regions are highest impacted under various scenarios; and others. Separate models may be useful for urban, suburban, and rural land areas.
Task 5: Creation of Access Point Data Set and Analysis This effort designed a repeatable method to count the number of road access points across the 5,700-mile SMS. The output data coordinated with the previous methodology steps in order to identify areas where adaptation to land development would be costly. The project did not attempt to establish or suggest new access management regulations. This effort focused on developing data collection methods for access points in corridors of the SMS. A sub-goal was to assess the cost of currently correcting and adapting the “high-priority” sections identified by the land-development forecasting model. Although it may be desirable to categorize the access points by severity (impact to traffic flow), the scope of this effort is aimed more towards measuring curb cut densities (which will be further associated to costs of adaptation) as opposed to accounting for their impacts on traffic flow. Furthermore, metrics for access point density outliers were developed through the interpretation of the data collected on curb cuts. Step-by-step instructions for the inventory of access points are provided in Appendix B. The developed access point data set procedure includes the following:
Design Requirements Curb Cut Counting Process Review of Design Against Requirements.
Design Requirements
The design requirements for this step are as follows:

14
R1. The design should provide the following information to the client: The total number of miles counted (along Virginia’s SMS) The number of significant access points identified Description of observed access points per mile ranges Analysis of the outliers found within observed access points per mile ranges (1, 2, 5,
and 10 miles) Characterization of access point densities for each high-risk area identified in the land
development forecasting model Analysis of correlation between high-risk areas and access point densities Highest density areas grouped by region An account of the census blocks used with their respective populations Range of access points along census blocks Physical comparison and analysis for most relevant areas.
R2. The design should possess the following capabilities: Easy to modify and repeat when there are new or updated data Compatible with the existing research projects and other informational layers (being in
the shapefile format that can be processed in arcGIS).
R3. The design should contain the following properties: Quick and easy to implement given the timeframe constraint Accurate and consistent in quality control In a finished and packaged form and ready to deliver to the client.
Curb Cut Counting Process
In order to satisfy the design requirements, ArcGIS software was used to create a statewide dataset indicating access point counts, locations, and densities. The team obtained a GIS layer from the client entitled “network with planning data.” This layer contained detailed data on all roads in Virginia. In addition, the team counted access points along primary roads that are parallel to SMS interstate highways. The effort also examined the CoSS. The CoSS is a land-based characterization of the important commercial corridors with multimodal significance within Virginia.
For the initial purposes of the team, the roads belonging to the SMS were filtered into a
separate layer. The team split the state into five equally sized parts into order to divide the counting work between team members. The team counted 750 access points per hour on average, resulting in a total of 70,000 counted points. Figure 6 provides a visualization of an example stretch of road where counting took place. In the GIS environment, the team used the abovementioned SMS layer to show which roads were to be counted and a layer of satellite

15
imagery11 to show where access points were located. The red line is the road belonging to the SMS and the green dots indicate where access points along this stretch of SMS are located.
Figure 6. Sample access point counting imagery. Source: ESRI, i-cubed, USDA FSA, USGS, AEX, GeoEye,
AeroGRID, Getmapping, IGP.
Numerous challenges were encountered during the data collection process. The most important obstacle was to define how and which access points required marking. The decision was made to count all types of access points equally in order to expedite the counting process. For example, a four-way intersection is marked as one access point in the same way that a rural driveway is marked as one access point. While the four way intersection is a more prominent access issue, it is given the same value as a rural driveway. Other problems included the quality of satellite imagery (trees, clouds, poor resolution) and potential inconsistencies in the group member’s individual interpretation of access points.
Several alternative methods for counting access points along corridors were investigated
before deciding on the final manual-counting method used by the team. The team studied software or systems capable of automating the counting process such as edge-detection software. However, this approach was both significantly difficult and costly, and although efficient in detecting intersections and high-density areas, the software was not able to detect discrete types of access points such as driveways. Signal detection in imagery through Fourier transforms was also evaluated for counting curb-cuts, however, was overly complex for the project timeframe. Thus, the team decided to use the available time and resources for the brute force method. Testing of this

16
manual counting approach on a subset of the SMS confirmed accuracy and efficiency of the design. Review of Design Against Requirements
1. The design shall provide the specified information to VDOT. Currently, the design includes the SMS, selected parallel corridors, and part of CoSS. The total number of access points and densities has been identified based on the current data.
2. The design shall possess the specified capabilities. Using ArcGIS and working with shapefiles make the design very compatible with other research projects and informational data provided by VDOT. It is also easy to modify and update the data, as well as to repeat the process of implementing the design.
3. The design shall contain the following properties. Provided the availability of tools
and software, the design can be quickly implemented. The accuracy and quality estimated at 80%, which can be improved in the future. The design can be stored in an external hard-drive, which will be packaged and delivered to the VDOT.
RESULTS
Literature Review
Needs and Practices for Land Development Forecasting
In 2009, the EPA joined with HUD and the DOT for the Partnership for Sustainable Communities. This program works to help improve access to affordable housing, aid in access to more transportation options, and lower transportation costs while protecting the environment in communities nationwide. The guiding principles include the enhancement of economic competitiveness through expanded business access to markets. The program works to enhance integrated planning and investment with housing, transportation, water infrastructure, and land use planning and investment.12 In 1991, ISTEA mandated that states and MPOs consider the preservation of rights of way in transportation plans and programs. Following the passage of ISTEA, Congress instructed the Secretary of Transportation to compile a report of corridors requiring protection.13
In the past, localities have used various methods to identify corridors needing protection in
long-range transportation plans. Indian River County, Kansas, identifies corridors using a transportation demand model. Stokes et al.14 identify corridors based on the capacity analysis procedures such as described in the Highway Capacity Manual. Highways currently have or are projected to have average annual daily traffic in excess of 5,000 vehicles per day were considered candidates for corridor preservation programs.15 Other types of models used to predict land

17
development include scenario generation and evaluation models, urban economic models, and integrated transportation and land use models.16,17
Numerous models have been developed to predict land use changes. Lowry models were
developed to project land use using demographic and economic data.18 Recent technological advances have allowed for greater use of geographical computation in land use forecasting. Sklar and Costanza incorporated spatial models to analyze watershed land use change.19 Pijanowski et al. coupled GIS with artificial neural networks to learn patterns of development and forecast land use changes on Michigan's Grand Traverse Bay Watershed.20 Turner used transition probability matrices to estimate rates of change between land use types.21 Brown et al. modeled land cover change using aerial photography and regression models.22 Researchers have applied an existing cellular automaton model, SLEUTH, to the Washington-Baltimore metropolitan region, which has experienced rapid land-use change in recent years. The model was calibrated using a historic time series of developed areas derived from remote sensing imagery, and future growth was projected out to 2030 assuming different policy scenarios.23 Other types of models used to predict land development include scenario generation and evaluation models, urban economic models, and integrated transportation and land use models.24,17 The use of state-transition modeling has been documented in various infrastructure protection projects. For example, Arizona’s Pavement Management System uses Markov modeling and linear optimization techniques to compute optimal policies for corridor maintenance.25 More recently, highway agencies across the nation have begun to use the PONTIS bridge management system most notably known for modeling bridge element deterioration according to a Markov process. The usage of state-transition modeling is often associated with analysis of optimal steady-state policies that intend to minimize lifecycle costs cost.26 Process of Risk Assessment and Management
This section describes the applicability of methods of risk assessment and management to address land development adjacent to multimodal corridors. Risk assessment methodology focuses on the following three questions27: what can go wrong, what are the likelihoods, and what are the consequences. What can go wrong addresses congestion and the safety concerns resulting from the congestion. What are the consequences refers to the societal costs of congestion on passenger productivity and goods movement, costly right-of-way acquisition, retrofits, rezoning, access management on transportation corridors and agencies. What are the likelihoods is the primary focus of this report as it forecasts probabilities of land development on corridors. Risk management methodology introduces three additional questions28: what can be done; what are the trade-offs among all costs, benefits, and risks; and what are the impacts of current decisions to future options. The introduction above has addressed what can be done by describing the efforts of jurisdictions to manage rezoning, public utilities, rights of way, and managing access points in cases of land volatility. What are the trade-offs among all costs, benefits, and risks is discussed throughout the report considering that jurisdictions face limited funding and must prioritize the corridors facing land volatility. Finally, what are the impacts of current decisions to future options is discussed in the introduction with discussion of the initiatives of DOT, HUD, and EPA on livable and sustainable communities and infrastructures, the development of priorities for the use

18
of limited funding to minimize the negative impacts of land development to the mobility of people and goods.
The incorporation of the stakeholder perspectives in risk analysis can be done through
hierarchical holographic modeling (HHM).28 HHM accepts the inadequacy of single models and views and consequently sets up a comprehensive framework for modeling and risk identification through incorporation of multiple perspectives and understanding of the various levels on a system hierarchy. Linthicum and Lambert29 described a single-layer approach to forecast land development along infrastructure corridors using aggregation of relevant factors but did not incorporate a time to development, did not include geographic dissimilarities, weighed all indicators equally, and used an overly simple prioritization method. Schroeder and Lambert30 discussed the need and methods for scenario-based analysis for infrastructure planning. Karvetski et al. discussed methods for scenario analysis for energy and environmental security in relation to military infrastructure.31 Lambert and Sarda32 identified risks to critical infrastructure through layering of network models. Interactions of scenarios and network components were generated and analyzed.
Identification of High-Risk Adjacent Land
This section describes the interpretation of results based on the methods described in the
Methods section. Tables and maps show the results of the aggregation of factors, demographic perspective, economic perspective, and land-use perspective. In addition, access point analysis maps highlight high-risk sections of corridors based on access point density. Many of the factors used to estimate the risk are based on percentage growth, not absolute numbers, because percentage growth provides a better illustration of the ability for corridors to meet demand. In other words, the impact of a particular percentage growth can be better generalized across urban, suburban, and rural areas compared to an absolute number growth. The thresholds of factor values for the perspectives are shown in Appendix D.
Base Perspective
The aggregation of factors using population, home value, population projections, and jobs
housing balance is presented in Table 3 and graphically in Figure 7. The high-risk areas consist of outer northern Virginia including the northern parts of Culpeper and Fredericksburg, western Hampton Roads area, the outer Roanoke/Blacksburg area, and the western fringe of Richmond (including Goochland County). The majority of the high-risk areas lie within non-highway corridors designated as Not Part of the National Highway System and Other Principal Arterial corridors. The medium risk areas are also mostly composed of the Not Part of the National Highway System and Other Principal Arterial corridors. A sample of the specific corridors of concern in high-risk areas is I-66 Warrenton, Manassas; I-95 Fredericksburg, Petersburg, Manassas, Ashland; I-64 Williamsburg, Ashland; Bus. US 15: Leesburg; PR 208 Fredericksburg; PR 267 Leesburg; PR 3 Fredericksburg, Culpeper; SC 3000 Manassas; US 15 Culpeper, Leesburg, Manassas; US 211 Culpeper, Warrenton; US 258 Suffolk; US 33 Harrisonburg, Ashland; US 522 Chesterfield, Culpeper, Warrenton; PR 7 Leesburg; George Washington Memorial Highway Williamsburg; PR 234 Manassas; US 17 Fredericksburg, Warrenton.

19
Figure 7. Aggregation of factors in the base perspective. Land development ranking based on population, home value, population projection, and jobs-housing balance.
Table 3. Miles of SMS with high, medium, and low risk due using simple aggregation of factors
Corridor Type High Low Medium Total Miles
Eisenhower Interstate 50 561 499 1,110
Intermodal Connector 3 15 17 35
Major Strategic Highway Network Connector - 45 24 69
Not Part of NHS 94 1,444 830 2,368
Other Principal Arterial 84 1,038 675 1,797
Strategic Highway Network (STRAHNET) 3 340 139 482
Total Miles 235 3,442 2,184 5,860 Economic Perspective
Results from the economic perspective using the factors of jobs-housing balance, employment forecast, and HUBzones are shown in Table 4 and Figure 8. The results show high-risk areas in outer northern Virginia (including Fauquier and Rappahannock County), the eastern part of the Hampton Roads area, and the southwest region. The majority of the high-risk areas lie

20
within non-highway corridors designated as Not Part of the National Highway System and Other Principal Arterial corridors. The medium risk areas are also mostly composed of the Not Part of the National Highway System and Other Principal Arterial corridors. A sample of the specific corridors of concern in high-risk areas are I-81 Abingdon, Wytheville, Christiansburg; I-77 Wytheville; SC 619 Manassas; PR 16 Abingdon, Tazewell; PR 3 Culpeper, Fredericksburg; PR 57 Martinsville; US 58 Abingdon, Martinsville; Alt. US 58 Wise; George Washington Memorial Highway Williamsburg; US 15 Culpeper, Warrenton; US 19 Abingdon, Tazewell; US 220 Martinsville, Rocky Mount; US 23 Wise; US 29 Charlottesville, Fairfax; US 460 Christiansburg, Tazewell.
Table 4. Miles of SMS with high, medium, and low risk based on the economic perspective
Corridor Type High Medium Low Total Miles
Eisenhower Interstate 85 294 731 1,110
Intermodal Connector 2 4 29 35
Major Strategic Highway Network Connector 14 26 29 69
Not Part of NHS 120 771 1,476 2,368
Other Principal Arterial 200 620 977 1,797
Strategic Highway Network (STRAHNET) 4 189 289 482
Total Miles 425 1,904 3,531 5,860
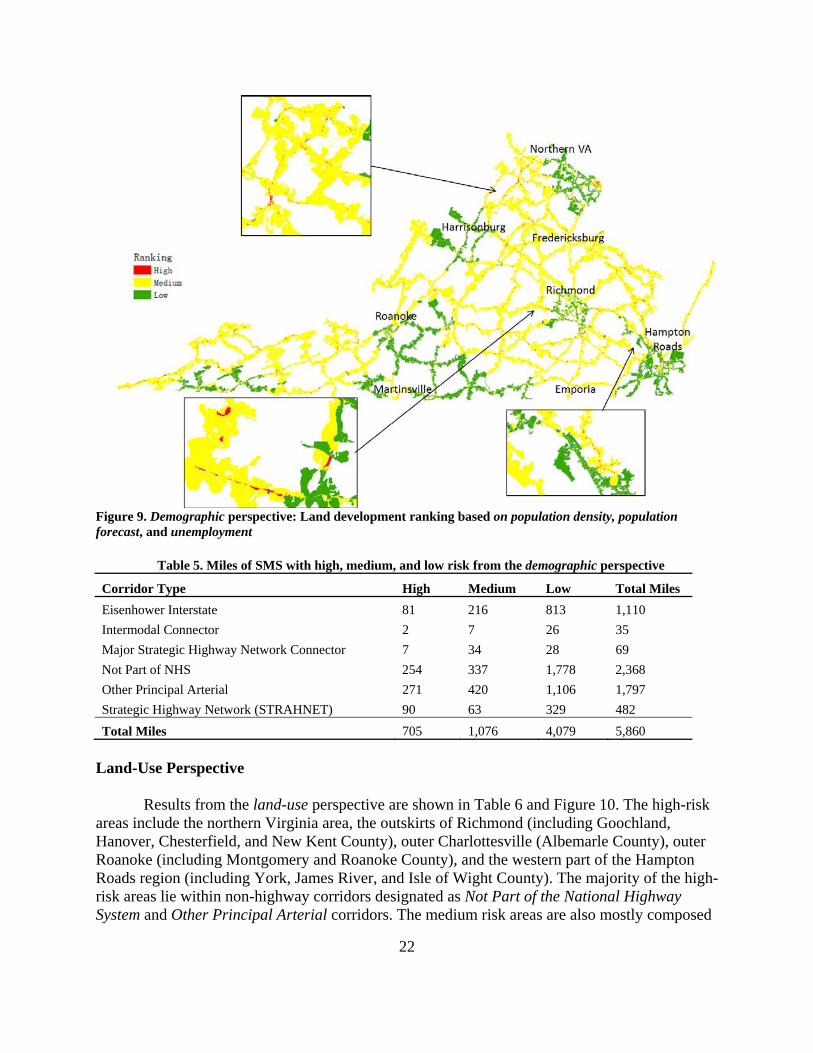
Demographic Perspective
Results from the demographic perspective using the factors of population density, population forecast, and unemployment are shown in Table 5 and Figure 9. The high-risk areas within the demographic perspective are more dispersed compared to the other perspectives addressed. The high-risk areas are found within northern Virginia (including Fairfax and Prince William County), the outskirts of Richmond (including Goochland, Hanover, Powhatan, New Kent County), and the Roanoke area (including Giles, Pulaski, and Botetourt County). The majority of the high-risk areas lie within non-highway corridors designated as Not Part of the National Highway System and Other Principal Arterial corridors. The medium risk areas are also mostly composed of the Not Part of the National Highway System and Other Principal Arterial corridors. A sample of specific corridors of concern in high-risk areas are I-95 Petersburg; I-295 Petersburg; I-77 Hillsville, Wytheville; Alt. US 58 Jonesville; PR 100 Christiansburg; PR 3 Fredericksburg, Culpeper, Northern Neck, Saluda; PR 33 Saluda, Sandston; US 15 Culpeper, Dillwyn, Louisa; US 17 Luray; US 33 Charlottesville, Culpeper, Harrisonburg, Louisa, Sandston; US 360 Bowling Green, Northern Neck; US 58 Martinsville, Hillsville, Jonesville, Wytheville; US 60 Amherst, Chesterfield, Lexington; George Washington Memorial Highway: Saluda, Williamsburg; US 19 Lebanon, Tazewell; US 23 Jonesville, Wise; US 29 Charlottesville, Amherst, Appomattox, Culpeper, Fairfax; US 13 Accomac.

21
Figure 8. Economic perspective: land development ranking based on jobs-housing balance, employment forecast, and HUBzones
22
Figure 9. Demographic perspective: Land development ranking based on population density, population forecast, and unemployment
Table 5. Miles of SMS with high, medium, and low risk from the demographic perspective
Corridor Type High Medium Low Total Miles
Eisenhower Interstate 81 216 813 1,110
Intermodal Connector 2 7 26 35
Major Strategic Highway Network Connector 7 34 28 69
Not Part of NHS 254 337 1,778 2,368
Other Principal Arterial 271 420 1,106 1,797
Strategic Highway Network (STRAHNET) 90 63 329 482
Total Miles 705 1,076 4,079 5,860
Land-Use Perspective
Results from the land-use perspective are shown in Table 6 and Figure 10. The high-risk areas include the northern Virginia area, the outskirts of Richmond (including Goochland, Hanover, Chesterfield, and New Kent County), outer Charlottesville (Albemarle County), outer Roanoke (including Montgomery and Roanoke County), and the western part of the Hampton Roads region (including York, James River, and Isle of Wight County). The majority of the high-risk areas lie within non-highway corridors designated as Not Part of the National Highway System and Other Principal Arterial corridors. The medium risk areas are also mostly composed

23
of the Not Part of the National Highway System and Other Principal Arterial corridors. A sample of specific corridors of concern in high-risk areas are I-66 Luray; I-81 Christiansburg, Edinburg, Harrisonburg, Salem; PR 20 Charlottesville, Culpeper; PR 208 Fredericksburg; PR 3: Fredericksburg, Culpeper; US 15: Culpeper, Dillwyn, Leesburg, Manassas; US 17 Luray, Edinburg; US 211 Warrenton; US 221 Salem; US 258 Suffolk; US 33 Harrisonburg, Ashland; PR 288 Chesterfield, Ashland; PR 7 Luray, Leesburg, Edinburg; US 29 Charlottesville, Culpeper, Fairfax, Manassas; US 460 Suffolk, Dillwyn, Franklin, Petersburg.
Table 6. Miles of SMS with high, medium, and low risk based on the land-use perspective
Corridor Type High Medium Low Total Miles
Eisenhower Interstate 142 517 450 1,110
Intermodal Connector 2 19 14 35
Major Strategic Highway Network Connector 10 31 28 69
Not Part of NHS 235 1,288 845 2,368
Other Principal Arterial 138 845 814 1,797
Strategic Highway Network (STRAHNET) 28 332 122 482
Total Miles 554 3,032 2,274 5,860
Figure 10. Land-use perspective: Land development ranking based on land value and suburban/urban/rural classification

24
The corridors of concern showing high ranking in the economic, demographic, and land-use perspectives are segments are I-95 and US 460 Blacksburg/Christiansburg; I-95 Northern Virginia; US 15 in Culpeper. The corridors of concern showing high rankings in the economic and demographic perspectives only are I-81 Blacksburg/Christiansburg; Route 16 Marion, PR 57 Martinsville; US 58 Martinsville; Alt. US 58 Wise, George Washington Memorial Highway Hampton Roads; US 220 Martinsville; US 460 Blacksburg/Christiansburg, Bluefield, Richlands. The corridors of concern showing high rankings in the economic and land-use perspectives only are I-95 Fredericksburg, Northern Virginia, Richmond; Route 17 Fredericksburg; PR 8 Blacksburg/Christiansburg; US 460 Blacksburg/Christiansburg; US 15 Culpeper; PR 234 Northern Virginia. The corridors of concern showing high rankings in the demographic and land-use perspectives only are I-81 Blacksburg/Christiansburg, Roanoke, Winchester; I-64 Charlottesville, Hampton Roads, Richmond; Bus. US 17 Hampton Roads; PR 3 Fredericksburg; US 17 Winchester; US 33 Richmond; US 522 Winchester; US 60 Richmond; George Washington Memorial Highway Hampton Roads; PR 37 Winchester; US 15 Culpeper; US 17 Fredericksburg; US 29 Charlottesville; US 460 Blacksburg/Christiansburg; US 522 Winchester.
Table 7 shows the corridors that were determined to be high-risk according to the three
perspectives: economic, demographic, and land-use. This table shows the areas of highest concern are within sections of the Blacksburg/Christiansburg and Northern Virginia areas.
Table 7. High-risk corridor sections based on the economic, demographic, and land-use perspectives
Route City Miles
Eisenhower Interstate I- 81 Blacksburg/Christiansburg 1
I- 95 Northern Virginia 1
Other Principal Arterial US 15 Culpeper 4
US 460 Blacksburg/Christiansburg 1
Total Miles 7
Access Point Density of Corridor Segments
Figure 11 describes segment counts per route by attribute for the top 5% of access point density segments across the state. Other attributes that could have been used include Residency, Median Type, District, and Federal Functional Class. The chart identifies, for a specific attribute, instances of that attribute that are outliers in the data. Once these instances are identified, a further in-depth analysis can be performed to explain why they are outliers. Figure 3 shows Routes 11, 60 and 1 have the most 1-mile segments with high (top 5%) access point densities.
Figure 12 highlights the highest access point density segments by construction district.
The districts of Staunton, Hampton Roads, and Richmond contained the largest quantity of the top 5% access point density segments. A planner may make use of the rest of the results from this methodology to further analyze these particular districts. Figures 13 and 14 show the number of 1-mile segments that fall within a particular bin of access points per mile along Route 29 and Route 11 respectively. These histograms were created for each of the corridors in the network in order to verify the inferences drawn from the attribute-specific charts. The histograms for Route 11 and

25
US 29 also validate the initial discernment for Route 11 being a corridor of concern. The shape of the US 29 histogram is typical of other corridors examined (high relative counts of low access point densities). Route 11’s distribution, however, is more heavily weighted towards middle and high-end access point bins. Distributions with this shape are of concern since it can be inferred that the corridor has large amounts of high access point density sections.
Figure 11. Top 5% of 1-mile densities per route; the other category is an average segment count for other routes that appear in the top 5%. Note the routes are different lengths.
Figure 12. Top 5% of 1-mile densities per district across Virginia

26
Figure 13. Route 29 access point density, with counts of segments exhibiting between 5 and 55 or more access points per mile
Figure 14. Route 11 access point density
Figure 15 shows a corridor-specific representation of access point density and density
outliers areas along the network. The density map highlights the 1-mile segments that fall within the top 10% of access point densities for the data set. This approach can be applied to the entire network or for a specific corridor. For the US 29 corridor, sections of concern are located near the counties of Arlington, Fairfax, Fauquier, Culpeper, Madison, Nelson, Amherst, Campbell, and Pittsylvania.

27
Figure 15. Access point densities for 1-mile segments along US 29 in Virginia. Top 10% of access point density segments are indicated in red.
Figure 16 compares access point density, traffic volume, and average priority scores along the 1-mile segments of a corridor. Appendix C contains 11 additional figures for the CoSS. The risk of land development priority scores are represented by the varied land parcel colors. A gradient color scale is used to assign the priority scores to highlight potential risk areas with the route roadway. Traffic volume is measured by the average daily traffic for each 1-mile segment and is graphed along the linear roadway mileage. The linear mile-densities are graphed in the same manner to chart the progression along the route mileage. This management layer helps decision makers identify segments that need protection from future land development and prioritize these segments for resource allocation. Segments with a high priority score indicate areas that need protection from future land development. Segments also exhibiting high density of access points and high traffic volume indicate significant current development (in addition to the predicted future development), which would make implementation of an access management protection plan costly.33 Conversely, at-risk segments low in traffic volume and access point density may be more cost-effective to protect since they represent areas that are expected to develop but have not yet been developed. Although land with a high likelihood of development includes highway corridors, the greatest potential for regret exists on corridors that currently do not have sufficient access management. Because highways are inherently access managed, they are of less concern for this study.
The 80 miles of Route 50 through the northern part of Virginia were studied further to exemplify the use of this management layer. Route 50 experiences high traffic volumes in regions near Winchester and around Fairfax. Specifically, spikes in average daily traffic are observed near

28
Mileposts 22, 58 through 60, and 70 through 80. High access point sections are observed near Winchester, Upperville, Fairfax, and Washington, D.C. Mileposts 12 through 22, 40, 70 through 75, and 85 indicate these areas of concern. By comparing both charts, sections with both high access point densities and traffic volume can be observed near Mileposts 22 and 70 through 75. Planners can identify whether these 1-mile segments are at risk for future land development using the map on top of the two plots. The orange coloring in land parcels near Winchester (Milepost 22) suggests that this area is threatened by future development. However, the high access point and traffic volume characteristics suggest that this area also has significant amounts of current activity. Access management projects are more costly to implement in regions that have current activity and development. The necessary infrastructure adaptation for currently undeveloped segments is relatively inexpensive due to the roadway having few features that will need to be changed or moved. An example of this type of corridor section is found near the end of US 50, at Milepost 82. Segments with high access point density and low traffic volume may require an access management project to improve efficiency and roadway safety. These segments would have a low priority score for protective resource allocation since they would also be costly for VDOT to protect due to the high number of access points. US 50 has 11 such 1-mile sections at Mileposts 12 through 20, 40, 49, and 55.
Figure 16. Relationships among access points per mile, risk of land development prediction, and average daily traffic on Route 50. This figure shows 1-mile segments along the 80-mile corridor in the northern part of Virginia that are exposed to risk of future land development.

29
High-Risk Areas and Access Point Density Outliers
Figure 17 shows the economic perspective land development ranking with bolded top 10% access point density segments based on jobs-housing balance, employment forecast, and HUBzones. Segments showing a high ranking in the economic perspective and top 10% access point density include US 15 Culpeper; PR 8 Blacksburg/Christiansburg; Alt. PR 57 Martinsville; George Washington Memorial Highway Hampton Roads; US 1 Northern Virginia.
Figure 17. Economic perspective: Land development ranking and top 10% access point density based on jobs-housing balance, employment forecast, and HUBzones. Red is high, yellow is medium, and green is low.
Figure 18 shows the demographic perspective land development ranking with the bolded top 10% access point density segments based on population density, population forecast, and unemployment. Segments showing a high ranking in the demographic perspective and top 10% access point density include US 15 Culpeper; US 20 Orange; PR 3 Fredericksburg; US 29 Northern Virginia; George Washington Memorial Highway Hampton Roads. Figure 19 shows the land use perspective land development ranking with the bolded top 10% access point density segments based on land value and suburban/urban/ruralclassification. Segments showing a high ranking in the land-use perspective and top 10% access point density include US 522 Culpeper; PR 3 Fredericksburg; PR 8 Blacksburg/Christiansburg; US 33 Harrisonburg and Richmond; US 360 Richmond; US 50 Northern Virginia; US 522 Winchester; George Washington Memorial Highway Hampton Roads; US 11 Roanoke; US 17 Fredericksburg.

30
Figure 18. Demographic perspective – land development ranking and top 10% access point density based on population density, population forecast, and unemployment. Red is high, yellow is medium, and green is low.
Figure 19. Land-use perspective: land development ranking and top 10% access point density based on land value and suburban/urban/rural classification. Red is high, yellow is medium, and green is low.

31
SUMMARY
This study demonstrated the coordination of multiple layers of modeling to address the risks of unforeseen land development adjacent to multimodal transportation corridors. The study area consisted of census blocks of land adjacent to the 5,760 miles of the Virginia SMS. The study included 95 counties and 39 independent cities. In total, more than 43,000 census blocks were evaluated.
The results focused on where to commission detailed corridor studies, fund specific access
management activities, seek proffers from owners and developers, locate urban development areas, and seek improved subdivision ordinances. The methods developed in this study will facilitate strategic decisions in the planning process, reduced costs to localities, and the building of concerted long-range action plans among agencies and developers. The developed methods are implementable to state, regional, and local planners via this report, an online video tutorial, and PowerPoint presentations developed for this purpose and are available on the website of the University of Virginia Center for Risk Management of Engineering Systems. 1 The visual nature of this methodology lends itself particularly well to the online videos and slide presentations.
CONCLUSIONS The model identified areas with high risk of development according to the demographic,
economic, and land-use perspectives as categorized by corridor type (Eisenhower Interstate, Strategic Highway Network, etc.). These sections will likely require proffers for development.
The model identified 235 miles of corridor showing high risk of development according to
simple aggregation of factors. The model identified the top 5% density of 1-mile corridor segments representing access point
density outliers across the SMS and CoSS. The model identified the top 10% density of 1-mile corridor segments representing access
point density outliers across each route of the SMS and CoSS. The model identified segments along each route displaying high likelihood of adjacent land
development, high access point density, and high average daily traffic. Opportunities exist for collaboration among transportation and land use authorities as well as
various government agencies for sharing data, seeking opinion and comment, harmonizing long-range plans of various agencies, and seeking policies that favor the interests of multiple agencies. Additionally, coordination allows for a diverse selection of the corridors with respect to length, metropolitan area proximity, geography and terrain, and status of local access management plans. Particular synergies may exist between corridor protection and resource protection activities. There are significant benefits to conserving contiguous parcels of land34-35

32
thus additional adjacent conservation easements may be cost-effective by serving both access management and environmental conservation purposes.
RECOMMENDATIONS
1. Risk assessment of land development: VDOT’s TMPD or contracted researchers should
communicate the methods developed in this study to localities and economic development officials in order to promote concerted efforts toward the protection of the transportation infrastructure.
2. Identification of high-risk corridor sections. VDOT’s TMPD or contracted researchers should
identify corridor sections with high land development rankings as candidates for protective actions in order to avoid regret of unforeseen development.
3. Coordination with regions and localities. VDOT’s TMPD should encourage dialogue with
localities/regions on corridor sections where there is a coincidence of features: (1) high land-development potential, (2) high access-point densities, and (3) high traffic volumes. The dialogue process should encourage regions and localities (MPOs, counties, and independent cities) to focus transportation planning efforts on corridor sections with these features.
4. Protection actions that support safety, mobility, and economic development. VDOT’s TMPD
should use the methods developed in this study to coordinate protective actions with regions/localities and developers to avoid compromising safety and mobility on the adjacent infrastructure corridors. Strategies for future development could include (1) management of access-point densities in the interest of safety, mobility, and economic development; (2) consideration of proffers to ensure adequate compensation for the impact of land development to the adjacent corridor sections; and (3) investigation for site selection and setback distance directed initially to locations with high land-development potential, high access point densities, and high traffic volumes.
IMPLEMENTATION
The implementation of the model includes the following activities:
Training materials and presentations Recommendations developed with VDOT and regions Technology transfer.
Online versions of a training manual for SMS implementation that includes the lessons learned from the authors’ experiences in the previous tasks are available. The developed materials including video presentations, slide presentations, a manual, a research report, telephone support,

33
and otherwise promoted adoption of the methodology in various forms as appropriate are available for regional organizations throughout Virginia. The authors worked with VDOT and regional planning organizations to develop recommendations for data, practices, policies, and procedures of VDOT and regional planners in support of legislation and policies including Chapter 527. In addition, the authors made presentations to Virginia regions, professional conferences including that of the Institute of Transportation Engineers, and others on-site and via teleconference. Further, the authors provided VDOT’s TMPD new data that will be made available via the VDOT Learning Center and the VDOT GIS Integrator.
COSTS AND BENEFITS ASSESSMENT
Benefits
Implementing the recommendations offered will benefit transportation accessibility,
mobility, economic development, and safety for sections of the SMS and CoSS that are vulnerable to adjacent land development. Implementation will help VDOT and other transportation planners systematically prioritize needs for corridor protection and access management, including the identification by Virginia localities of urban development areas as required by Chapter 896 of the 2007 Acts of Assembly (House Bill 320236).
Additional benefits are as follows: Reduced cost of unanticipated development to VDOT’s TMPD resulting from the
automated methodology and further TMPD analysis efforts based on model results.
Reduced VDOT cost, congestion, and safety hazards through improved access management.
Informing VDOT with a critical 5-to-10-year lead time to protect transportation assets of the SMS.
Support for VDOT in key stages of STIP and VDOT’s Six-Year Improvement Program discussions and decision making related to land use and access management.
Improved awareness for VDOT of how needed transportation improvements are influenced by land development,
Support for VDOT in a process to minimize the impacts of land development to transportation systems.
A tool and resource for VDOT and the development community to meet critical mandates of the Code of Virginia pertaining to access management.

34
Understanding by VDOT of activities by Virginia localities to identify their urban development areas by 2011 as required by Chapter 896 of the 2007 Acts of Assembly25 (also known as House Bill 3202).
Facilitate decisions regarding regional and local priorities for detailed corridor studies, specific access management activities, proffers from developers, and improved subdivision ordinances.
Enhancement of the stature of VDOT in the nation as a leader in the topic of systems modeling for access management.
Costs
The costs of implementation are as follows: Costs associated with GIS software and GIS-trained personnel. Transportation and
planning agencies already have GIS software and trained personnel, and many others are planning to acquire these resources for a variety of uses in addition to conducting suitability analyses.
Costs associated with resources and time for analysis. The resources and time spent on
analysis by VDOT’s TMPD or contracted researchers will be combined with multiple similar analysis efforts via automated data-driven methodology.
ACKNOWLEDGMENTS
The authors acknowledge several individuals who contributed to this project. The project steering committee was composed of Marsha Fiol, Katherine Graham, Robin Grier, Ross Hudnall, Ben Mannell, Brad Shelton, Rick Tambellini, and Chad Tucker of VDOT and John Miller, Amy O’Leary, and Mike Perfater of VCTIR. The following UVA undergraduate assistants are acknowledged for their contribution to this project: Juan Aguilar, Matt Giorgis, Michael Gude, Preut Thanarat, and Cait Walcoff. The following UVA students are acknowledged for their contribution to this project: Alex Linthicum, Sandeep Pillutla, and Matthew Schroeder. The following individuals are also acknowledged for their participation in the project: Rick Carr of Fauquier County; John Giometti, Paul Grasewicz, Robert Hofrichter, Matthew Merrill, and Kim Pryor Spence of VDOT; Mary Lynn Tischer, formerly of VDOT; and Jeff Walker of RRRC.

35
REFERENCES 1. University of Virginia Center for Risk Management of Engineering Systems. Land
Development Risk Analysis for the Statewide Mobility System. www.virginia.edu/crmes/corridorprotection. Accessed January 28, 2011.
2. Virginia Department of Transportation. VDOT Six-Year Improvement Program. http://syip.virginiadot.org/Pages/allProjects.aspx. Accessed January 28, 2011.
3. Virginia Department of Transportation. Statewide Transportation Improvement Program. http://www.virginiadot.org/about/stip.asp. Accessed January 28, 2011.
4. Commonwealth of Virginia. LIS > Code of Virginia > 15.2-2223. http://leg1.state.va.us/000/cod/15.2-2223.HTM. Accessed January 28, 2011.
5. Commonwealth of Virginia. LIS > Code of Virginia > 15.2-2222.1. http://leg1.state.va.us/cgi-bin/legp504.exe?000+cod+15.2-2222.1. Accessed January 28, 2011.
6. Commonwealth of Virginia. LIS > Code of Virginia > 15.2-2223.1. http://leg1.state.va.us/cgi-bin/legp504.exe?000+cod+15.2-2223.1. Accessed January 28, 2011.
7. Dulles Corridor Metrorail Project. Dulles Metrorail - Frequently Asked Questions. http://www.dullesmetro.com/info/faqs.cfm#3. Accessed October 1, 2010.
8. Department of Rail and Public Transportation. 2035 Surface Transportation Plan Update. http://www.drpt.virginia.gov/special/files/2035%20Surface%20Transportation%20Plan%20Update.pdf. Accessed October 1, 2010.
9. Office of Intermodal Planning and Investment. Corridors of Statewide Significance: Introduction. Richmond, undated. http://www.vtrans.org/resources/Introduction_Chapter.pdf. Accessed January 3, 2011
10. Pate-Cornell, M.E. Uncertainties in Risk Analysis: Six Levels of Treatment. Reliability Engineering & System Safety, Vol. 54, No. 2-3, November-December 1996, pp. 95-111.
11. ESRI. World Imagery, December 12, 2009. http://www.arcgis.com/home/item.html?id=10df2279f9684e4a9f6a7f08febac2a9. Accessed September 10, 2010.
12. U.S. Environmental Protection Agency. Smart Growth: HUD-DOT-EPA Interagency Partnership for Sustainable Communities. http://www.epa.gov/dced/partnership/index.html. Accessed December 26, 2009.

36
13. Federal Highway Administration. Report of the Secretary of Transportation to the United States Congress on Preservation of Transportation Corridors. Washington, D.C., 1994.
14. Stokes, R.W., Russell, E.R., and Vellanki, B.K. Recommended Corridor Preservation Program for Kansas Highways. K-TRAN: KSU- 93-1. Kansas Department of Transportation, Manhattan, 1994.
15. Kleinburd, R. Corridor Preservation in Delaware. In Proceedings of the Second National Conference on Access Management. Federal Highway Administration, Vail, Colo., 1996, pp. 409-414.
16. Johnston, R.A., and Clay, M.J. A Graduate Course Comparing the Major Types Of Urban Models. UCD-ITS-RR-04-8. Institute of Transportation Studies, Davis, Calif.,. 2004.
17. Waddell, P. UrbanSim: Modeling Urban Development for Land Use, Transportation and Environmental Planning. Journal of the American Planning Association, Vol. 68, No. 3, Summer 2002, pp. 297-314.
18. Lowry, I.S. A Model of Metropolis. RM-4035-RC. The RAND Corporation, Santa Monica, Calif., 1964.
19. Skiar, F., and Costanza, R. The Development of Dynamic Spatial Models for Landscape Ecology: A Review and Prognosis. In Quantitative Methods in Landscape Ecology, M.G. Turner and R. Gardner, eds. Springer-Verlag, New York, 1991, pp. 239-288.
20. Pijanowski, B.C., Brown, D.G., Shellito, B.A., and Manik, G.A. Using Neural Networks and GIS to Forecast Land Use Changes: A Land Transformation Model. Computers, Environment and Urban Systems, Vol. 26, No. 6, November 2002, pp. 553-575.
21. Turner, M.U., Spatial Simulation of Landscape Change in Georgia: A Comparison of 3 Transition Models. Landscape Ecology, Vol. 1, No. 1, 1987, pp. 29-36.
22. Brown, D.G., Pijanowski, B.C., and Duh, J.D. Modeling The Relationships Between Land Use and Land Cover On Private Lands In The Upper Midwest, USA. Journal of Environmental Management, Vol. 59, No. 4, August 2000, pp. 247-263.
23. Jantz, C.A., Goetz, S.J., and Shelley, M.K. Using the SLEUTH Urban Growth Model to Simulate the Impacts of Future Policy Scenarios on Urban Land Use in the Baltimore–Washington Metropolitan Area. Environment and Planning B: Planning and Design, Vol. 31, No. 2, March 2004, pp. 251-271.
24. Johnston, R.A., and Clay, M.J. A Graduate Course Comparing the Major Types of Urban Models. UCD-ITS-RR-04-8. Institute of Transportation Studies, Davis, Calif., 2004.

37
25. Golabi, K., Kulkarni, R., and Way, G.A. Statewide Pavement Management System. Interfaces, Vol. 12, No. 6, December 1982, pp. 5-21.
26. Golabi, K., and Shepard, R. Pontis: A System for Maintenance Optimization and Improvement of US Bridge Networks. Interfaces, Vol. 27, No. 1, January-February 1997, pp. 71-88.
27. Kaplan, S., and Garrick, B.J. On the Quantitative Definition of Risk. Risk Analysis, Vol. 1, No. 1, March 1981, pp. 11-27.
28. Haimes, Y.Y. Risk Modeling, Assessment, and Management, 2nd ed. Wiley, New York, 2004.
29. Linthicum, A.S., and Lambert, J.H. Risk Management for Infrastructure Corridors
Vulnerable To Adjacent Land Development. Journal of Risk Research. Vol. 13, No. 8, December 2010, pp. 983-1006.
30. Schroeder, M.J., and Lambert, J.H. Scenario-Based Multiple Criteria Analysis For
Infrastructure Policy Impacts And Planning. Journal of Risk Research. Vol. 14, No. 2, February 2011, pp. 191–214.
31. Karvetski, C.W., Lambert, J.H., and Linkov, I. Scenario and Multiple Criteria Decision
Analysis for Energy and Environmental Security of Military and Industrial Installations. Integrated Environmental Assessment and Management, Vol. 7, No. 2, December 2010, pp. 228-236.
32. Lambert, J. H., and Sarda, P. Terrorism Scenario Identification by Superposition. Journal of
Infrastructure Systems, Vol. 11, No. 4, December 2005, pp. 211-220. 33. Schmidt, G.W., Rash, S.M., Kincaid, L.R., Kim, E.K, and Lambert, J.H. Incorporating the
Costs of Access Management to the Prioritization of Transportation Corridors Vulnerable To Land Development. In Proceedings of Systems and Information Engineering Design Symposium. IEEE, Charlottesville, Va., April 2008, pp. 95-99.
34. Debinski, D.M., and Holt, R.D. A Survey and Overview of Habitat Fragmentation
Experiments. Conservation Biology, Vol. 14, No. 2, April 2000, pp. 342-355.
35. Virginia Outdoors Foundation. Current VOF Easement Guidelines, 2007. http://www.virginiaoutdoorsfoundation.org/VOF_land-guidelines.php. Accessed October 15, 2007.
36. Virginia’s Legislative Information System. Report to the General Assembly. http://leg2.state.va.us/dls/h&sdocs.nsf/682def7a6a969fbf85256ec100529ebd/69fadb22386f32d0852572b900687105?OpenDocument. Accessed July 25, 2011.

38

39
APPENDIX A
CORRIDORS IN THE STATEWIDE MOBILITY SYSTEM INCLUDED IN THE ANALYSIS

40

41
Table A-1. Eisenhower Interstate miles of Statewide Mobility System
Eisenhower Interstate Miles
095 2
195 13
1-95 6
295 6
381 10
395 6
581 8
64 31
66 14
77 16
81 83
85 10
95 70
I- 295 91
I- 395 24
I- 495 32
I- 581 4
I- 66 132
I- 77 107
I- 81 526
I- 85 120
I- 95 244
I- 95 HOV 10 I-264 COLLECTOR/DISTRIBUTOR EB 5
I-264 EB 6
I-264 WB 27
I-464 NB 9
I-464 SB 12
I-564 EB 4
I-64 432
I-64 EB 33
I-64 EB TO I-664 WB RAMP 2
I-64 REVERSIBLE HOV 13
I-64 WB 15
I-664 30
I-664 EB TO I-264 EB RAMP 1
I-664 RAMP 3
I-664 WB 13

42
I-95 5
SC 631 9
SC 655 11
(blank) 26
Total Miles 2,219

43
Table A-2. Intermodal Connector miles of Statewide Mobility System
Intermodal Connector Miles
17 1
3 3
3405 2
ARMISTEAD AVE 3
ATLANTIC AVE 2
HUNTINGTON AVE 1
NORVIEW AVE 3
POTOMIC MILLS RD 1
PR 237 1
SC 2000 4
SC 631 2
SC 649 2
SC 687 1
SC 784 2
WARWICK BLVD 3
(blank) 4
Total Miles 35

44
Table A-3. Major Strategic Highway Network Connector miles of Statewide Mobility System
Major Strategic Highway Network Conn. Miles
144 2
150 P 1
BRAMBLETON AVE 6
F- 047 1
FORT EUSTIS BLVD 1
INTERNATIONAL TERMINAL BLVD 5
LASALLE AVE 1
OCEANA BLVD 3
OLD WILLIAMSBURG RD 2
PENNIMAN RD 1
PR 144 1
PR 150 2
RT 199 1
SC 600 2
SC 619 10
SC 7100 5
SHORE DR 16
TIDEWATER DR 1
US 11 6
US 50 1
VIRGINIA BEACH BLVD 1
Total Miles 69

45
APPENDIX B
METHODS FOR INVENTORY/COUNTING OF ACCESS POINTS

46

47
The following methodology was for access point inventory along the SMS, CoSS, and selected parallel corridors.
A repeatable method was developed for collecting, cleansing, and analyzing data on access points on a statewide scale. The software used in this method includes arcGIS and, to a lesser extent, an arcGIS add-on called XTools Pro. Below are detailed steps on how to carry out this methodology to characterize the access points of any statewide mobility system. Note that this methodology was not developed with the goal of being 100% accurate. The results produced, however, can be used to identify areas which may require further inspection for the purpose of improved resource allocation or for a variety of other transportation policy needs. Loading in the Data
1. Open ArcMap and create a new map. 2. Click “Add Data” button. 3. Select the appropriate road database file and import the appropriate road network layer.
In this case we opened the file SPS_data.mdb and selected Network_with_Planning_data.
To test our methodology on the Virginia SMS, the roads belonging to the SMS were filtered out into their own layer.
4. Add satellite imagery file using the “Add Data” button. 5. Ensure all data layers use the same coordinate system.
Counting Procedure
1. Create a new shape file using ArcCatalog. 2. Select “Feature Type” as “Point” and ensure appropriate coordinate system appears
under “Description.” 3. Add the new shape file into the working map. 4. Select “Editor” and “Start Editing.” 5. Clarify that the type of source is the previously created Shapefile. 6. Zoom in to desired marking area. 7. Select “Sketch Tool.” 8. Begin marking access points by clicking on the road breaks until all desired roads are
marked. An example is shown in Figure B-1. This can be a labor-intensive process. Please see details on team efficiency during
the testing to gain an understanding of potential time required. 9. To save edits, select “Editor” and “Save Edits.”

48
Figure B-1. Access Points. Source: ESRI, i-cubed, USDA FSA, USGS, AEX, GeoEye, AeroGRID, Getmapping,
IGP. Density Quantification Two methods were used for the purpose of quantifying density data. The first method served for identifying data quality issues, as it was used to create a “Radius Buffer Density Map” to show areas in the upper ranges (for access point density) by means of categorizing each buffer using gradient colors. The second method was useful for concisely summarizing and presenting density data through plots (histograms) and tables. The latter method allowed for the characterization of the data through 1-mile and 1/2-mile segments. Method I: Radius Aggregation: A measure of the number of points within a defined radius of each individual access point
1. Create a buffer around each point using the buffer function from the ArcToolbox window.
Input Features should be the previously created access point shape file. Output Feature will be a new shape file. Specify the desired radius of the buffer in the linear unit field.
2. Join the newly created buffer shape file with the access point shape file using the “Join
Data” function. Select “Join data from another layer based on spatial location” to join to this layer. Select the new buffer shape file as the layer chosen to join to this layer.

49
The result will be a new shape file with the attribute count, which is a count of the number of access points that fall within each buffer.
An example of this buffer is shown in Figure B-2.
Figure B-2. Radius buffer. Source: ESRI, i-cubed, USDA FSA, USGS, AEX, GeoEye, AeroGRID, Getmapping,
IGP. Method II: Segmented Linear Aggregation: A measure of the number of points along a defined length of roadway
1. If the segments of your road network data are broken into unequal lengths, use XTools Pro to create equal length segments. (See Appendix A for instructions.)
2. Create a buffer around each segment using the buffer function from the ArcToolbox window.
Input Features should be the equally segmented road network. Output Feature will be a new shape file. Specify the desired half-width of the buffer in the linear unit field (should be
appropriate width to encompass all access points). 3. Join the newly created buffer shape file with the access point shape file using Join Data
function. Select “Join data from another layer based on spatial location” to join to this layer. Select the new buffer shape file as the layer chosen to join to this layer. The result will be a new shape file with the attribute count, which is a count of the
number of access points that fall within each buffer. An example is shown in Figure B-3.

50
Figure B-3. Linear buffer. Source: ESRI, i-cubed, USDA FSA, USGS, AEX, GeoEye, AeroGRID, Getmapping,
IGP.
Visual Representation of Data
After access point data are aggregated using one of the two methods discussed, the data can be visually represented on the map using colors to represent specific counts or quantiles. Radius Buffer Density Map (from Method I)
After following the steps in Method I:
1. Create a color ramp through Layer Properties > Symbology > Quantities > Graduated Colors and use Count_ as the Value in the Fields box. Adjust the Classification requirements as needed. An example of the Radius Buffer Density Map is shown in Figure B-4.

51
Figure B-4. 11 Radius buffer density map. Source: ESRI, i-cubed, USDA FSA, USGS, AEX, GeoEye,
AeroGRID, Getmapping, IGP. Linear Buffer Density Map (from Method II)
After following the steps in Method II: 1. Create a color ramp through Layer Properties > Symbology > Quantities > Graduated
Colors and use Count_ as the Value in the Fields box. Adjust the Classification requirements as needed. An example of the Radius Buffer Density Map is shown in Figure B-5. .

52
Figure B-5. Linear buffer density map. Source: ESRI, i-cubed, USDA FSA, USGS, AEX, GeoEye, AeroGRID,
Getmapping, IGP. Data Quality
In order to identify any segments that may have been missed in the counting, the team reinvestigated segments with counts of zero access points.
Segments with Zero Access Points:
1. Open the attribute table of the file merged of the access points file and linear buffer file. 2. From the “Options” drop down select “Select By Attributes.” 3. Select “ ‘Count_’ = ‘0’ ” to show all segments that have zero access points counted
within them. 4. Choose the “Selected” option in the field “Show” to look at these segments.
In order to identify any segments that may have been over-counted, the team
reinvestigated segments with high density access points.
1. Create a Radial Density Map as per instructions above. 2. Look at the attribute table of the density map and order each segment by the attribute
count, making the highest count appear at the top of the table. 3. Double click on a row to zoom to it on the map and check for double counting.

53
Potential Obstacles
As the team tested the methodology on the Virginia SMS, it noted several obstacles that were rare but did occur. These included:
The road network feature did not follow the satellite imagery exactly. In this case, it
was important to drop the access point shapes along the road network line while following the satellite imagery with the eye.
It was difficult to detect access points on the satellite imagery due to: poor image resolution, tree cover, or clouds.
Limitations of Methodology
This methodology was designed under the requirement that it be able to be quickly implemented. As a result of this, the method presents the following limitations:
All access points are treated equally. For example, a four-way intersection is treated
the same as a rural driveway.
The Radius Aggregation Density Quantification method (Method I) can cause several problems:
Intersection counts are inflated due to the radial nature of the buffer (points from
the intersecting road are captured near the intersection). In only a couple of cases, the road split into two parallel segments in urban areas.
Counts in these areas would be inflated due to the radial buffer capturing the parallel road’s access points in addition to its own.
Roadway Segmenting: Process to segment a roadway shapefile into defined, equal lengths. This was used to divide the Virginia SMS shapefile into equal length segments rather than the default, unequal segment lengths.
1. Install the XTools Pro extension for ArcMap, which can be accessed through the website www.xtoolspro.com.
2. Merge segments of the road network into one single segment by selecting all segments and using the “Merge” function in the “Editor” menu (must have started editing before).
3. Choose any of the features to merge. 4. From the XTools Pro menu, select “Feature Conversions” > “Split Polylines.” 5. Under input feature layer, select the layer of merged segments. 6. Under the field “Output storage” specify where the file should be saved. 7. Split the polylines into specific segments of desired length (this length depends on the
goal of your analysis).

54
8. Reassociate Attributes from Original File to Segmented File: This process will assign file attributes of the original feature class to each segmented feature based on the spatial location. a. Delete Attributes from Segmented File.
Select Fields under the layer Properties. Clear All fields and recheck only FID and Shape. Select Data > Export Data to create new layer with only selected attribute
Fields. b. Spatially Join Files
Use Spatial Join tool in ArcToolbox > Analysis Tools > Overlay > Spatial Join. Target Features is segmented file. Join Features is the original attribute file.
c. Manually delete any duplicated attributes as needed.

55
APPENDIX C
BASE-PERSPECTIVE RISK LEVEL ACCESS POINT DENSITY AND TRAFFIC VOLUMES FOR SELECTED SMS AND CoSS CORRIDORS

56

57
Figure C-1. Base-perspective risk level access point density, and traffic volumes for I-81: Crescent Corridor

58
Figure C-2. Base-perspective risk level access point density and traffic volumes for U.S. 13: Eastern Shore Corridor

59
Figure C-3. Base-perspective risk level access point density and traffic volumes for I-64: East to West Corridor

60
Figure C-4. Base-perspective risk level access point density and traffic volumes for U.S. 460: Heartland Corridor
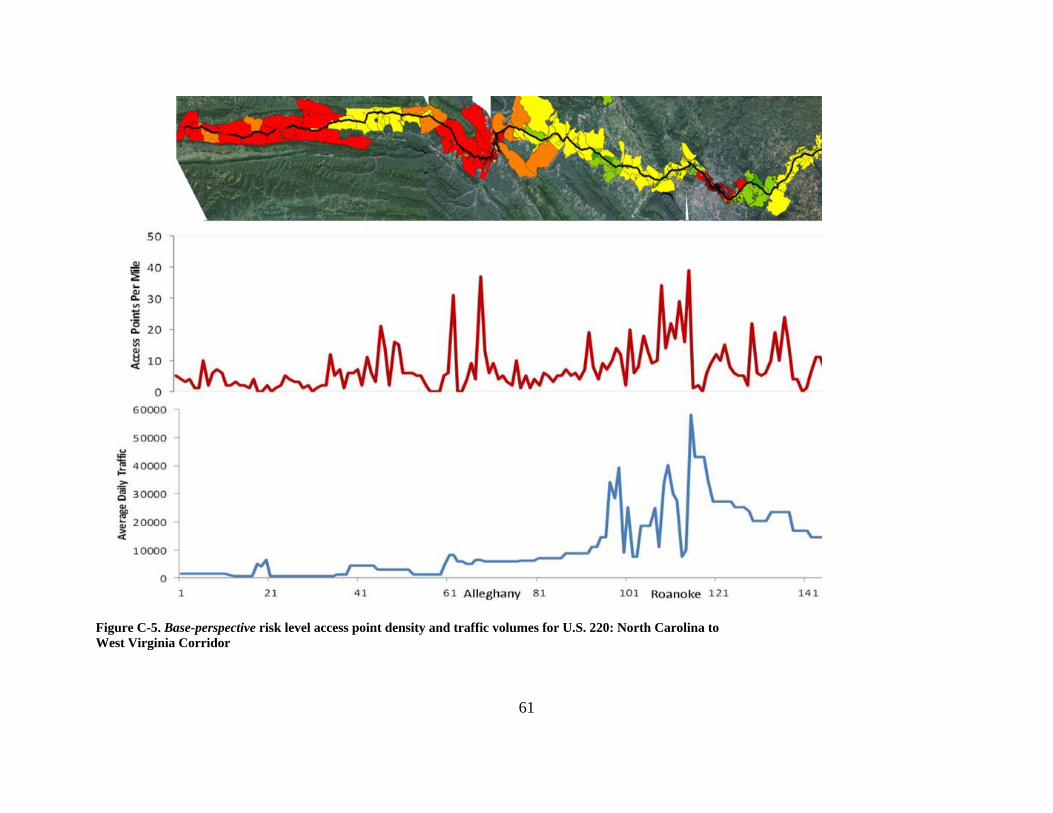
61
Figure C-5. Base-perspective risk level access point density and traffic volumes for U.S. 220: North Carolina to West Virginia Corridor

62
Figure C-6. Base-perspective risk level access point density and traffic volumes for I-66: Northern Virginia Connector Corridor

63
Figure C-7. Base-perspective risk level access point density and traffic volumes for U.S. 29: Seminole Corridor

64
Figure C-8. Base-perspective risk level access point density and traffic volumes for U.S. 58: Southside Corridor

65
Figure C-9. Base-perspective risk level access point density and traffic volumes for U.S. 17: Tidewater Corridor

66
Figure C-10. Base-perspective risk level access point density and traffic volumes for I-95: Washington to North Carolina Corridor

67
Figure C-11. Base-perspective risk level access point density and traffic volumes for I-77: Western Mountain Corridor

68

69
APPENDIX D
THRESHOLD VALUES FOR LAND DEVELOPMENT RISK PERSPECTIVES

70

71
The index of land development risk is in each of three perspectives: economic, demographic, and land-use. Each factor is assessed with an integer level 1 through 4 that is weighted according to the Weight column.
Table D-1. Land development risk index based on factor values for the economic, demographic, and land-use perspective
Perspective Rank Unit Weight 1 (Highest
Risk)
2
3
4 (Lowest
Risk) Economic Job Housing Balance Abs(#
Jobs/ # Housing units)-1
33.3% <0.23 >=0.23 and <0.41
>=0.41 and <0.66
>=0.66
Employment Forecast People 33.3% >84503 <= 84503 and
>21448
<=21448 and >9801
<=9801
HubZone "1" if HubZone, "0" else
33.3% 1 0
Demographic Population Density People per Square Km.
33.3% >2501.53 <=2501 and >485
<=485 and >62
<=62
Population Projection % 33.3% >53.50 <=53 and >21
<=21 and >1
<=1
Unemployment People 33.3% <976 >=976 and <2026
>=2026 and <5809
>=5809
Land-use Home Value Dollars 50.0% >289797 <=289797 and
>199023
<=199023 and
>138342
<=138342
Suburban/Urban/Rural Classification
"1" if Rural, "2" if Urban, "3" if Suburban
50.0% 3 1 2
1 University of Virginia Center for Risk Management of Engineering Systems. Land Development Risk Analysis for the Statewide Mobility System, Charlottesville, undated. www.virginia.edu/crmes/corridorprotection. Accessed January 28, 2011. 2 Virginia Department of Transportation. VDOT Six-Year Improvement Program. Richmond, undated. http://syip.virginiadot.org/Pages/allProjects.aspx. Accessed January 28, 2011. 3 Virginia Department of Transportation. Statewide Transportation Improvement Program. Richmond, undated. http://www.virginiadot.org/about/stip.asp. Accessed January 28, 2011. 4 Commonwealth of Virginia. LIS > Code of Virginia > 15.2-2223. Richmond, undated. http://leg1.state.va.us/000/cod/15.2‐2223.HTM. Accessed January 28, 2011. 5 Commonwealth of Virginia. LIS > Code of Virginia > 15.2-2222.1. Richmond, undated. http://leg1.state.va.us/cgi‐bin/legp504.exe?000+cod+15.2‐2222.1. Accessed January 28, 2011. 6 Commonwealth of Virginia. LIS > Code of Virginia > 15.2-2223.1. Richmond, undated. http://leg1.state.va.us/cgi‐bin/legp504.exe?000+cod+15.2‐2223.1. Accessed January 28, 2011. 7 Dulles Corridor Metrorail Project. Dulles Metrorail - Frequently Asked Questions. Vienna, undated. http://www.dullesmetro.com/info/faqs.cfm#3. Accessed October 1, 2010. 8 Department of Rail and Public Transportation. 2035 Surface Transportation Plan Update, Richmond, 2009. http://www.drpt.virginia.gov/special/files/2035%20Surface%20Transportation%20Plan%20Update.pdf. Accessed October 1, 2010. 9 Office of Intermodal Planning and Investment. Corridors of Statewide Significance: Introduction, Richmond, undated. http://www.vtrans.org/resources/Introduction_Chapter.pdf. Accessed January 3, 2011. 10 Pate-Cornell, M. E. Uncertainties in risk analysis: Six levels of treatment. Reliability Engineering & System Safety, Vol. 54, No. 2-3, 1996, pp. 95-111. 11 ESRI. World Imagery, location unknown, December 12, 2009. © 2009 Esri, © 2009 i-cubed, © 2009 USDA FSA, © 2009 USGS, © 2009 AEX, © 2009 GeoEye, © 2009 AeroGRID, © 2009 Getmapping, © 2009 IGP. http://www.arcgis.com/home/item.html?id=10df2279f9684e4a9f6a7f08febac2a9. Accessed September 10, 2010. 12 Environmental Protection Agency. HUD-DOT-EPA Interagency Partnership for Sustainable Communities. Environmental Protection Agency, location unknown, 2010. http://www.epa.gov/dced/partnership/index.html. Accessed December 26, 2009. 13 FHWA. Report of the Secretary of Transportation to the United States Congress on Preservation of Transportation Corridors, 1994. http://www.environment.fhwa.dot.gov/guidebook/vol2/doc5a.pdf. Accessed September 30, 2007. 14 Stokes, R.W., E.R. Russell, and B.K. Vellanki. Recommended corridor preservation program for Kansas highways. K-TRAN: KSU- 93-1. Kansas State University, for the Kansas Department of Transportation. Manhattan. 1994. 15 Kleinburd, R. Corridor Preservation in Delaware. Second National Access Management Conference, pp. 409-414. National Technical Information Service, Springfield, VA, 1996. 16 Johnston, R.A., and Clay, M.J. A graduate course comparing the major types of urban models. UCD-ITS-RR-04-8. Institute of Transportation Studies, Davis, CA. 2004. 17 Waddell, P. UrbanSim: Modeling urban development for land use, transportation and environmental planning. Journal of the American Planning Association, Vol. 68, No. 3, 2002, pp. 297-314. 18 Lowry I. S. A Model of Metropolis. RM-4035-RC, The RAND Corporation, Santa Monica, California, 1964. 19 Skiar, F. and R. Costanza, The Development of Dynamic Spatial Models for Landscape Ecology: A Review and Prognosis. Quantitative Methods in Landscape Ecology, M. G. Turner and R. Gardner (Ed.). Springer-Verlag, New York, 1991, pp. 239-288. 20 Pijanowski, Bryan C., Daniel G. Brown, Bradley A. Shellito and Gaurav A. Manik. Using neural networks and GIS to forecast land use changes: a Land Transformation Model. Computers, Environment and Urban Systems, Vol. 26, No. 6, 2002, pp. 553-575. 21 Turner, M. U., Spatial Simulation of Landscape Change in Georgia: A Comparison of 3 Transition Models. Landscape Ecology, Vol. 1, 1987, pp. 29-36. 22 Brown, D.G., Pijanowski, B.C., Duh, J.D. Modeling the relationships between land use and land cover on private lands in the Upper Midwest, USA. Journal of Environmental Management, Vol. 59, 2000, pp. 247-263. 23 Jantz, C A, S J Goetz, M K Shelley. Using the SLEUTH urban growth model to simulate the impacts of future policy scenarios on urban land use in the Baltimore –Washington metropolitan area. Environment and Planning B: Planning and Design, Vol. 31, No. 2, 2004, pp. 251 – 271. 24 Johnston, R.A., and Clay, M.J. A graduate course comparing the major types of urban models. UCD-ITS-RR-04-8. Institute of Transportation Studies, Davis, CA, 2004. 25 Virginia’s Legislative Information System. Report to the General Assembly. http://leg2.state.va.us/dls/h&sdocs.nsf/682def7a6a969fbf85256ec100529ebd/69fadb22386f32d0852572b900687105?OpenDocument. Accessed July 25, 2011./