lakeshore air toxics study (lats) jeff stoakes senior environmental manager indiana department of...
TRANSCRIPT
Lakeshore Air Toxics Study(LATS)Jeff Stoakes
Senior Environmental Manager
Indiana Department of Environmental
Management (IDEM)
1
Overview• The Northwest Indiana Lakeshore area is a highly
industrialized and heavily travelled area of the state– Includes U.S. Steel, BP Products, ArcelorMittal Indiana
Harbor and Burns Harbor, I-65, I-80/94, I-90
• Studies have previously estimated that the area may have elevated air toxics concentrations– 2005 United States Environmental Protection Agency (U.S.
EPA) National Air Toxic Assessment (NATA)– 2009 USA Today report The Smokestack Effect– U.S. EPA Assessing Outdoor Air Near Schools
2
Executive Summary• Every modeled census tract had similar to lower additional lifetime cancer risks than
the NATA for permitted stationary sources – The refined treatment of coke oven emissions and a better emissions inventory were factors in the Lakeshore
study’s additional lifetime cancer risk estimation being lower than previous estimates – IDEM believes the refined, current (2009-2011) inventory and detailed modeling analysis produced more
accurate local results than previous estimates
• The greatest level of additional lifetime cancer risk and non-cancer hazard is attributable to onroad mobile sources (cars and trucks)
– Existing and proposed U. S. EPA rules are expected to greatly reduce the risk and hazard from mobile sources over time
– Benzene and Formaldehyde are the major mobile source pollutants
• Evaluation of comparable ambient air toxics monitoring data available show the Lakeshore area measured similar air toxic concentrations as other United States cities
• IDEM is working with permitted sources to explore opportunities for pollution prevention
3
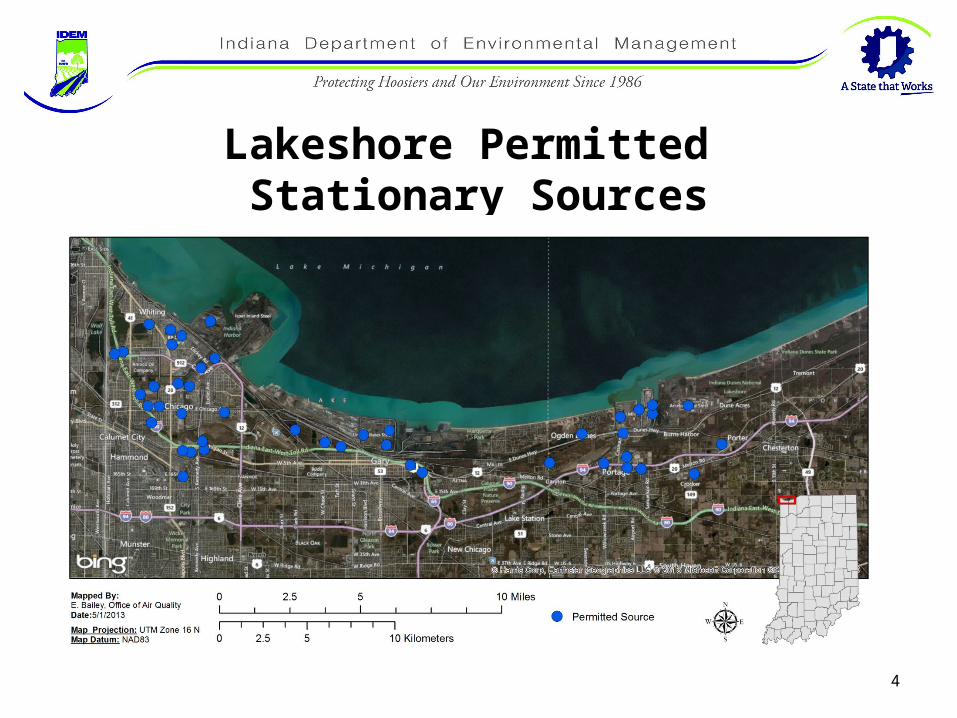
Lakeshore Permitted Stationary Sources
4
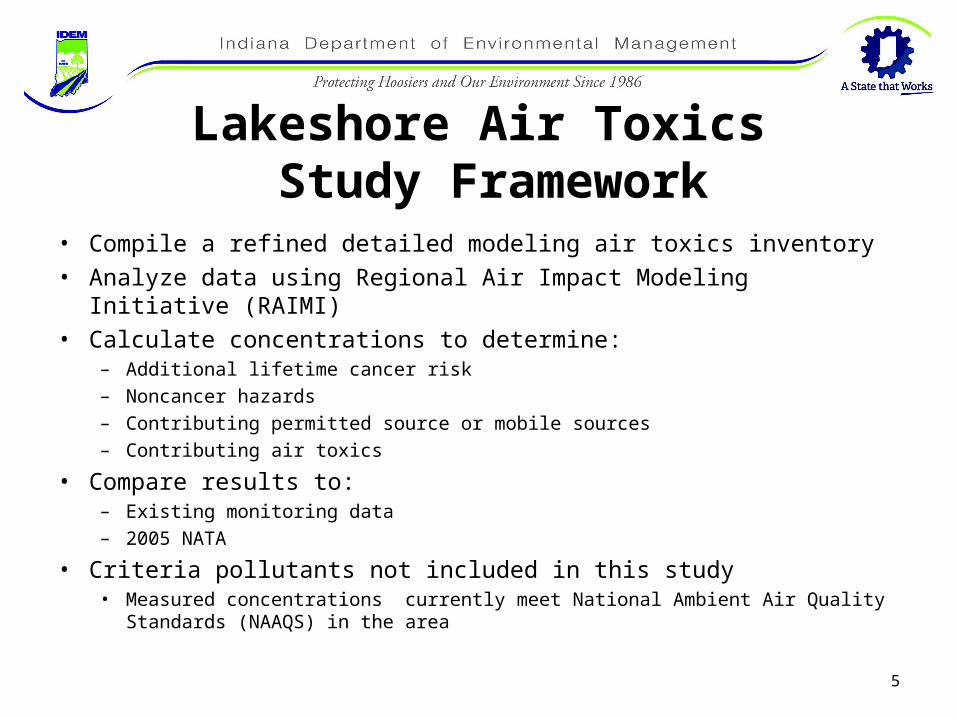
Lakeshore Air Toxics Study Framework
• Compile a refined detailed modeling air toxics inventory• Analyze data using Regional Air Impact Modeling Initiative (RAIMI)• Calculate concentrations to determine:
– Additional lifetime cancer risk– Noncancer hazards– Contributing permitted source or mobile sources– Contributing air toxics
• Compare results to:– Existing monitoring data– 2005 NATA
• Criteria pollutants not included in this study• Measured concentrations currently meet National Ambient Air Quality Standards (NAAQS)
in the area
5
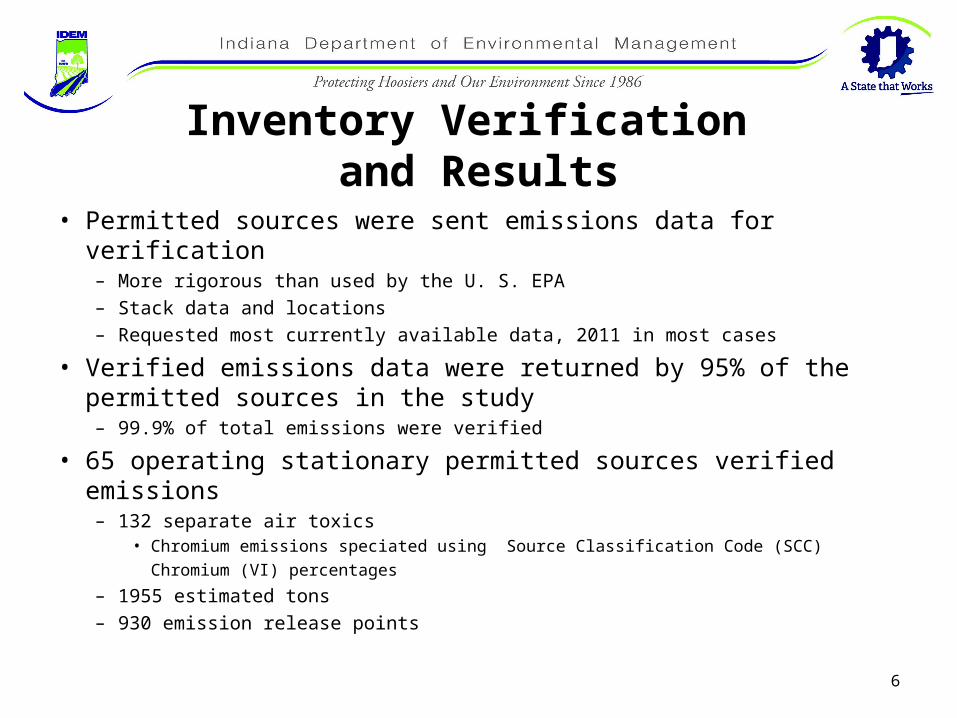
Inventory Verification and Results
• Permitted sources were sent emissions data for verification– More rigorous than used by the U. S. EPA– Stack data and locations– Requested most currently available data, 2011 in most cases
• Verified emissions data were returned by 95% of the permitted sources in the study– 99.9% of total emissions were verified
• 65 operating stationary permitted sources verified emissions – 132 separate air toxics
• Chromium emissions speciated using Source Classification Code (SCC) Chromium (VI) percentages
– 1955 estimated tons– 930 emission release points
6
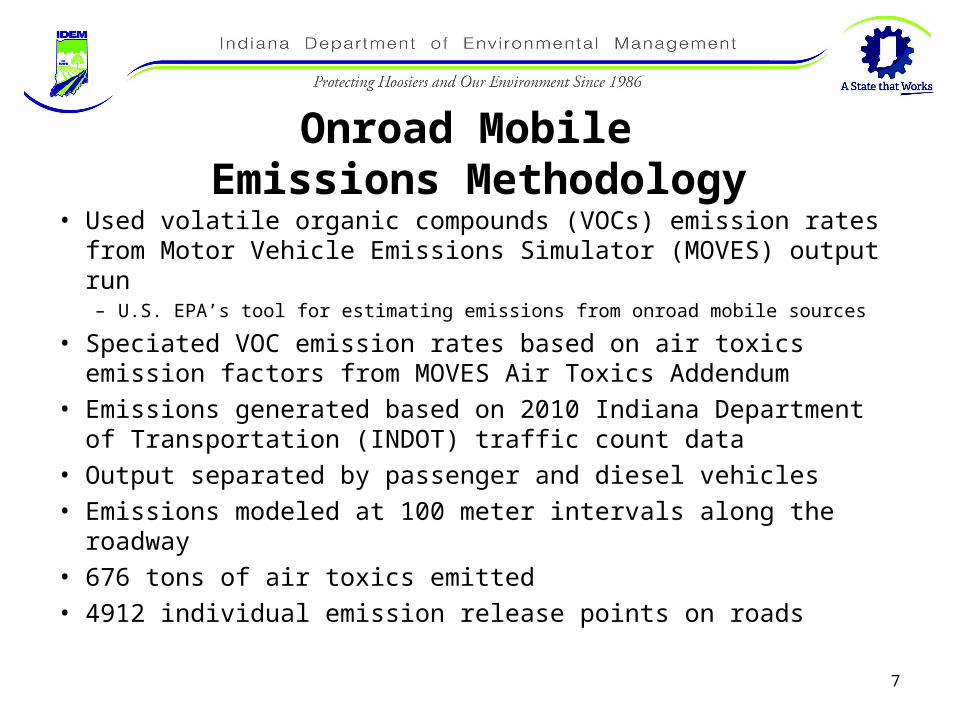
Onroad Mobile Emissions Methodology
• Used volatile organic compounds (VOCs) emission rates from Motor Vehicle Emissions Simulator (MOVES) output run– U.S. EPA’s tool for estimating emissions from onroad mobile sources
• Speciated VOC emission rates based on air toxics emission factors from MOVES Air Toxics Addendum
• Emissions generated based on 2010 Indiana Department of Transportation (INDOT) traffic count data
• Output separated by passenger and diesel vehicles• Emissions modeled at 100 meter intervals along the roadway• 676 tons of air toxics emitted• 4912 individual emission release points on roads
7
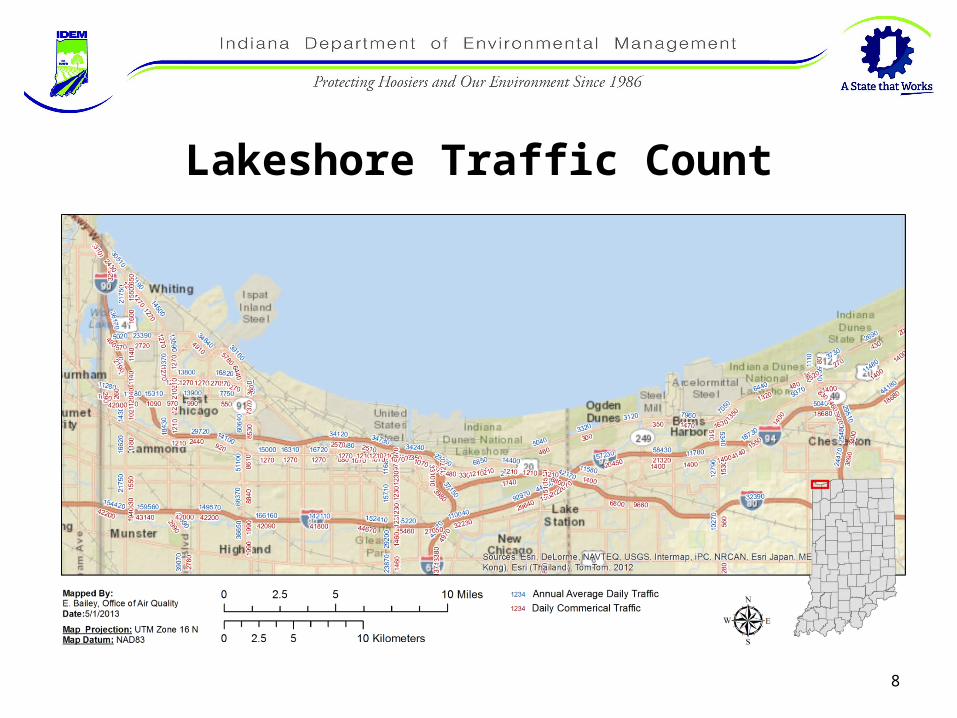
Lakeshore Traffic Count
8
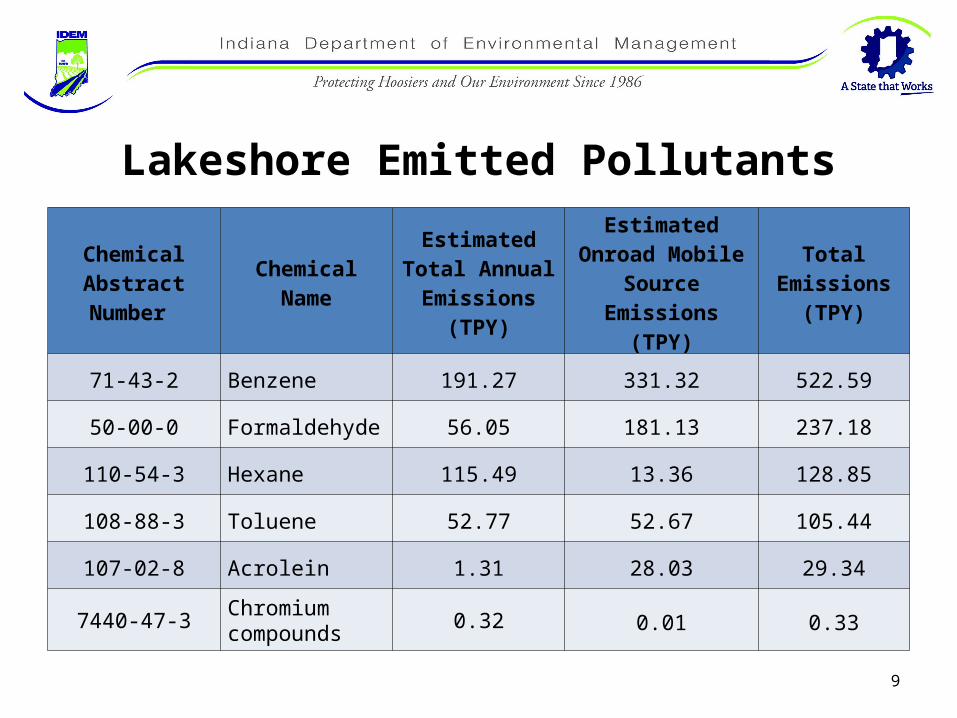
Lakeshore Emitted Pollutants
Chemical Abstract Number
Chemical NameEstimated Total
Annual Emissions (TPY)
Estimated Onroad Mobile Source
Emissions (TPY)
Total Emissions (TPY)
71-43-2 Benzene 191.27 331.32 522.59
50-00-0 Formaldehyde 56.05 181.13 237.18
110-54-3 Hexane 115.49 13.36 128.85
108-88-3 Toluene 52.77 52.67 105.44
107-02-8 Acrolein 1.31 28.03 29.34
7440-47-3 Chromium compounds 0.32 0.01 0.33
9
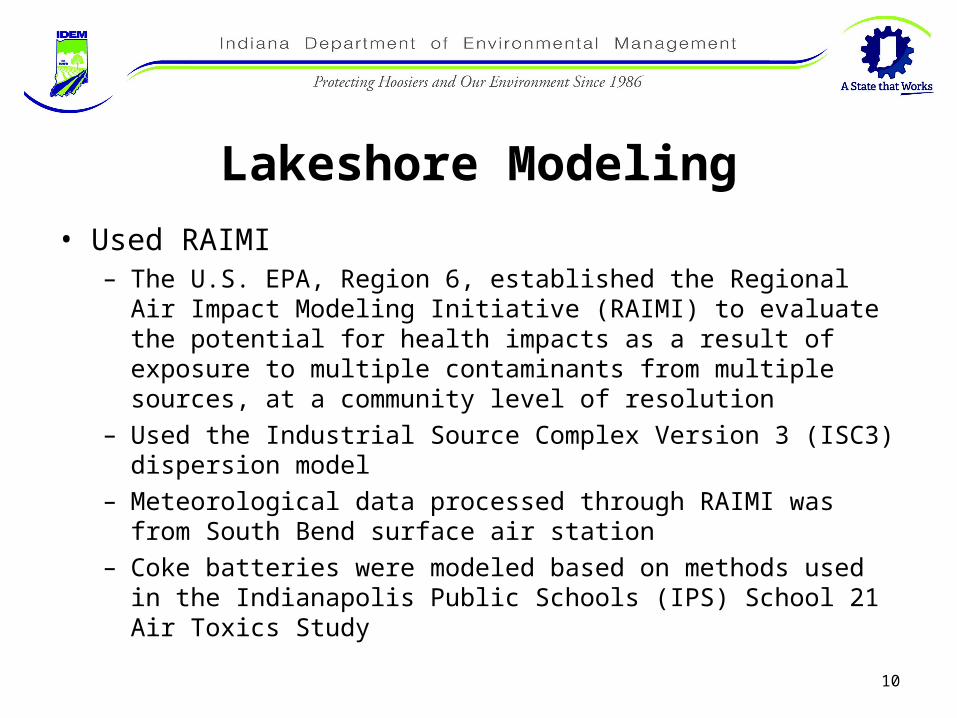
Lakeshore Modeling• Used RAIMI
– The U.S. EPA, Region 6, established the Regional Air Impact Modeling Initiative (RAIMI) to evaluate the potential for health impacts as a result of exposure to multiple contaminants from multiple sources, at a community level of resolution
– Used the Industrial Source Complex Version 3 (ISC3) dispersion model– Meteorological data processed through RAIMI was from South Bend
surface air station– Coke batteries were modeled based on methods used in the
Indianapolis Public Schools (IPS) School 21 Air Toxics Study
10
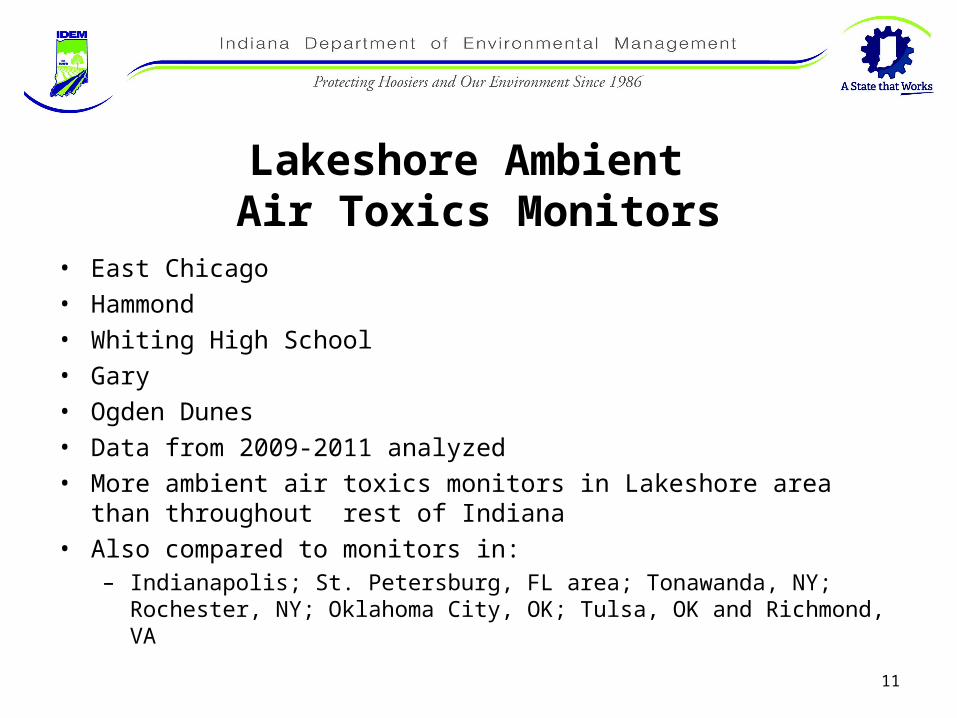
Lakeshore Ambient Air Toxics Monitors
• East Chicago• Hammond• Whiting High School• Gary• Ogden Dunes• Data from 2009-2011 analyzed• More ambient air toxics monitors in Lakeshore area than throughout rest
of Indiana• Also compared to monitors in:
– Indianapolis; St. Petersburg, FL area; Tonawanda, NY; Rochester, NY; Oklahoma City, OK; Tulsa, OK and Richmond, VA
11
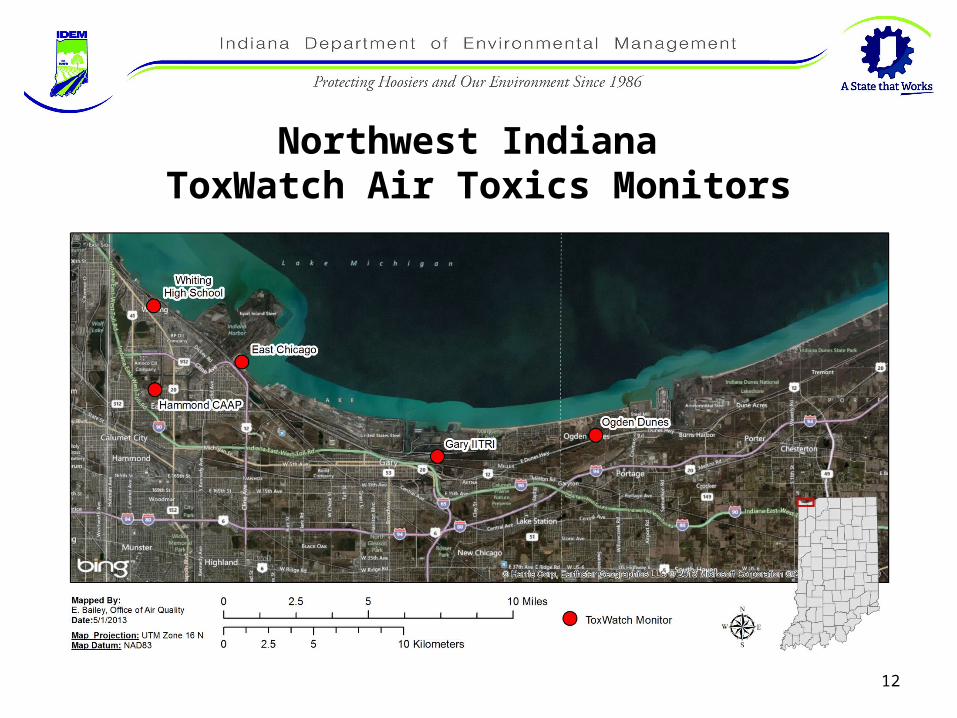
Northwest Indiana ToxWatch Air Toxics Monitors
12
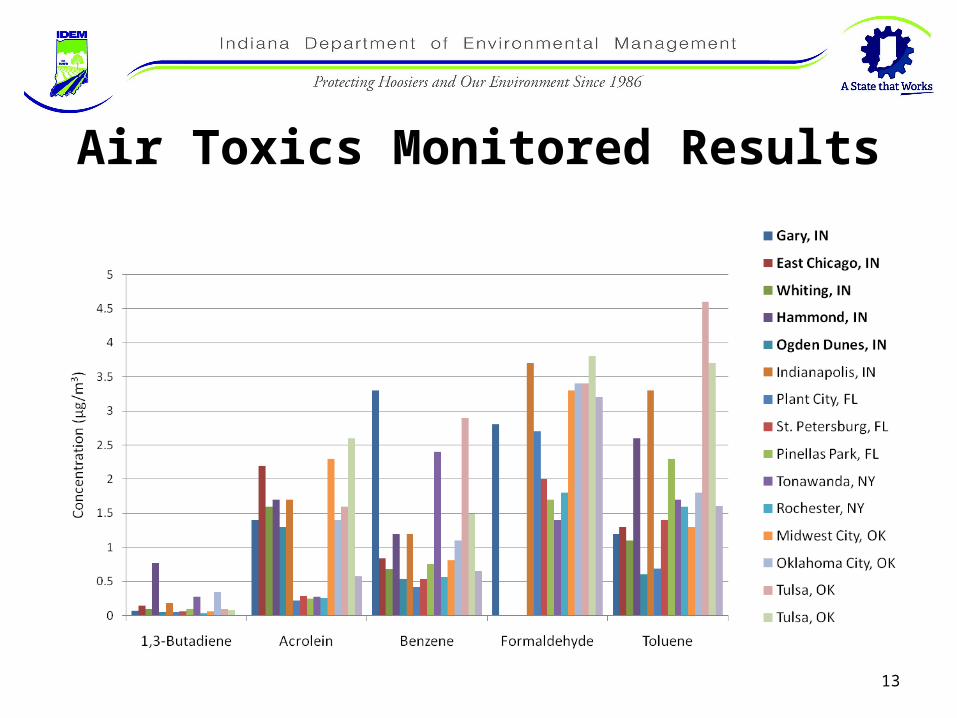
Air Toxics Monitored Results
13
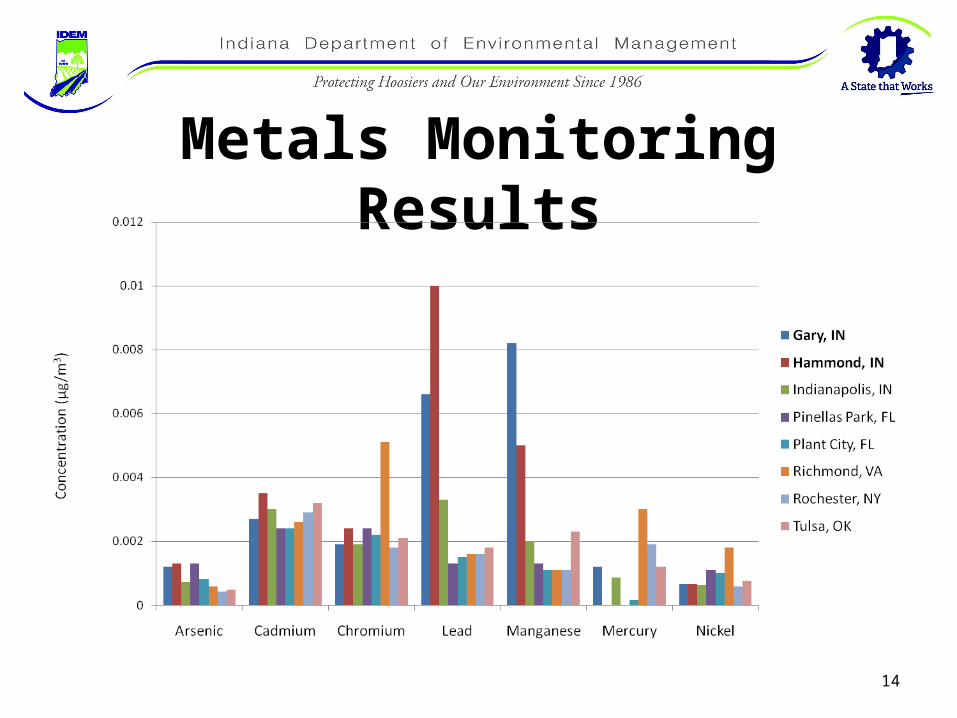
Metals Monitoring Results
14
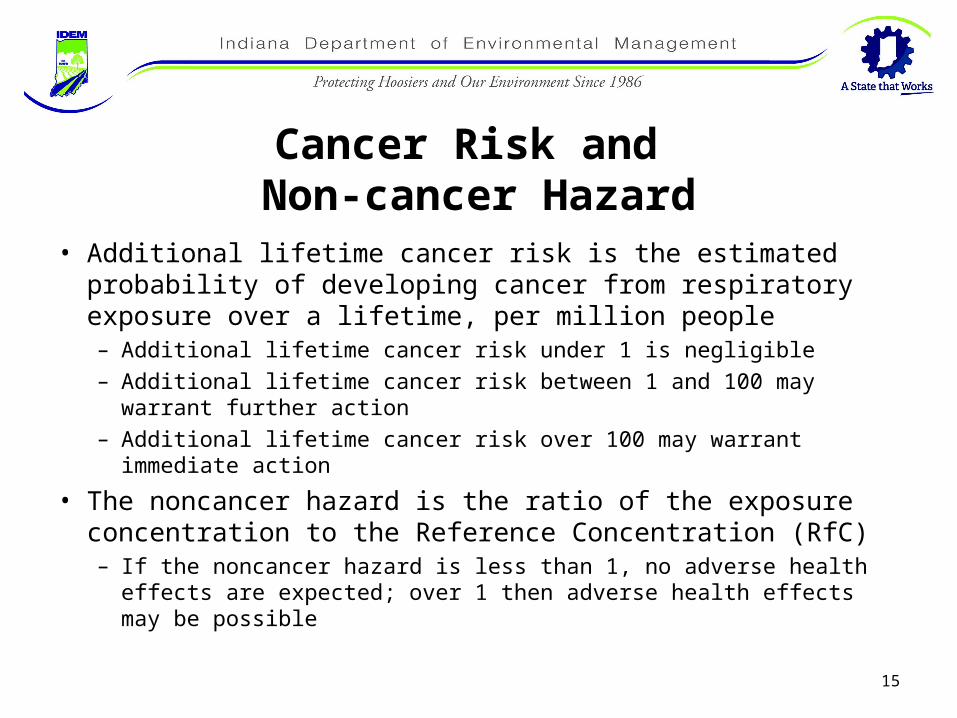
Cancer Risk and Non-cancer Hazard
• Additional lifetime cancer risk is the estimated probability of developing cancer from respiratory exposure over a lifetime, per million people– Additional lifetime cancer risk under 1 is negligible– Additional lifetime cancer risk between 1 and 100 may warrant further
action– Additional lifetime cancer risk over 100 may warrant immediate action
• The noncancer hazard is the ratio of the exposure concentration to the Reference Concentration (RfC)– If the noncancer hazard is less than 1, no adverse health effects are
expected; over 1 then adverse health effects may be possible
15
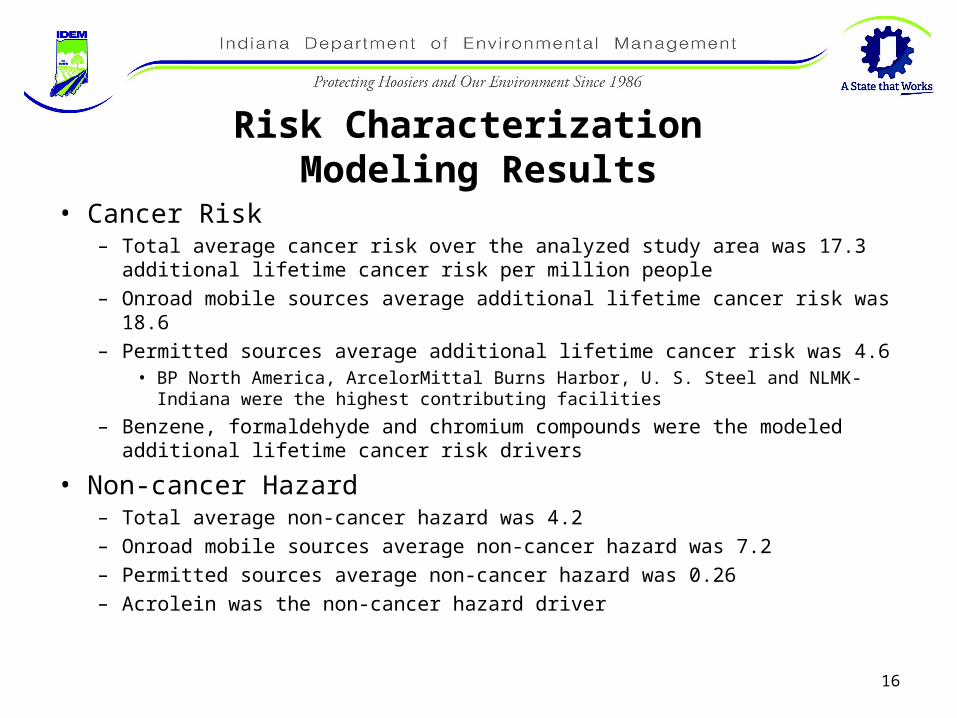
Risk Characterization Modeling Results
• Cancer Risk– Total average cancer risk over the analyzed study area was 17.3 additional lifetime
cancer risk per million people– Onroad mobile sources average additional lifetime cancer risk was 18.6– Permitted sources average additional lifetime cancer risk was 4.6
• BP North America, ArcelorMittal Burns Harbor, U. S. Steel and NLMK-Indiana were the highest contributing facilities
– Benzene, formaldehyde and chromium compounds were the modeled additional lifetime cancer risk drivers
• Non-cancer Hazard– Total average non-cancer hazard was 4.2– Onroad mobile sources average non-cancer hazard was 7.2– Permitted sources average non-cancer hazard was 0.26– Acrolein was the non-cancer hazard driver
16
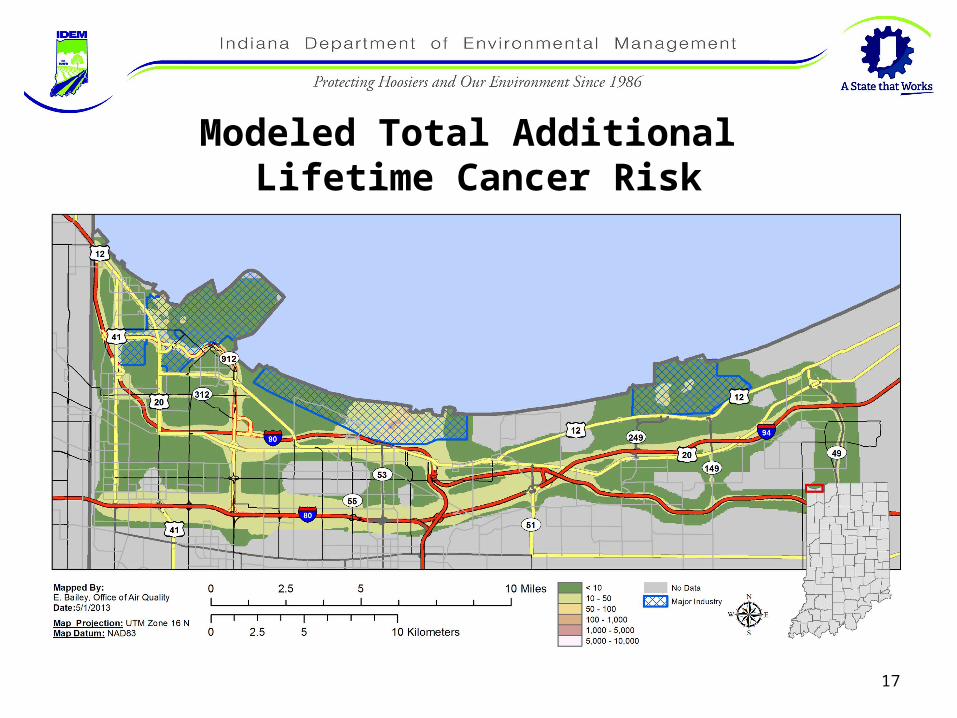
Modeled Total Additional Lifetime Cancer Risk
17
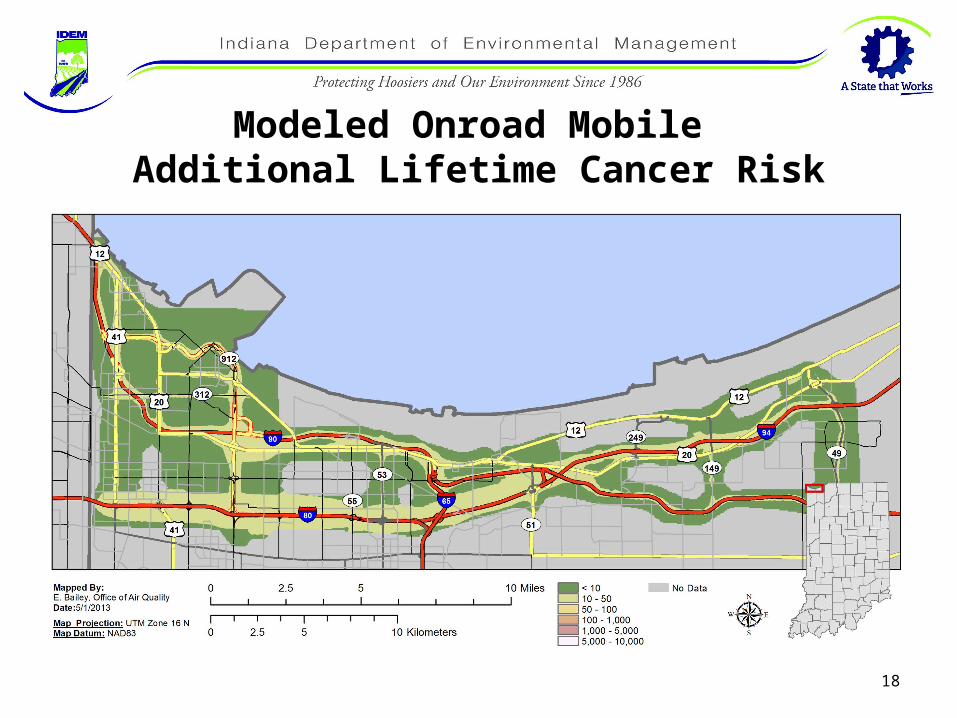
Modeled Onroad Mobile Additional Lifetime Cancer Risk
18
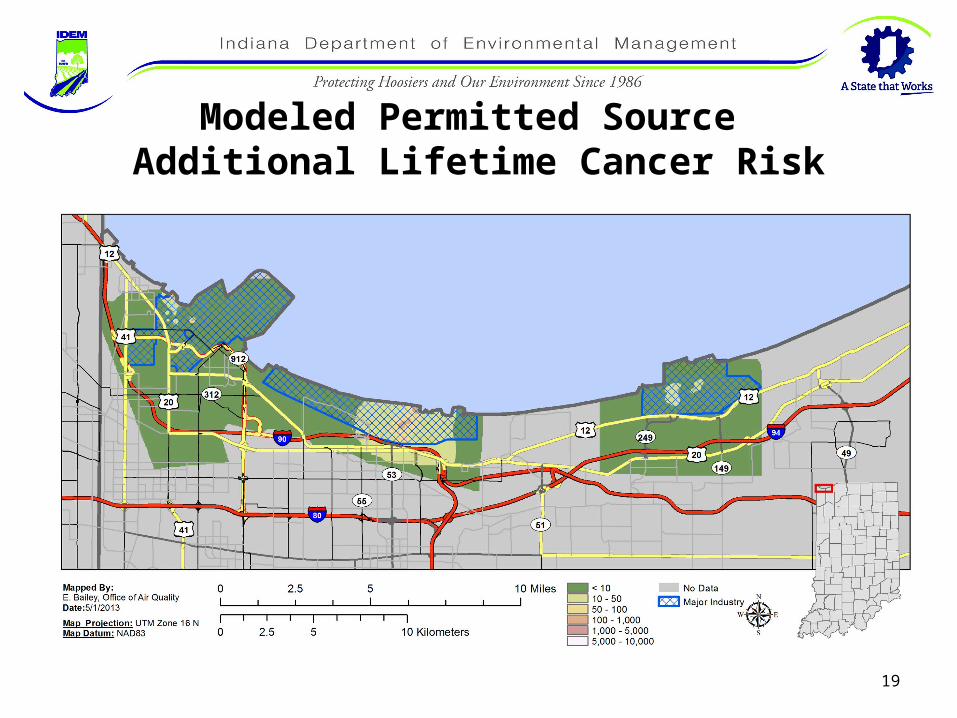
Modeled Permitted Source Additional Lifetime Cancer Risk
19

Modeled Total Non-cancer Hazard
20
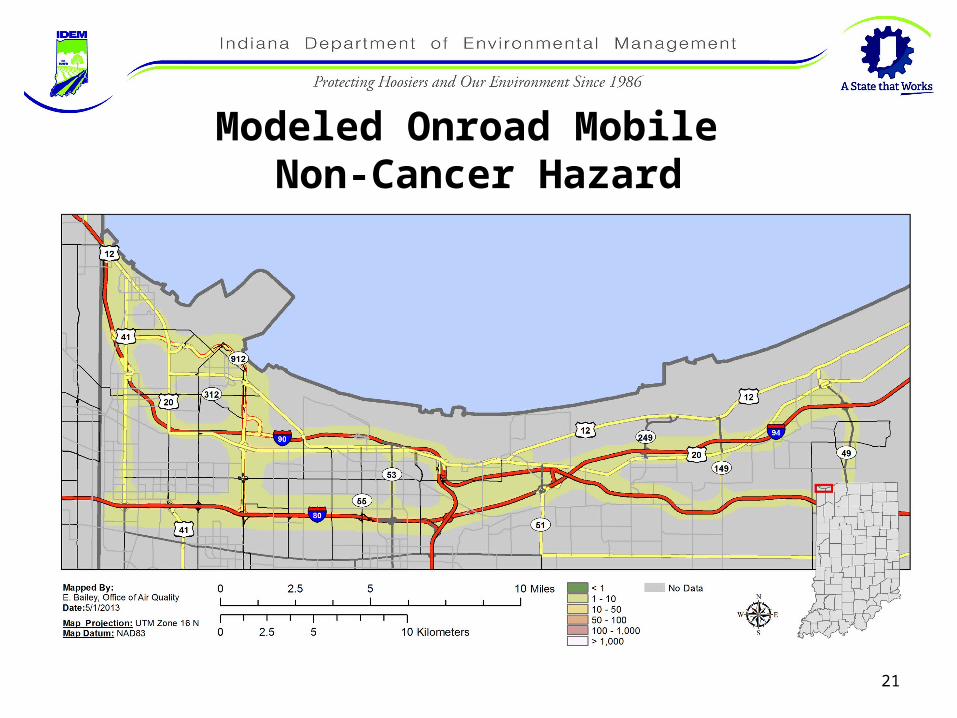
Modeled Onroad Mobile Non-Cancer Hazard
21
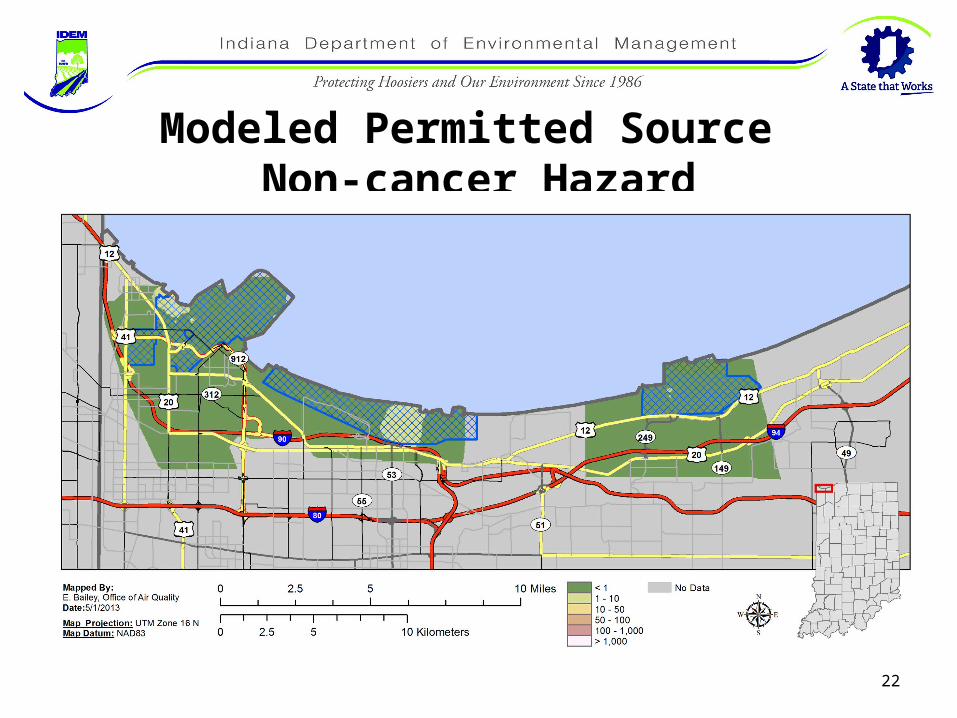
Modeled Permitted Source Non-cancer Hazard
22
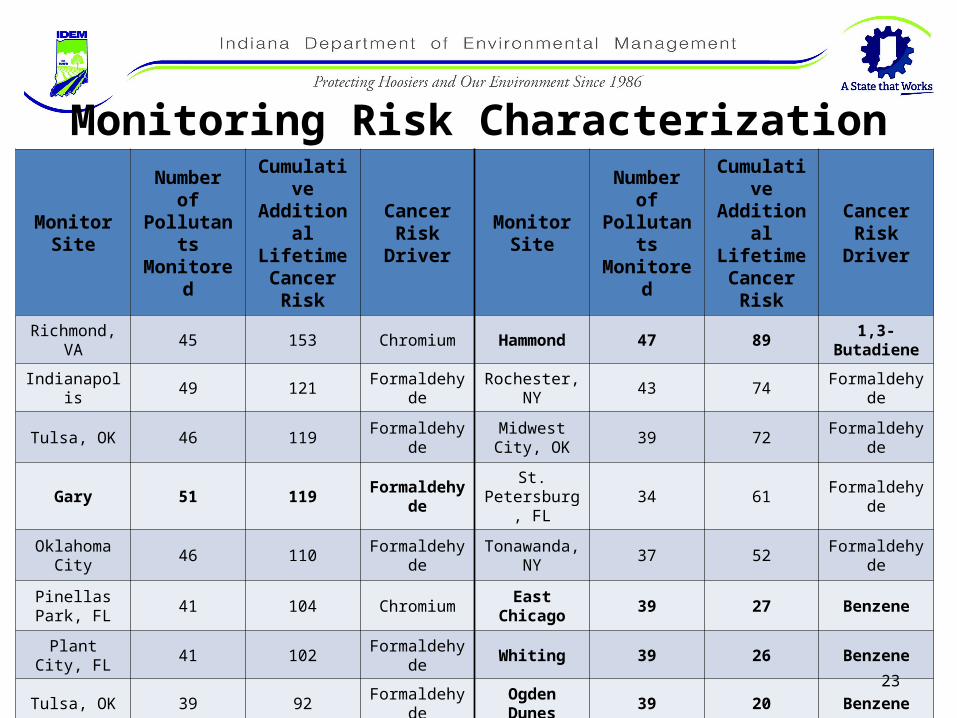
Monitoring Risk CharacterizationMonitor
Site
Number of Pollutants Monitored
Cumulative Additional Lifetime
Cancer Risk
Cancer Risk Driver
Monitor Site
Number of Pollutants Monitored
Cumulative Additional
Lifetime Cancer Risk
Cancer Risk Driver
Richmond, VA 45 153 Chromium Hammond 47 89 1,3-Butadiene
Indianapolis 49 121 Formaldehyde Rochester, NY 43 74 Formaldehyde
Tulsa, OK 46 119 Formaldehyde Midwest City, OK 39 72 Formaldehyde
Gary 51 119 Formaldehyde St. Petersburg, FL 34 61 Formaldehyde
Oklahoma City 46 110 Formaldehyde Tonawanda, NY 37 52 Formaldehyde
Pinellas Park, FL 41 104 Chromium East Chicago 39 27 Benzene
Plant City, FL 41 102 Formaldehyde Whiting 39 26 Benzene
Tulsa, OK 39 92 Formaldehyde Ogden Dunes 39 20 Benzene
Bold= Lakeshore area Monitors
23
Acrolein and Monitoring Issues• Acrolein is a common pollutant found in many urban areas
– Most commonly associated with the burning of organic materials and from motor vehicles
– Can be formed in the air when pollutants react with sunlight and other chemicals.
– Exposure may cause watery eyes, burning of the nose and throat and a decreased breathing rate
• Acrolein monitored concentrations has recently become a national concern– Current methods appear to bias results high so actual acrolein concentrations
are likely lower than those recorded– Evidence indicates that new procedures may need to be developed in order to
better quantify acrolein concentrations in monitoring data
24
Model to Monitoring Ratio
• Model to monitoring comparisons are completed to assess if there are any potential gaps with the emissions and modeling data– A model to monitor ratio of 1 indicates the concentrations are the same– U. S. EPA considers modeled to monitored ratios from 0.33 to 3 as acceptable
and from 0.5 to 2 to be good model to monitor agreement.
Lakeshore Air Toxics Results• The average ratio for benzene, acetaldehyde, formaldehyde
and chromium compounds are in the acceptable range• Due to monitoring issues, acrolein’s ratio is outside of the
acceptable range25
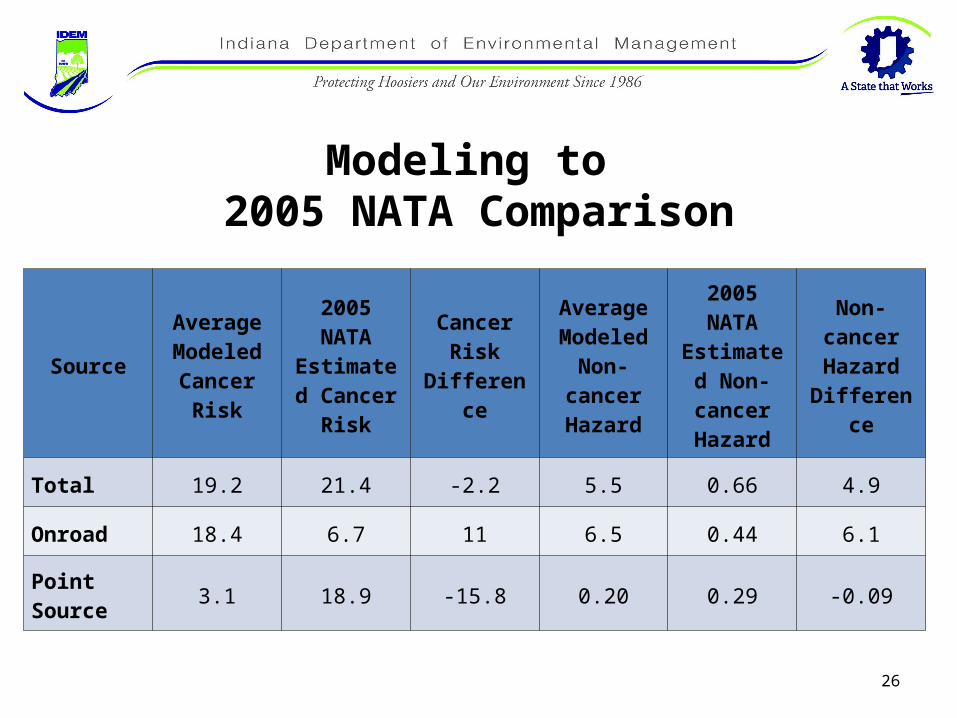
Modeling to 2005 NATA Comparison
Source
Average Modeled Cancer
Risk
2005 NATA Estimated
Cancer Risk
Cancer Risk
Difference
Average Modeled
Non-cancer Hazard
2005 NATA Estimated
Non-cancer Hazard
Non-cancer Hazard
Difference
Total 19.2 21.4 -2.2 5.5 0.66 4.9
Onroad 18.4 6.7 11 6.5 0.44 6.1
Point Source
3.1 18.9 -15.8 0.20 0.29 -0.09
26
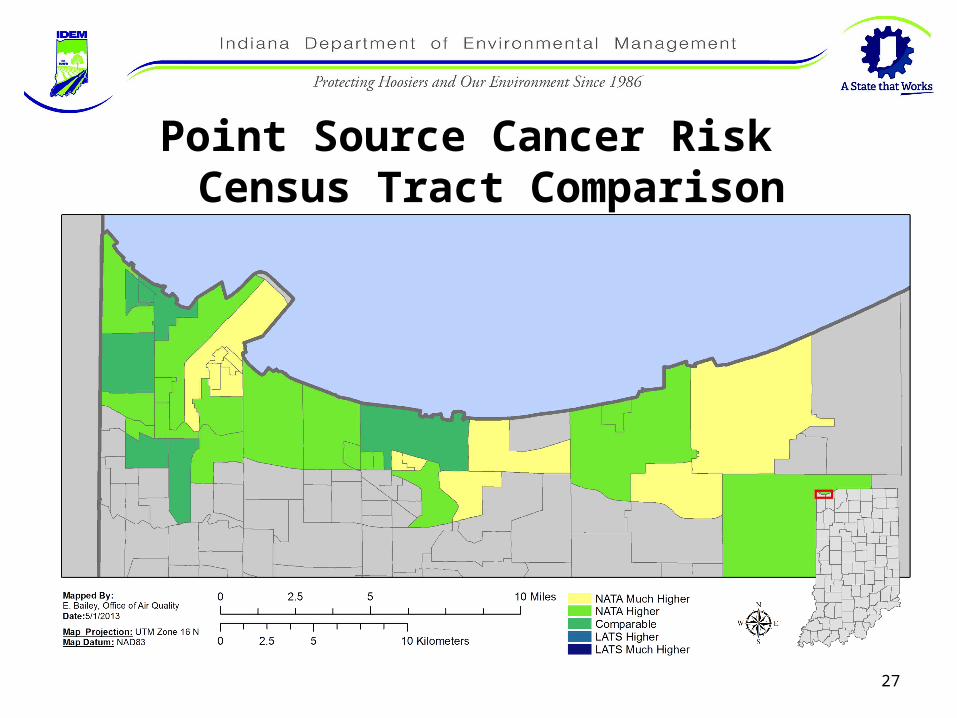
Point Source Cancer Risk Census Tract Comparison
27
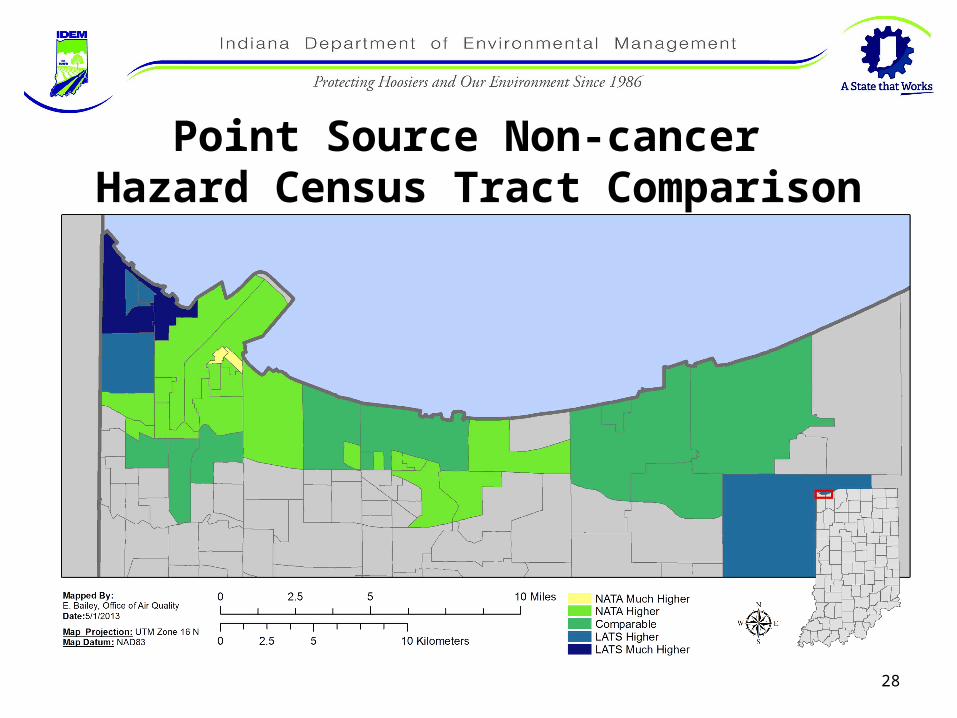
Point Source Non-cancer Hazard Census Tract Comparison
28
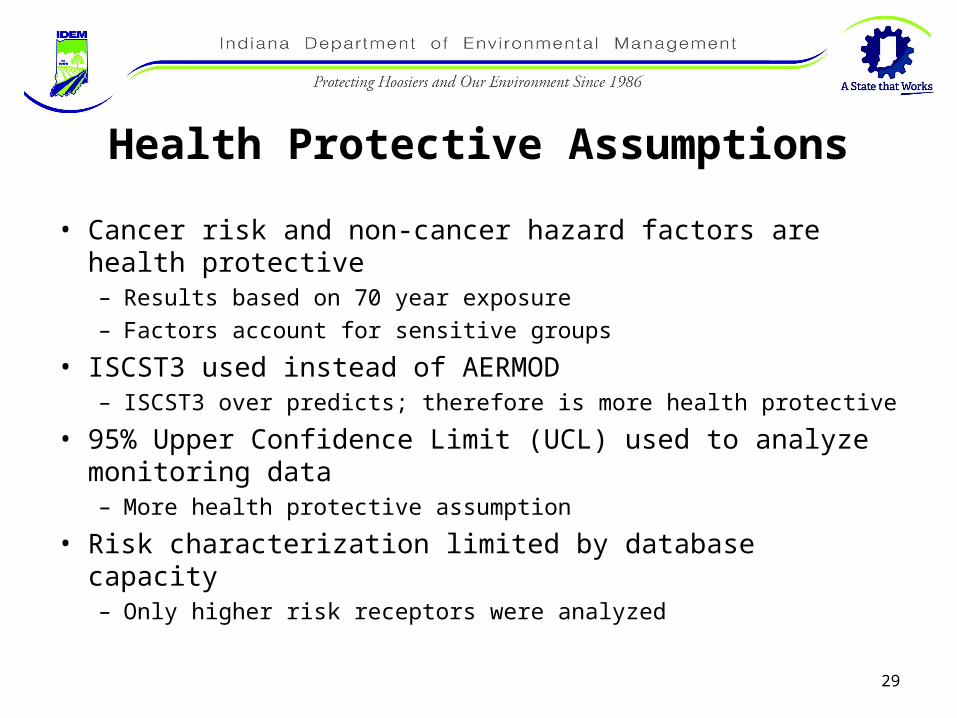
Health Protective Assumptions
• Cancer risk and non-cancer hazard factors are health protective– Results based on 70 year exposure– Factors account for sensitive groups
• ISCST3 used instead of AERMOD– ISCST3 over predicts; therefore is more health protective
• 95% Upper Confidence Limit (UCL) used to analyze monitoring data– More health protective assumption
• Risk characterization limited by database capacity– Only higher risk receptors were analyzed
29
Next Steps and Future Considerations
• The greatest level of cancer risk and non-cancer hazard is attributable to onroad mobile sources– Mobile Source Air Toxics (MSAT) regulations expected to lower onroad mobile
emissions and risk• Should reduce benzene emissions by 61,000 tons nationwide by 2030• Mass transit and carpooling also reduce onroad mobile source emissions
• Since there is still off-property risk from permitted sources, opportunities for pollution prevention may be explored– BP changing processes to meet MSAT requirements and adding fenceline
monitoring equipment– U. S. Steel changing coke oven process
• Reducing air toxics by removing byproduct emissions, combusting all process gases, and eliminating potential of fugitive leaks
• Continue to refine an enhanced modeling/risk characterization tool30
Conclusions• A better emissions inventory was a key factor in the Lakeshore
study’s additional lifetime cancer risk estimation being lower than previous estimates
• The greatest level of cancer risk and non-cancer hazard is attributable to onroad mobile sources
• Permitted stationary sources had similar to lower modeled additional lifetime cancer risks than the previous estimates
• Comparable monitoring data indicate the Lakeshore area contains similar air toxic concentrations as those measured at other United States cities
31

32
Questions?
Contact Jeff StoakesSenior Environmental Manager
(317)233-0429(800)451-6027