labrador iron ore royalty corporation
TRANSCRIPT

Labrador Iron Ore Royalty Corporation
April 2020

Notice to reader
2
All dollar figures are stated in Canadian (“CDN”) dollars unless noted otherwise.
The information contained in this presentation is derived from publicly available sources, such as annual andquarterly financial reports and the annual information form filed by Labrador Iron Ore Royalty Corporation(“LIORC”) in accordance with applicable securities laws, Rio Tinto reports and releases, news reports andanalysts’ reports. Certain market and pricing data contained in this presentation has been obtained from S&PGlobal Platts.
This presentation may contain "forward-looking" statements that involve risks, uncertainties and other factorsthat may cause the actual results, performance or achievements to be materially different from any futureresults, performance or achievements expressed or implied by such forward-looking statements. Words suchas "may", "will", "expect", "believe", "plan", "intend", "should", "would", "anticipate" and other similarterminology are intended to identify forward-looking statements. These statements reflect current assumptionsand expectations regarding future events and operating performance as of the date of this presentation.Forward-looking statements involve significant risks and uncertainties, should not be read as guarantees offuture performance or results, and will not necessarily be accurate indications of whether or not such resultswill be achieved. A number of factors could cause actual results to vary significantly, including iron ore priceand volume volatility, exchange rates, the performance of Iron Ore Company of Canada (“IOC”), marketconditions in the steel industry, mining risks and insurance, relationships with indigenous groups, naturaldisasters, severe weather conditions and public health epidemics, changes affecting IOC's customers,competition from other iron ore producers, estimates of reserves and resources and government regulationand taxation. A discussion of these factors is contained in LIORC's annual information form dated March 5,2020 under the heading, "Risk Factors". Although the forward-looking statements contained in thispresentation are based upon what management of LIORC believes are reasonable assumptions, LIORCcannot assure investors that actual results will be consistent with these forward-looking statements. Theseforward-looking statements are made as of the date of this presentation and LIORC assumes no obligation,except as required by law, to update any forward-looking statements to reflect new events or circumstances.This presentation should be viewed in conjunction with LIORC's other publicly available filings, copies ofwhich can be obtained electronically on SEDAR at www.sedar.com.

Notice to readerMineral Reserves and Mineral Resources
Mineral Reserve and Mineral Resource estimates are quoted for the end of 2019. Details of these Reserveand Resource estimates are set out in the 2019 LIORC Annual Information Form. IOC confirms that it isnot aware of any new information or data that materially affects the Mineral Reserve or Mineral Resourceinformation, that all material assumptions and technical parameters underpinning those estimates continueto apply and have not materially changed, and that the form and context of the Mineral Reserves andMineral Resources has not been materially modified.
Mineral Reserves are quoted on an as-mined (i.e. net of dilution and mining losses) basis. MineralResources are quoted on an in-situ basis. Both Mineral Reserves and Mineral Resources are quoted on adry basis.
Most of the assays and density determinations used in the reserve and resource estimates have beencarried out by the IOC laboratory. QA/QC protocols have been in place since 2004. Assay standards areinserted after each 12th sample and duplicate assays are carried out on every 50th sample. A limitednumber of twinned holes have been compared to validate the assays from holes drilled before thecommencement of the QA/QC program. The sampling protocol has been reviewed and the chain ofcustody of samples has been reviewed on an ad-hoc basis, although this is not part of the routine QA/QCprocess. Reconciliations of modelled ore tonnes and qualities against measured tonnes and qualities arecarried out monthly, to validate the reserve models.
Mineral Resources exclude Mineral Reserves.
Mineral Reserves have been estimated by Peter Ziemendorf who meets the criteria for being a QualifiedPerson, as defined by National Instrument 43-101 and who is a full time employee of IOC. MineralResources have been estimated by Ramsey Way, Beverly Power and Mervin McDonald who meet thecriteria for being Qualified Persons, as defined by National Instrument 43-101 and who are all full timeemployees of IOC.
3

Corporate structure
4

IOC shareholders
5
World leader in mining, and processing of mineral resources & the Managing Shareholder
59%26%
15%
Rio Tinto
MitsubishiCorporation
LabradorIron OreRoyaltyCompany
Major global trader of iron ore and other minerals
Holds land lease rights and licenses to mine ore

© Rio Tinto 2017
Over 60 years of operation
Four generations in the workplace
Fully integrated mine-to-market operation
2500 employees
Over 60 years in operation
Leading producer and exporter of quality pellets
and concentrate to customers worldwide
Operating sites located in Labrador City &
Sept-Îles
66

IOC integrated mine to port production system
7
• Expandable high quality resource base withsignificant exploration potential
• 3 operating pits and potential to develop additionalpits
• Ore upgraded often in excess of 65% Feconcentrate
• Approximately 55-60% of concentrate production is converted to pellets
• Product transported to port via ~400 km wholly owned QNS&L railway, federally regulated
• The only single operator train system in North America (since 1997)
• Year round, expandable deep water port
• Port capable of handling Lakers / Panamax & Capesize Vessels (225 kt)
• Up to 7200t/hr loading rates

Ore delivery system from mine to processing plants
8
Automated Train Operation (ATO)
• Hauls ore 8 to 12 km from mine to concentrator
• 7 automated electric trains with 20 cars carrying 100 tonnes per car
• 3 loading pockets across the mine
Parallel Ore Delivery System (PODS)
• Dedicated crusher• 6 km overland conveyor direct to
concentrator for processing• Debottlenecks ore delivery system• Proximity to current and future active
pits reduces truck cycle times

Concentrator and pellet plant
9
• Annual concentrator capacity of 55 million tonnes crushed ore / 23 million tonnes concentrate
• Annual pellet plant capacity of 12.5 million tonnes
• Six indurating machines in pellet plant
• Flotation plant for production of high grade pellet products
• Flexibility to adjust product mix in response to market conditions
• Value adding process attracts significant market premiums

High quality 65%+ Fe products
10
Top tier quality
products
• High iron content (65.7%)• Very low phosphorus (0.007%) & low
alumina (0.2%)
Customer locations • Europe, Asia-Pacific
Premiumpellet
products
• Standard Acid Pellets, Low Silica Acid Pellets, Low Silica Fluxed, Direct Reduction Pellets
• High iron content (65.0% - 67.7%)• Very low phosphorus (0.007%), low
sulfur, alumina (0.32%) & alkalis
Customer locations
• BF pellets: Europe, Japan, Asia• DR pellets: MENA, North America
IOC targets niche, high value segments of the seaborne iron ore market, including high-grade, low-impurity fines, premium blast furnace pellets, and premium direct reduction pellets.

Operations centres in Labrador City and Sept-Îles
11

Focused on delivering production growth
12
Year on year improvement in production achieved through:
• Implementing an Integrated Operating model
• Focusing on Asset Management• Reinforcing employee engagement• Increasing leadership capability

IOC Sales Tonnages(Tonnes millions)
13
• Positive fundamentals support the high-grade iron ore market
• Tightening environmental standards• Steel sector consolidation and move towards larger blast furnaces• Consumer demand for higher quality steels• Increasing adoption of Electric Arc Furnace technology and resulting demand for Direct
Reduction pellets
• Long term contracts secured
• Well positioned and competitive in all pellet markets
Dec. 31, 2019 Dec. 31, 2018 Dec. 31, 2017 Dec. 31, 2016
IOC Sales - Pellets 9.62 8.41 10.48 10.06
IOC Sales – Concentrate for Sale 7.51 6.70 8.67 8.17
IOC Sales – Total (1) (2) 17.14 15.10 19.15 18.23
(1) Sales tonnages as reported by IOC for calculating the LIORC royalty.(2) 2018 results were affected by a nine-week work stoppage in the second quarter.

Sufficient mineral inventory to support future expansion options
14
• Vast mineral inventory• All reserves, resources
yield saleable product with similar high quality chemistry
• Mineral inventory is proximal to existing IOC infrastructure
• Estimated total reserves of 1.3 billion tonnes
• Estimated resources of 1.8 billion tonnes
• Approximately 25 years of production at planned processing rate, based on reserves only
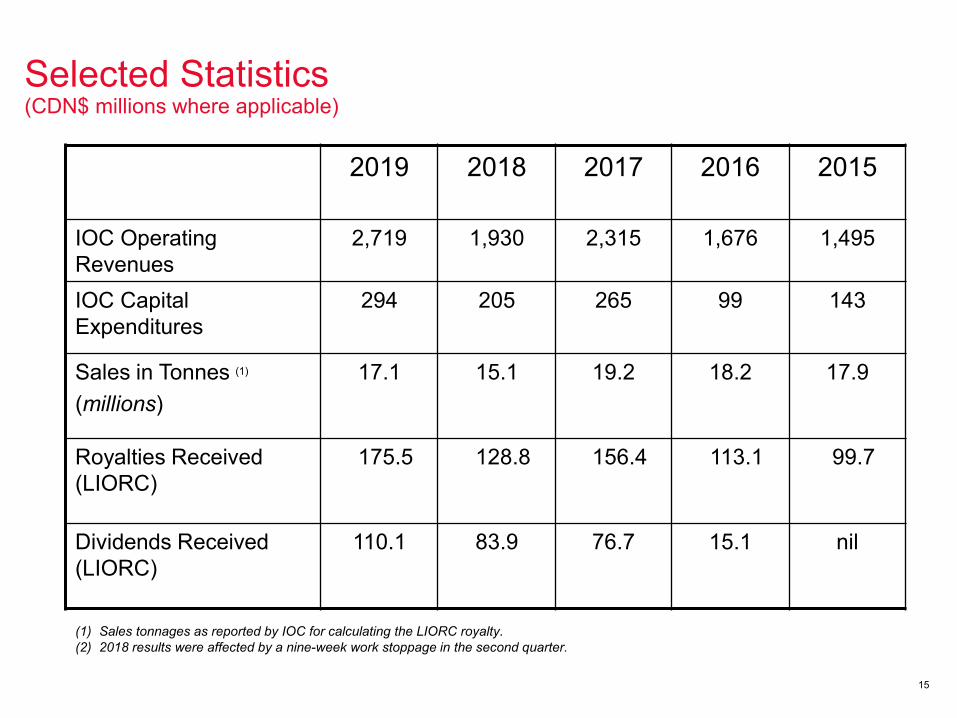
Selected Statistics(CDN$ millions where applicable)
15
2019 2018 2017 2016 2015
IOC Operating Revenues
2,719 1,930 2,315 1,676 1,495
IOC Capital Expenditures
294 205 265 99 143
Sales in Tonnes (1)
(millions)17.1 15.1 19.2 18.2 17.9
Royalties Received (LIORC)
175.5 128.8 156.4 113.1 99.7
Dividends Received (LIORC)
110.1 83.9 76.7 15.1 nil
(1) Sales tonnages as reported by IOC for calculating the LIORC royalty.(2) 2018 results were affected by a nine-week work stoppage in the second quarter.

Summary of Key Metrics
16
Iron Ore Price, 62% Fe, North China (1)
US$/tonne $93 $69 $71 $58
LIORC
Revenue C$ millions $178.3 $130.9 $158.6 $115.1
Income before Equity Earnings & Income Taxes
C$ millions $133.8 $96.4 $118.1 $84.6
Net Income C$ millions $205.3 $128.5 $157.3 $78.2
Net Income per Share C$ /Share $3.21 $2.01 $2.46 $1.22
Adjusted Cash Flow C$ millions $208.1 $155.2 $163.8 $78.0
ACF per Share C$/Share $3.25 $2.42 $2.56 $1.22
Year Ended Dec. 31, 2019
Year Ended Dec. 31, 2018
Year Ended Dec. 31, 2017
Year Ended Dec. 31, 2016
(1) Approximate average Iron Ore Prices, 62% Fe, North China.(2) 2018 results were affected by a nine-week work stoppage in the second quarter.

Investment Highlights - IOC
17
• Leading producer of premium iron ore products (65% Fe) including higher margin pellets
• Significant wholly owned infrastructure in place with concentrator, pellet plant, 418 km railway and port facilities
• Competitive operating costs and high margins
• Operating for over 50 years without a shut down due to market conditions
• State of the art operations centres in Labrador City and Sept-Îles monitor processes
• Positive margins given current iron ore prices and premiums
• Large, high quality resources with a long mine life (>25 years) in a stable jurisdiction
• Opportunity to extend mine life by converting large resource base to reserves
• World class operator – Rio Tinto

Investment Highlights - LIORC
18
• Unique ownership interest in IOC: 7% top line royalty is attractive 15.1% equity interest in IOC 10¢ per ton commission on all IOC sales
• Cash flow largely paid out as dividends
• Pure play on iron ore prices
• Royalty limits the operational risk to LIORC
• Iron ore prices attractive from a historical perspective
• LIORC benefits from all IOC production growth
• Debt-free balance sheet
• 15.1% investment in IOC provides: Dividends to LIORC when iron ore market is
strong Two seats at IOC board table Upside to iron ore markets