labour statistics malerato mosiane labour statistics division statistics south africa seminar on...
TRANSCRIPT

Labour Statistics
Malerato MosianeLabour Statistics Division
Statistics South Africa
Seminar on Developing a programme for the implementation of the
2008 SNA and supporting statistics
17-19 October 2012Pretoria, South Africa
1

Outline
• Sources of labour market information• QLFS
– How the LFS evolved– From LFS to QLFS– Activities of Labour Statistics section– Why conduct the QLFS– How QLFS is conducted– Labour Force Framework and definitions
• QLFS and QES
2

Household-based surveys• October Household Survey (OHS) annually 1995-1999
• Labour Force Survey (LFS) – in Mar, Sep each year since 2000
• Income and Expenditure Survey 1995, 2000, 2005/6, 2010/11
• General Household Survey (GHS) – in July each year since 2002
• Community Survey – February 2007
• Quarterly Labour Force Survey (QLFS) - Jan 2008
Establishment surveys• Survey of Employment and Earnings (SEE discontinued)
• Quarterly Employment Statistics (QES)
Population Census (whole country), 1996, 2001, 2011
Sources of labour market information

QLFS
4
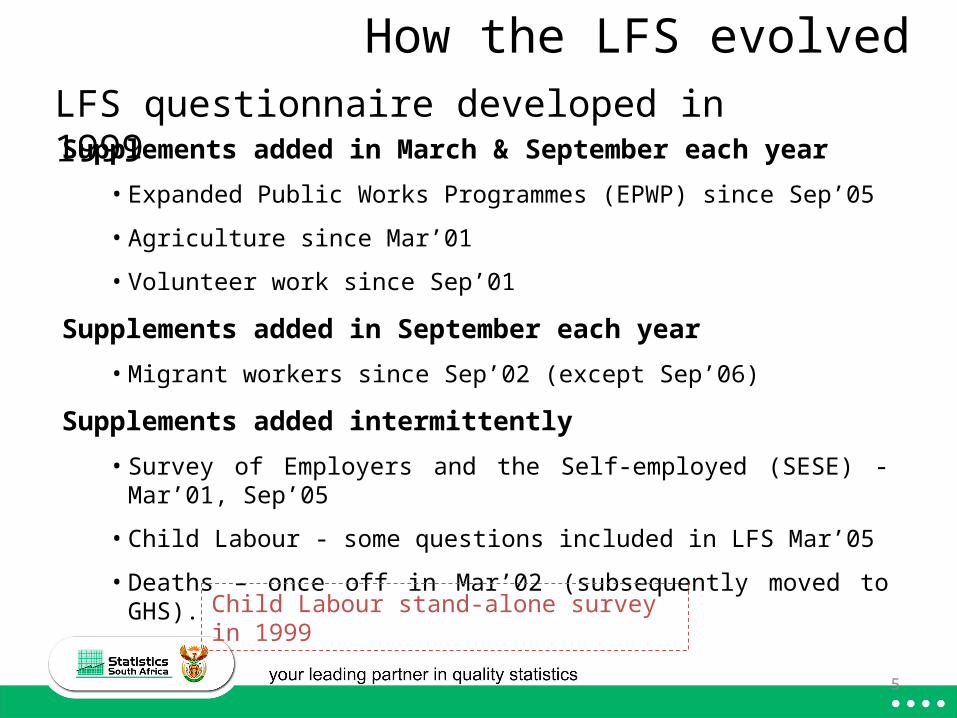
Supplements added in March & September each year
• Expanded Public Works Programmes (EPWP) since Sep’05
• Agriculture since Mar’01
• Volunteer work since Sep’01
Supplements added in September each year
• Migrant workers since Sep’02 (except Sep’06)
Supplements added intermittently
• Survey of Employers and the Self-employed (SESE) - Mar’01, Sep’05
• Child Labour - some questions included in LFS Mar’05
• Deaths – once off in Mar’02 (subsequently moved to GHS).
LFS questionnaire developed in 1999
How the LFS evolved
Child Labour stand-alone survey in 1999
5

Re-engineering of LFS
• Concerns raised about LFS– Coverage– Frequency – Timeliness– Analysis
• LFS re-engineered based on recommendations by IMF consultants in June 2005
• Recommendations reviewed by consultants to Stats SA and senior management
• Decision taken to re-engineer the LFS
6

Implications of LFS re-engineering
• From bi-annual to quarterly collection
– Continuous quarterly data collection and processing
– Appointment of permanent field and data processing staff
• Publish results shortly after quarter end
• Detailed analysis
• Etc
Establishment of Labour Statistics Division
7

Activities of Labour Statistics unit
8

Activities of Labour Statistics Unit• Quarterly Labour Force Survey (QLFS):
– Household survey Supplements to the QLFS
– Survey of the employers and the self-employed (SESE) (2009): • Conducted every 4 years• Sub-sample of the QLFS• Provide information on the characteristics of micro- and small
businesses in South Africa that are not registered for VAT.– Volunteer Activities Survey (VAS) (2010):
• Conducted every 4 years• Sub-sample of the QLFS• Collects data on the volunteer activities of individuals aged 15
years and older.
9
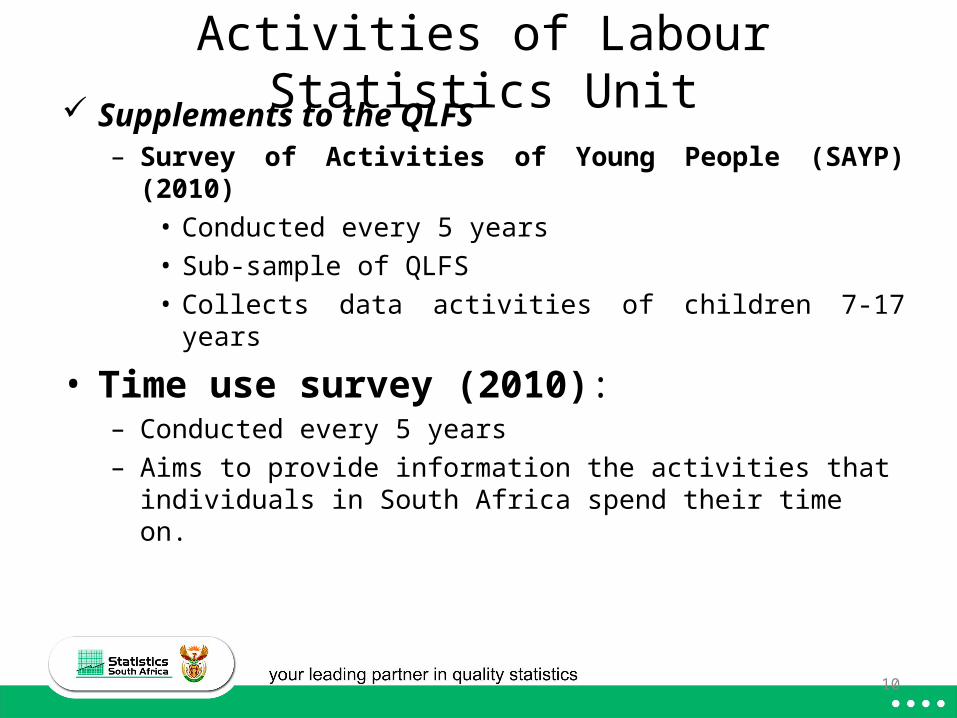
Activities of Labour Statistics Unit Supplements to the QLFS
– Survey of Activities of Young People (SAYP) (2010)• Conducted every 5 years• Sub-sample of QLFS• Collects data activities of children 7-17 years
• Time use survey (2010): – Conducted every 5 years– Aims to provide information the activities that individuals in South
Africa spend their time on.
10

Why QLFS is conducted
11

Why conduct the QLFS• The Quarterly Labour Force Survey (QLFS) is the principal
vehicle for providing current labour market information
• QLFS is used to provide the quarter-to-quarter changes in the labour market indicators. These include:
– Employment (Both in the formal and informal sector)
– Descriptors of employment - e.g. Industry, occupation, atypical employment indicators (hours of work , contract and other benefits)
– Unemployment, duration of unemployment
– Inactivity.
– Market vs Non-Market activities.
12

How QLFS is conducted
13

• Sample of 3080 PSUs– Approximately 32 000 dwelling units
– The sample for the redesigned Labour Force Survey is based on a stratified two-stage design with probability proportional to size (PPS) sampling of primary sampling units (PSUs) in the first stage, and sampling of dwelling units (DUs) with systematic sampling in the second stage
– The sample is designed to report at National, Provincial and metro level. Currently the reports are at national and provincial levels.
– Rotating sample – each dwelling unit in the sample for four quarters and then rotated out (75% sample overlap quarter-to-quarter)
How QLFS is conducted
14

0
100
200
300
400
500
600
PSU allocation 180 264 268 288 324 364 384 464 544
NC FS NW MP LP EC WC KZN GP
Distribution of the Master Sample by province
A total of 3 080 PSUs in the Master Sample
15

Conducting the QLFS
Jan Feb Mar Apr May Jun Jul Aug Sep Oct Nov Dec
Collect data Q1 Collect data Q2 Collect data Q3 Collect data Q4
Results Q4:Core
Results Q3:Core
Results Q2:Core
Results Q1:Core
Report each year on additional aspects of:
Employment
Unemployment & not economically active
Annual report in September of following year using all information
Supplementary reports as required
16

• Face-to-face interviews – continuously
– 0110 methodology
• Week 1 - publicity and set up appointments
• Week 2 and 3 – conduct interviews
• Week 4 - wrap up and master sample update
• Continuous data processing – scanning
• Weighting
• Data analysis
• Report writing
• Publish results 4-6 weeks after quarter end
Other processes
17

Labour Force conceptual framework and Definitions
18
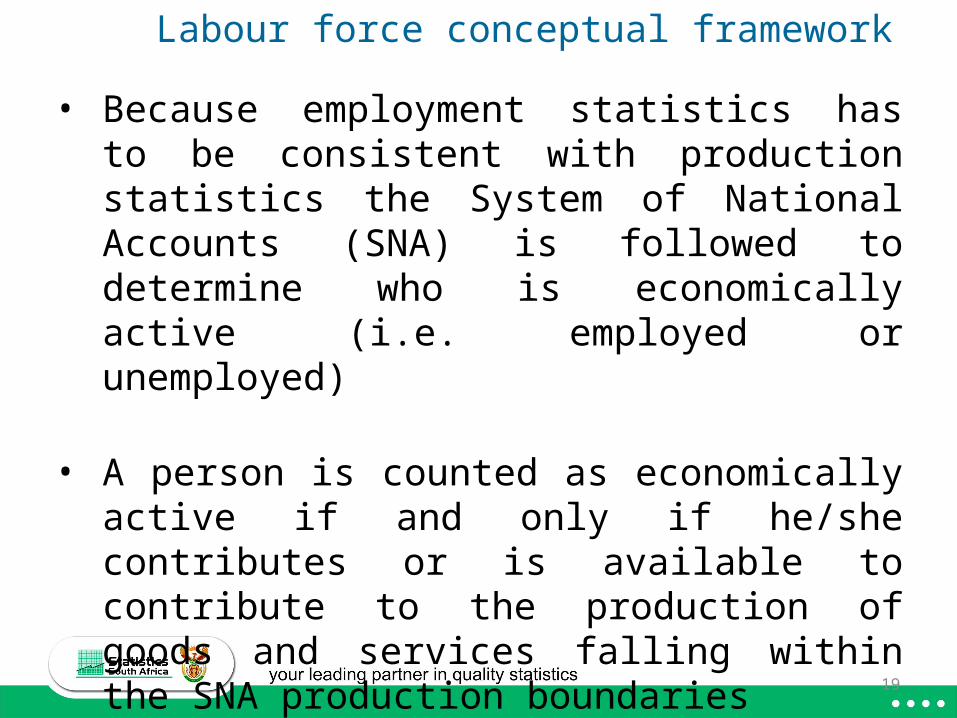
• Because employment statistics has to be consistent with production statistics the System of National Accounts (SNA) is followed to determine who is economically active (i.e. employed or unemployed)
• A person is counted as economically active if and only if he/she contributes or is available to contribute to the production of goods and services falling within the SNA production boundaries
Labour force conceptual framework
19

Economic activities(production of goods & services)
Activities
Market production
Production of goods and services for sale
Production of other goods and services such as government activities
Non-market production
Production of agricultural and other products for own consumption/use
Growing mealies, fruits, vegetables Hunting animals and birds, catching fish Fetching wood, water, dung Collecting thatching materials
Processing of agricultural and other products for
own consumption/use
Making butter, cheese, beer Slaughtering livestock, Making furniture Weaving baskets and mats Tailoring Making clay pots
Production of fixed assets for own use Construction of own dwellings, farm buildings Clearing land for cultivation Major repair work
Non-economic activities
House work
Minor repairs
System of National Accounts (SNA 1993)
20

• Individuals have to be classified into three mutually exclusive and exhaustive categories following Labour Force Framework hierarchy:
→Employed
→ Unemployed
→ Inactive / not in the labour force
Classification
21

Employed persons are those who during the reference week:
• Did work for a wage, salary, commission or any payment in kind (including paid domestic work), even if it was for only one hour; or
• Ran any kind of business, big or small, on their own or with one or more partners, even if it was for only one hour; or
• Helped without being paid in a household business, even if it was for only one hour; or
• Were temporarily absent from their jobs or businesses but were definitely returning to them.
Employed (Market production only)
22

Employed
Employers; Own-account; Working unpaid
in hhold business
Registered for VAT or Income tax
No
Informal sector
Employees
Income tax deducted by employer
No
Size of establishment less than 5 employees
Yes
Deriving informal sector in the QLFS
23

Persons above 15 years who during the reference week were:
• “without work” – not in paid employment or self-employment
• “available for work” – were available for paid work or self-employment during the reference week
• “have taken active steps” in the four weeks preceding the interview to seek paid
employment or self-employment
Unemployed – official definition
24

Unemployed – Expanded definition
Job search criterion is relaxed
The unemployed are persons above 15 years who during the reference week were:
• “without work” – not in paid employment or self-employment
• “available for work” – were available for paid work or self-employment during the reference week
25

Inactivity is also an important indicator. The inactive are mainly:
• Students
• Housewives
• Retired
• Disabled
• Discouraged work-seekers
Inactive
26

Among people who did not look for work: Job search activities in the last 4 weeks
Reasons for not trying to find work or start business last 4 weeks:
• No jobs available in the area
• Unable to find work requiring his/her skills
• Lost hope of finding any kind of work
No
Discouraged
Wanted to work the previous week
Availability to start work/business the previous week
Yes
NoYes
Other NEA
Discouraged work-seekers in the QLFS
NEANEA
27

Main indicators
Unemployment rate Unemployment x 100
Labour force
Absorption Rate Employed x 100
Working age (15-64 yrs)
Labour Force Participation Rate
Labour force x 100
Working age (15-64 yrs)
28

• Response rate as a quality indicator set to above 80%.
− The most recent release (qrt2:2012) reported 92,6%
at national level
− The lowest response rate was in GP at 82,9%
− This was followed by WC at 86,4%
− The rest of other provinces reported response rates of
above 93,0%
Quality measures
29

• Precision as a quality measure was set to be less than 5% at national level and less than 10% at provincial level for employment. This is measured by Coefficient of variation (CV)
Quality measures
CVs for employment estimates by province
WC 1,6
EC 2,7
NC 3,4
FS 2,0
KZN 1,7
NW 2,7
GP 1,2
MP 2,3
LP 3,8
RSA 0,7
None is above 5% even at provincial level
30

QLFS and QES

Difference between QLFS and QESQLFS QES
Coverage Private households including worker’s hostel
Target population is civilian non-institutionalised aged 15 and older.
Formal, informal, Agriculture and employment in Private hh
VAT registered business (pay roll)
Employees only. Formal non-
agricultural sector
Frequency Quarterly sample survey of 30 000 dwellings (sampling unit is dwelling and unit of observation is the household)
Quarterly sample survey of 20 000 non-agric formal enterprises
Reference Period
A week prior to the interviews Collection is in the middle two weeks
of each month of the quarter
Pay roll on the last day of the quarter

Difference between QLFS and QESQLFS QES
Definitions Formal Sector Non-agricEmployers and own account worker whose businesses are registered for tax (income tax or VAT)Employees whose employers deduct income tax from their salariesEmployees whose employer does not deduct income tax but work for establishment with more than 5 employees
Formal Sector-non agricVAT registration
SIC All industries Agriculture and Private households excluded
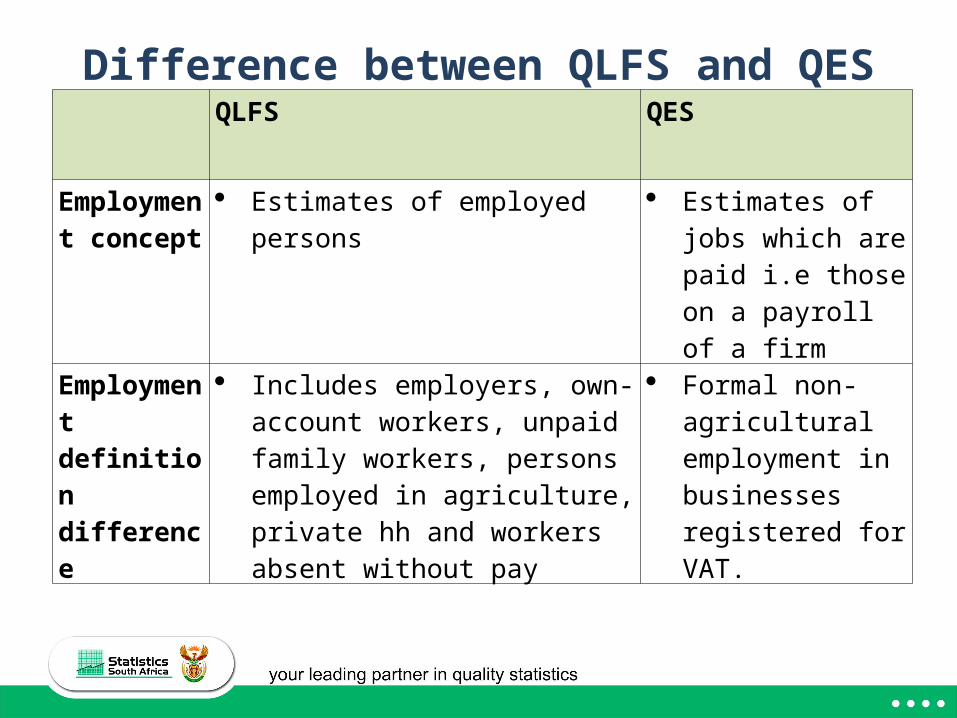
Difference between QLFS and QESQLFS QES
Employment concept
Estimates of employed persons Estimates of jobs which are paid i.e those on a payroll of a firm
Employment definition difference
Includes employers, own-account workers, unpaid family workers, persons employed in agriculture, private hh and workers absent without pay
Formal non-agricultural employment in businesses registered for VAT.

Comparison between the QES and QLFS
• Trend in formal sector employment between the QES and QLFS are similar, but levels of employment higher in QLFS.

Thank you
36

• Sampling Frame
• Census 2001 enumeration areas (EAs - 80 787)
• On average an EA consists of 150-200 dwellings
• However, over a period some EAs grow and others shrink so listing maintenance is used to update the frame
The QLFS sample
37

• Sampling Frame• In preparation of the sampling frame small EAs
(25-99 Dus) are combined with adjacent EA of the same type to form Primary Sampling Unit (PSUs) and very big EAs are split into a number of PSUs.
• This process generated 52 939 PSUs in the entire country.
• From the 52 000 PSUs, a sample of 3080 PSUs was selected for the QLFS
The sample
38

• Sampling Frame• This sample size was determined based on
the required level of precision of employment ratio at national and provincial level
• Measures of precision are determined by the magnitude of the Coefficient of variation (CV)
• This was set to be at least less than 5% at the national level and less than 10% at the provincial level
The sample
39

• After selecting the 3080 PSU. The listing process follows
• Each and every dwelling within the boundaries of each PSU is listed and numbered
• The list is used to select a systematic sample of between 10 and 12 dwellings to be interviewed
• Each DU is visited 4 times and then rotated out to avoid respondent fatigue
• There is a 75% sample overlap quarter-to-quarter to minimize sampling variability
The sample
40

After the data collection and editing phases of the survey are completed;
• Sampling weights are constructed so that the responses could be properly expanded to represent the entire population.
•This is a result of calculations involving the following factors
• Original selection probabilities
• Base weight adjustment which include non-response adjustment and PSU adjustment
• Benchmarking to a known population counts produced by the Statistics SA demography division
Data Weighting
41