labour force survey - western cape · labour force survey september 2002 co-operation between...
TRANSCRIPT
Statistical release
P0210 (Survey date: Sep 2002)
Labour force survey September 2002
Co-operation between Statistics South Africa (Stats SA), the citizens of the country, the private sector and government institutions is essential for a successful statistical system. Without continued co-operation and goodwill, the timely release of relevant and reliable official statistics will not be possible. Stats SA publishes approximately three hundred different releases each year. It is not economically viable to produce them in more than one of South Africa’s eleven official languages. Since the releases are used extensively, not only locally, but also by international economic and social-scientific communities, Stats SA releases are published in English only.
Date: 25 March 2003 Time: 11:30
����� ���������� ��������������������� ����������������� ��!#"%$��&� '�� �#� (��)"#*,+-��� /.�.��0���1��������1�&�2�3� �������54687:9<;,=?>%@�A/BC>8D#E#BGFIHKJKBLB M�N2O�;,=?>%@�A/BG>�D#E%>8>PE%E�@8Q
R-S�T8�:�VUW�-+�+-�� .X. YZ�V* $��-[�.��&�\�3.X.Z�^] \���^] _�� `aXbX.�� �/Yc!X���0d,Y e�e^f�f�f�] .��&�\�3.X.Z�^] \���^] _��
Published by Statistics South Africa, Private Bag X44, Pretoria 0001 © Statistics South Africa, 2003 Users may apply or process this data, provided Statistics South Africa (Stats SA) is acknowledged as the original source of the data; that it is specified that the application and/or analysis is the result of the user’s independent processing of the data; and that neither the basic data nor any reprocessed version or application thereof may be sold or offered for sale in any form whatsoever without prior permission from Stats SA. Stats SA Library Cataloguing-in-Publication (CIP) Data Labour Force Survey September 2002/ Statistics South Africa. Pretoria: Statistics South Africa, 2001 xiv 84 p. Biannually, No. 1 1. Labour supply – Statistics 2. Labour supply (South Africa) 3. Unemployment (South Africa) 4. Informal sector (Economics) – South Africa 5. Formal sector (Economics) – South Africa I. Statistics South Africa II. Series (LCSH 16) A complete set of Stats SA publications is available at Stats SA Library and the following libraries: National Library of South Africa, Pretoria Division National Library of South Africa, Cape Town Division Library of Parliament, Cape Town Bloemfontein Public Library Natal Society Library, Pietermaritzburg Johannesburg Public Library Eastern Cape Library Services, King William's Town Central Regional Library, Polokwane Central Reference Library, Nelspruit Central Reference Collection, Kimberley Central Reference Library, Mmabatho Obtainable from: Distribution section, Statistics South Africa Tel: (012) 310 8251 Fax: (012) 322 3374 (012) 310 8619 E-mail: [email protected]
CONTENTS Page Introduction i The labour market in September 2002 i Labour market changes between February 2000 and September 2002 The main labour market trends ii Changes in employment between February 2000 and September 2002 by economic sector iv Employment by industry v Unemployment in urban and non-urban areas (official definition) viii Unemployment by province (official definition) ix Unemployment by population group (official definition) ix Unemployment by population group and sex (official definition) x Employment in the formal and informal sectors: September 2002 Formal and informal sector employment by industry x Comparison of formal sector employment figures in the LFS and the SEE xi Comparison of formal sector employment by industry in the LFS and the SEE of February/March of 2002 xi Labour market trends: expanded definition of unemployment xii Voluntary workers xiii Notes 1. Official and expanded unemployment rates xv 2. Sample design xv 3. Coverage xv 4. Weighting the LFS of September 2002 xv 5. Symbols used in the tables that follow xv 6. Comparability of results with other Stats SA data sources xv 7. Urbanisation xvi 8 Confidence intervals xvi Definitions of terms xvi Tables
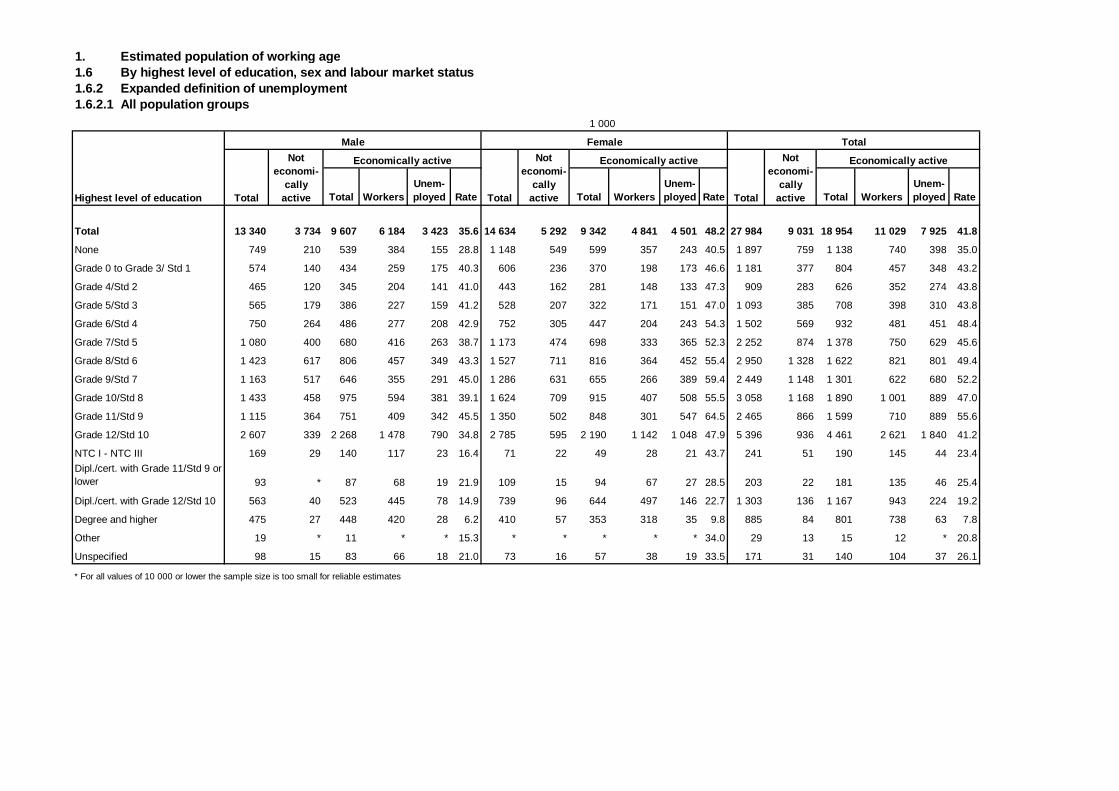
1. Estimated population of working age 1.1 By economic activity, population group and sex 1.2 By economic activity, involvement and sex 1.3 By economic activity, involvement and area 1.4 By population group, area, sex and labour market status 1.4.1 Official definition of unemployment 1.4.2 Expanded definition of unemployment 1.5 By province, area, sex and labour market status 1.5.1 Official definition of unemployment 1.5.2 Expanded definition of unemployment 1.6 By highest level of education, sex and labour market status 1.6.1 Official definition of unemployment 1.6.1.1 All population groups 1.6.1.2 African 1.6.1.3 Other 1.6.2 Expanded definition of unemployment 1.6.2.1 All population groups 1.6.2.2 African 1.6.2.3 Other 1.7 By definition of unemployment, work-related skills training, sex and labour market status
1 3 5 7 8 9 11 13 14 15 16 17 18 19
2. Workers (employers, employees and self-employed) 2.1 By main industry and sector 2.2 By main occupation and sector 2.3 By population group, sex and sector 2.4 By main industry, population group and sex 2.4.1 All sectors 2.4.2 Formal sector 2.4.3 Informal sector 2.5 By monthly income and sector 2.6 By highest level of education and sector 2.7 By highest level of education and monthly income 2.7.1 All population groups 2.7.2 African 2.7.3 Other 2.8 Workers with degrees, diplomas and certificates by field of study and monthly income 2.9 By main industry and monthly income 2.10 By main occupation and monthly income 2.11 By employment status 2.11.1 By sector and sex 2.11.2 By sector, population group and sex 2.12 Conditions of employment of employees 2.12.1 By main industry and existence of written contract 2.12.2 By main industry and terms of employment 2.12.3 By main industry and paid leave status 2.12.4 By main industry and trade union membership 2.12.5 By main industry and provision for, or contribution towards, medical aid/health insurance 2.13 By main industry and provision for, or contribution towards, medical aid/health insurance 2.13.1 Formal sector 2.13.2 Informal sector 2.14 By main industry and location of business 2.14.1 Formal sector 2.14.2 Informal sector 2.15 By main industry and number of regular workers in the business 2.16 By main industry and whether their company or close corporation is registered 2.17 By main industry and deduction of UIF contributions 3. The unemployed 3.1 By area, age, population group and sex 3.1.1 Official definition of unemployment 3.1.2 Expanded definition of unemployment 3.2 By duration of job seeking, age and whether they have worked before 3.3 Unemployed persons who have worked before by duration of unemployment and previous industry 3.3.1 Official definition of unemployment 3.3.2 Expanded definition of unemployment 3.4 Unemployed persons who have worked before by length of time since they last worked and previous
occupation 3.4.1 Official definition of unemployment 3.4.2 Expanded definition of unemployment 3.5 Unemployed persons who have worked before by length of time since they last worked and age 3.6 Unemployed persons who have never worked before by duration of job seeking and age 3.7 By highest level of education, population group and sex 3.7.1 Official definition of unemployment 3.7.2 Expanded definition of unemployment 3.8 Unemployed persons with degrees, diplomas and certificates by field of study and sex: both definitions of
unemployment 3.9 Unemployed and not economically active population by reason for not working and sex 3.9.1 Official definition of unemployment 3.9.2 Expanded definition of unemployment
20 21 22 23 24 25 26 27 28 29 30 31 32 33 34 36 37 38 39 40 41 42 43 44 45 46 47 48 49 50 51 52 53 54 55 56 57 58 59 60 61 62
4. Economic activities of the aged (66 years and above) 4.1 Economically and not economically active population by type of activity, sex and involvement in the
economic activities 4.2 Economically and not economically active population by type of activity, population group and
involvement in the economic activities 4.3 Working aged by population group, sex and sector 4.4 Working aged by main industry and sex 4.5 Working aged by main occupation and sex 5. Voluntary workers (15 to 65 years) 5.1 By province and involvement in uncompensated work 5.2 By type of area, age, population group and sex 5.3 By population group, sex and labour market status 5.3.1 Official definition of unemployment 5.3.2 Expanded definition of unemployment 5.4 By type of uncompensated activity, population group, involvement in the activity and sex 5.5 By type of uncompensated activity, area, involvement in the activity and sex
63 65 67 68 69 70 71 72 73 74 76

Data and metadata set Labour force survey September 2002 The data and metadata set from the Labour force survey September 2002 is available on CD-ROM at the cost of R1000.
P0210 (Survey date: Sep 2002)
i
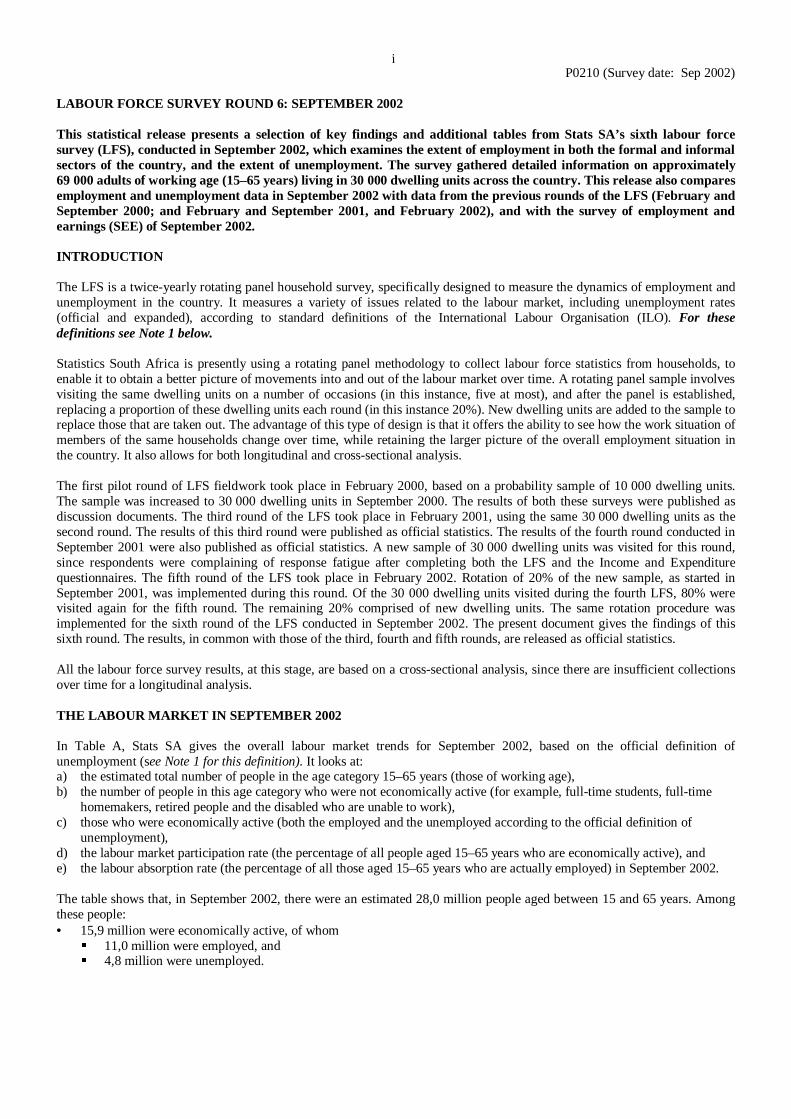
LABOUR FORCE SURVEY ROUND 6: SEPTEMBER 2002 This statistical release presents a selection of key findings and additional tables from Stats SA’s sixth labour force sur vey (LFS), conducted in September 2002, which examines the extent of employment in both the formal and informal sectors of the country, and the extent of unemployment. The survey gathered detailed information on approximately 69 000 adults of working age (15–65 years) living in 30 000 dwelling units across the country. This release also compares employment and unemployment data in September 2002 with data from the previous rounds of the LFS (February and September 2000; and February and September 2001, and Febr uary 2002), and with the sur vey of employment and earnings (SEE) of September 2002. INTRODUCTION The LFS is a twice-yearly rotating panel household survey, specifically designed to measure the dynamics of employment and unemployment in the country. It measures a variety of issues related to the labour market, including unemployment rates (official and expanded), according to standard definitions of the International Labour Organisation (ILO). For these definitions see Note 1 below. Statistics South Africa is presently using a rotating panel methodology to collect labour force statistics from households, to enable it to obtain a better picture of movements into and out of the labour market over time. A rotating panel sample involves visiting the same dwelling units on a number of occasions (in this instance, five at most), and after the panel is established, replacing a proportion of these dwelling units each round (in this instance 20%). New dwelling units are added to the sample to replace those that are taken out. The advantage of this type of design is that it offers the ability to see how the work situation of members of the same households change over time, while retaining the larger picture of the overall employment situation in the country. It also allows for both longitudinal and cross-sectional analysis. The first pilot round of LFS fieldwork took place in February 2000, based on a probability sample of 10 000 dwelling units. The sample was increased to 30 000 dwelling units in September 2000. The results of both these surveys were published as discussion documents. The third round of the LFS took place in February 2001, using the same 30 000 dwelling units as the second round. The results of this third round were published as official statistics. The results of the fourth round conducted in September 2001 were also published as official statistics. A new sample of 30 000 dwelling units was visited for this round, since respondents were complaining of response fatigue after completing both the LFS and the Income and Expenditure questionnaires. The fifth round of the LFS took place in February 2002. Rotation of 20% of the new sample, as started in September 2001, was implemented during this round. Of the 30 000 dwelling units visited during the fourth LFS, 80% were visited again for the fifth round. The remaining 20% comprised of new dwelling units. The same rotation procedure was implemented for the sixth round of the LFS conducted in September 2002. The present document gives the findings of this sixth round. The results, in common with those of the third, fourth and fifth rounds, are released as official statistics. All the labour force survey results, at this stage, are based on a cross-sectional analysis, since there are insufficient collections over time for a longitudinal analysis. THE LABOUR MARKET IN SEPTEMBER 2002 In Table A, Stats SA gives the overall labour market trends for September 2002, based on the official definition of unemployment (see Note 1 for this definition). It looks at: a) the estimated total number of people in the age category 15–65 years (those of working age), b) the number of people in this age category who were not economically active (for example, full-time students, full-time
homemakers, retired people and the disabled who are unable to work), c) those who were economically active (both the employed and the unemployed according to the official definition of
unemployment), d) the labour market participation rate (the percentage of all people aged 15–65 years who are economically active), and e) the labour absorption rate (the percentage of all those aged 15–65 years who are actually employed) in September 2002. The table shows that, in September 2002, there were an estimated 28,0 million people aged between 15 and 65 years. Among these people: • 15,9 million were economically active, of whom
� 11,0 million were employed, and � 4,8 million were unemployed.
P0210 (Survey date: Sep 2002)
ii
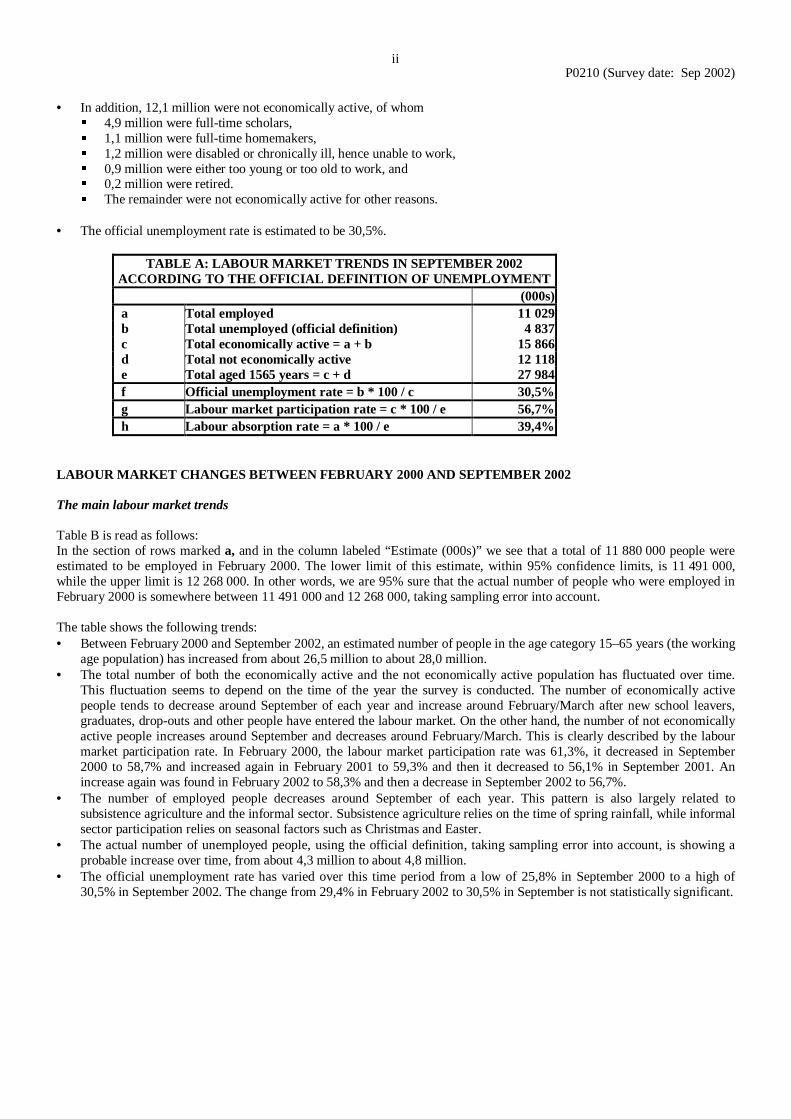
• In addition, 12,1 million were not economically active, of whom
� 4,9 million were full-time scholars, � 1,1 million were full-time homemakers, � 1,2 million were disabled or chronically ill, hence unable to work, � 0,9 million were either too young or too old to work, and � 0,2 million were retired. � The remainder were not economically active for other reasons.
• The official unemployment rate is estimated to be 30,5%.
TABLE A: LABOUR MARKET TRENDS IN SEPTEMBER 2002 ACCORDING TO THE OFFICIAL DEFINITION OF UNEMPLOYMENT
(000s) a Total employed 11 029 b Total unemployed (official definition) 4 837 c Total economically active = a + b 15 866 d Total not economically active 12 118 e Total aged 1565 years = c + d 27 984 f Official unemployment rate = b * 100 / c 30,5% g Labour market par ticipation rate = c * 100 / e 56,7% h Labour absorption rate = a * 100 / e 39,4%
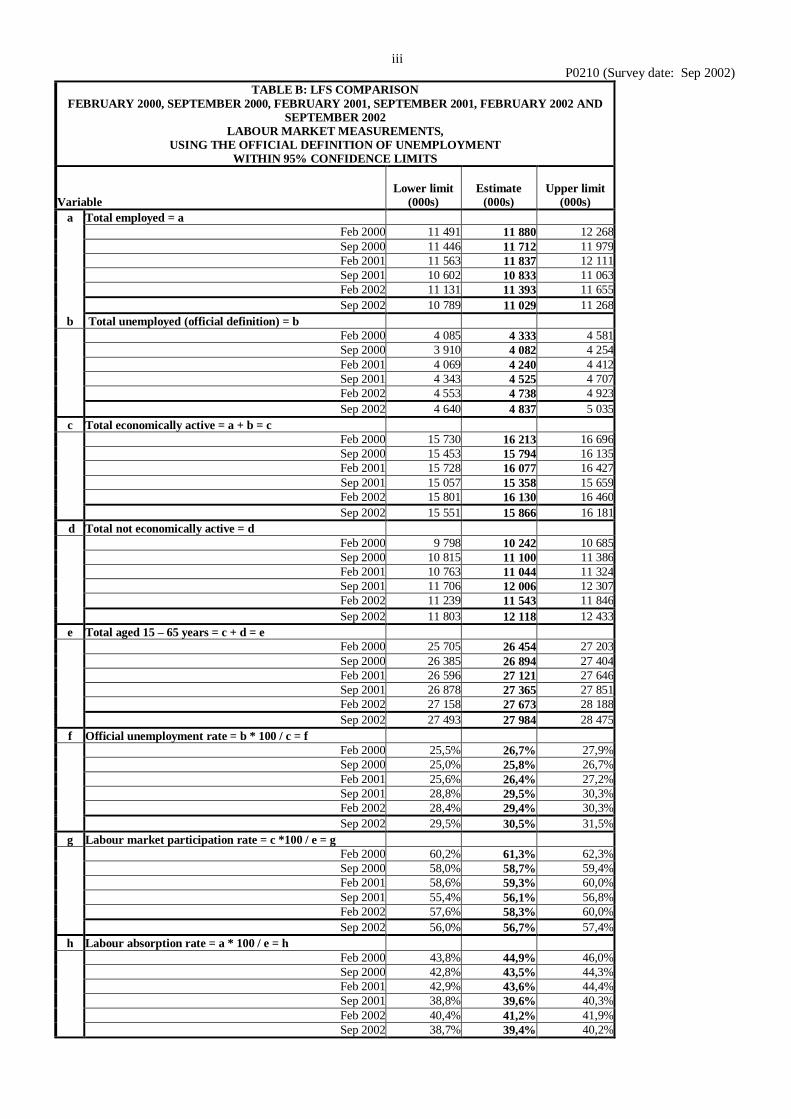
LABOUR MARKET CHANGES BETWEEN FEBRUARY 2000 AND SEPTEMBER 2002 The main labour market trends Table B is read as follows: In the section of rows marked a, and in the column labeled “Estimate (000s)” we see that a total of 11 880 000 people were estimated to be employed in February 2000. The lower limit of this estimate, within 95% confidence limits, is 11 491 000, while the upper limit is 12 268 000. In other words, we are 95% sure that the actual number of people who were employed in February 2000 is somewhere between 11 491 000 and 12 268 000, taking sampling error into account. The table shows the following trends: • Between February 2000 and September 2002, an estimated number of people in the age category 15–65 years (the working
age population) has increased from about 26,5 million to about 28,0 million. • The total number of both the economically active and the not economically active population has fluctuated over time.
This fluctuation seems to depend on the time of the year the survey is conducted. The number of economically active people tends to decrease around September of each year and increase around February/March after new school leavers, graduates, drop-outs and other people have entered the labour market. On the other hand, the number of not economically active people increases around September and decreases around February/March. This is clearly described by the labour market participation rate. In February 2000, the labour market participation rate was 61,3%, it decreased in September 2000 to 58,7% and increased again in February 2001 to 59,3% and then it decreased to 56,1% in September 2001. An increase again was found in February 2002 to 58,3% and then a decrease in September 2002 to 56,7%.
• The number of employed people decreases around September of each year. This pattern is also largely related to subsistence agriculture and the informal sector. Subsistence agriculture relies on the time of spring rainfall, while informal sector participation relies on seasonal factors such as Christmas and Easter.
• The actual number of unemployed people, using the official definition, taking sampling error into account, is showing a probable increase over time, from about 4,3 million to about 4,8 million.
• The official unemployment rate has varied over this time period from a low of 25,8% in September 2000 to a high of 30,5% in September 2002. The change from 29,4% in February 2002 to 30,5% in September is not statistically significant.
P0210 (Survey date: Sep 2002)
iii
TABLE B: LFS COMPARISON FEBRUARY 2000, SEPTEMBER 2000, FEBRUARY 2001, SEPTEMBER 2001, FEBRUARY 2002 AND
SEPTEMBER 2002 LABOUR MARKET MEASUREMENTS,
USING THE OFFICIAL DEFINITION OF UNEMPLOYMENT WITHIN 95% CONFIDENCE LIMITS
Var iable
Lower limit
(000s)
Estimate
(000s)
Upper limit
(000s) a Total employed = a Feb 2000 11 491 11 880 12 268 Sep 2000 11 446 11 712 11 979 Feb 2001 11 563 11 837 12 111 Sep 2001 10 602 10 833 11 063 Feb 2002 11 131 11 393 11 655 Sep 2002 10 789 11 029 11 268b Total unemployed (official definition) = b Feb 2000 4 085 4 333 4 581 Sep 2000 3 910 4 082 4 254 Feb 2001 4 069 4 240 4 412 Sep 2001 4 343 4 525 4 707 Feb 2002 4 553 4 738 4 923 Sep 2002 4 640 4 837 5 035c Total economically active = a + b = c Feb 2000 15 730 16 213 16 696 Sep 2000 15 453 15 794 16 135 Feb 2001 15 728 16 077 16 427 Sep 2001 15 057 15 358 15 659 Feb 2002 15 801 16 130 16 460 Sep 2002 15 551 15 866 16 181
d Total not economically active = d Feb 2000 9 798 10 242 10 685 Sep 2000 10 815 11 100 11 386 Feb 2001 10 763 11 044 11 324 Sep 2001 11 706 12 006 12 307 Feb 2002 11 239 11 543 11 846 Sep 2002 11 803 12 118 12 433e Total aged 15 – 65 years = c + d = e Feb 2000 25 705 26 454 27 203 Sep 2000 26 385 26 894 27 404 Feb 2001 26 596 27 121 27 646 Sep 2001 26 878 27 365 27 851 Feb 2002 27 158 27 673 28 188 Sep 2002 27 493 27 984 28 475f Official unemployment rate = b * 100 / c = f Feb 2000 25,5% 26,7% 27,9% Sep 2000 25,0% 25,8% 26,7% Feb 2001 25,6% 26,4% 27,2% Sep 2001 28,8% 29,5% 30,3% Feb 2002 28,4% 29,4% 30,3% Sep 2002 29,5% 30,5% 31,5%g Labour market par ticipation rate = c *100 / e = g Feb 2000 60,2% 61,3% 62,3% Sep 2000 58,0% 58,7% 59,4% Feb 2001 58,6% 59,3% 60,0% Sep 2001 55,4% 56,1% 56,8% Feb 2002 57,6% 58,3% 60,0% Sep 2002 56,0% 56,7% 57,4%h Labour absorption rate = a * 100 / e = h
Feb 2000 43,8% 44,9% 46,0% Sep 2000 42,8% 43,5% 44,3% Feb 2001 42,9% 43,6% 44,4% Sep 2001 38,8% 39,6% 40,3% Feb 2002 40,4% 41,2% 41,9% Sep 2002 38,7% 39,4% 40,2%
P0210 (Survey date: Sep 2002)
iv
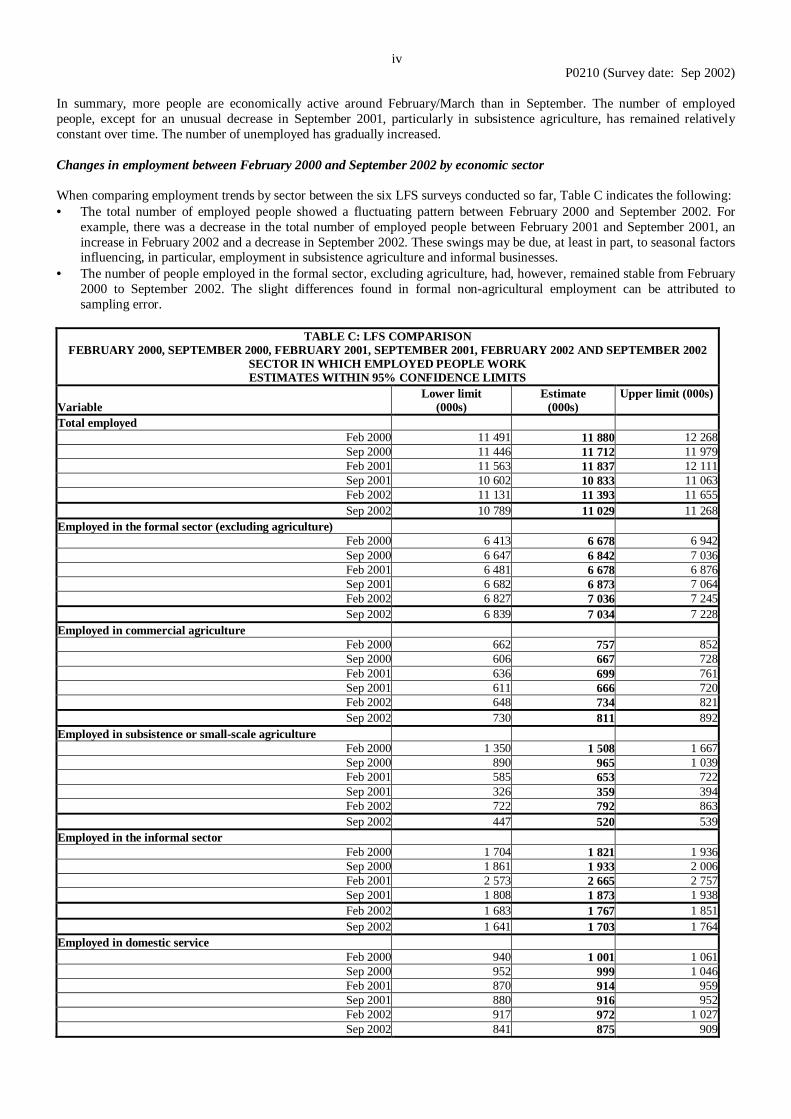
In summary, more people are economically active around February/March than in September. The number of employed people, except for an unusual decrease in September 2001, particularly in subsistence agriculture, has remained relatively constant over time. The number of unemployed has gradually increased. Changes in employment between February 2000 and September 2002 by economic sector When comparing employment trends by sector between the six LFS surveys conducted so far, Table C indicates the following: • The total number of employed people showed a fluctuating pattern between February 2000 and September 2002. For
example, there was a decrease in the total number of employed people between February 2001 and September 2001, an increase in February 2002 and a decrease in September 2002. These swings may be due, at least in part, to seasonal factors influencing, in particular, employment in subsistence agriculture and informal businesses.
• The number of people employed in the formal sector, excluding agriculture, had, however, remained stable from February 2000 to September 2002. The slight differences found in formal non-agricultural employment can be attributed to sampling error.
TABLE C: LFS COMPARISON
FEBRUARY 2000, SEPTEMBER 2000, FEBRUARY 2001, SEPTEMBER 2001, FEBRUARY 2002 AND SEPTEMBER 2002 SECTOR IN WHICH EMPLOYED PEOPLE WORK ESTIMATES WITHIN 95% CONFIDENCE LIMITS
Var iable
Lower limit (000s)
Estimate (000s)
Upper limit (000s)
Total employed Feb 2000 11 491 11 880 12 268Sep 2000 11 446 11 712 11 979Feb 2001 11 563 11 837 12 111Sep 2001 10 602 10 833 11 063Feb 2002 11 131 11 393 11 655Sep 2002 10 789 11 029 11 268
Employed in the formal sector (excluding agriculture) Feb 2000 6 413 6 678 6 942Sep 2000 6 647 6 842 7 036Feb 2001 6 481 6 678 6 876Sep 2001 6 682 6 873 7 064Feb 2002 6 827 7 036 7 245Sep 2002 6 839 7 034 7 228
Employed in commercial agr iculture Feb 2000 662 757 852Sep 2000 606 667 728Feb 2001 636 699 761Sep 2001 611 666 720Feb 2002 648 734 821Sep 2002 730 811 892
Employed in subsistence or small-scale agr iculture Feb 2000 1 350 1 508 1 667Sep 2000 890 965 1 039Feb 2001 585 653 722Sep 2001 326 359 394Feb 2002 722 792 863Sep 2002 447 520 539
Employed in the informal sector Feb 2000 1 704 1 821 1 936Sep 2000 1 861 1 933 2 006Feb 2001 2 573 2 665 2 757Sep 2001 1 808 1 873 1 938Feb 2002 1 683 1 767 1 851Sep 2002 1 641 1 703 1 764
Employed in domestic service Feb 2000 940 1 001 1 061Sep 2000 952 999 1 046Feb 2001 870 914 959Sep 2001 880 916 952Feb 2002 917 972 1 027Sep 2002 841 875 909
P0210 (Survey date: Sep 2002)
v
• Employment in commercial agriculture has remained more or less stable between February 2000 and February 2002, at
approximately 0,7 million people. However, an increase in the number of people employed in this sector from 734 000 people in February 2002 to 811 000 people in September 2002 is found. This increase is not statistically significant, and can be attributed to sampling error.
• In subsistence agriculture or small-scale farming, however, there were some significant changes over time. In February 2000, there were 1,5 million people in subsistence farming, decreasing to 1,0 million in September 2000, 0,7 million in February 2001, and 0,4 million in September 2001, increasing significantly to 0,8 million in February 2002 and then decreasing significantly again in September 2002 to 0,5 million. Rainfall, drought and other weather conditions as well as other natural factors may all influence the extent of subsistence agricultural activity at any given time. Subsistence agricultural employment is proving to be unstable and difficult to measure every six months. A longer time series and more frequent measurements are required to obtain a better understanding of factors influencing employment in the sector.
• In the case of the informal sector, some variation is again apparent, with a high of 2,7 million people working in informal businesses in February 2001, as against 1,7 million to 1,9 million working in the sector at other times the LFS was conducted in September. An interval of six months is proving to be inadequate to understand the dynamics of the sector.
• In domestic service, the number of people employed in the sector has remained more or less constant over time at approximately 0,9 million to 1,0 million people, but there was a significant decrease of about 0,1 million people between February 2002 and September 2002.
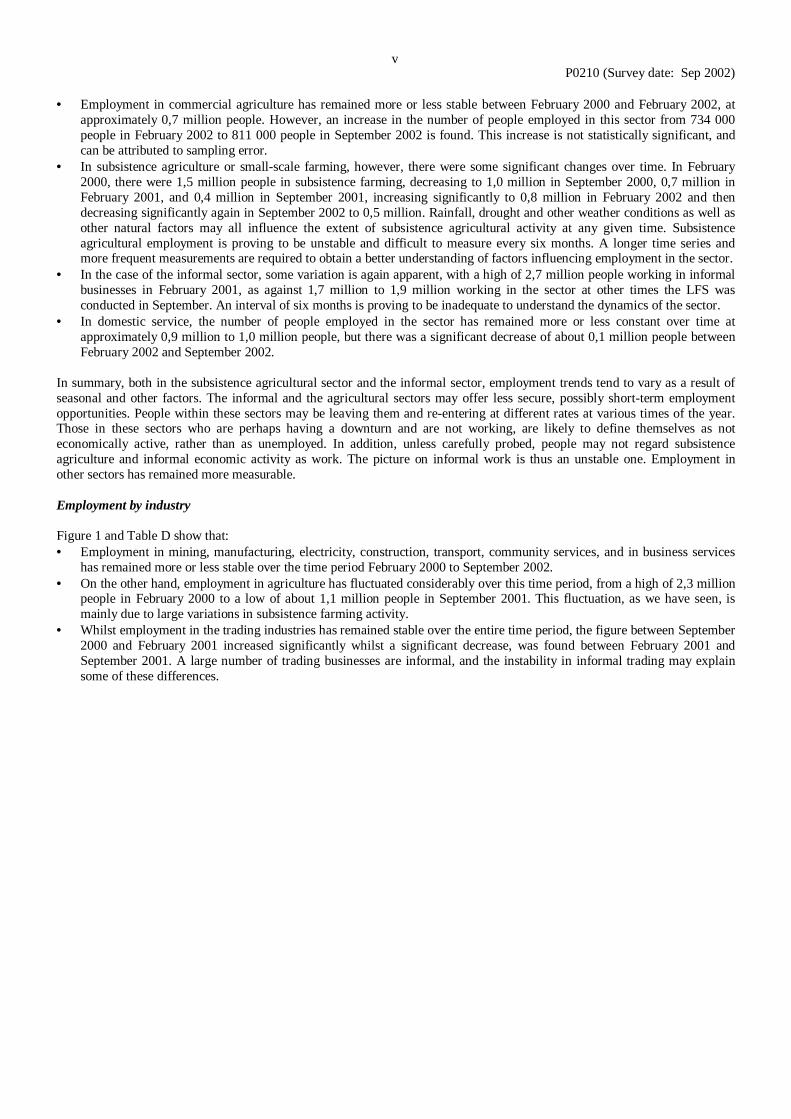
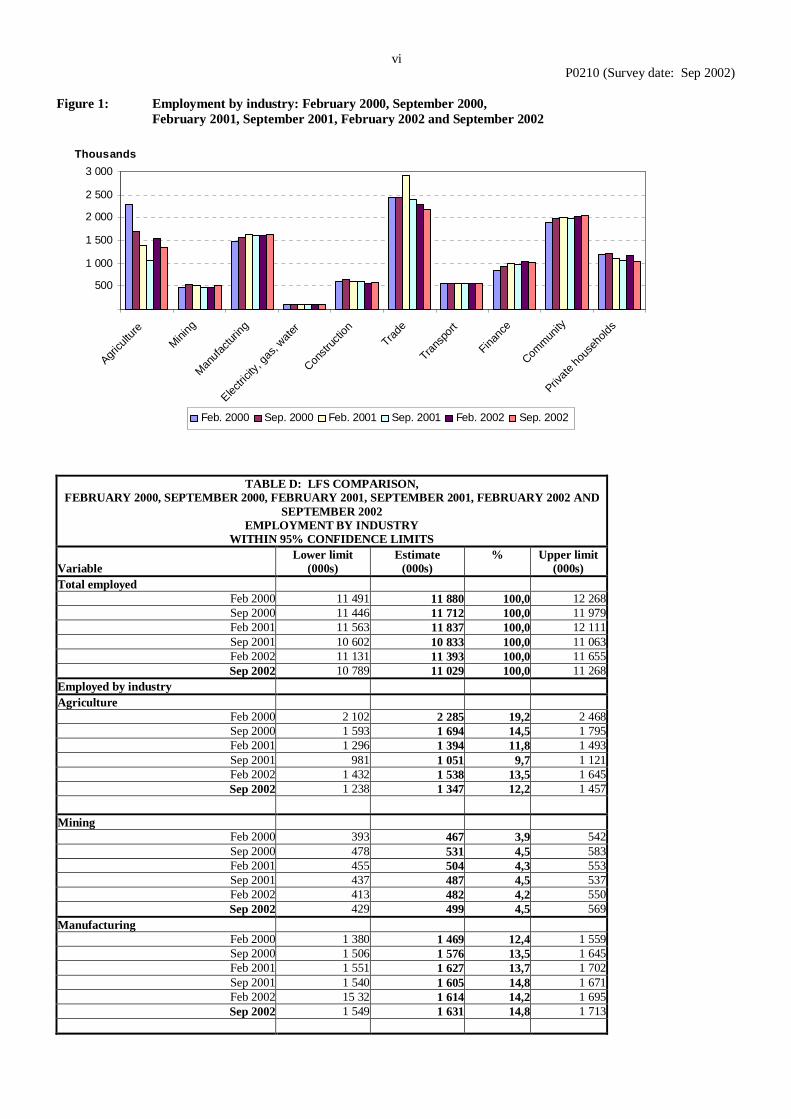
In summary, both in the subsistence agricultural sector and the informal sector, employment trends tend to vary as a result of seasonal and other factors. The informal and the agricultural sectors may offer less secure, possibly short-term employment opportunities. People within these sectors may be leaving them and re-entering at different rates at various times of the year. Those in these sectors who are perhaps having a downturn and are not working, are likely to define themselves as not economically active, rather than as unemployed. In addition, unless carefully probed, people may not regard subsistence agriculture and informal economic activity as work. The picture on informal work is thus an unstable one. Employment in other sectors has remained more measurable. Employment by industry Figure 1 and Table D show that: • Employment in mining, manufacturing, electricity, construction, transport, community services, and in business services
has remained more or less stable over the time period February 2000 to September 2002. • On the other hand, employment in agriculture has fluctuated considerably over this time period, from a high of 2,3 million
people in February 2000 to a low of about 1,1 million people in September 2001. This fluctuation, as we have seen, is mainly due to large variations in subsistence farming activity.
• Whilst employment in the trading industries has remained stable over the entire time period, the figure between September 2000 and February 2001 increased significantly whilst a significant decrease, was found between February 2001 and September 2001. A large number of trading businesses are informal, and the instability in informal trading may explain some of these differences.
P0210 (Survey date: Sep 2002)
vi
Figure 1: Employment by industry: February 2000, September 2000,
February 2001, September 2001, February 2002 and September 2002
500
1 000
1 500
2 000
2 500
3 000
Agricu
lture
Mining
Man
ufac
turing
Electri
city,
gas,
water
Constr
uctio
nTra
de
Trans
port
Financ
e
Comm
unity
Privat
e hou
seho
lds
Thousands
Feb. 2000 Sep. 2000 Feb. 2001 Sep. 2001 Feb. 2002 Sep. 2002
TABLE D: LFS COMPARISON, FEBRUARY 2000, SEPTEMBER 2000, FEBRUARY 2001, SEPTEMBER 2001, FEBRUARY 2002 AND
SEPTEMBER 2002 EMPLOYMENT BY INDUSTRY
WITHIN 95% CONFIDENCE LIMITS Var iable
Lower limit (000s)
Estimate (000s)
% Upper limit (000s)
Total employed Feb 2000 11 491 11 880 100,0 12 268Sep 2000 11 446 11 712 100,0 11 979Feb 2001 11 563 11 837 100,0 12 111Sep 2001 10 602 10 833 100,0 11 063Feb 2002 11 131 11 393 100,0 11 655Sep 2002 10 789 11 029 100,0 11 268
Employed by industry Agr iculture
Feb 2000 2 102 2 285 19,2 2 468Sep 2000 1 593 1 694 14,5 1 795Feb 2001 1 296 1 394 11,8 1 493Sep 2001 981 1 051 9,7 1 121Feb 2002 1 432 1 538 13,5 1 645Sep 2002 1 238 1 347 12,2 1 457
Mining Feb 2000 393 467 3,9 542Sep 2000 478 531 4,5 583Feb 2001 455 504 4,3 553Sep 2001 437 487 4,5 537Feb 2002 413 482 4,2 550Sep 2002 429 499 4,5 569
Manufacturing Feb 2000 1 380 1 469 12,4 1 559Sep 2000 1 506 1 576 13,5 1 645Feb 2001 1 551 1 627 13,7 1 702Sep 2001 1 540 1 605 14,8 1 671Feb 2002 15 32 1 614 14,2 1 695Sep 2002 1 549 1 631 14,8 1 713
P0210 (Survey date: Sep 2002)
vii
Electr icity
Feb 2000 73 88 0,7 102Sep 2000 73 82 0,7 91 Feb 2001 83 93 0,8 103Sep 2001 83 95 0,9 106Feb 2002 70 85 0,7 99Sep 2002 62 81 0,7 98
Construction
Feb 2000 550 596 5,0 643Sep 2000 607 639 5,5 670Feb 2001 561 589 5,0 617Sep 2001 566 594 5,5 622Feb 2002 503 544 4,8 585Sep 2002 528 570 5,2 611
Trade
Feb 2000 2 300 2 434 20,5 2 569Sep 2000 2 340 2 426 20,7 2 513Feb 2001 2 824 2 916 24,6 3 008Sep 2001 2 317 2 397 22,1 2 478Feb 2002 2 206 2 305 20,2 2 403Sep 2002 2 088 2 177 19,7 2 265
Transpor t
Feb 2000 509 547 4,6 585Sep 2000 523 551 4,7 578Feb 2001 525 554 4,7 583Sep 2001 514 543 5,0 571Feb 2002 515 556 4,9 597Sep 2002 505 550 5,0 595
Business services
Feb 2000 779 837 7,0 896Sep 2000 875 928 7,9 981Feb 2001 929 985 8,3 1 042Sep 2001 920 975 9,0 1 030Feb 2002 958 1 033 9,1 1 108Sep 2002 949 1 021 9,3 1 093
Community services
Feb 2000 1 793 1 900 16,0 2 007Sep 2000 1 912 1 994 17,0 2 076Feb 2001 1 920 2 000 16,9 2 079Sep 2001 1 908 1 988 18,3 2 068Feb 2002 1 926 2 020 17,7 2 114Sep 2002 1 951 2 046 18,6 2 142
Private households
Feb 2000 1 007 1 187 10,0 1 267Sep 2000 1 149 1 205 10,3 1 260Feb 2001 1 043 1 099 9,3 1 155Sep 2001 1 014 1 055 9,7 1 096Feb 2002 1 095 1 159 10,2 1 224Sep 2002 982 1 041 9,4 1 100
Totals include unspecified
P0210 (Survey date: Sep 2002)
viii
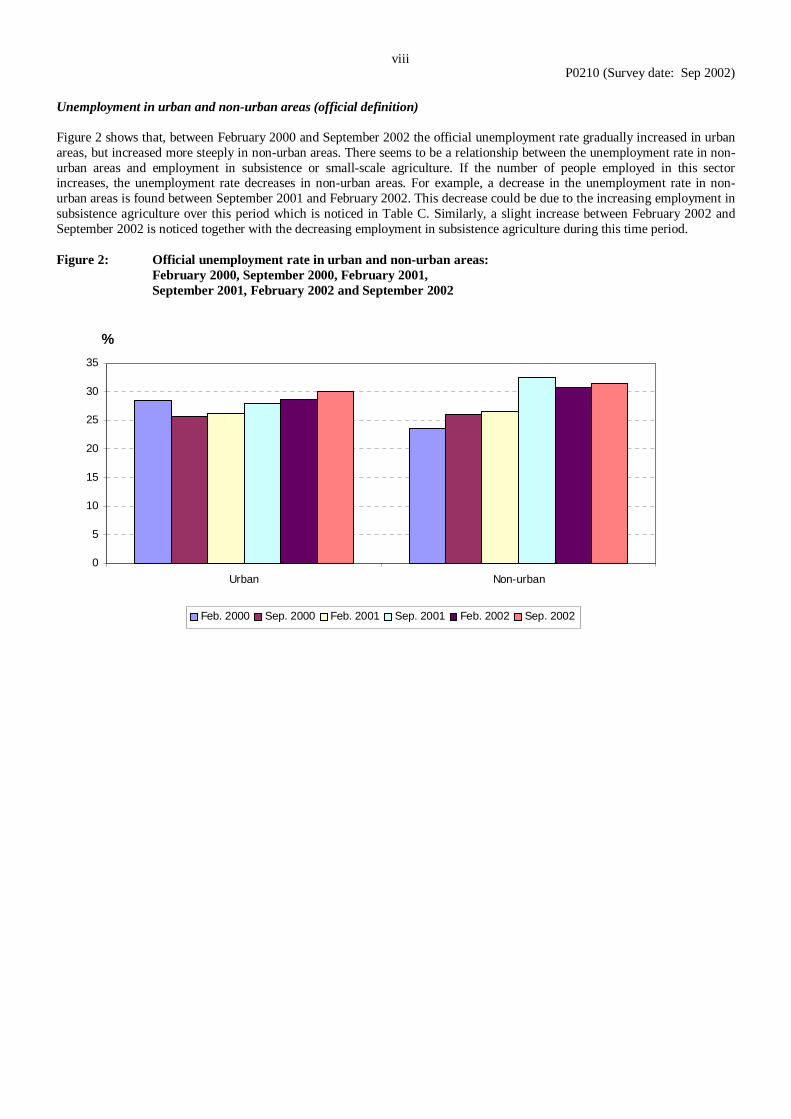
Unemployment in urban and non-urban areas (official definition) Figure 2 shows that, between February 2000 and September 2002 the official unemployment rate gradually increased in urban areas, but increased more steeply in non-urban areas. There seems to be a relationship between the unemployment rate in non-urban areas and employment in subsistence or small-scale agriculture. If the number of people employed in this sector increases, the unemployment rate decreases in non-urban areas. For example, a decrease in the unemployment rate in non-urban areas is found between September 2001 and February 2002. This decrease could be due to the increasing employment in subsistence agriculture over this period which is noticed in Table C. Similarly, a slight increase between February 2002 and September 2002 is noticed together with the decreasing employment in subsistence agriculture during this time period. Figure 2: Official unemployment rate in urban and non-urban areas: February 2000, September 2000, February 2001, September 2001, February 2002 and September 2002
0
5
10
15
20
25
30
35
Urban Non-urban
%
Feb. 2000 Sep. 2000 Feb. 2001 Sep. 2001 Feb. 2002 Sep. 2002
P0210 (Survey date: Sep 2002)
ix
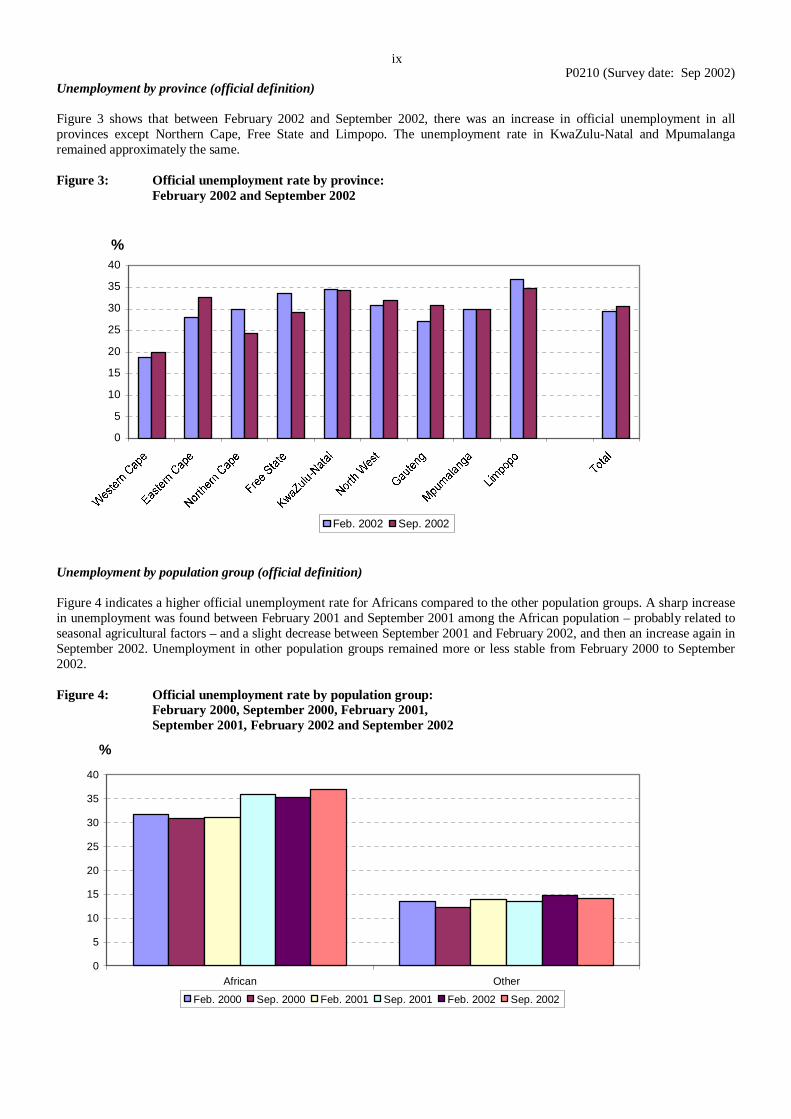
Unemployment by province (official definition) Figure 3 shows that between February 2002 and September 2002, there was an increase in official unemployment in all provinces except Northern Cape, Free State and Limpopo. The unemployment rate in KwaZulu-Natal and Mpumalanga remained approximately the same. Figure 3: Official unemployment rate by province: February 2002 and September 2002
0
5
10
15
20
25
30
35
40
%
Feb. 2002 Sep. 2002
Unemployment by population group (official definition) Figure 4 indicates a higher official unemployment rate for Africans compared to the other population groups. A sharp increase in unemployment was found between February 2001 and September 2001 among the African population – probably related to seasonal agricultural factors – and a slight decrease between September 2001 and February 2002, and then an increase again in September 2002. Unemployment in other population groups remained more or less stable from February 2000 to September 2002. Figure 4: Official unemployment rate by population group: February 2000, September 2000, February 2001, September 2001, February 2002 and September 2002
0
5
10
15
20
25
30
35
40
African Other
%
Feb. 2000 Sep. 2000 Feb. 2001 Sep. 2001 Feb. 2002 Sep. 2002
P0210 (Survey date: Sep 2002)
x
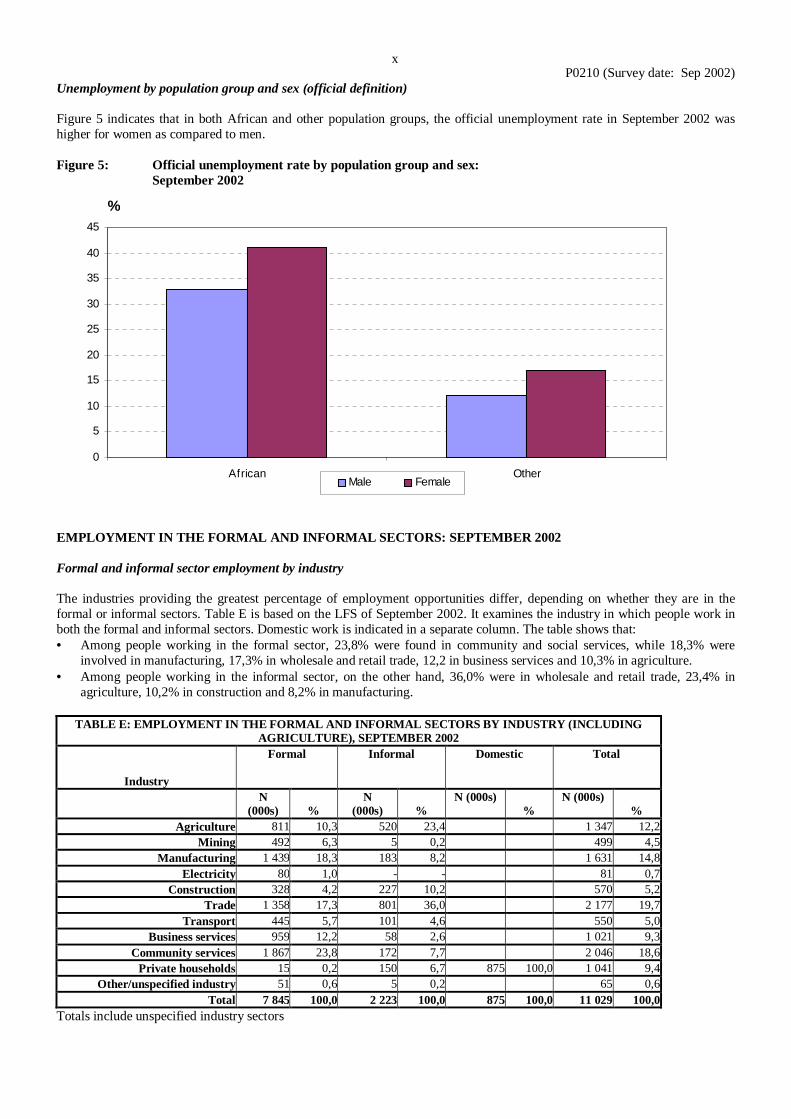
Unemployment by population group and sex (official definition) Figure 5 indicates that in both African and other population groups, the official unemployment rate in September 2002 was higher for women as compared to men. Figure 5: Official unemployment rate by population group and sex: September 2002
0
5
10
15
20
25
30
35
40
45
African Other
%
Male Female
EMPLOYMENT IN THE FORMAL AND INFORMAL SECTORS: SEPTEMBER 2002 Formal and informal sector employment by industry The industries providing the greatest percentage of employment opportunities differ, depending on whether they are in the formal or informal sectors. Table E is based on the LFS of September 2002. It examines the industry in which people work in both the formal and informal sectors. Domestic work is indicated in a separate column. The table shows that: • Among people working in the formal sector, 23,8% were found in community and social services, while 18,3% were
involved in manufacturing, 17,3% in wholesale and retail trade, 12,2 in business services and 10,3% in agriculture. • Among people working in the informal sector, on the other hand, 36,0% were in wholesale and retail trade, 23,4% in
agriculture, 10,2% in construction and 8,2% in manufacturing.
TABLE E: EMPLOYMENT IN THE FORMAL AND INFORMAL SECTORS BY INDUSTRY (INCLUDING AGRICULTURE), SEPTEMBER 2002
Industry
Formal Informal Domestic Total
N (000s)
%
N (000s)
%
N (000s) %
N (000s) %
Agr iculture 811 10,3 520 23,4 1 347 12,2Mining 492 6,3 5 0,2 499 4,5
Manufacturing 1 439 18,3 183 8,2 1 631 14,8Electr icity 80 1,0 - - 81 0,7
Construction 328 4,2 227 10,2 570 5,2 Trade 1 358 17,3 801 36,0 2 177 19,7
Transpor t 445 5,7 101 4,6 550 5,0Business services 959 12,2 58 2,6 1 021 9,3
Community services 1 867 23,8 172 7,7 2 046 18,6Private households 15 0,2 150 6,7 875 100,0 1 041 9,4
Other/unspecified industry 51 0,6 5 0,2 65 0,6Total 7 845 100,0 2 223 100,0 875 100,0 11 029 100,0
Totals include unspecified industry sectors
P0210 (Survey date: Sep 2002)
xi
Comparison of formal employment figures in the LFS and the SEE Formal sector employment figures may be obtained from various other Stats SA data sets, including the survey of employment and earnings (SEE), which collects information on formal employment in South Africa (excluding certain industries, divisions and activities as described below). The comparable results to the LFS of September 2002 are from the SEE of September 2002. The comparable results to the LFS of February/March 2002 are from the SEE of March 2002. It needs to be borne in mind that SEE obtains data from businesses, while in the LFS, households rather than businesses are sampled. Households contain people working in all industries. When complex probability sampling is used, people have the same chance of being selected in their particular stratum in the sample as their overall proportion in a particular industry within that stratum. The SEE on the other hand collects information from formal sector businesses, excluding the following: • agriculture, hunting, forestry and fishing, • restaurants and other eating and drinking places, boarding houses, caravan parks, guest farms, • water and air transport, • financial institutions excluding banks, • real estate and business services, • educational services outside the public sector, • medical, dental and other health services outside the public sector, • welfare organisations outside the public sector, • religious organisations, • recreational and cultural services, • household services and domestic workers in private households, and • informal businesses. Table F indicates that SEE shows a decline in formal sector employment in the industries and divisions that it covers between February/March 2000 and February/March 2002, then a slight increase in September 2002. The LFS, on the other hand, shows a relatively stable picture in formal sector employment, in the industries and divisions that are not well covered by SEE between March 2000 and September 2002.
TABLE F: COMPARISONS OF FORMAL SECTOR EMPLOYMENT ACCORDING TO THE LFS AND THE SEE February/
March 2000 September
2000 February/
March 2001 September
2001 February/
March 2002 September
2002 (000s) (000s) (000s) (000s) (000s) (000s) Employed according to SEE 4 754 4 685 4 676
4 650
4 634
4 679
Employed in formal sector in activities which are not covered in SEE
1 924 2 157 2 002
2 223 2 403
2 355
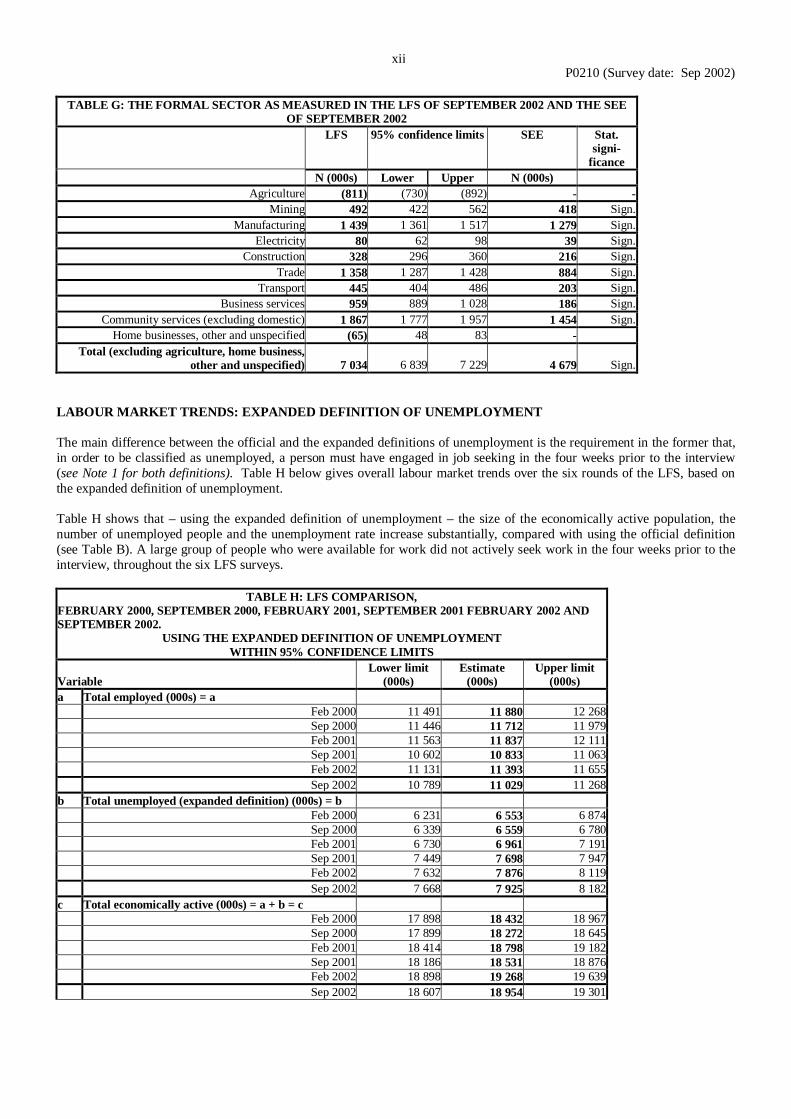
Comparison of formal sector employment by industry in the LFS and the SEE of February/March 2002 As indicated previously, the SEE excludes a range of businesses not only in certain industries but also in divisions within industries, which may indeed be formal businesses. Table G indicates significant differences in all types of industry between LFS and SEE. The SEE finds less employment than the LFS in all types of industry. It would therefore seem as if formal sector employment is growing in those industries or divisions that are not well covered by SEE. This may be indicative of a shift to the tertiary rather than the secondary sector in new job opportunities. It may also be indicative of outsourcing of non-core business in some industries.
P0210 (Survey date: Sep 2002)
xii
TABLE G: THE FORMAL SECTOR AS MEASURED IN THE LFS OF SEPTEMBER 2002 AND THE SEE
OF SEPTEMBER 2002 LFS 95% confidence limits SEE Stat.
signi-ficance
N (000s) Lower Upper N (000s) Agriculture (811) (730) (892) - -
Mining 492 422 562 418 Sign. Manufacturing 1 439 1 361 1 517 1 279 Sign.
Electricity 80 62 98 39 Sign. Construction 328 296 360 216 Sign.
Trade 1 358 1 287 1 428 884 Sign. Transport 445 404 486 203 Sign.
Business services 959 889 1 028 186 Sign. Community services (excluding domestic) 1 867 1 777 1 957 1 454 Sign.
Home businesses, other and unspecified (65) 48 83 - Total (excluding agriculture, home business,
other and unspecified) 7 034 6 839 7 229 4 679
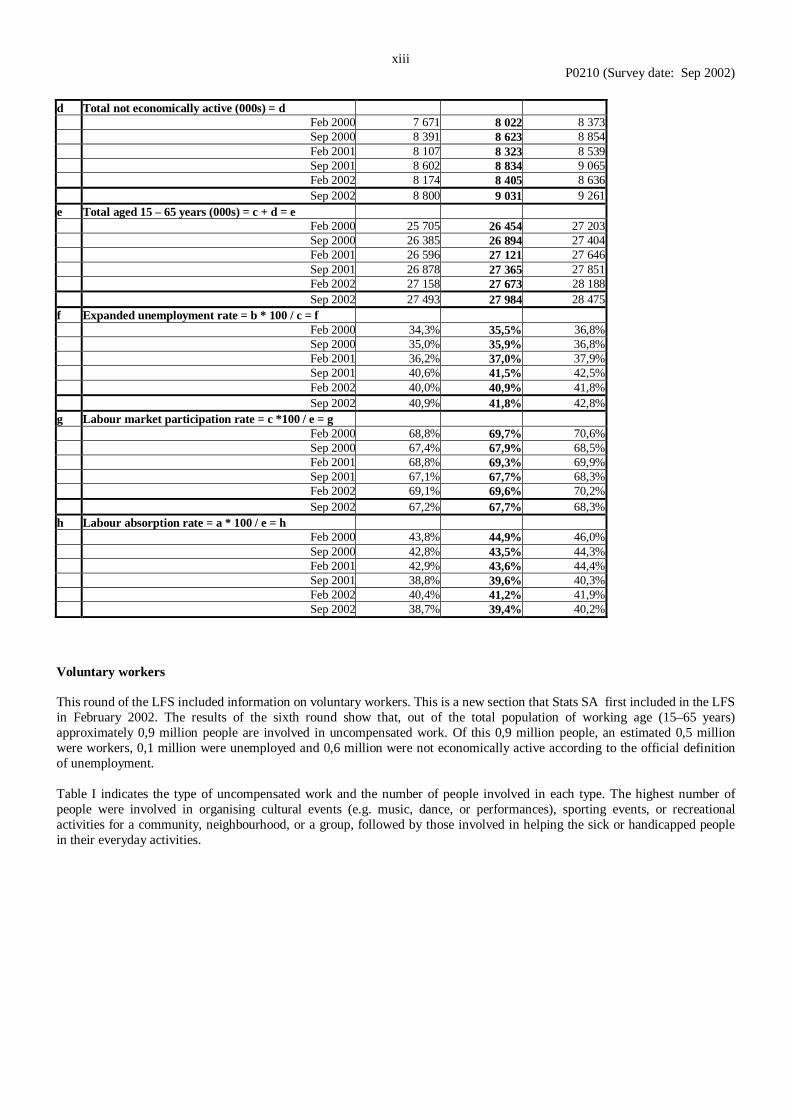
Sign. LABOUR MARKET TRENDS: EXPANDED DEFINITION OF UNEMPLOYMENT The main difference between the official and the expanded definitions of unemployment is the requirement in the former that, in order to be classified as unemployed, a person must have engaged in job seeking in the four weeks prior to the interview (see Note 1 for both definitions). Table H below gives overall labour market trends over the six rounds of the LFS, based on the expanded definition of unemployment. Table H shows that – using the expanded definition of unemployment – the size of the economically active population, the number of unemployed people and the unemployment rate increase substantially, compared with using the official definition (see Table B). A large group of people who were available for work did not actively seek work in the four weeks prior to the interview, throughout the six LFS surveys.
TABLE H: LFS COMPARISON, FEBRUARY 2000, SEPTEMBER 2000, FEBRUARY 2001, SEPTEMBER 2001 FEBRUARY 2002 AND SEPTEMBER 2002.
USING THE EXPANDED DEFINITION OF UNEMPLOYMENT WITHIN 95% CONFIDENCE LIMITS
Var iable
Lower limit (000s)
Estimate (000s)
Upper limit (000s)
a Total employed (000s) = a Feb 2000 11 491 11 880 12 268 Sep 2000 11 446 11 712 11 979 Feb 2001 11 563 11 837 12 111 Sep 2001 10 602 10 833 11 063 Feb 2002 11 131 11 393 11 655
Sep 2002 10 789 11 029 11 268b Total unemployed (expanded definition) (000s) = b
Feb 2000 6 231 6 553 6 874 Sep 2000 6 339 6 559 6 780 Feb 2001 6 730 6 961 7 191 Sep 2001 7 449 7 698 7 947 Feb 2002 7 632 7 876 8 119
Sep 2002 7 668 7 925 8 182c Total economically active (000s) = a + b = c
Feb 2000 17 898 18 432 18 967 Sep 2000 17 899 18 272 18 645 Feb 2001 18 414 18 798 19 182 Sep 2001 18 186 18 531 18 876 Feb 2002 18 898 19 268 19 639
Sep 2002 18 607 18 954 19 301
P0210 (Survey date: Sep 2002)
xiii
d Total not economically active (000s) = d
Feb 2000 7 671 8 022 8 373 Sep 2000 8 391 8 623 8 854 Feb 2001 8 107 8 323 8 539 Sep 2001 8 602 8 834 9 065 Feb 2002 8 174 8 405 8 636
Sep 2002 8 800 9 031 9 261 e Total aged 15 – 65 years (000s) = c + d = e
Feb 2000 25 705 26 454 27 203 Sep 2000 26 385 26 894 27 404 Feb 2001 26 596 27 121 27 646 Sep 2001 26 878 27 365 27 851 Feb 2002 27 158 27 673 28 188
Sep 2002 27 493 27 984 28 475 f Expanded unemployment rate = b * 100 / c = f
Feb 2000 34,3% 35,5% 36,8% Sep 2000 35,0% 35,9% 36,8% Feb 2001 36,2% 37,0% 37,9% Sep 2001 40,6% 41,5% 42,5% Feb 2002 40,0% 40,9% 41,8%
Sep 2002 40,9% 41,8% 42,8% g Labour market par ticipation rate = c *100 / e = g
Feb 2000 68,8% 69,7% 70,6% Sep 2000 67,4% 67,9% 68,5% Feb 2001 68,8% 69,3% 69,9% Sep 2001 67,1% 67,7% 68,3% Feb 2002 69,1% 69,6% 70,2%
Sep 2002 67,2% 67,7% 68,3% h Labour absorption rate = a * 100 / e = h
Feb 2000 43,8% 44,9% 46,0% Sep 2000 42,8% 43,5% 44,3% Feb 2001 42,9% 43,6% 44,4% Sep 2001 38,8% 39,6% 40,3% Feb 2002 40,4% 41,2% 41,9% Sep 2002 38,7% 39,4% 40,2%
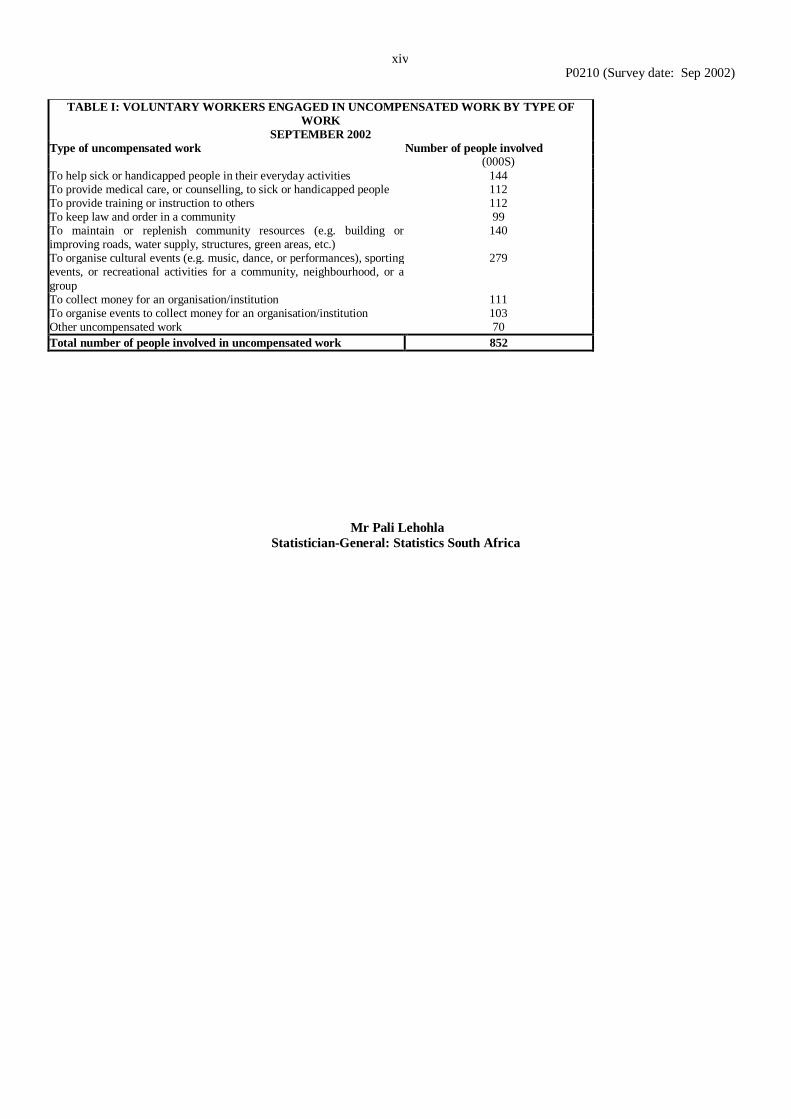
Voluntary workers This round of the LFS included information on voluntary workers. This is a new section that Stats SA first included in the LFS in February 2002. The results of the sixth round show that, out of the total population of working age (15–65 years) approximately 0,9 million people are involved in uncompensated work. Of this 0,9 million people, an estimated 0,5 million were workers, 0,1 million were unemployed and 0,6 million were not economically active according to the official definition of unemployment. Table I indicates the type of uncompensated work and the number of people involved in each type. The highest number of people were involved in organising cultural events (e.g. music, dance, or performances), sporting events, or recreational activities for a community, neighbourhood, or a group, followed by those involved in helping the sick or handicapped people in their everyday activities.
P0210 (Survey date: Sep 2002)
xiv
TABLE I : VOLUNTARY WORKERS ENGAGED IN UNCOMPENSATED WORK BY TYPE OF
WORK SEPTEMBER 2002
Type of uncompensated work Number of people involved (000S) To help sick or handicapped people in their everyday activities 144 To provide medical care, or counselling, to sick or handicapped people 112 To provide training or instruction to others 112 To keep law and order in a community 99 To maintain or replenish community resources (e.g. building or improving roads, water supply, structures, green areas, etc.)
140
To organise cultural events (e.g. music, dance, or performances), sporting events, or recreational activities for a community, neighbourhood, or a group
279
To collect money for an organisation/institution 111 To organise events to collect money for an organisation/institution 103 Other uncompensated work 70 Total number of people involved in uncompensated work 852
Mr Pali Lehohla
Statistician-General: Statistics South Afr ica
P0210 (Survey date: Sep 2002)
xv
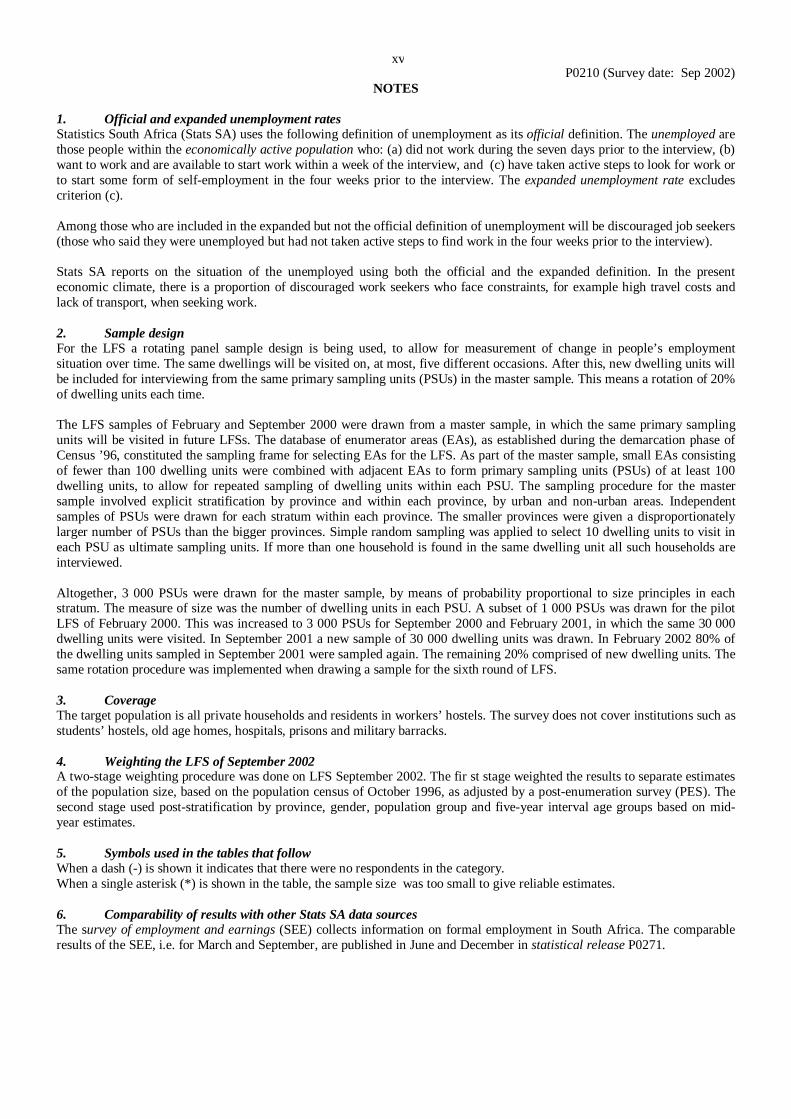
NOTES 1. Official and expanded unemployment rates Statistics South Africa (Stats SA) uses the following definition of unemployment as its official definition. The unemployed are those people within the economically active population who: (a) did not work during the seven days prior to the interview, (b) want to work and are available to start work within a week of the interview, and (c) have taken active steps to look for work or to start some form of self-employment in the four weeks prior to the interview. The expanded unemployment rate excludes criterion (c). Among those who are included in the expanded but not the official definition of unemployment will be discouraged job seekers (those who said they were unemployed but had not taken active steps to find work in the four weeks prior to the interview). Stats SA reports on the situation of the unemployed using both the official and the expanded definition. In the present economic climate, there is a proportion of discouraged work seekers who face constraints, for example high travel costs and lack of transport, when seeking work. 2. Sample design For the LFS a rotating panel sample design is being used, to allow for measurement of change in people’s employment situation over time. The same dwellings will be visited on, at most, five different occasions. After this, new dwelling units will be included for interviewing from the same primary sampling units (PSUs) in the master sample. This means a rotation of 20% of dwelling units each time. The LFS samples of February and September 2000 were drawn from a master sample, in which the same primary sampling units will be visited in future LFSs. The database of enumerator areas (EAs), as established during the demarcation phase of Census ’96, constituted the sampling frame for selecting EAs for the LFS. As part of the master sample, small EAs consisting of fewer than 100 dwelling units were combined with adjacent EAs to form primary sampling units (PSUs) of at least 100 dwelling units, to allow for repeated sampling of dwelling units within each PSU. The sampling procedure for the master sample involved explicit stratification by province and within each province, by urban and non-urban areas. Independent samples of PSUs were drawn for each stratum within each province. The smaller provinces were given a disproportionately larger number of PSUs than the bigger provinces. Simple random sampling was applied to select 10 dwelling units to visit in each PSU as ultimate sampling units. If more than one household is found in the same dwelling unit all such households are interviewed. Altogether, 3 000 PSUs were drawn for the master sample, by means of probability proportional to size principles in each stratum. The measure of size was the number of dwelling units in each PSU. A subset of 1 000 PSUs was drawn for the pilot LFS of February 2000. This was increased to 3 000 PSUs for September 2000 and February 2001, in which the same 30 000 dwelling units were visited. In September 2001 a new sample of 30 000 dwelling units was drawn. In February 2002 80% of the dwelling units sampled in September 2001 were sampled again. The remaining 20% comprised of new dwelling units. The same rotation procedure was implemented when drawing a sample for the sixth round of LFS. 3. Coverage The target population is all private households and residents in workers’ hostels. The survey does not cover institutions such as students’ hostels, old age homes, hospitals, prisons and military barracks. 4. Weighting the LFS of September 2002 A two-stage weighting procedure was done on LFS September 2002. The fir st stage weighted the results to separate estimates of the population size, based on the population census of October 1996, as adjusted by a post-enumeration survey (PES). The second stage used post-stratification by province, gender, population group and five-year interval age groups based on mid-year estimates. 5. Symbols used in the tables that follow When a dash (-) is shown it indicates that there were no respondents in the category. When a single asterisk (* ) is shown in the table, the sample size was too small to give reliable estimates. 6. Comparability of results with other Stats SA data sources The survey of employment and earnings (SEE) collects information on formal employment in South Africa. The comparable results of the SEE, i.e. for March and September, are published in June and December in statistical release P0271.
P0210 (Survey date: Sep 2002)
xvi
7. Urbanisation The urban population constituted 54,1% of the total population according to Census ’96. In the weighting matrix for the LFS of September 2002, the proportionate distribution of the population by urban and non-urban areas was based on the population census of 1996. It follows that urbanisation cannot be detected from the LFS, but will be measured by comparing Census ’96 with Census 2001. 8. Confidence intervals Stats SA have calculated 95% confidence limits for key variables. These are available on request to users who require this information. DEFINITIONS OF TERMS A household consists of a single person or a group of people who live together for at least four nights a week, who eat together and who share resources. A dwelling unit is any structure or part of a structure or group of structures occupied by one or more than one household; or which is vacant or under construction but could be lived in at the time of the survey. The dwelling unit is the major listing unit for this survey. However, if multiple households are identified during listing, then each household is listed separately. But the listing unit is not primarily households, as multiple households are sometimes discovered at the time of the survey. In workers’ hostels, (1) where rooms are occupied by individual persons/households, then each room is treated as a dwelling unit, and (2) in the case of dormitories/communal rooms, each bed is listed separately and treated as a dwelling unit. It is important to note that the dwelling unit as defined here was also the selection unit for our sample. Population group describes the racial classification of a particular group of South African citizens. The previous government used legislation to impose this type of classification, to divide the South African population into distinct groupings on which to base apartheid policies. For quite a different reason it remains important for Stats SA to continue to use this classification wherever possible. It clearly indicates the effects of discrimination of the past, and permits monitoring of policies to alleviate discrimination. Note that, in the past, population group was based on a legal definition, but it is now based on self-perceptions and self-classification. An African/black person is someone who classifies him/herself as such. The same applies to a coloured, Indian/Asian or white person. A hostel is a communal living quarter for workers, provided by a public organisation such as a local authority, or a private organisation such as a mining company. These were residential dormitories established for migrant workers during the apartheid era, and they continue to house people working in certain industries, such as the mining industry. Institutions are communal temporary, semi-permanent or permanent living arrangements for people in special circumstances, for example prisons, police cells, school boarding facilities, homes for the aged or the disabled, hotels and hospitals. The working age population includes all those aged between 15 and 65 years. The economically active population consists of both those who are employed and those who are unemployed. The employed are those who performed work for pay, profit or family gain in the seven days prior to the survey interview, or who were absent from work during these seven days, but did have some form of paid work during this time. The official unemployment rate: see Note 1. The expanded unemployment rate: see Note 1. The people who are out of the labour market or who are not economically active are those who are not available for work. This category includes full-time scholars and students, full-time homemakers, those who are retired, and those who are unable or unwilling to work. The formal sector includes all businesses that are registered in any way. The informal sector consists of those businesses that are not registered in any way. They are generally small in nature, and are seldom run from business premises. Instead, they are run from homes, street pavements or other informal arrangements. Primary industries include agriculture, forestry and fishing, and mining and quarrying.
P0210 (Survey date: Sep 2002)
xvii
Secondary industries include manufacturing, electricity and other utilities, and construction. Tertiary industries include trade, transport, financial and business services, and social, personal and community services. Employment status refers to whether or not the person is self-employed, or works as an employee, or both, or else works as a domestic worker in a household. Location refers to whether the person lives in an urban or non-urban area. • An urban area is one that has been legally proclaimed as being urban. These include towns, cities and metropolitan areas. • A semi-urban area is not part of a legally proclaimed urban area, but adjoins it. Informal settlements are examples of these
types of areas. In this publication semi-urban areas have been included with non-urban areas. • All other areas are classified as non-urban, including commercial farms, small settlements, rural villages and other areas
which are further away from towns and cities. Workers include the self-employed, employers and employees. Labour market dynamics refer to movement into and out of the labour market, and into and out of actual employment, over a specified time period.
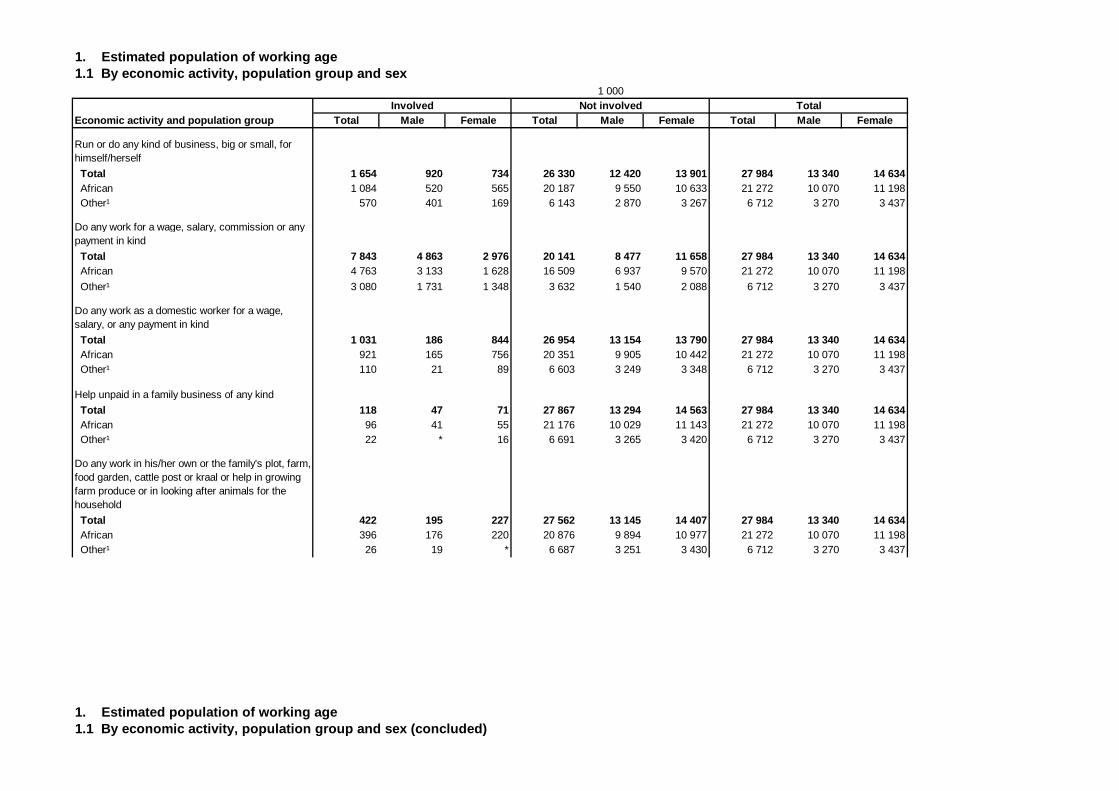
1. Estimated population of working age1.1 By economic activity, population group and sex
Total Male Female Total Male Female Total Male Female
Run or do any kind of business, big or small, for himself/herself
Total 1 654 920 734 26 330 12 420 13 901 27 984 13 340 14 634 African 1 084 520 565 20 187 9 550 10 633 21 272 10 070 11 198 Other¹ 570 401 169 6 143 2 870 3 267 6 712 3 270 3 437
Do any work for a wage, salary, commission or any payment in kind
Total 7 843 4 863 2 976 20 141 8 477 11 658 27 984 13 340 14 634 African 4 763 3 133 1 628 16 509 6 937 9 570 21 272 10 070 11 198
Other¹ 3 080 1 731 1 348 3 632 1 540 2 088 6 712 3 270 3 437
Do any work as a domestic worker for a wage, salary, or any payment in kind
Total 1 031 186 844 26 954 13 154 13 790 27 984 13 340 14 634 African 921 165 756 20 351 9 905 10 442 21 272 10 070 11 198 Other¹ 110 21 89 6 603 3 249 3 348 6 712 3 270 3 437
Help unpaid in a family business of any kind
Total 118 47 71 27 867 13 294 14 563 27 984 13 340 14 634 African 96 41 55 21 176 10 029 11 143 21 272 10 070 11 198 Other¹ 22 * 16 6 691 3 265 3 420 6 712 3 270 3 437
Do any work in his/her own or the family's plot, farm, food garden, cattle post or kraal or help in growing farm produce or in looking after animals for the household
Total 422 195 227 27 562 13 145 14 407 27 984 13 340 14 634 African 396 176 220 20 876 9 894 10 977 21 272 10 070 11 198 Other¹ 26 19 * 6 687 3 251 3 430 6 712 3 270 3 437
1. Estimated population of working age1.1 By economic activity, population group and sex (concluded)
1 000
Economic activity and population groupInvolved Not involved Total
Total Male Female Total Male Female Total Male Female
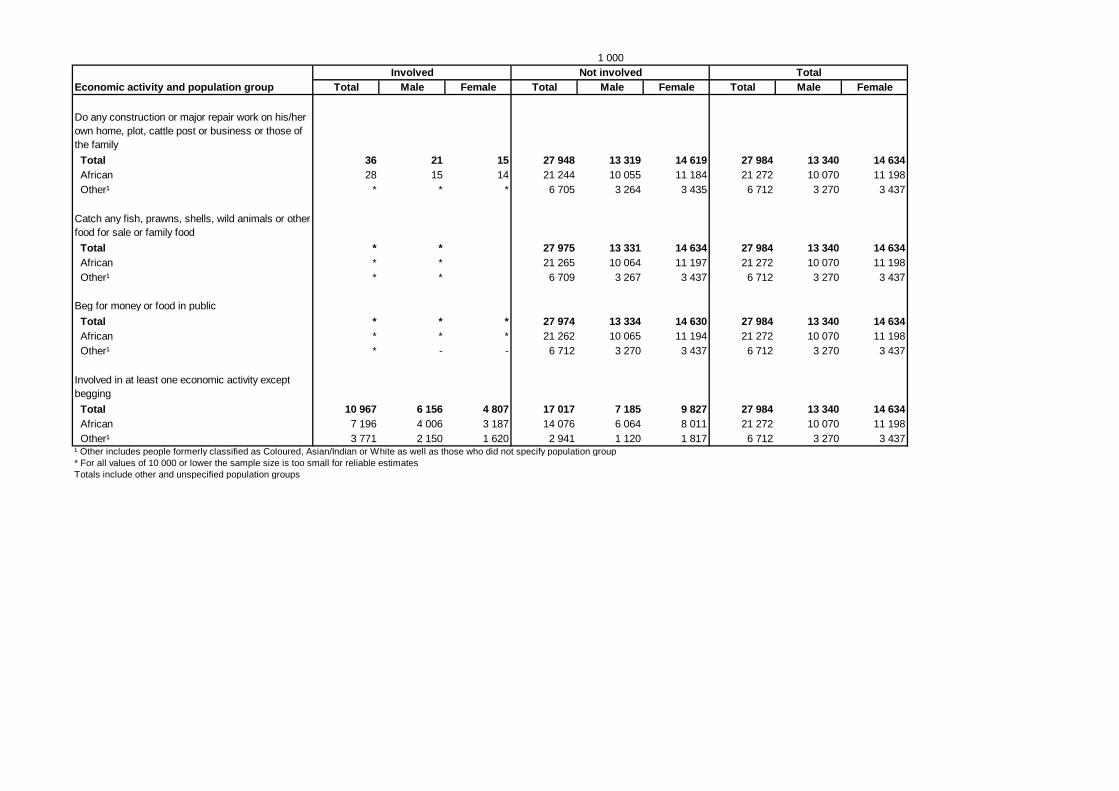
Do any construction or major repair work on his/her own home, plot, cattle post or business or those of the family
Total 36 21 15 27 948 13 319 14 619 27 984 13 340 14 634 African 28 15 14 21 244 10 055 11 184 21 272 10 070 11 198 Other¹ * * * 6 705 3 264 3 435 6 712 3 270 3 437
Catch any fish, prawns, shells, wild animals or other food for sale or family food
Total * * 27 975 13 331 14 634 27 984 13 340 14 634 African * * 21 265 10 064 11 197 21 272 10 070 11 198 Other¹ * * 6 709 3 267 3 437 6 712 3 270 3 437
Beg for money or food in public
Total * * * 27 974 13 334 14 630 27 984 13 340 14 634 African * * * 21 262 10 065 11 194 21 272 10 070 11 198 Other¹ * - - 6 712 3 270 3 437 6 712 3 270 3 437
Involved in at least one economic activity except begging
Total 10 967 6 156 4 807 17 017 7 185 9 827 27 984 13 340 14 634 African 7 196 4 006 3 187 14 076 6 064 8 011 21 272 10 070 11 198 Other¹ 3 771 2 150 1 620 2 941 1 120 1 817 6 712 3 270 3 437¹ Other includes people formerly classified as Coloured, Asian/Indian or White as well as those who did not specify population group* For all values of 10 000 or lower the sample size is too small for reliable estimatesTotals include other and unspecified population groups
1 000
Economic activity and population groupInvolved Not involved Total
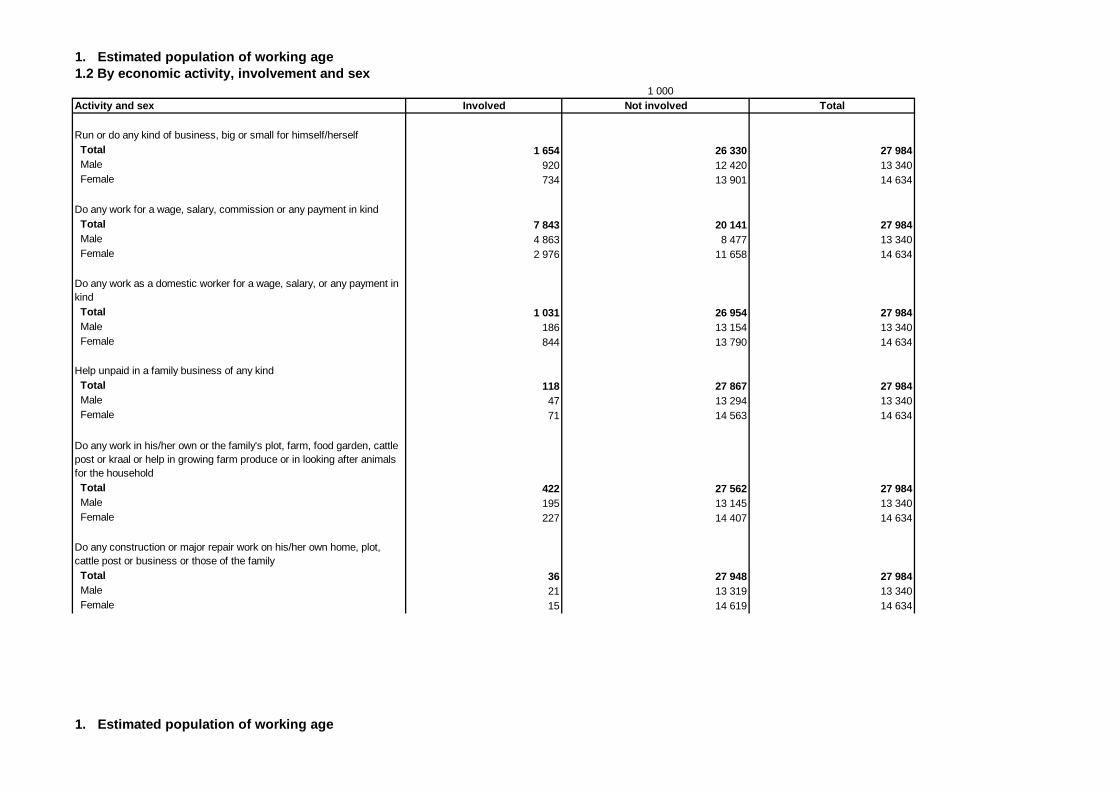
1. Estimated population of working age1.2 By economic activity, involvement and sex
Activity and sex Involved Not involved Total
Run or do any kind of business, big or small for himself/herself Total 1 654 26 330 27 984 Male 920 12 420 13 340 Female 734 13 901 14 634
Do any work for a wage, salary, commission or any payment in kind Total 7 843 20 141 27 984 Male 4 863 8 477 13 340 Female 2 976 11 658 14 634
Do any work as a domestic worker for a wage, salary, or any payment in kind Total 1 031 26 954 27 984 Male 186 13 154 13 340 Female 844 13 790 14 634
Help unpaid in a family business of any kind Total 118 27 867 27 984 Male 47 13 294 13 340 Female 71 14 563 14 634
Do any work in his/her own or the family's plot, farm, food garden, cattle post or kraal or help in growing farm produce or in looking after animals for the household Total 422 27 562 27 984 Male 195 13 145 13 340 Female 227 14 407 14 634
Do any construction or major repair work on his/her own home, plot, cattle post or business or those of the family Total 36 27 948 27 984 Male 21 13 319 13 340 Female 15 14 619 14 634
1. Estimated population of working age
1 000
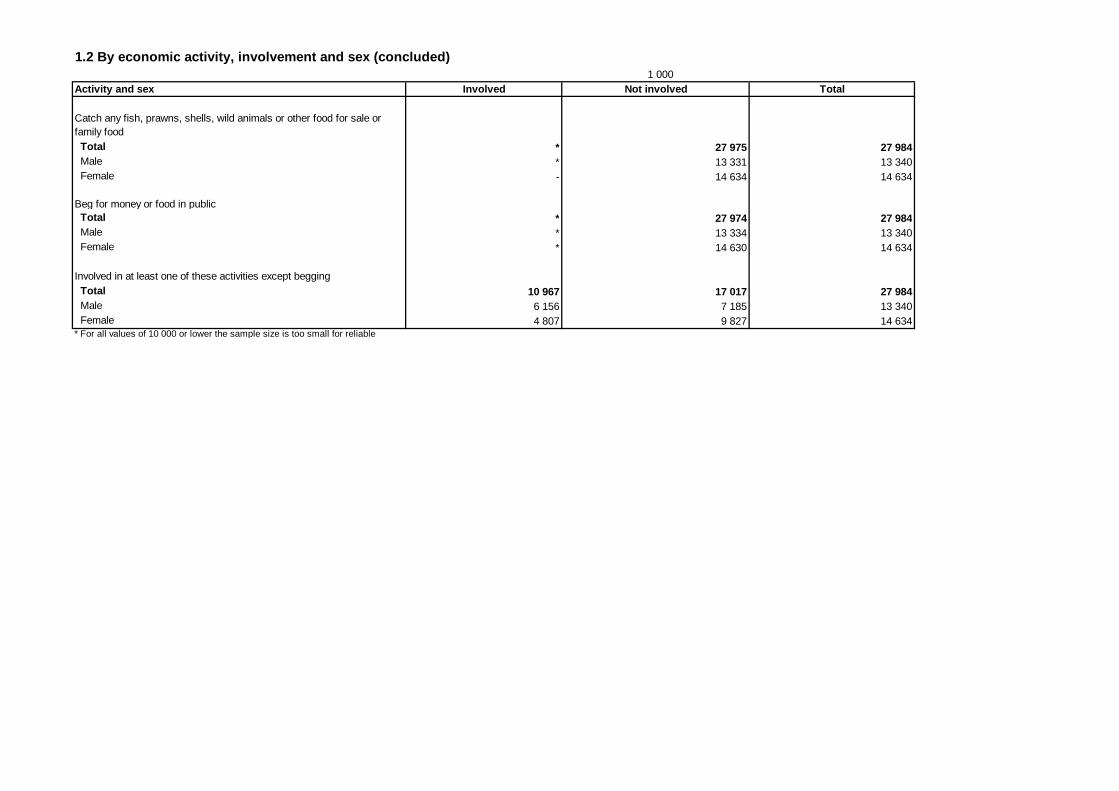
1.2 By economic activity, involvement and sex (concluded)
Activity and sex Involved Not involved Total
Catch any fish, prawns, shells, wild animals or other food for sale or family food Total * 27 975 27 984 Male * 13 331 13 340 Female - 14 634 14 634
Beg for money or food in public Total * 27 974 27 984 Male * 13 334 13 340 Female * 14 630 14 634
Involved in at least one of these activities except begging Total 10 967 17 017 27 984 Male 6 156 7 185 13 340 Female 4 807 9 827 14 634* For all values of 10 000 or lower the sample size is too small for reliable
1 000
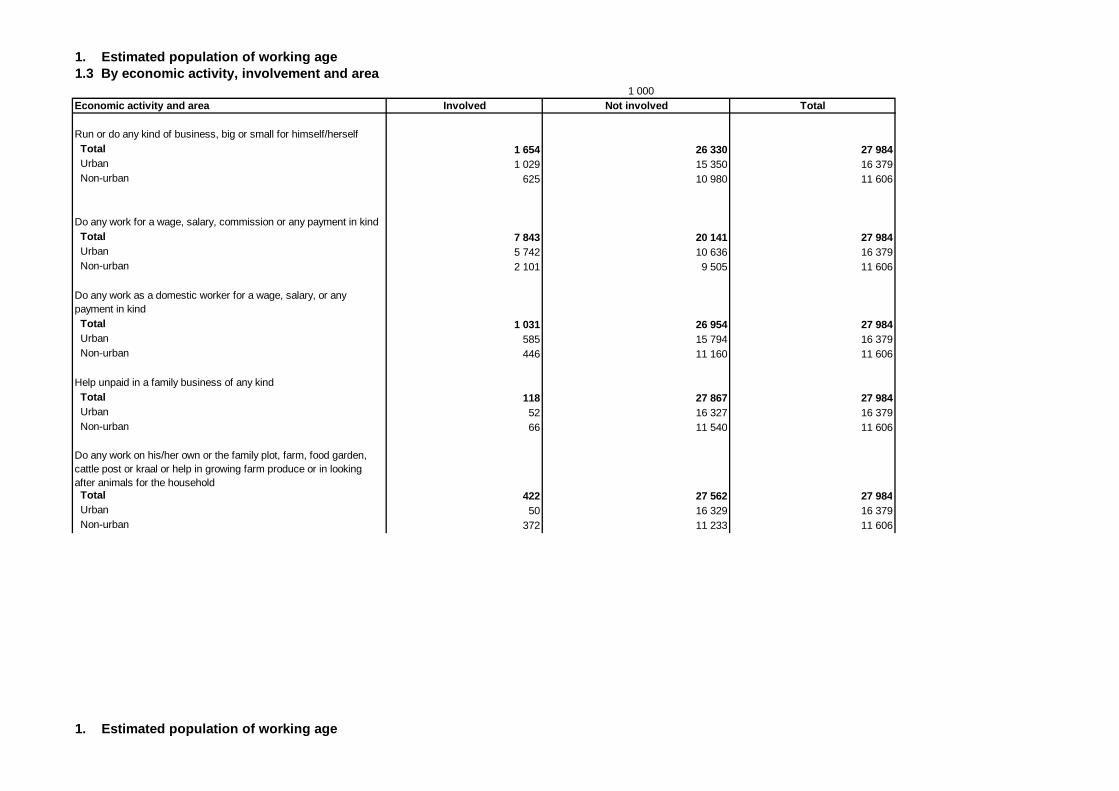
1. Estimated population of working age1.3 By economic activity, involvement and area
Economic activity and area Involved Not involved Total
Run or do any kind of business, big or small for himself/herself Total 1 654 26 330 27 984 Urban 1 029 15 350 16 379 Non-urban 625 10 980 11 606
Do any work for a wage, salary, commission or any payment in kind Total 7 843 20 141 27 984 Urban 5 742 10 636 16 379 Non-urban 2 101 9 505 11 606
Do any work as a domestic worker for a wage, salary, or any payment in kind Total 1 031 26 954 27 984 Urban 585 15 794 16 379 Non-urban 446 11 160 11 606
Help unpaid in a family business of any kind Total 118 27 867 27 984 Urban 52 16 327 16 379 Non-urban 66 11 540 11 606
Do any work on his/her own or the family plot, farm, food garden, cattle post or kraal or help in growing farm produce or in looking after animals for the household Total 422 27 562 27 984 Urban 50 16 329 16 379 Non-urban 372 11 233 11 606
1. Estimated population of working age
1 000
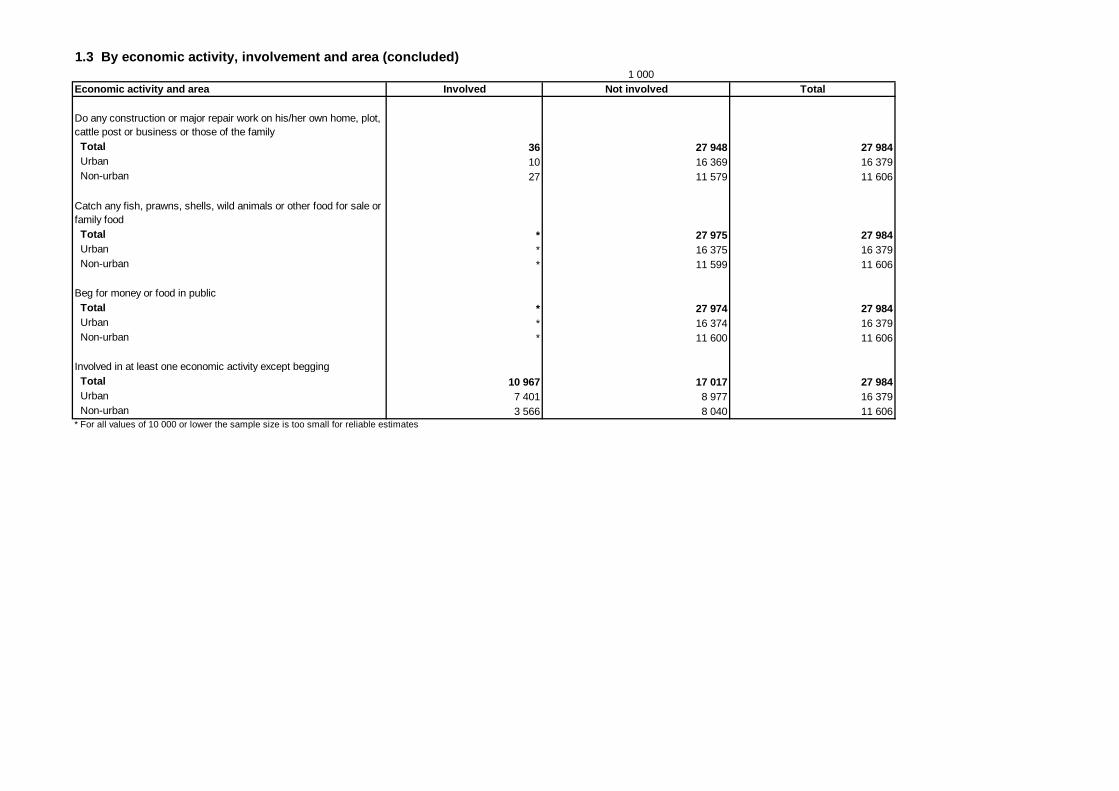
1.3 By economic activity, involvement and area (concluded)
Economic activity and area Involved Not involved Total
Do any construction or major repair work on his/her own home, plot, cattle post or business or those of the family Total 36 27 948 27 984 Urban 10 16 369 16 379 Non-urban 27 11 579 11 606
Catch any fish, prawns, shells, wild animals or other food for sale or family food Total * 27 975 27 984 Urban * 16 375 16 379 Non-urban * 11 599 11 606
Beg for money or food in public Total * 27 974 27 984 Urban * 16 374 16 379 Non-urban * 11 600 11 606
Involved in at least one economic activity except begging Total 10 967 17 017 27 984 Urban 7 401 8 977 16 379 Non-urban 3 566 8 040 11 606* For all values of 10 000 or lower the sample size is too small for reliable estimates
1 000
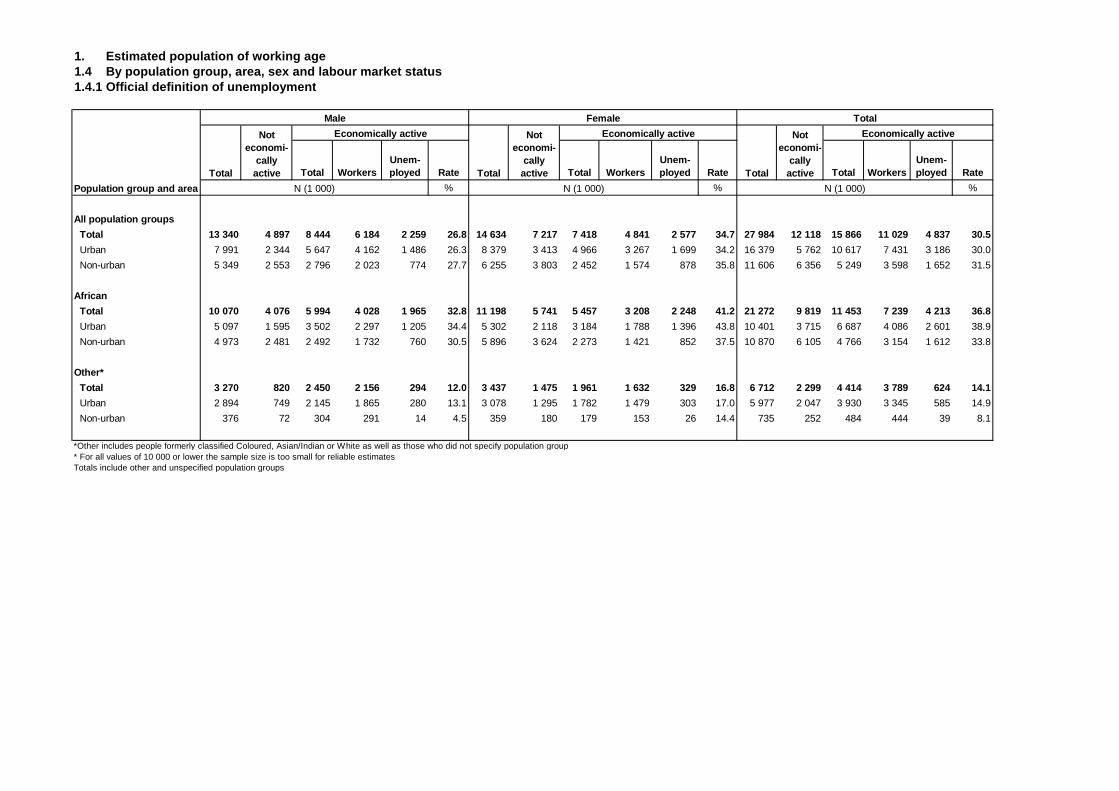
1. Estimated population of working age1.4 By population group, area, sex and labour market status 1.4.1 Official definition of unemployment
Total WorkersUnem-ployed Rate Total Workers
Unem-ployed Rate Total Workers
Unem-ployed Rate
% % %
All population groups
Total 13 340 4 897 8 444 6 184 2 259 26.8 14 634 7 217 7 418 4 841 2 577 34.7 27 984 12 118 15 866 11 029 4 837 30.5
Urban 7 991 2 344 5 647 4 162 1 486 26.3 8 379 3 413 4 966 3 267 1 699 34.2 16 379 5 762 10 617 7 431 3 186 30.0
Non-urban 5 349 2 553 2 796 2 023 774 27.7 6 255 3 803 2 452 1 574 878 35.8 11 606 6 356 5 249 3 598 1 652 31.5
African
Total 10 070 4 076 5 994 4 028 1 965 32.8 11 198 5 741 5 457 3 208 2 248 41.2 21 272 9 819 11 453 7 239 4 213 36.8
Urban 5 097 1 595 3 502 2 297 1 205 34.4 5 302 2 118 3 184 1 788 1 396 43.8 10 401 3 715 6 687 4 086 2 601 38.9
Non-urban 4 973 2 481 2 492 1 732 760 30.5 5 896 3 624 2 273 1 421 852 37.5 10 870 6 105 4 766 3 154 1 612 33.8
Other*
Total 3 270 820 2 450 2 156 294 12.0 3 437 1 475 1 961 1 632 329 16.8 6 712 2 299 4 414 3 789 624 14.1
Urban 2 894 749 2 145 1 865 280 13.1 3 078 1 295 1 782 1 479 303 17.0 5 977 2 047 3 930 3 345 585 14.9
Non-urban 376 72 304 291 14 4.5 359 180 179 153 26 14.4 735 252 484 444 39 8.1
*Other includes people formerly classified Coloured, Asian/Indian or White as well as those who did not specify population group* For all values of 10 000 or lower the sample size is too small for reliable estimatesTotals include other and unspecified population groups
N (1 000) N (1 000) N (1 000)Population group and area
Total
Not economi-
cally active
Economically active
Total
Not economi-
cally active
Economically active
Total
Not economi-
cally active
Economically active
Male Female Total
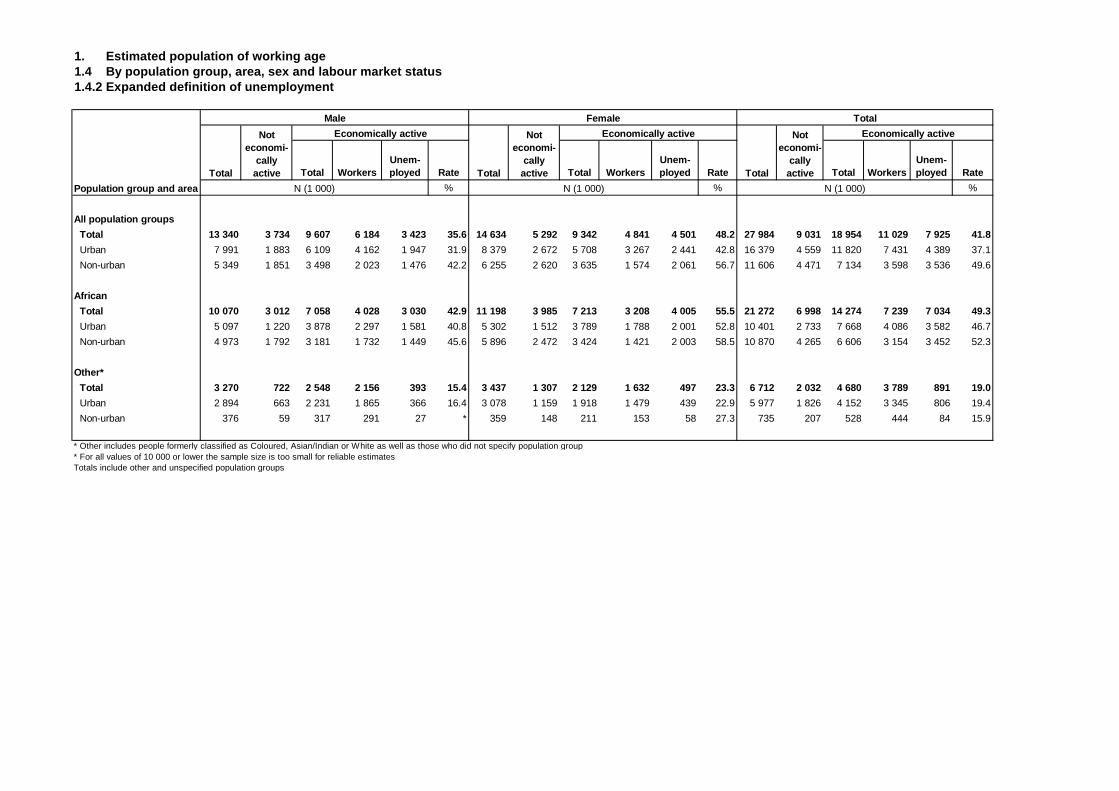
1. Estimated population of working age1.4 By population group, area, sex and labour market status 1.4.2 Expanded definition of unemployment
Total WorkersUnem-ployed Rate Total Workers
Unem-ployed Rate Total Workers
Unem-ployed Rate
% % %
All population groups
Total 13 340 3 734 9 607 6 184 3 423 35.6 14 634 5 292 9 342 4 841 4 501 48.2 27 984 9 031 18 954 11 029 7 925 41.8
Urban 7 991 1 883 6 109 4 162 1 947 31.9 8 379 2 672 5 708 3 267 2 441 42.8 16 379 4 559 11 820 7 431 4 389 37.1
Non-urban 5 349 1 851 3 498 2 023 1 476 42.2 6 255 2 620 3 635 1 574 2 061 56.7 11 606 4 471 7 134 3 598 3 536 49.6
African
Total 10 070 3 012 7 058 4 028 3 030 42.9 11 198 3 985 7 213 3 208 4 005 55.5 21 272 6 998 14 274 7 239 7 034 49.3
Urban 5 097 1 220 3 878 2 297 1 581 40.8 5 302 1 512 3 789 1 788 2 001 52.8 10 401 2 733 7 668 4 086 3 582 46.7
Non-urban 4 973 1 792 3 181 1 732 1 449 45.6 5 896 2 472 3 424 1 421 2 003 58.5 10 870 4 265 6 606 3 154 3 452 52.3
Other*
Total 3 270 722 2 548 2 156 393 15.4 3 437 1 307 2 129 1 632 497 23.3 6 712 2 032 4 680 3 789 891 19.0
Urban 2 894 663 2 231 1 865 366 16.4 3 078 1 159 1 918 1 479 439 22.9 5 977 1 826 4 152 3 345 806 19.4
Non-urban 376 59 317 291 27 * 359 148 211 153 58 27.3 735 207 528 444 84 15.9
* Other includes people formerly classified as Coloured, Asian/Indian or White as well as those who did not specify population group* For all values of 10 000 or lower the sample size is too small for reliable estimatesTotals include other and unspecified population groups
N (1 000)N (1 000)N (1 000)Population group and area
Economically active
Total
Not economi-
cally active
Economically active
Total
Not economi-
cally active
Economically active
Total
Not economi-
cally active
Male Female Total
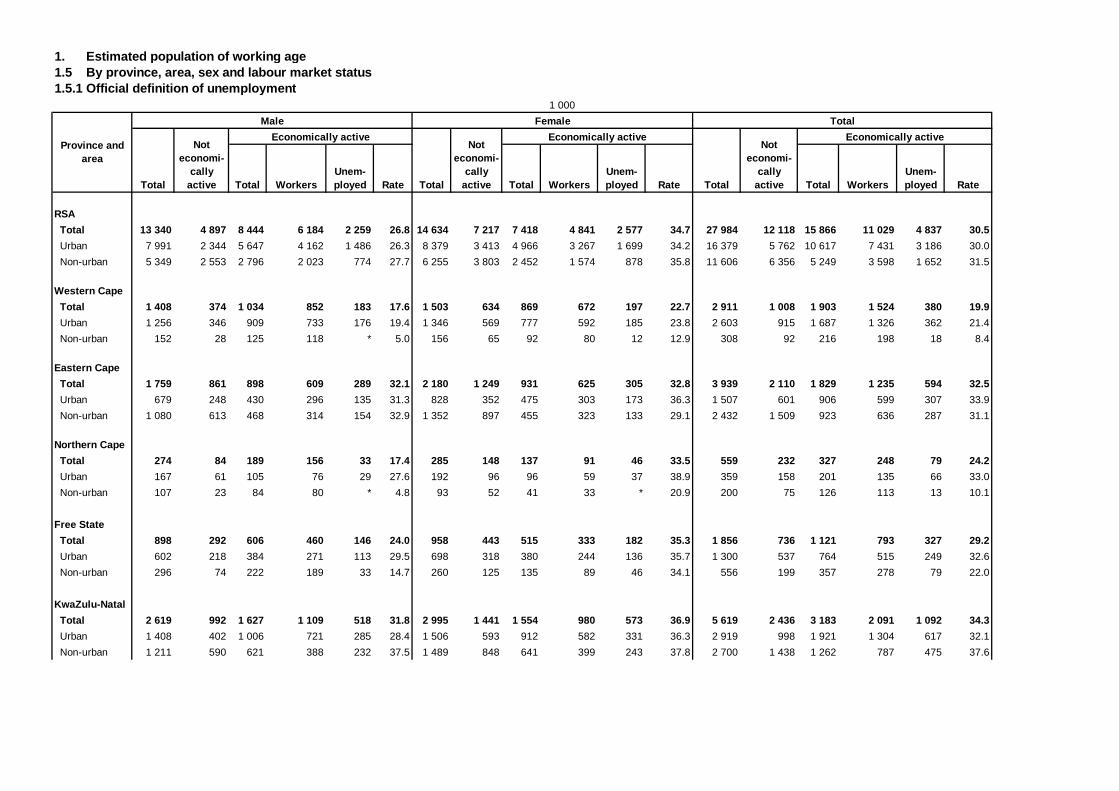
1. Estimated population of working age1.5 By province, area, sex and labour market status 1.5.1 Official definition of unemployment
RSA
Total 13 340 4 897 8 444 6 184 2 259 26.8 14 634 7 217 7 418 4 841 2 577 34.7 27 984 12 118 15 866 11 029 4 837 30.5
Urban 7 991 2 344 5 647 4 162 1 486 26.3 8 379 3 413 4 966 3 267 1 699 34.2 16 379 5 762 10 617 7 431 3 186 30.0
Non-urban 5 349 2 553 2 796 2 023 774 27.7 6 255 3 803 2 452 1 574 878 35.8 11 606 6 356 5 249 3 598 1 652 31.5
Western Cape
Total 1 408 374 1 034 852 183 17.6 1 503 634 869 672 197 22.7 2 911 1 008 1 903 1 524 380 19.9
Urban 1 256 346 909 733 176 19.4 1 346 569 777 592 185 23.8 2 603 915 1 687 1 326 362 21.4
Non-urban 152 28 125 118 * 5.0 156 65 92 80 12 12.9 308 92 216 198 18 8.4
Eastern Cape
Total 1 759 861 898 609 289 32.1 2 180 1 249 931 625 305 32.8 3 939 2 110 1 829 1 235 594 32.5
Urban 679 248 430 296 135 31.3 828 352 475 303 173 36.3 1 507 601 906 599 307 33.9
Non-urban 1 080 613 468 314 154 32.9 1 352 897 455 323 133 29.1 2 432 1 509 923 636 287 31.1
Northern Cape
Total 274 84 189 156 33 17.4 285 148 137 91 46 33.5 559 232 327 248 79 24.2
Urban 167 61 105 76 29 27.6 192 96 96 59 37 38.9 359 158 201 135 66 33.0
Non-urban 107 23 84 80 * 4.8 93 52 41 33 * 20.9 200 75 126 113 13 10.1
Free State
Total 898 292 606 460 146 24.0 958 443 515 333 182 35.3 1 856 736 1 121 793 327 29.2
Urban 602 218 384 271 113 29.5 698 318 380 244 136 35.7 1 300 537 764 515 249 32.6
Non-urban 296 74 222 189 33 14.7 260 125 135 89 46 34.1 556 199 357 278 79 22.0
KwaZulu-Natal
Total 2 619 992 1 627 1 109 518 31.8 2 995 1 441 1 554 980 573 36.9 5 619 2 436 3 183 2 091 1 092 34.3
Urban 1 408 402 1 006 721 285 28.4 1 506 593 912 582 331 36.3 2 919 998 1 921 1 304 617 32.1
Non-urban 1 211 590 621 388 232 37.5 1 489 848 641 399 243 37.8 2 700 1 438 1 262 787 475 37.6
Unem-ployed RateTotal Workers
Unem-ployed Rate
Economical ly active
Total
Not economi-
cal ly active
Economical ly active
Total WorkersUnem-ployed Rate Total Workers
1 000
Province and area
Male Female Total
Total
Not economi-
cal ly active
Economical ly active
Total
Not economi-
cal ly active
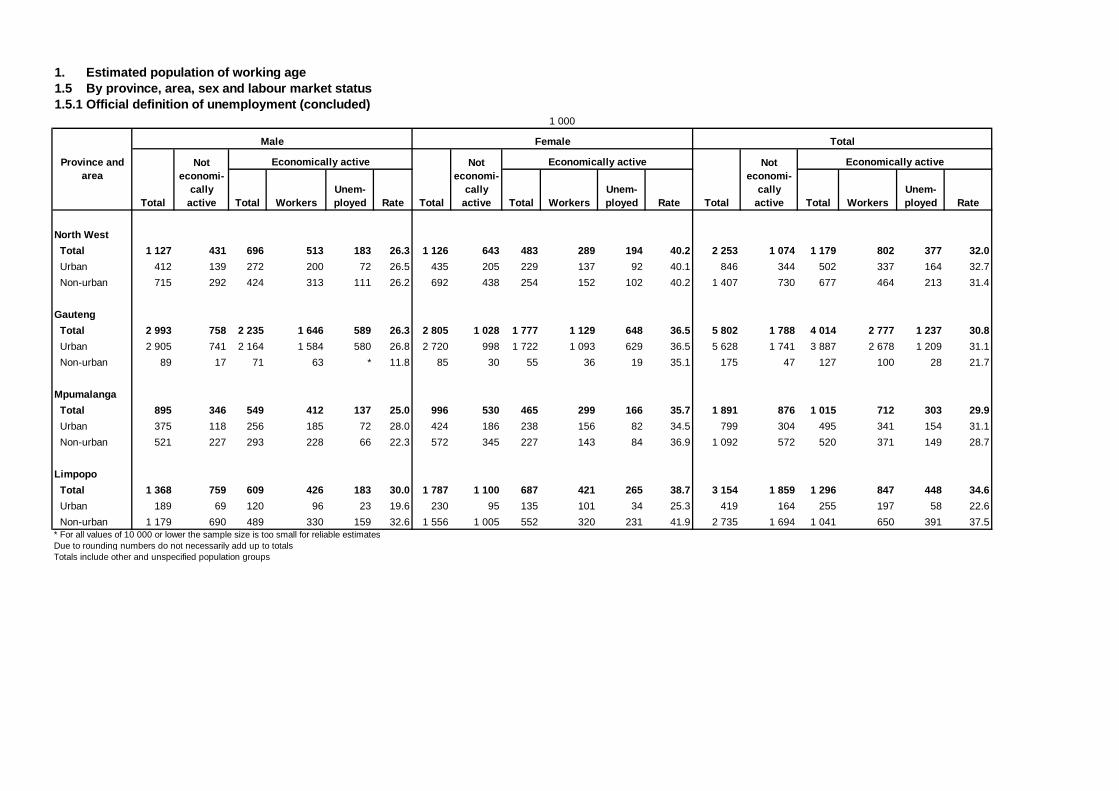
1. Estimated population of working age1.5 By province, area, sex and labour market status 1.5.1 Official definition of unemployment (concluded)
North West
Total 1 127 431 696 513 183 26.3 1 126 643 483 289 194 40.2 2 253 1 074 1 179 802 377 32.0
Urban 412 139 272 200 72 26.5 435 205 229 137 92 40.1 846 344 502 337 164 32.7
Non-urban 715 292 424 313 111 26.2 692 438 254 152 102 40.2 1 407 730 677 464 213 31.4
Gauteng
Total 2 993 758 2 235 1 646 589 26.3 2 805 1 028 1 777 1 129 648 36.5 5 802 1 788 4 014 2 777 1 237 30.8
Urban 2 905 741 2 164 1 584 580 26.8 2 720 998 1 722 1 093 629 36.5 5 628 1 741 3 887 2 678 1 209 31.1
Non-urban 89 17 71 63 * 11.8 85 30 55 36 19 35.1 175 47 127 100 28 21.7
Mpumalanga
Total 895 346 549 412 137 25.0 996 530 465 299 166 35.7 1 891 876 1 015 712 303 29.9
Urban 375 118 256 185 72 28.0 424 186 238 156 82 34.5 799 304 495 341 154 31.1
Non-urban 521 227 293 228 66 22.3 572 345 227 143 84 36.9 1 092 572 520 371 149 28.7
Limpopo
Total 1 368 759 609 426 183 30.0 1 787 1 100 687 421 265 38.7 3 154 1 859 1 296 847 448 34.6
Urban 189 69 120 96 23 19.6 230 95 135 101 34 25.3 419 164 255 197 58 22.6
Non-urban 1 179 690 489 330 159 32.6 1 556 1 005 552 320 231 41.9 2 735 1 694 1 041 650 391 37.5* For all values of 10 000 or lower the sample size is too small for reliable estimatesDue to rounding numbers do not necessarily add up to totalsTotals include other and unspecified population groups
Total WorkersUnem-ployed Rate
Not economi-
cal ly active
Economical ly active
Total WorkersUnem-ployed Rate Total Workers
Unem-ployed RateTotal
Not economi-
cal ly active
Economical ly active
Total
1 000
Province and area
Male Female Total
Total
Not economi-
cal ly active
Economical ly active
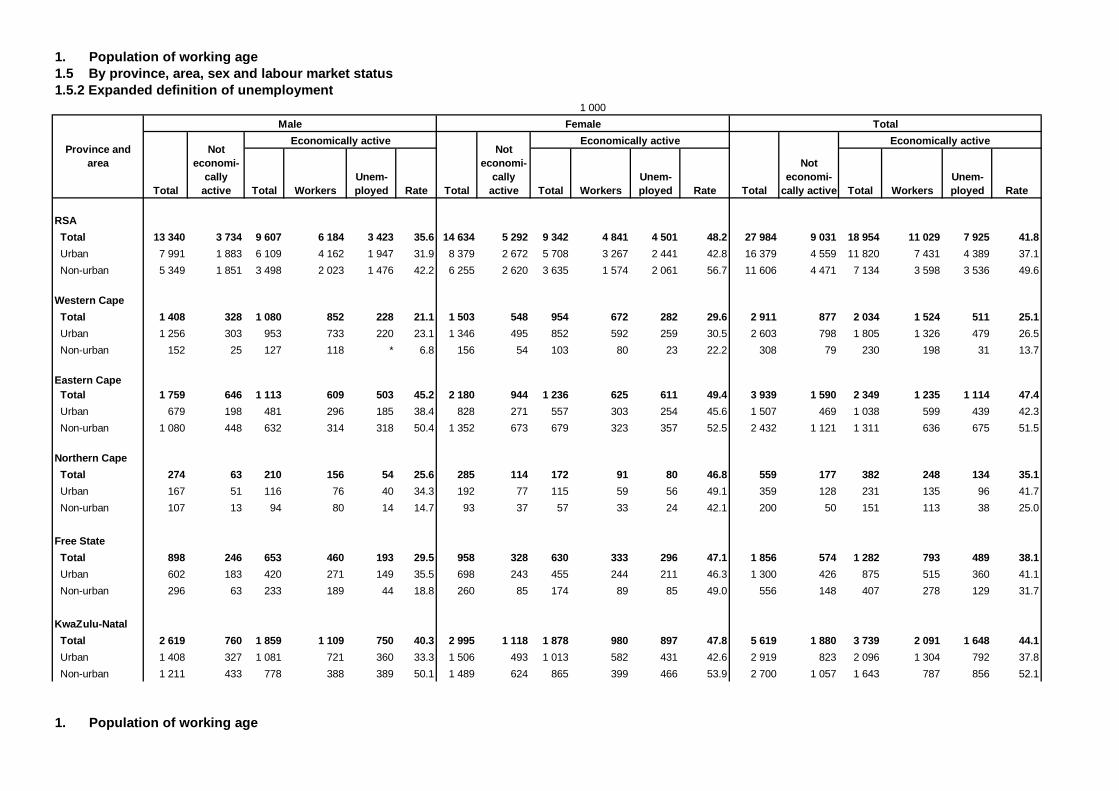
1. Population of working age1.5 By province, area, sex and labour market status 1.5.2 Expanded definition of unemployment
RSA
Total 13 340 3 734 9 607 6 184 3 423 35.6 14 634 5 292 9 342 4 841 4 501 48.2 27 984 9 031 18 954 11 029 7 925 41.8
Urban 7 991 1 883 6 109 4 162 1 947 31.9 8 379 2 672 5 708 3 267 2 441 42.8 16 379 4 559 11 820 7 431 4 389 37.1
Non-urban 5 349 1 851 3 498 2 023 1 476 42.2 6 255 2 620 3 635 1 574 2 061 56.7 11 606 4 471 7 134 3 598 3 536 49.6
Western Cape
Total 1 408 328 1 080 852 228 21.1 1 503 548 954 672 282 29.6 2 911 877 2 034 1 524 511 25.1
Urban 1 256 303 953 733 220 23.1 1 346 495 852 592 259 30.5 2 603 798 1 805 1 326 479 26.5
Non-urban 152 25 127 118 * 6.8 156 54 103 80 23 22.2 308 79 230 198 31 13.7
Eastern Cape Total 1 759 646 1 113 609 503 45.2 2 180 944 1 236 625 611 49.4 3 939 1 590 2 349 1 235 1 114 47.4
Urban 679 198 481 296 185 38.4 828 271 557 303 254 45.6 1 507 469 1 038 599 439 42.3
Non-urban 1 080 448 632 314 318 50.4 1 352 673 679 323 357 52.5 2 432 1 121 1 311 636 675 51.5
Northern Cape
Total 274 63 210 156 54 25.6 285 114 172 91 80 46.8 559 177 382 248 134 35.1
Urban 167 51 116 76 40 34.3 192 77 115 59 56 49.1 359 128 231 135 96 41.7
Non-urban 107 13 94 80 14 14.7 93 37 57 33 24 42.1 200 50 151 113 38 25.0
Free State
Total 898 246 653 460 193 29.5 958 328 630 333 296 47.1 1 856 574 1 282 793 489 38.1
Urban 602 183 420 271 149 35.5 698 243 455 244 211 46.3 1 300 426 875 515 360 41.1
Non-urban 296 63 233 189 44 18.8 260 85 174 89 85 49.0 556 148 407 278 129 31.7
KwaZulu-Natal
Total 2 619 760 1 859 1 109 750 40.3 2 995 1 118 1 878 980 897 47.8 5 619 1 880 3 739 2 091 1 648 44.1
Urban 1 408 327 1 081 721 360 33.3 1 506 493 1 013 582 431 42.6 2 919 823 2 096 1 304 792 37.8
Non-urban 1 211 433 778 388 389 50.1 1 489 624 865 399 466 53.9 2 700 1 057 1 643 787 856 52.1
1. Population of working age
Unem-ployed RateTotal Workers
Unem-ployed Rate
Economically active
Total
Not economi-
cally active
Economically active
Total WorkersUnem-ployed Rate Total Workers
1 000
Province and area
Male Female Total
Total
Not economi-
cally active
Economically active
Total
Not economi-
cally active
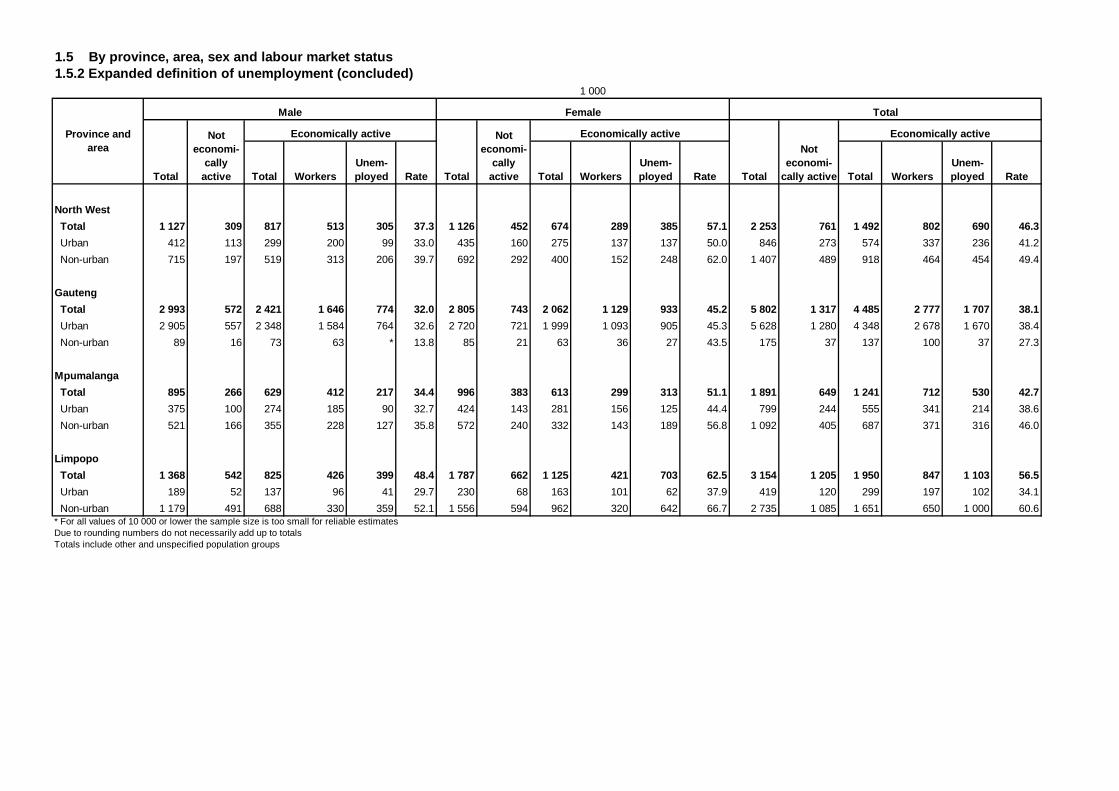
1.5 By province, area, sex and labour market status 1.5.2 Expanded definition of unemployment (concluded)
North West
Total 1 127 309 817 513 305 37.3 1 126 452 674 289 385 57.1 2 253 761 1 492 802 690 46.3
Urban 412 113 299 200 99 33.0 435 160 275 137 137 50.0 846 273 574 337 236 41.2
Non-urban 715 197 519 313 206 39.7 692 292 400 152 248 62.0 1 407 489 918 464 454 49.4
Gauteng
Total 2 993 572 2 421 1 646 774 32.0 2 805 743 2 062 1 129 933 45.2 5 802 1 317 4 485 2 777 1 707 38.1
Urban 2 905 557 2 348 1 584 764 32.6 2 720 721 1 999 1 093 905 45.3 5 628 1 280 4 348 2 678 1 670 38.4
Non-urban 89 16 73 63 * 13.8 85 21 63 36 27 43.5 175 37 137 100 37 27.3
Mpumalanga
Total 895 266 629 412 217 34.4 996 383 613 299 313 51.1 1 891 649 1 241 712 530 42.7
Urban 375 100 274 185 90 32.7 424 143 281 156 125 44.4 799 244 555 341 214 38.6
Non-urban 521 166 355 228 127 35.8 572 240 332 143 189 56.8 1 092 405 687 371 316 46.0
Limpopo
Total 1 368 542 825 426 399 48.4 1 787 662 1 125 421 703 62.5 3 154 1 205 1 950 847 1 103 56.5
Urban 189 52 137 96 41 29.7 230 68 163 101 62 37.9 419 120 299 197 102 34.1
Non-urban 1 179 491 688 330 359 52.1 1 556 594 962 320 642 66.7 2 735 1 085 1 651 650 1 000 60.6* For all values of 10 000 or lower the sample size is too small for reliable estimatesDue to rounding numbers do not necessarily add up to totalsTotals include other and unspecified population groups
Total WorkersUnem-ployed Rate
Not economi-
cally active
Economically active
Total WorkersUnem-ployed Rate Total Workers
Unem-ployed RateTotal
Not economi-
cally active
Economically active
Total
1 000
Province and area
Male Female Total
Total
Not economi-
cally active
Economically active
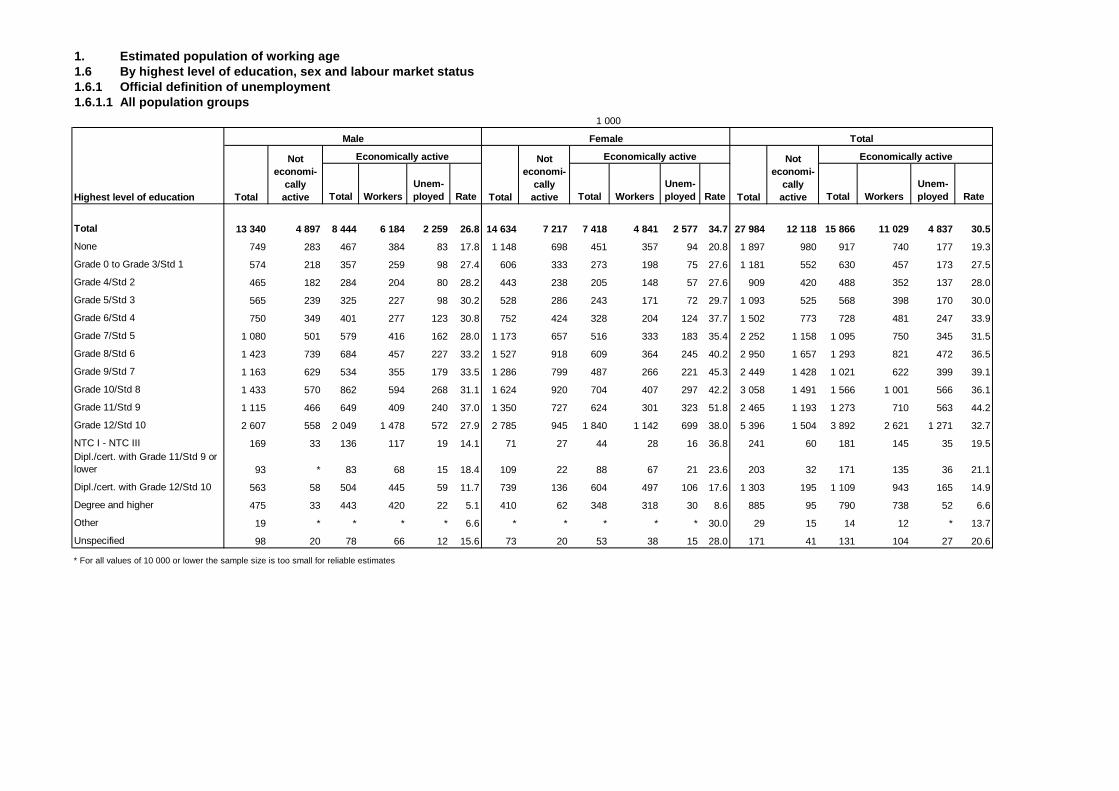
Total WorkersUnem-ployed Rate Total Workers
Unem-ployed Rate Total Workers
Unem-ployed Rate
Total 13 340 4 897 8 444 6 184 2 259 26.8 14 634 7 217 7 418 4 841 2 577 34.7 27 984 12 118 15 866 11 029 4 837 30.5
None 749 283 467 384 83 17.8 1 148 698 451 357 94 20.8 1 897 980 917 740 177 19.3
Grade 0 to Grade 3/Std 1 574 218 357 259 98 27.4 606 333 273 198 75 27.6 1 181 552 630 457 173 27.5
Grade 4/Std 2 465 182 284 204 80 28.2 443 238 205 148 57 27.6 909 420 488 352 137 28.0
Grade 5/Std 3 565 239 325 227 98 30.2 528 286 243 171 72 29.7 1 093 525 568 398 170 30.0
Grade 6/Std 4 750 349 401 277 123 30.8 752 424 328 204 124 37.7 1 502 773 728 481 247 33.9
Grade 7/Std 5 1 080 501 579 416 162 28.0 1 173 657 516 333 183 35.4 2 252 1 158 1 095 750 345 31.5
Grade 8/Std 6 1 423 739 684 457 227 33.2 1 527 918 609 364 245 40.2 2 950 1 657 1 293 821 472 36.5
Grade 9/Std 7 1 163 629 534 355 179 33.5 1 286 799 487 266 221 45.3 2 449 1 428 1 021 622 399 39.1
Grade 10/Std 8 1 433 570 862 594 268 31.1 1 624 920 704 407 297 42.2 3 058 1 491 1 566 1 001 566 36.1
Grade 11/Std 9 1 115 466 649 409 240 37.0 1 350 727 624 301 323 51.8 2 465 1 193 1 273 710 563 44.2
Grade 12/Std 10 2 607 558 2 049 1 478 572 27.9 2 785 945 1 840 1 142 699 38.0 5 396 1 504 3 892 2 621 1 271 32.7
NTC I - NTC III 169 33 136 117 19 14.1 71 27 44 28 16 36.8 241 60 181 145 35 19.5Dipl./cert. with Grade 11/Std 9 or lower 93 * 83 68 15 18.4 109 22 88 67 21 23.6 203 32 171 135 36 21.1
Dipl./cert. with Grade 12/Std 10 563 58 504 445 59 11.7 739 136 604 497 106 17.6 1 303 195 1 109 943 165 14.9
Degree and higher 475 33 443 420 22 5.1 410 62 348 318 30 8.6 885 95 790 738 52 6.6
Other 19 * * * * 6.6 * * * * * 30.0 29 15 14 12 * 13.7
Unspecified 98 20 78 66 12 15.6 73 20 53 38 15 28.0 171 41 131 104 27 20.6
1. Estimated population of working age1.6 By highest level of education, sex and labour market status 1.6.1 Official definition of unemployment1.6.1.1 All population groups
Economically active
1 000
Highest level of education
Male Female Total
Total
Not economi-
cally active
Economically active
Total
* For all values of 10 000 or lower the sample size is too small for reliable estimates
Economically active
Total
Not economi-
cally active
Not economi-
cally active
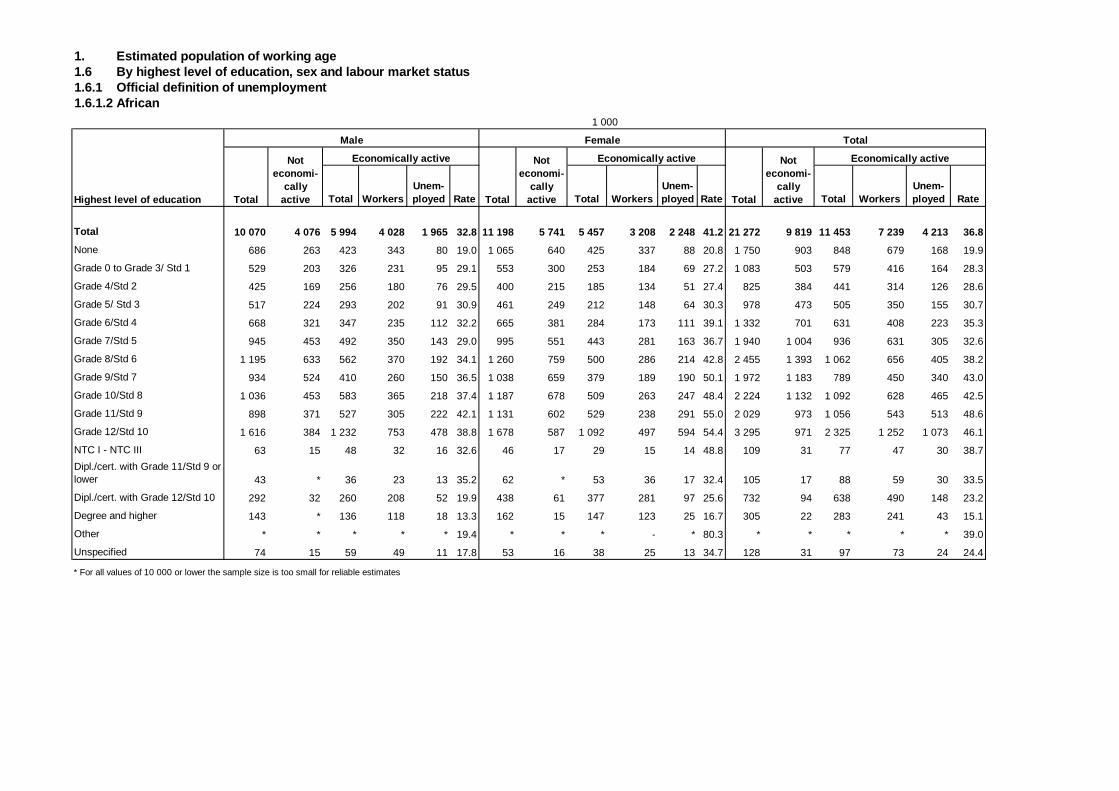
Total WorkersUnem-ployed Rate Total Workers
Unem-ployed Rate Total Workers
Unem-ployed Rate
Total 10 070 4 076 5 994 4 028 1 965 32.8 11 198 5 741 5 457 3 208 2 248 41.2 21 272 9 819 11 453 7 239 4 213 36.8
None 686 263 423 343 80 19.0 1 065 640 425 337 88 20.8 1 750 903 848 679 168 19.9
Grade 0 to Grade 3/ Std 1 529 203 326 231 95 29.1 553 300 253 184 69 27.2 1 083 503 579 416 164 28.3
Grade 4/Std 2 425 169 256 180 76 29.5 400 215 185 134 51 27.4 825 384 441 314 126 28.6
Grade 5/ Std 3 517 224 293 202 91 30.9 461 249 212 148 64 30.3 978 473 505 350 155 30.7
Grade 6/Std 4 668 321 347 235 112 32.2 665 381 284 173 111 39.1 1 332 701 631 408 223 35.3
Grade 7/Std 5 945 453 492 350 143 29.0 995 551 443 281 163 36.7 1 940 1 004 936 631 305 32.6
Grade 8/Std 6 1 195 633 562 370 192 34.1 1 260 759 500 286 214 42.8 2 455 1 393 1 062 656 405 38.2
Grade 9/Std 7 934 524 410 260 150 36.5 1 038 659 379 189 190 50.1 1 972 1 183 789 450 340 43.0
Grade 10/Std 8 1 036 453 583 365 218 37.4 1 187 678 509 263 247 48.4 2 224 1 132 1 092 628 465 42.5
Grade 11/Std 9 898 371 527 305 222 42.1 1 131 602 529 238 291 55.0 2 029 973 1 056 543 513 48.6
Grade 12/Std 10 1 616 384 1 232 753 478 38.8 1 678 587 1 092 497 594 54.4 3 295 971 2 325 1 252 1 073 46.1
NTC I - NTC III 63 15 48 32 16 32.6 46 17 29 15 14 48.8 109 31 77 47 30 38.7
Dipl./cert. with Grade 11/Std 9 or lower 43 * 36 23 13 35.2 62 * 53 36 17 32.4 105 17 88 59 30 33.5
Dipl./cert. with Grade 12/Std 10 292 32 260 208 52 19.9 438 61 377 281 97 25.6 732 94 638 490 148 23.2
Degree and higher 143 * 136 118 18 13.3 162 15 147 123 25 16.7 305 22 283 241 43 15.1
Other * * * * * 19.4 * * * - * 80.3 * * * * * 39.0
Unspecified 74 15 59 49 11 17.8 53 16 38 25 13 34.7 128 31 97 73 24 24.4
1. Estimated population of working age1.6 By highest level of education, sex and labour market status 1.6.1 Official definition of unemployment1.6.1.2 African
Economical ly active
1 000
Highest level of education
Male Female Total
Total
Not economi-
cal ly active
Economical ly active
Total
* For all values of 10 000 or lower the sample size is too small for reliable estimates
Economical ly active
Total
Not economi-
cal ly active
Not economi-
cal ly active

1. Estimated population of working age1.6 By highest level of education, sex and labour market status 1.6.1 Official definition of unemployment1.6.1.3 Other¹
Total WorkersUnem-ployed Rate Total Workers
Unem-ployed Rate Total Workers
Unem-ployed Rate
Total 3 270 820 2 450 2 156 294 12.0 3 437 1 475 1 961 1 632 329 16.8 6 712 2 299 4 414 3 789 624 14.1
None 64 20 44 41 * 6.5 83 58 26 20 * 21.8 147 78 69 61 * 12.2
Grade 0 to Grade 3/ Std 1 45 15 30 28 * 8.8 53 33 20 13 * 33.5 99 48 50 41 * 18.7
Grade 4/Std 2 40 12 28 23 * 15.8 43 23 20 14 * 30.2 84 36 48 37 * 21.8
Grade 5/ Std 3 48 16 32 25 * 23.8 67 36 31 23 * 25.4 115 52 63 48 16 24.6
Grade 6/Std 4 82 29 53 42 12 21.5 87 44 44 31 12 28.4 169 72 97 73 24 24.6
Grade 7/Std 5 135 48 86 67 20 22.7 178 105 72 52 20 27.7 312 154 159 119 40 25.0
Grade 8/Std 6 228 105 122 87 36 29.2 267 158 109 78 31 28.4 495 264 231 165 67 28.8
Grade 9/Std 7 229 105 124 95 29 23.3 248 140 108 77 31 28.5 477 246 232 172 60 25.7
Grade 10/Std 8 396 117 279 229 50 18.0 437 242 195 145 51 25.9 833 359 474 373 101 21.3
Grade 11/Std 9 217 95 121 104 18 14.6 219 124 95 63 32 33.9 436 220 216 166 50 23.1
Grade 12/Std 10 991 173 818 724 93 11.4 1 107 359 749 644 104 13.9 2 101 533 1 567 1 369 198 12.7
NTC I - NTC III 106 18 88 84 * 4.0 25 11 14 13 * 12.8 132 29 104 98 * 5.2
Dipl./cert. with Grade 11/Std 9 or lower 51 * 47 45 * 5.8 47 12 35 32 * 10.4 98 15 83 76 * 7.8
Dipl./cert. with Grade 12/Std 10 270 26 244 237 * 3.1 301 75 226 217 * 4.3 572 101 471 453 17 3.6
Degree and higher 332 26 307 302 * 1.4 248 47 200 195 * 2.6 580 73 507 498 * 1.9
Other 13 * * * - - * * * * - - 18 * * * - -
Unspecified 24 * 19 17 * 8.8 20 * 15 13 * 10.8 44 * 34 30 * 9.7
* For all values of 10 000 or lower the sample size is too small for reliable estimates
¹ Other includes people formerly classified as Coloured, Asian/Indian or White as well as those who did not specify population group
1 000
Highest level of education
Male Female Total
Total
Not economi-
cal ly active
Economical ly active
Total
Not economi-
cal ly active
Economical ly active
Total
Not economi-
cal ly active
Economical ly active
1. Estimated population of working age1.6 By highest level of education, sex and labour market status 1.6.2 Expanded definition of unemployment1.6.2.1 All population groups
Total WorkersUnem-ployed Rate Total Workers
Unem-ployed Rate Total Workers
Unem-ployed Rate
Total 13 340 3 734 9 607 6 184 3 423 35.6 14 634 5 292 9 342 4 841 4 501 48.2 27 984 9 031 18 954 11 029 7 925 41.8
None 749 210 539 384 155 28.8 1 148 549 599 357 243 40.5 1 897 759 1 138 740 398 35.0
Grade 0 to Grade 3/ Std 1 574 140 434 259 175 40.3 606 236 370 198 173 46.6 1 181 377 804 457 348 43.2
Grade 4/Std 2 465 120 345 204 141 41.0 443 162 281 148 133 47.3 909 283 626 352 274 43.8
Grade 5/Std 3 565 179 386 227 159 41.2 528 207 322 171 151 47.0 1 093 385 708 398 310 43.8
Grade 6/Std 4 750 264 486 277 208 42.9 752 305 447 204 243 54.3 1 502 569 932 481 451 48.4
Grade 7/Std 5 1 080 400 680 416 263 38.7 1 173 474 698 333 365 52.3 2 252 874 1 378 750 629 45.6
Grade 8/Std 6 1 423 617 806 457 349 43.3 1 527 711 816 364 452 55.4 2 950 1 328 1 622 821 801 49.4
Grade 9/Std 7 1 163 517 646 355 291 45.0 1 286 631 655 266 389 59.4 2 449 1 148 1 301 622 680 52.2
Grade 10/Std 8 1 433 458 975 594 381 39.1 1 624 709 915 407 508 55.5 3 058 1 168 1 890 1 001 889 47.0
Grade 11/Std 9 1 115 364 751 409 342 45.5 1 350 502 848 301 547 64.5 2 465 866 1 599 710 889 55.6
Grade 12/Std 10 2 607 339 2 268 1 478 790 34.8 2 785 595 2 190 1 142 1 048 47.9 5 396 936 4 461 2 621 1 840 41.2
NTC I - NTC III 169 29 140 117 23 16.4 71 22 49 28 21 43.7 241 51 190 145 44 23.4
Dipl./cert. with Grade 11/Std 9 or lower 93 * 87 68 19 21.9 109 15 94 67 27 28.5 203 22 181 135 46 25.4
Dipl./cert. with Grade 12/Std 10 563 40 523 445 78 14.9 739 96 644 497 146 22.7 1 303 136 1 167 943 224 19.2
Degree and higher 475 27 448 420 28 6.2 410 57 353 318 35 9.8 885 84 801 738 63 7.8
Other 19 * 11 * * 15.3 * * * * * 34.0 29 13 15 12 * 20.8
Unspecified 98 15 83 66 18 21.0 73 16 57 38 19 33.5 171 31 140 104 37 26.1
* For all values of 10 000 or lower the sample size is too small for reliable estimates
1 000
Highest level of education
Male Female Total
Total
Not economi-
cal ly active
Economical ly active
Total
Not economi-
cal ly active
Economical ly active
Total
Not economi-
cal ly active
Economical ly active

1. Estimated population of working age1.6 By highest level of education, sex and labour market status 1.6.2 Expanded definition of unemployment1.6.2.2 African
Total WorkersUnem-ployed Rate Total Workers
Unem-ployed Rate Total Workers
Unem-ployed Rate
Total 10 070 3 012 7 058 4 028 3 030 42.9 11 198 3 985 7 213 3 208 4 005 55.5 21 272 6 998 14 274 7 239 7 034 49.3
None 686 192 493 343 151 30.5 1 065 498 567 337 230 40.6 1 750 690 1 060 679 381 35.9
Grade 0 to Grade 3/ Std 1 529 128 401 231 170 42.3 553 209 345 184 160 46.6 1 083 337 746 416 330 44.3
Grade 4/Std 2 425 111 314 180 134 42.7 400 142 258 134 124 48.0 825 252 573 314 258 45.1
Grade 5/Std 3 517 165 352 202 150 42.5 461 176 285 148 138 48.3 978 341 637 350 287 45.1
Grade 6/Std 4 668 243 425 235 190 44.6 665 268 397 173 224 56.5 1 332 510 822 408 414 50.4
Grade 7/Std 5 945 360 585 350 235 40.2 995 388 607 281 326 53.7 1 940 748 1 192 631 561 47.1
Grade 8/Std 6 1 195 523 672 370 302 44.9 1 260 573 687 286 401 58.3 2 455 1 096 1 359 656 703 51.7
Grade 9/Std 7 934 425 508 260 248 48.8 1 038 506 532 189 343 64.5 1 972 931 1 041 450 591 56.8
Grade 10/Std 8 1 036 355 681 365 316 46.4 1 187 488 700 263 437 62.5 2 224 843 1 381 628 753 54.6
Grade 11/Std 9 898 278 621 305 315 50.8 1 131 394 737 238 499 67.7 2 029 672 1 357 543 814 60.0
Grade 12/Std 10 1 616 181 1 435 753 681 47.5 1 678 271 1 407 497 910 64.7 3 295 452 2 843 1 252 1 591 56.0
NTC I - NTC III 63 12 51 32 19 36.8 46 12 33 15 19 55.4 109 24 85 47 37 44.2Dipl./cert. with Grade 11/Std 9 or lower 43 * 39 23 16 41.4 62 * 57 36 22 37.8 105 * 97 59 38 39.3
Dipl./cert. with Grade 12/Std 10 292 17 275 208 67 24.3 438 30 408 281 127 31.2 732 48 684 490 194 28.4
Degree and higher 143 * 139 118 21 15.3 162 12 150 123 27 18.2 305 16 289 241 49 16.8
Other * * * * * 19.4 * * * - * 83.0 * * * * * 42.0
Unspecified 74 12 62 49 14 21.9 53 12 42 25 17 41.1 128 24 104 73 31 29.6
* For all values of 10 000 or lower the sample size is too small for reliable estimates
1 000
Highest level of education
Male Female Total
Total
Not economi-
cally active
Economically active
Total
Not economi-
cally active
Economically active
Total
Not economi-
cally active
Economically active
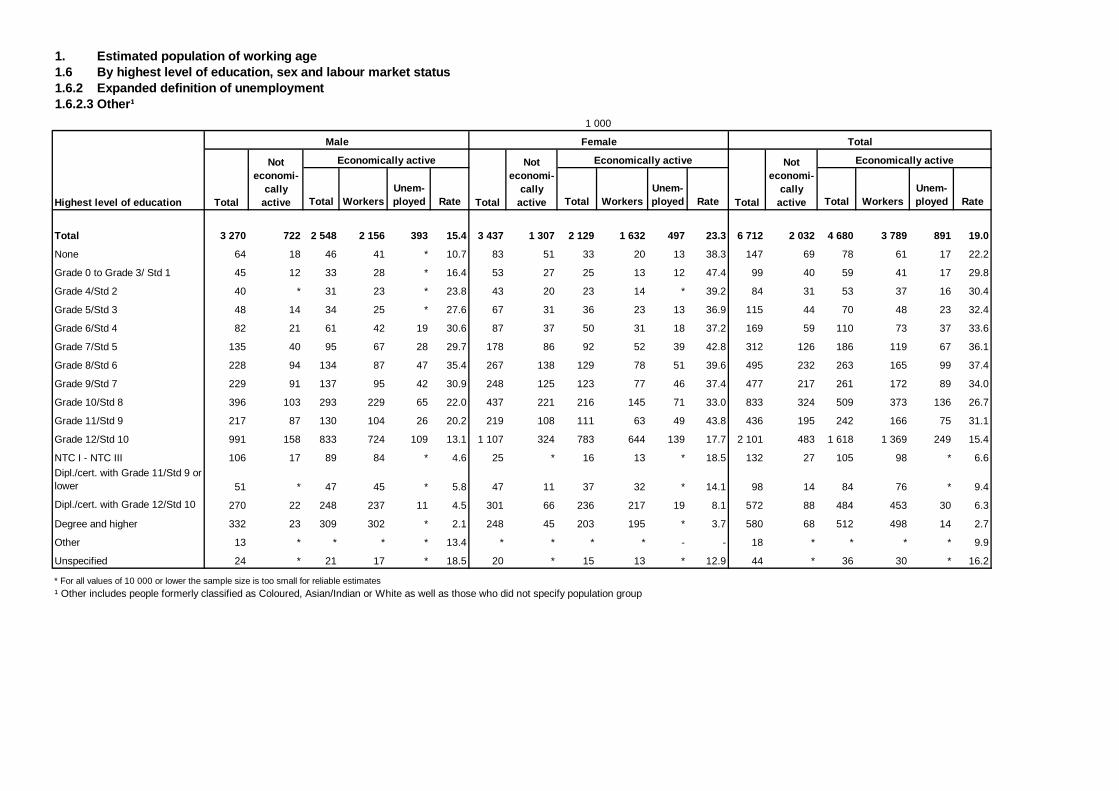
1. Estimated population of working age1.6 By highest level of education, sex and labour market status 1.6.2 Expanded definition of unemployment1.6.2.3 Other¹
Total WorkersUnem-ployed Rate Total Workers
Unem-ployed Rate Total Workers
Unem-ployed Rate
Total 3 270 722 2 548 2 156 393 15.4 3 437 1 307 2 129 1 632 497 23.3 6 712 2 032 4 680 3 789 891 19.0
None 64 18 46 41 * 10.7 83 51 33 20 13 38.3 147 69 78 61 17 22.2
Grade 0 to Grade 3/ Std 1 45 12 33 28 * 16.4 53 27 25 13 12 47.4 99 40 59 41 17 29.8
Grade 4/Std 2 40 * 31 23 * 23.8 43 20 23 14 * 39.2 84 31 53 37 16 30.4
Grade 5/Std 3 48 14 34 25 * 27.6 67 31 36 23 13 36.9 115 44 70 48 23 32.4
Grade 6/Std 4 82 21 61 42 19 30.6 87 37 50 31 18 37.2 169 59 110 73 37 33.6
Grade 7/Std 5 135 40 95 67 28 29.7 178 86 92 52 39 42.8 312 126 186 119 67 36.1
Grade 8/Std 6 228 94 134 87 47 35.4 267 138 129 78 51 39.6 495 232 263 165 99 37.4
Grade 9/Std 7 229 91 137 95 42 30.9 248 125 123 77 46 37.4 477 217 261 172 89 34.0
Grade 10/Std 8 396 103 293 229 65 22.0 437 221 216 145 71 33.0 833 324 509 373 136 26.7
Grade 11/Std 9 217 87 130 104 26 20.2 219 108 111 63 49 43.8 436 195 242 166 75 31.1
Grade 12/Std 10 991 158 833 724 109 13.1 1 107 324 783 644 139 17.7 2 101 483 1 618 1 369 249 15.4
NTC I - NTC III 106 17 89 84 * 4.6 25 * 16 13 * 18.5 132 27 105 98 * 6.6
Dipl./cert. with Grade 11/Std 9 or lower 51 * 47 45 * 5.8 47 11 37 32 * 14.1 98 14 84 76 * 9.4
Dipl./cert. with Grade 12/Std 10 270 22 248 237 11 4.5 301 66 236 217 19 8.1 572 88 484 453 30 6.3
Degree and higher 332 23 309 302 * 2.1 248 45 203 195 * 3.7 580 68 512 498 14 2.7
Other 13 * * * * 13.4 * * * * - - 18 * * * * 9.9
Unspecified 24 * 21 17 * 18.5 20 * 15 13 * 12.9 44 * 36 30 * 16.2
* For all values of 10 000 or lower the sample size is too small for reliable estimates
1 000
Highest level of education
Male Female Total
Total
Not economi-
cal ly active
Economical ly active
Total
Not economi-
cal ly active
¹ Other includes people formerly classified as Coloured, Asian/Indian or White as well as those who did not specify population group
Economical ly active
Total
Not economi-
cal ly active
Economical ly active
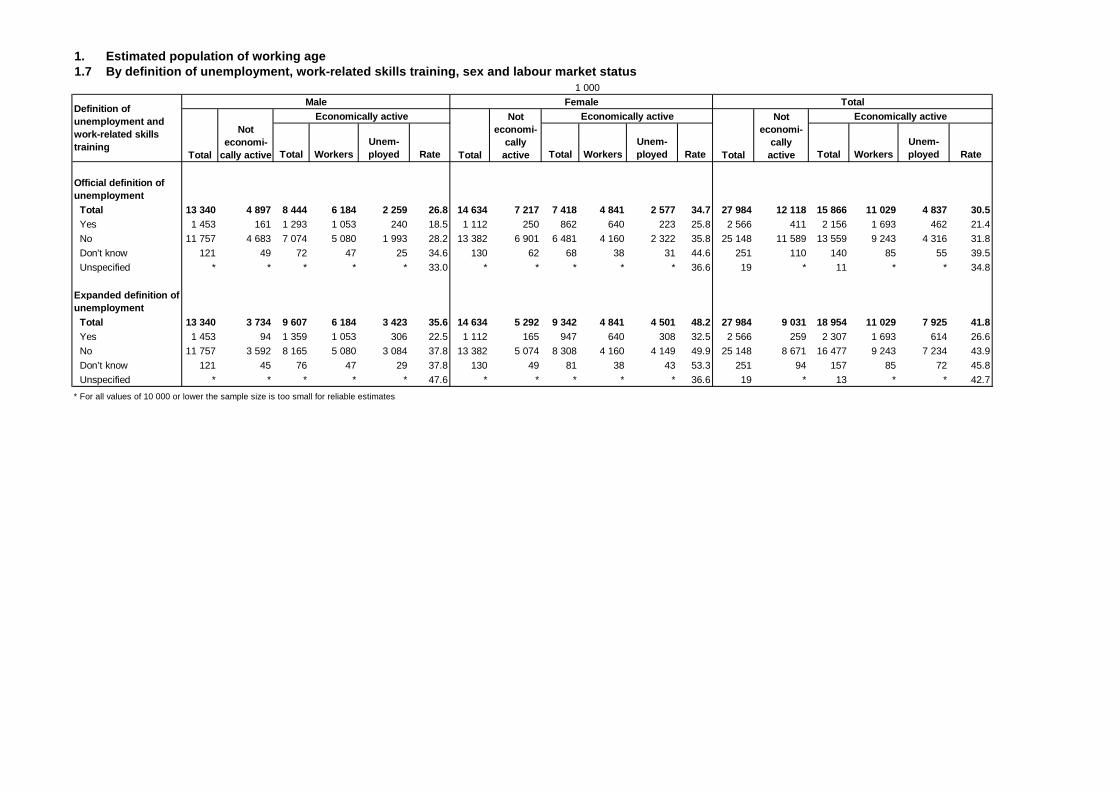
1. Estimated population of working age1.7 By definition of unemployment, work-related skills training, sex and labour market status
Total WorkersUnem-ployed Rate Total Workers
Unem-ployed Rate Total Workers
Unem-ployed Rate
Official definition of unemployment Total 13 340 4 897 8 444 6 184 2 259 26.8 14 634 7 217 7 418 4 841 2 577 34.7 27 984 12 118 15 866 11 029 4 837 30.5 Yes 1 453 161 1 293 1 053 240 18.5 1 112 250 862 640 223 25.8 2 566 411 2 156 1 693 462 21.4
No 11 757 4 683 7 074 5 080 1 993 28.2 13 382 6 901 6 481 4 160 2 322 35.8 25 148 11 589 13 559 9 243 4 316 31.8
Don't know 121 49 72 47 25 34.6 130 62 68 38 31 44.6 251 110 140 85 55 39.5
Unspecified * * * * * 33.0 * * * * * 36.6 19 * 11 * * 34.8
Expanded definition of unemployment Total 13 340 3 734 9 607 6 184 3 423 35.6 14 634 5 292 9 342 4 841 4 501 48.2 27 984 9 031 18 954 11 029 7 925 41.8 Yes 1 453 94 1 359 1 053 306 22.5 1 112 165 947 640 308 32.5 2 566 259 2 307 1 693 614 26.6
No 11 757 3 592 8 165 5 080 3 084 37.8 13 382 5 074 8 308 4 160 4 149 49.9 25 148 8 671 16 477 9 243 7 234 43.9
Don’t know 121 45 76 47 29 37.8 130 49 81 38 43 53.3 251 94 157 85 72 45.8
Unspecified * * * * * 47.6 * * * * * 36.6 19 * 13 * * 42.7
* For all values of 10 000 or lower the sample size is too small for reliable estimates
Definition of unemployment and work-related skills training
Male Female Total
Total
Not economi-
cally active
Economically active
Total
Not economi-
cally active
1 000
Economically active
Total
Not economi-
cally active
Economically active
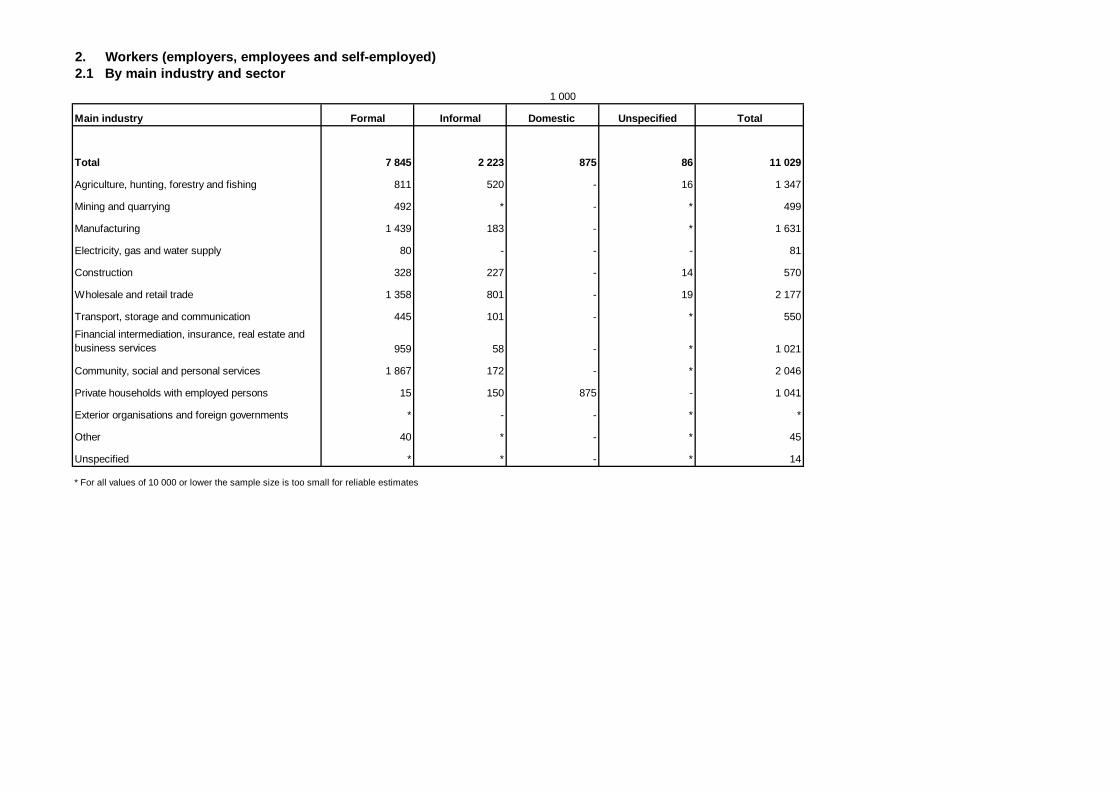
2. Workers (employers, employees and self-employed) 2.1 By main industry and sector
Main industry Formal Informal Domestic Unspecified Total
Total 7 845 2 223 875 86 11 029
Agriculture, hunting, forestry and fishing 811 520 - 16 1 347
Mining and quarrying 492 * - * 499
Manufacturing 1 439 183 - * 1 631
Electricity, gas and water supply 80 - - - 81
Construction 328 227 - 14 570
Wholesale and retail trade 1 358 801 - 19 2 177
Transport, storage and communication 445 101 - * 550
Financial intermediation, insurance, real estate and business services 959 58 - * 1 021
Community, social and personal services 1 867 172 - * 2 046
Private households with employed persons 15 150 875 - 1 041
Exterior organisations and foreign governments * - - * *
Other 40 * - * 45
Unspecified * * - * 14
* For all values of 10 000 or lower the sample size is too small for reliable estimates
1 000
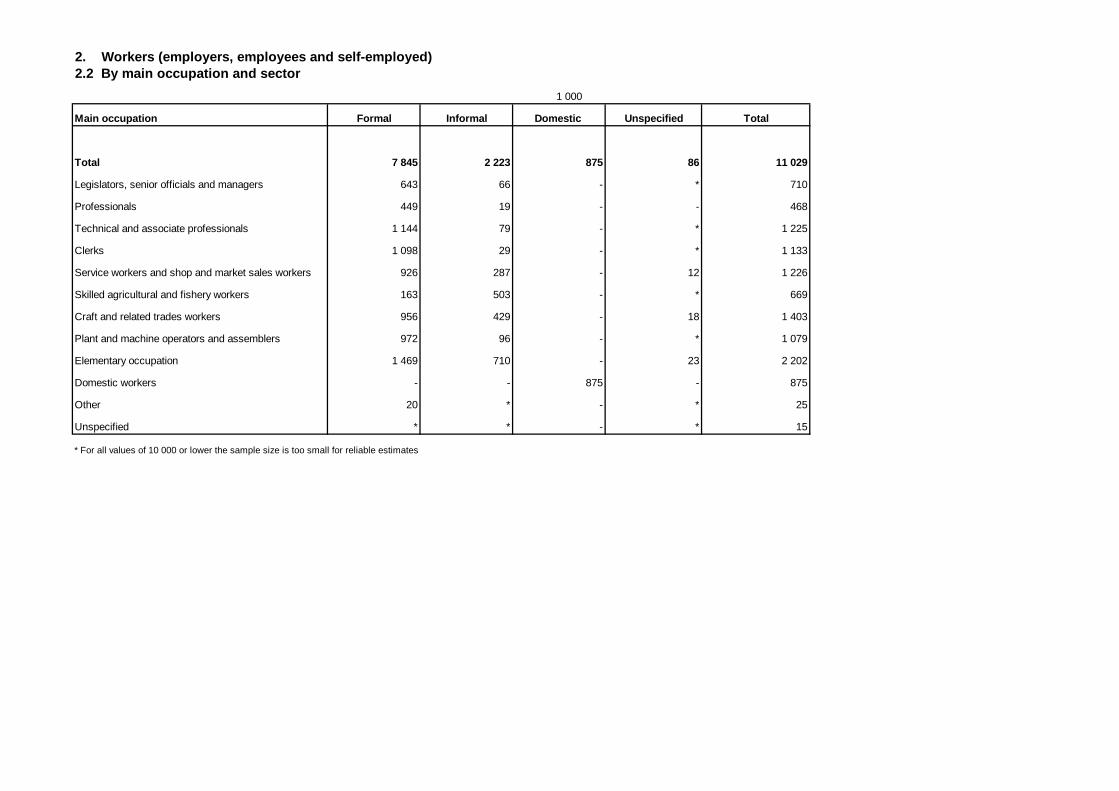
2. Workers (employers, employees and self-employed)2.2 By main occupation and sector
Main occupation Formal Informal Domestic Unspecified Total
Total 7 845 2 223 875 86 11 029
Legislators, senior officials and managers 643 66 - * 710
Professionals 449 19 - - 468
Technical and associate professionals 1 144 79 - * 1 225
Clerks 1 098 29 - * 1 133
Service workers and shop and market sales workers 926 287 - 12 1 226
Skilled agricultural and fishery workers 163 503 - * 669
Craft and related trades workers 956 429 - 18 1 403
Plant and machine operators and assemblers 972 96 - * 1 079
Elementary occupation 1 469 710 - 23 2 202
Domestic workers - - 875 - 875
Other 20 * - * 25
Unspecified * * - * 15
* For all values of 10 000 or lower the sample size is too small for reliable estimates
1 000
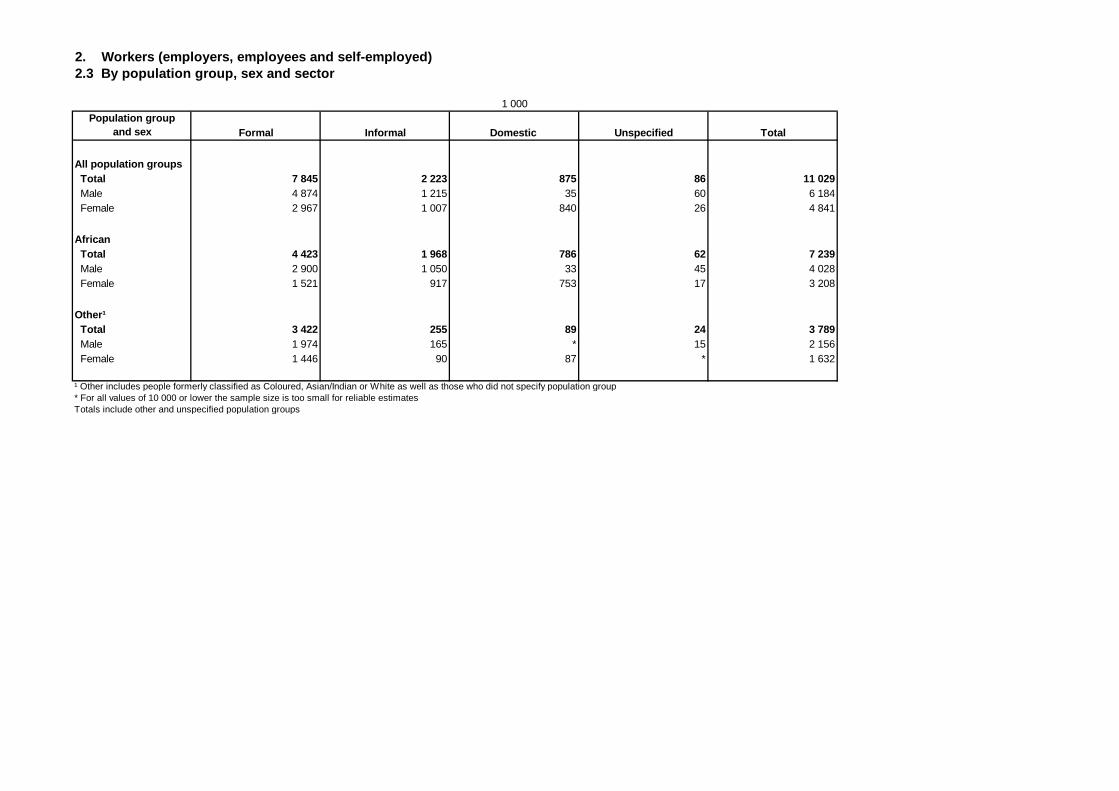
2. Workers (employers, employees and self-employed)2.3 By population group, sex and sector
Population group and sex Formal Informal Domestic Unspecified Total
All population groups Total 7 845 2 223 875 86 11 029 Male 4 874 1 215 35 60 6 184 Female 2 967 1 007 840 26 4 841
African Total 4 423 1 968 786 62 7 239 Male 2 900 1 050 33 45 4 028 Female 1 521 917 753 17 3 208
Other¹ Total 3 422 255 89 24 3 789 Male 1 974 165 * 15 2 156 Female 1 446 90 87 * 1 632
¹ Other includes people formerly classified as Coloured, Asian/Indian or White as well as those who did not specify population group* For all values of 10 000 or lower the sample size is too small for reliable estimatesTotals include other and unspecified population groups
1 000
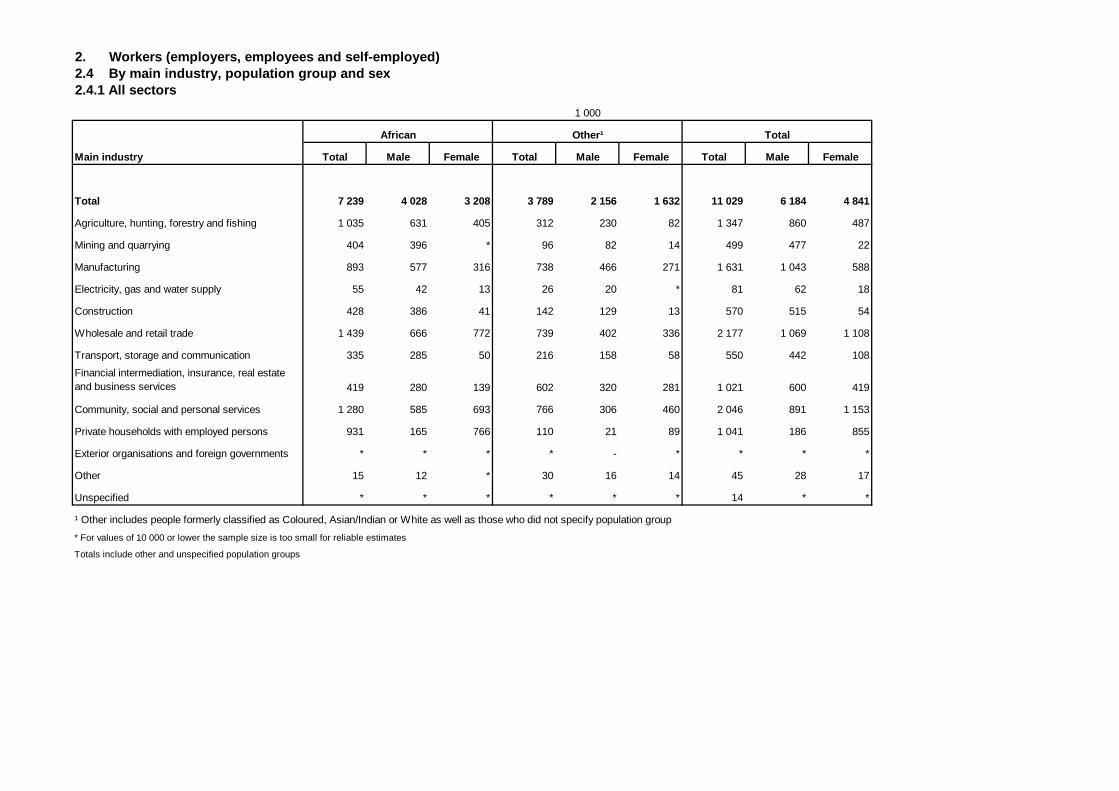
2. Workers (employers, employees and self-employed)2.4 By main industry, population group and sex 2.4.1 All sectors
Total Male Female Total Male Female Total Male Female
Total 7 239 4 028 3 208 3 789 2 156 1 632 11 029 6 184 4 841
Agriculture, hunting, forestry and fishing 1 035 631 405 312 230 82 1 347 860 487
Mining and quarrying 404 396 * 96 82 14 499 477 22
Manufacturing 893 577 316 738 466 271 1 631 1 043 588
Electricity, gas and water supply 55 42 13 26 20 * 81 62 18
Construction 428 386 41 142 129 13 570 515 54
Wholesale and retail trade 1 439 666 772 739 402 336 2 177 1 069 1 108
Transport, storage and communication 335 285 50 216 158 58 550 442 108
Financial intermediation, insurance, real estate and business services 419 280 139 602 320 281 1 021 600 419
Community, social and personal services 1 280 585 693 766 306 460 2 046 891 1 153
Private households with employed persons 931 165 766 110 21 89 1 041 186 855
Exterior organisations and foreign governments * * * * - * * * *
Other 15 12 * 30 16 14 45 28 17
Unspecified * * * * * * 14 * *
¹ Other includes people formerly classified as Coloured, Asian/Indian or White as well as those who did not specify population group
* For values of 10 000 or lower the sample size is too small for reliable estimates
Totals include other and unspecified population groups
1 000
Main industry
African Other¹ Total
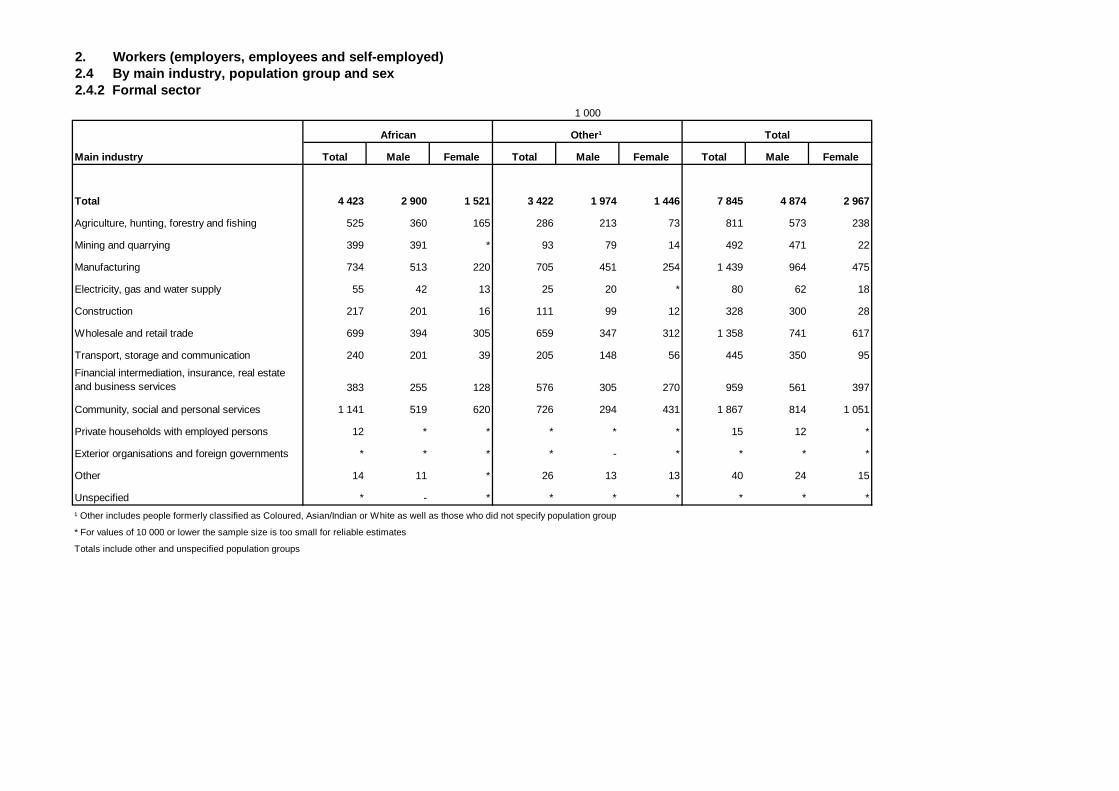
2. Workers (employers, employees and self-employed)2.4 By main industry, population group and sex 2.4.2 Formal sector
Total Male Female Total Male Female Total Male Female
Total 4 423 2 900 1 521 3 422 1 974 1 446 7 845 4 874 2 967
Agriculture, hunting, forestry and fishing 525 360 165 286 213 73 811 573 238
Mining and quarrying 399 391 * 93 79 14 492 471 22
Manufacturing 734 513 220 705 451 254 1 439 964 475
Electricity, gas and water supply 55 42 13 25 20 * 80 62 18
Construction 217 201 16 111 99 12 328 300 28
Wholesale and retail trade 699 394 305 659 347 312 1 358 741 617
Transport, storage and communication 240 201 39 205 148 56 445 350 95
Financial intermediation, insurance, real estate and business services 383 255 128 576 305 270 959 561 397
Community, social and personal services 1 141 519 620 726 294 431 1 867 814 1 051
Private households with employed persons 12 * * * * * 15 12 *
Exterior organisations and foreign governments * * * * - * * * *
Other 14 11 * 26 13 13 40 24 15
Unspecified * - * * * * * * *
¹ Other includes people formerly classified as Coloured, Asian/Indian or White as well as those who did not specify population group
* For values of 10 000 or lower the sample size is too small for reliable estimates
Totals include other and unspecified population groups
1 000
Main industry
African Other¹ Total
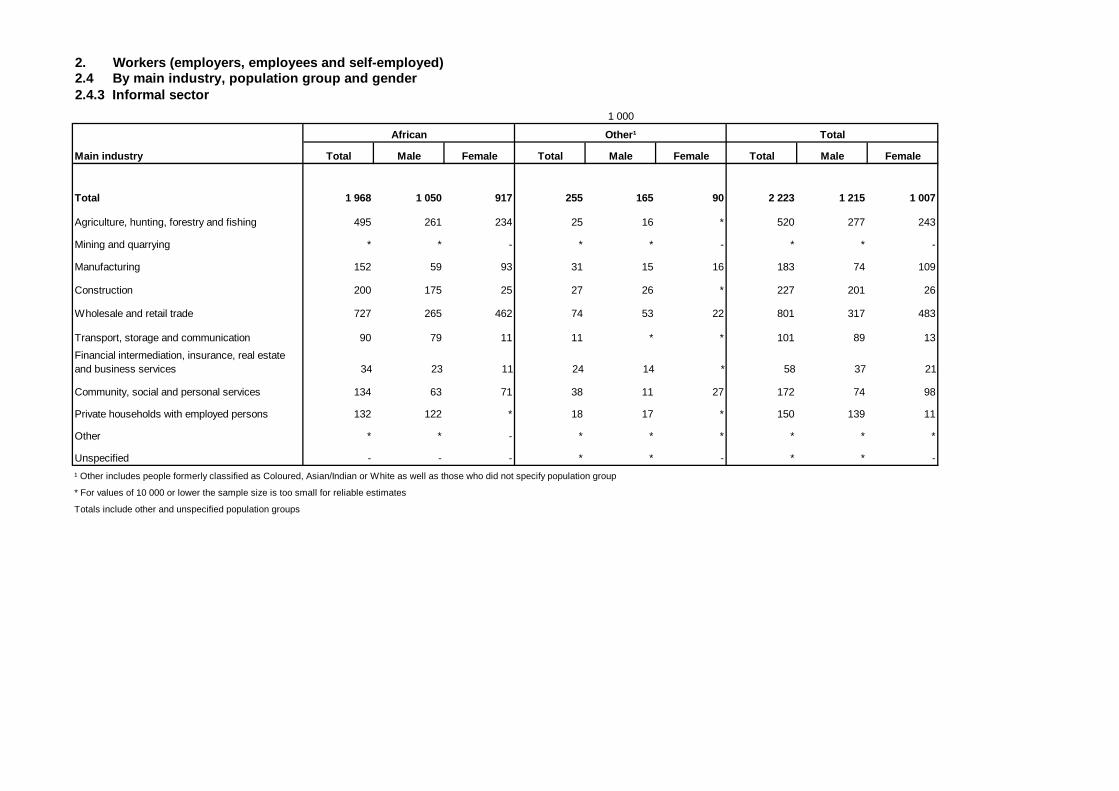
2. Workers (employers, employees and self-employed)2.4 By main industry, population group and gender 2.4.3 Informal sector
Total Male Female Total Male Female Total Male Female
Total 1 968 1 050 917 255 165 90 2 223 1 215 1 007
Agriculture, hunting, forestry and fishing 495 261 234 25 16 * 520 277 243
Mining and quarrying * * - * * - * * -
Manufacturing 152 59 93 31 15 16 183 74 109
Construction 200 175 25 27 26 * 227 201 26
Wholesale and retail trade 727 265 462 74 53 22 801 317 483
Transport, storage and communication 90 79 11 11 * * 101 89 13
Financial intermediation, insurance, real estate and business services 34 23 11 24 14 * 58 37 21
Community, social and personal services 134 63 71 38 11 27 172 74 98
Private households with employed persons 132 122 * 18 17 * 150 139 11
Other * * - * * * * * *
Unspecified - - - * * - * * -
¹ Other includes people formerly classified as Coloured, Asian/Indian or White as well as those who did not specify population group
* For values of 10 000 or lower the sample size is too small for reliable estimates
Totals include other and unspecified population groups
1 000
Main industry
African Other¹ Total

2. Workers (employers, employees and self-employed)2.5 By monthly income and sector
Monthly income Formal Informal Domestic Unspecified Total
Total 7 845 2 223 875 86 11 029
None 33 422 - * 458
R1 - R500 691 873 589 21 2 174
R501 - R1 000 1 045 401 233 20 1 698
R1 001 - R2 500 2 163 277 36 13 2 489
R2 501 - R8 000 2 430 128 * * 2 568
R8 001+ 700 25 - * 726
Don't know/Refused 763 92 12 * 876
Unspecified 20 * * 13 40
* For all values of 10 000 or lower the sample size is too small for reliable estimates
1 000
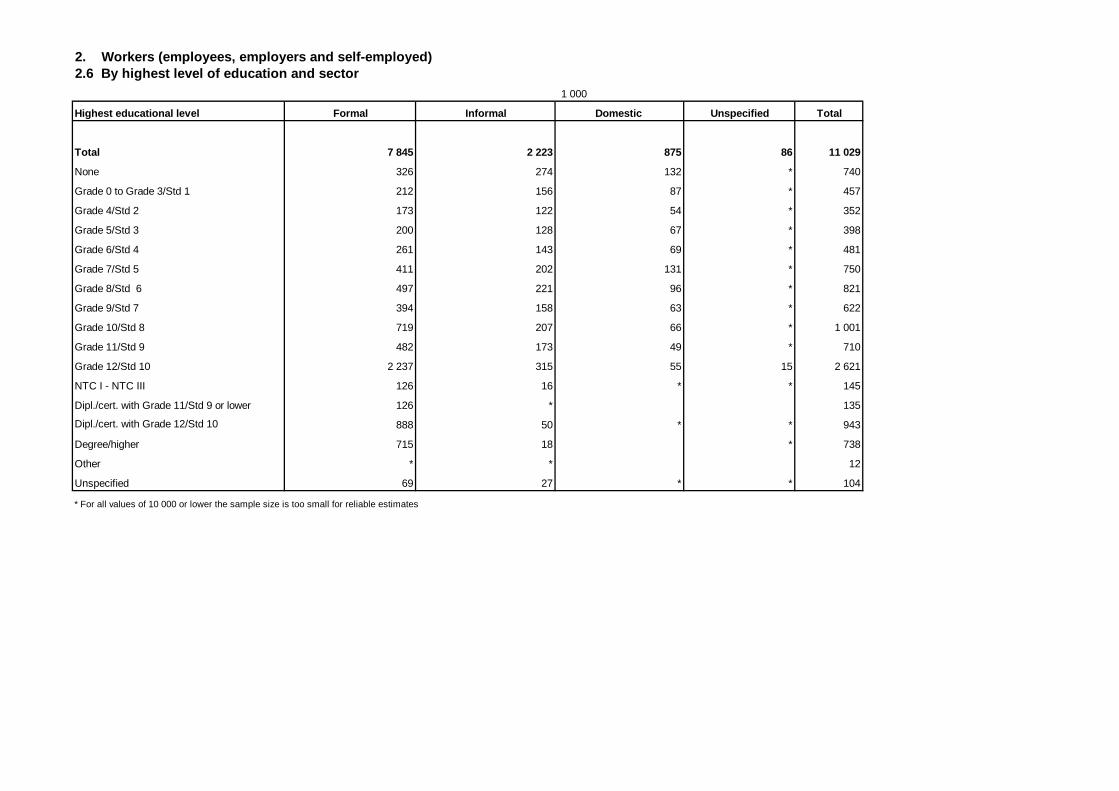
2. Workers (employees, employers and self-employed)2.6 By highest level of education and sector
Highest educational level Formal Informal Domestic Unspecified Total
Total 7 845 2 223 875 86 11 029
None 326 274 132 * 740
Grade 0 to Grade 3/Std 1 212 156 87 * 457
Grade 4/Std 2 173 122 54 * 352
Grade 5/Std 3 200 128 67 * 398
Grade 6/Std 4 261 143 69 * 481
Grade 7/Std 5 411 202 131 * 750
Grade 8/Std 6 497 221 96 * 821
Grade 9/Std 7 394 158 63 * 622
Grade 10/Std 8 719 207 66 * 1 001
Grade 11/Std 9 482 173 49 * 710
Grade 12/Std 10 2 237 315 55 15 2 621
NTC I - NTC III 126 16 * * 145
Dipl./cert. with Grade 11/Std 9 or lower 126 * 135
Dipl./cert. with Grade 12/Std 10 888 50 * * 943
Degree/higher 715 18 * 738
Other * * 12
Unspecified 69 27 * * 104
* For all values of 10 000 or lower the sample size is too small for reliable estimates
1 000
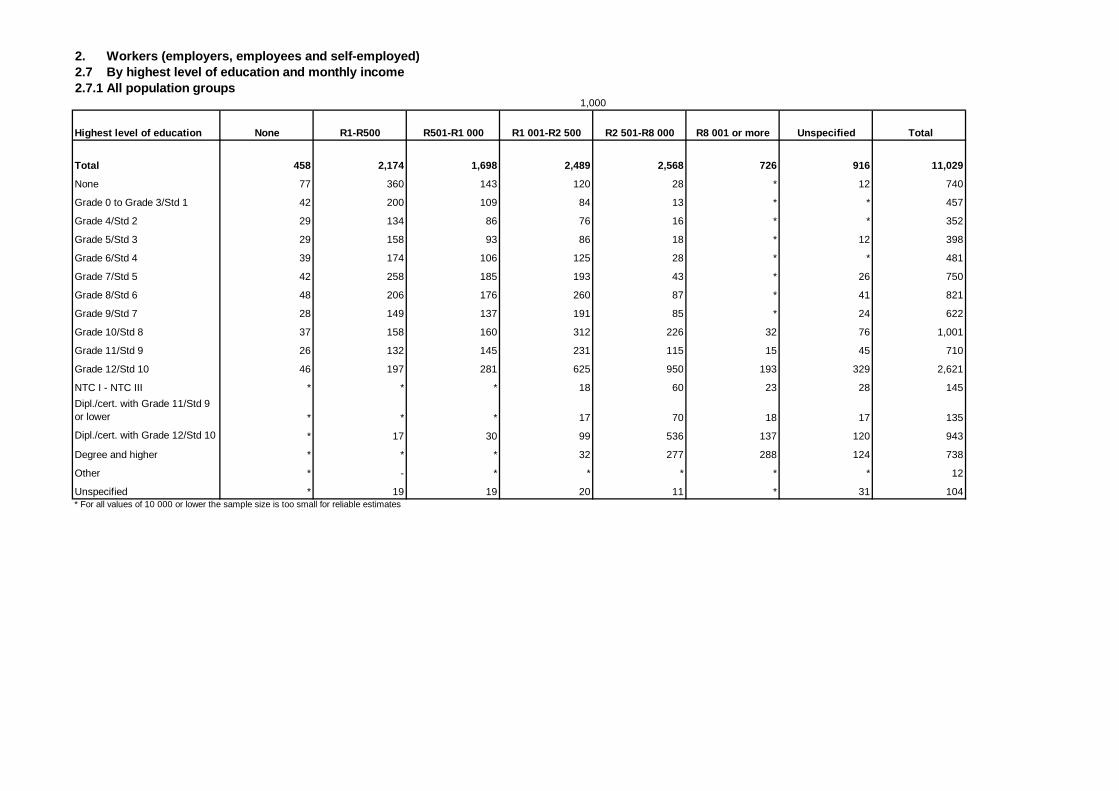
2. Workers (employers, employees and self-employed)2.7 By highest level of education and monthly income2.7.1 All population groups
Total 458 2,174 1,698 2,489 2,568 726 916 11,029
None 77 360 143 120 28 * 12 740
Grade 0 to Grade 3/Std 1 42 200 109 84 13 * * 457
Grade 4/Std 2 29 134 86 76 16 * * 352
Grade 5/Std 3 29 158 93 86 18 * 12 398
Grade 6/Std 4 39 174 106 125 28 * * 481
Grade 7/Std 5 42 258 185 193 43 * 26 750
Grade 8/Std 6 48 206 176 260 87 * 41 821
Grade 9/Std 7 28 149 137 191 85 * 24 622
Grade 10/Std 8 37 158 160 312 226 32 76 1,001
Grade 11/Std 9 26 132 145 231 115 15 45 710
Grade 12/Std 10 46 197 281 625 950 193 329 2,621
NTC I - NTC III * * * 18 60 23 28 145
Dipl./cert. with Grade 11/Std 9 or lower * * * 17 70 18 17 135
Dipl./cert. with Grade 12/Std 10 * 17 30 99 536 137 120 943
Degree and higher * * * 32 277 288 124 738
Other * - * * * * * 12
Unspecified * 19 19 20 11 * 31 104* For all values of 10 000 or lower the sample size is too small for reliable estimates
1,000
Highest level of education None R1-R500 R501-R1 000 R1 001-R2 500 R2 501-R8 000 R8 001 or more Unspecified Total
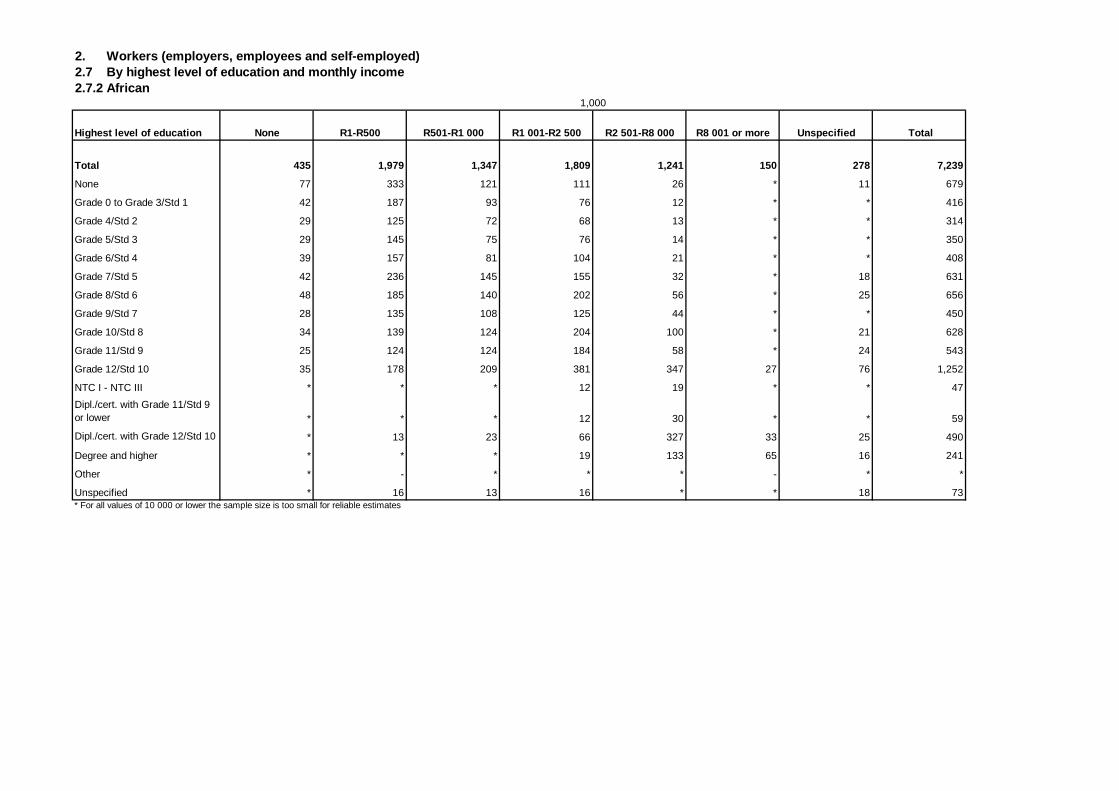
2. Workers (employers, employees and self-employed)2.7 By highest level of education and monthly income 2.7.2 African
Total 435 1,979 1,347 1,809 1,241 150 278 7,239
None 77 333 121 111 26 * 11 679
Grade 0 to Grade 3/Std 1 42 187 93 76 12 * * 416
Grade 4/Std 2 29 125 72 68 13 * * 314
Grade 5/Std 3 29 145 75 76 14 * * 350
Grade 6/Std 4 39 157 81 104 21 * * 408
Grade 7/Std 5 42 236 145 155 32 * 18 631
Grade 8/Std 6 48 185 140 202 56 * 25 656
Grade 9/Std 7 28 135 108 125 44 * * 450
Grade 10/Std 8 34 139 124 204 100 * 21 628
Grade 11/Std 9 25 124 124 184 58 * 24 543
Grade 12/Std 10 35 178 209 381 347 27 76 1,252
NTC I - NTC III * * * 12 19 * * 47
Dipl./cert. with Grade 11/Std 9 or lower * * * 12 30 * * 59
Dipl./cert. with Grade 12/Std 10 * 13 23 66 327 33 25 490
Degree and higher * * * 19 133 65 16 241
Other * - * * * - * *
Unspecified * 16 13 16 * * 18 73* For all values of 10 000 or lower the sample size is too small for reliable estimates
1,000
Highest level of education None R1-R500 R501-R1 000 R1 001-R2 500 R2 501-R8 000 R8 001 or more Unspecified Total
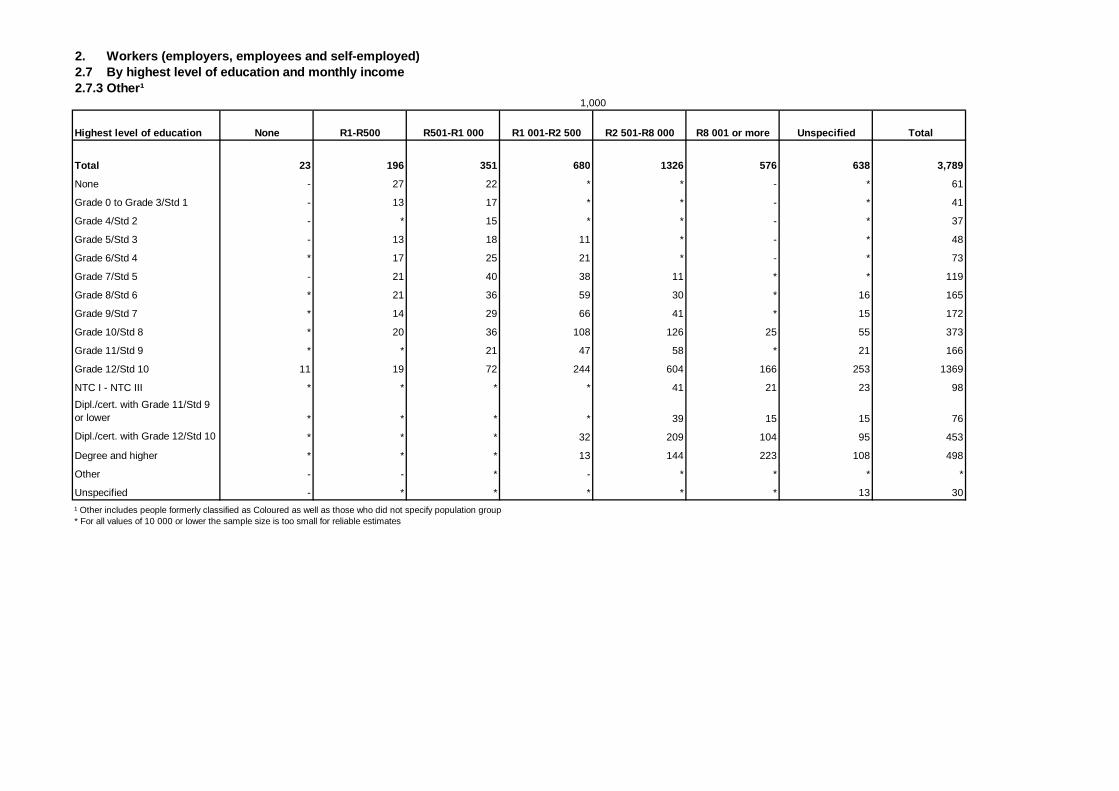
2. Workers (employers, employees and self-employed)2.7 By highest level of education and monthly income 2.7.3 Other¹
Total 23 196 351 680 1326 576 638 3,789
None - 27 22 * * - * 61
Grade 0 to Grade 3/Std 1 - 13 17 * * - * 41
Grade 4/Std 2 - * 15 * * - * 37
Grade 5/Std 3 - 13 18 11 * - * 48
Grade 6/Std 4 * 17 25 21 * - * 73
Grade 7/Std 5 - 21 40 38 11 * * 119
Grade 8/Std 6 * 21 36 59 30 * 16 165
Grade 9/Std 7 * 14 29 66 41 * 15 172
Grade 10/Std 8 * 20 36 108 126 25 55 373
Grade 11/Std 9 * * 21 47 58 * 21 166
Grade 12/Std 10 11 19 72 244 604 166 253 1369
NTC I - NTC III * * * * 41 21 23 98
Dipl./cert. with Grade 11/Std 9 or lower * * * * 39 15 15 76
Dipl./cert. with Grade 12/Std 10 * * * 32 209 104 95 453
Degree and higher * * * 13 144 223 108 498
Other - - * - * * * *
Unspecified - * * * * * 13 30
¹ Other includes people formerly classified as Coloured as well as those who did not specify population group* For all values of 10 000 or lower the sample size is too small for reliable estimates
1,000
Highest level of education None R1-R500 R501-R1 000 R1 001-R2 500 R2 501-R8 000 R8 001 or more Unspecified Total
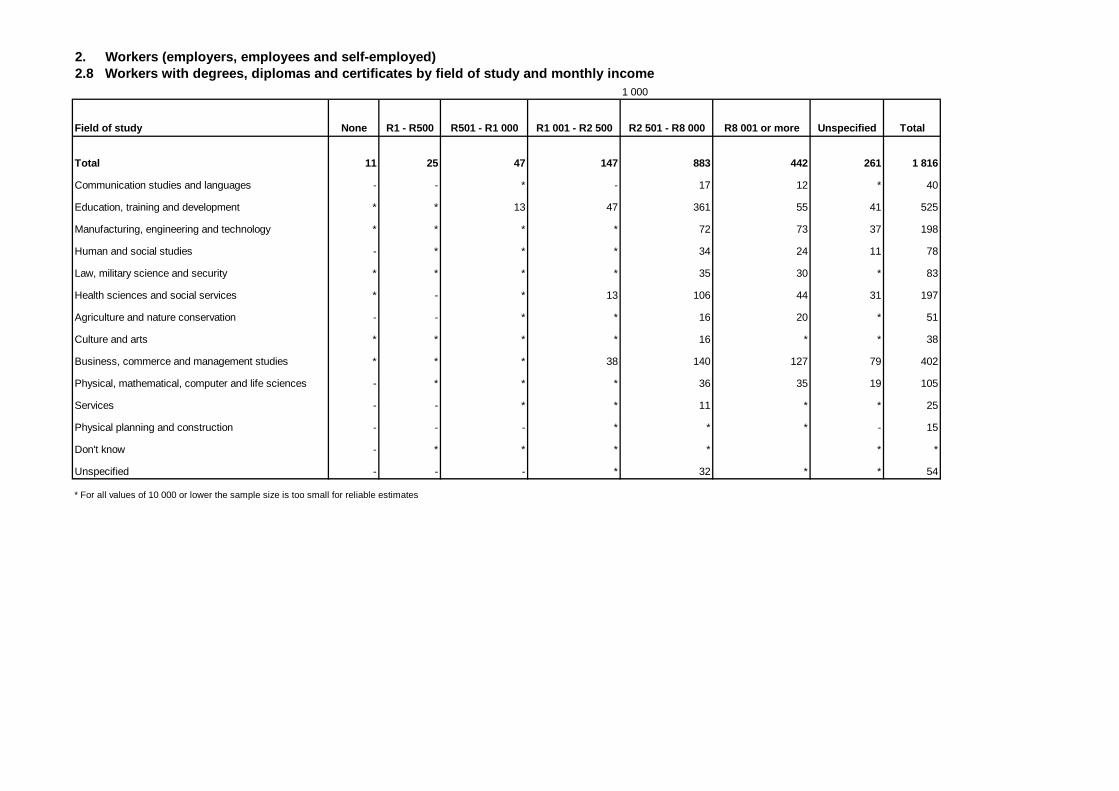
2. Workers (employers, employees and self-employed)2.8 Workers with degrees, diplomas and certificates by field of study and monthly income
Field of study None R1 - R500 R501 - R1 000 R1 001 - R2 500 R2 501 - R8 000 R8 001 or more Unspecified Total
Total 11 25 47 147 883 442 261 1 816
Communication studies and languages - - * - 17 12 * 40
Education, training and development * * 13 47 361 55 41 525
Manufacturing, engineering and technology * * * * 72 73 37 198
Human and social studies - * * * 34 24 11 78
Law, military science and security * * * * 35 30 * 83
Health sciences and social services * - * 13 106 44 31 197
Agriculture and nature conservation - - * * 16 20 * 51
Culture and arts * * * * 16 * * 38
Business, commerce and management studies * * * 38 140 127 79 402
Physical, mathematical, computer and life sciences - * * * 36 35 19 105
Services - - * * 11 * * 25
Physical planning and construction - - - * * * - 15
Don't know - * * * * * *
Unspecified - - - * 32 * * 54
* For all values of 10 000 or lower the sample size is too small for reliable estimates
1 000
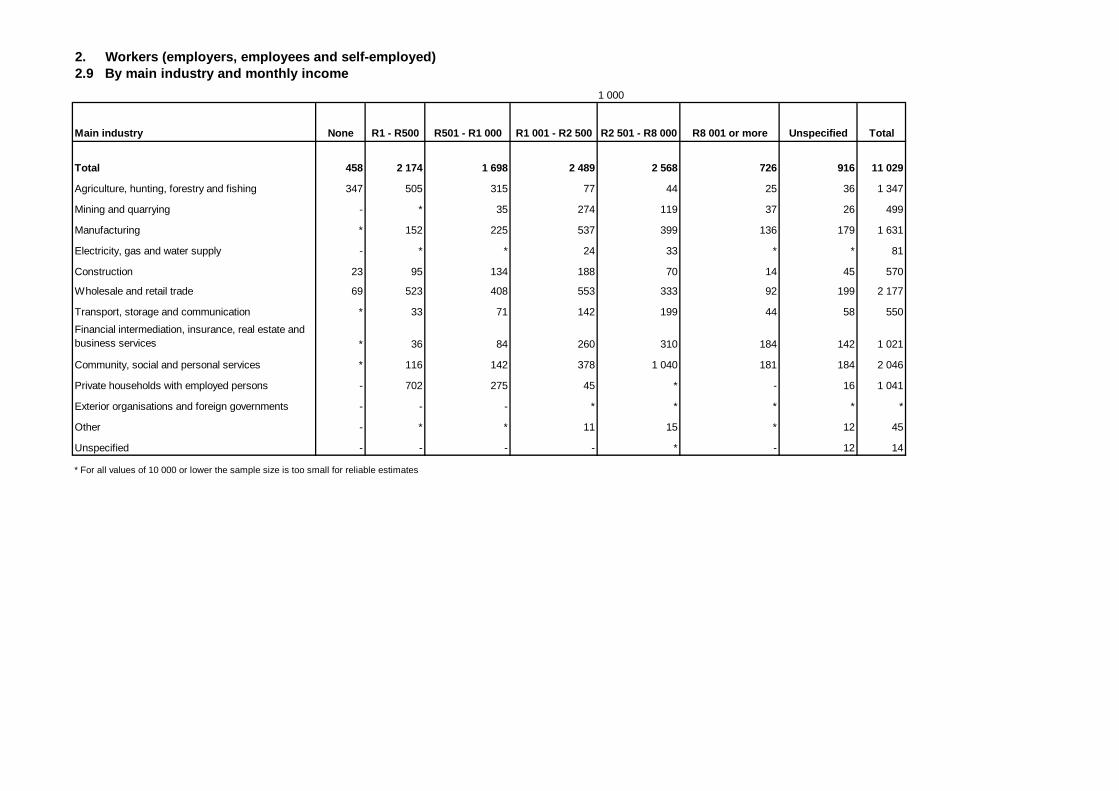
2. Workers (employers, employees and self-employed)2.9 By main industry and monthly income
Main industry None R1 - R500 R501 - R1 000 R1 001 - R2 500 R2 501 - R8 000 R8 001 or more Unspecified Total
Total 458 2 174 1 698 2 489 2 568 726 916 11 029
Agriculture, hunting, forestry and fishing 347 505 315 77 44 25 36 1 347
Mining and quarrying - * 35 274 119 37 26 499
Manufacturing * 152 225 537 399 136 179 1 631
Electricity, gas and water supply - * * 24 33 * * 81
Construction 23 95 134 188 70 14 45 570
Wholesale and retail trade 69 523 408 553 333 92 199 2 177
Transport, storage and communication * 33 71 142 199 44 58 550
Financial intermediation, insurance, real estate and business services * 36 84 260 310 184 142 1 021
Community, social and personal services * 116 142 378 1 040 181 184 2 046
Private households with employed persons - 702 275 45 * - 16 1 041
Exterior organisations and foreign governments - - - * * * * *
Other - * * 11 15 * 12 45
Unspecified - - - - * - 12 14
* For all values of 10 000 or lower the sample size is too small for reliable estimates
1 000
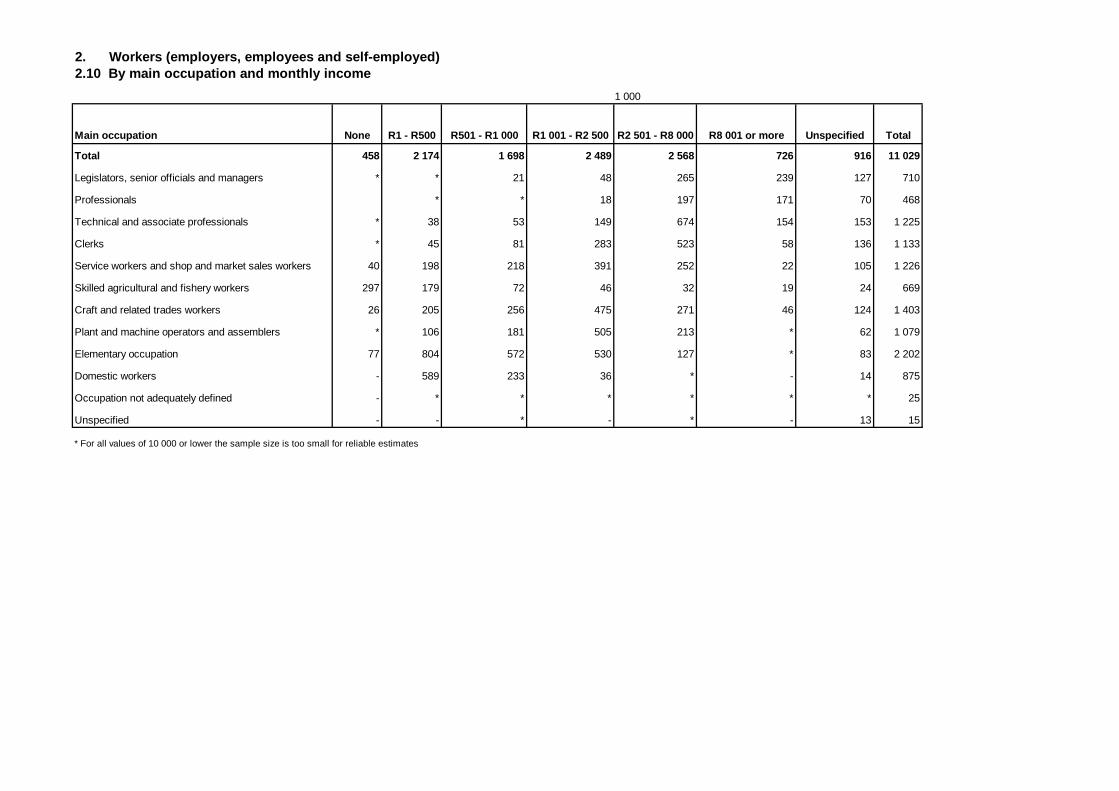
2. Workers (employers, employees and self-employed)2.10 By main occupation and monthly income
Main occupation None R1 - R500 R501 - R1 000 R1 001 - R2 500 R2 501 - R8 000 R8 001 or more Unspecified Total
Total 458 2 174 1 698 2 489 2 568 726 916 11 029
Legislators, senior officials and managers * * 21 48 265 239 127 710
Professionals * * 18 197 171 70 468
Technical and associate professionals * 38 53 149 674 154 153 1 225
Clerks * 45 81 283 523 58 136 1 133
Service workers and shop and market sales workers 40 198 218 391 252 22 105 1 226
Skilled agricultural and fishery workers 297 179 72 46 32 19 24 669
Craft and related trades workers 26 205 256 475 271 46 124 1 403
Plant and machine operators and assemblers * 106 181 505 213 * 62 1 079
Elementary occupation 77 804 572 530 127 * 83 2 202
Domestic workers - 589 233 36 * - 14 875
Occupation not adequately defined - * * * * * * 25
Unspecified - - * - * - 13 15
* For all values of 10 000 or lower the sample size is too small for reliable estimates
1 000
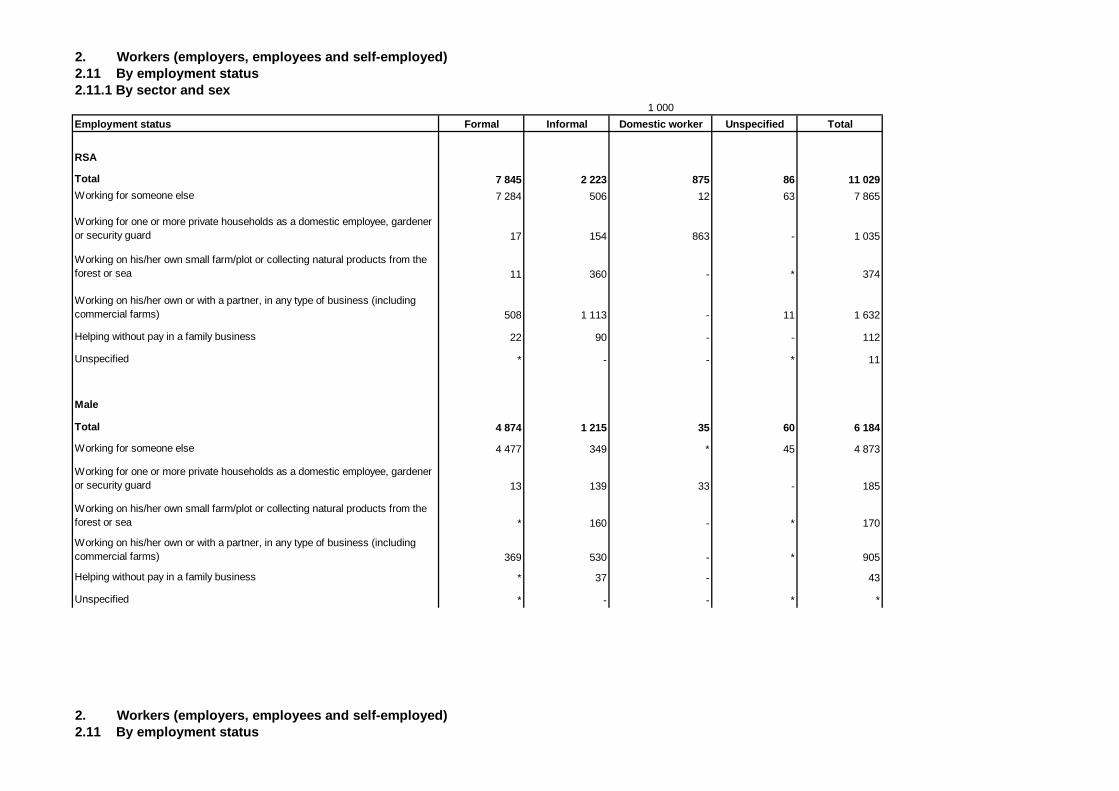
2. Workers (employers, employees and self-employed)2.11 By employment status 2.11.1 By sector and sex
Employment status Formal Informal Domestic worker Unspecified Total
RSA
Total 7 845 2 223 875 86 11 029Working for someone else 7 284 506 12 63 7 865
Working for one or more private households as a domestic employee, gardener or security guard 17 154 863 - 1 035
Working on his/her own small farm/plot or collecting natural products from the forest or sea 11 360 - * 374
Working on his/her own or with a partner, in any type of business (including commercial farms) 508 1 113 - 11 1 632
Helping without pay in a family business 22 90 - - 112
Unspecified * - - * 11
Male
Total 4 874 1 215 35 60 6 184
Working for someone else 4 477 349 * 45 4 873
Working for one or more private households as a domestic employee, gardener or security guard 13 139 33 - 185
Working on his/her own small farm/plot or collecting natural products from the forest or sea * 160 - * 170
Working on his/her own or with a partner, in any type of business (including commercial farms) 369 530 - * 905
Helping without pay in a family business * 37 - 43
Unspecified * - - * *
2. Workers (employers, employees and self-employed)2.11 By employment status
1 000
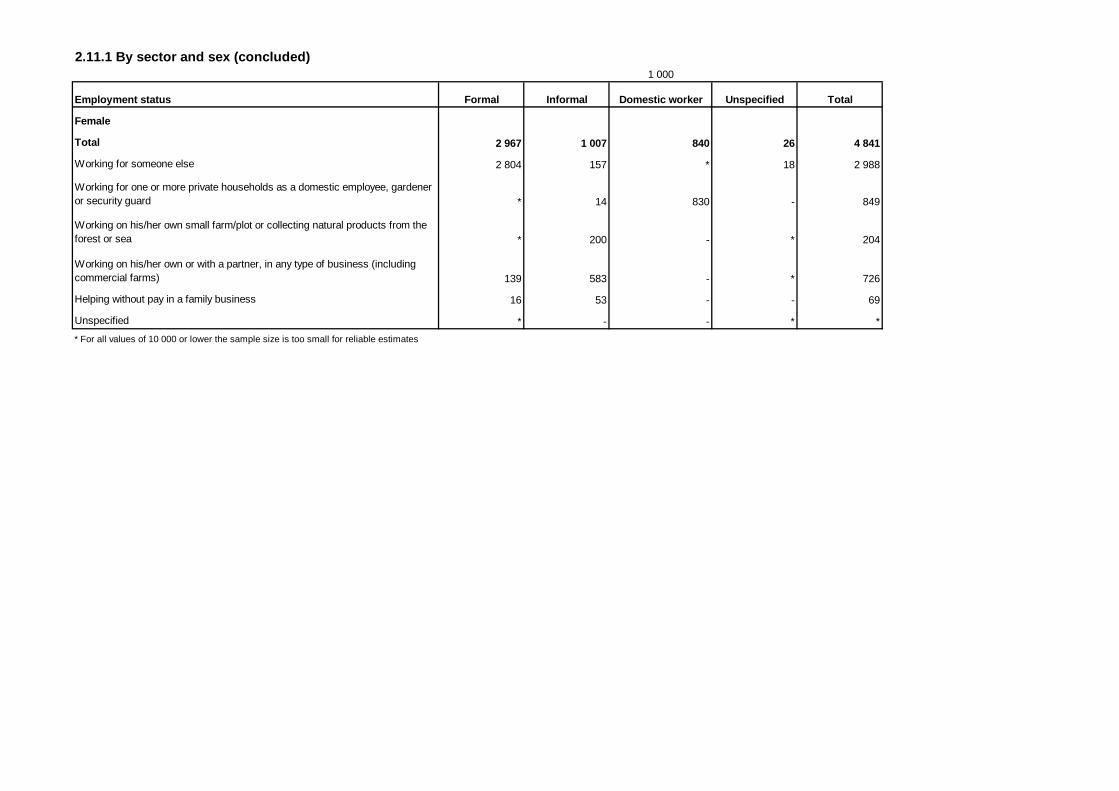
2.11.1 By sector and sex (concluded)
Employment status Formal Informal Domestic worker Unspecified Total
Female
Total 2 967 1 007 840 26 4 841
Working for someone else 2 804 157 * 18 2 988
Working for one or more private households as a domestic employee, gardener or security guard * 14 830 - 849
Working on his/her own small farm/plot or collecting natural products from the forest or sea * 200 - * 204
Working on his/her own or with a partner, in any type of business (including commercial farms) 139 583 - * 726
Helping without pay in a family business 16 53 - - 69
Unspecified * - - * *
* For all values of 10 000 or lower the sample size is too small for reliable estimates
1 000
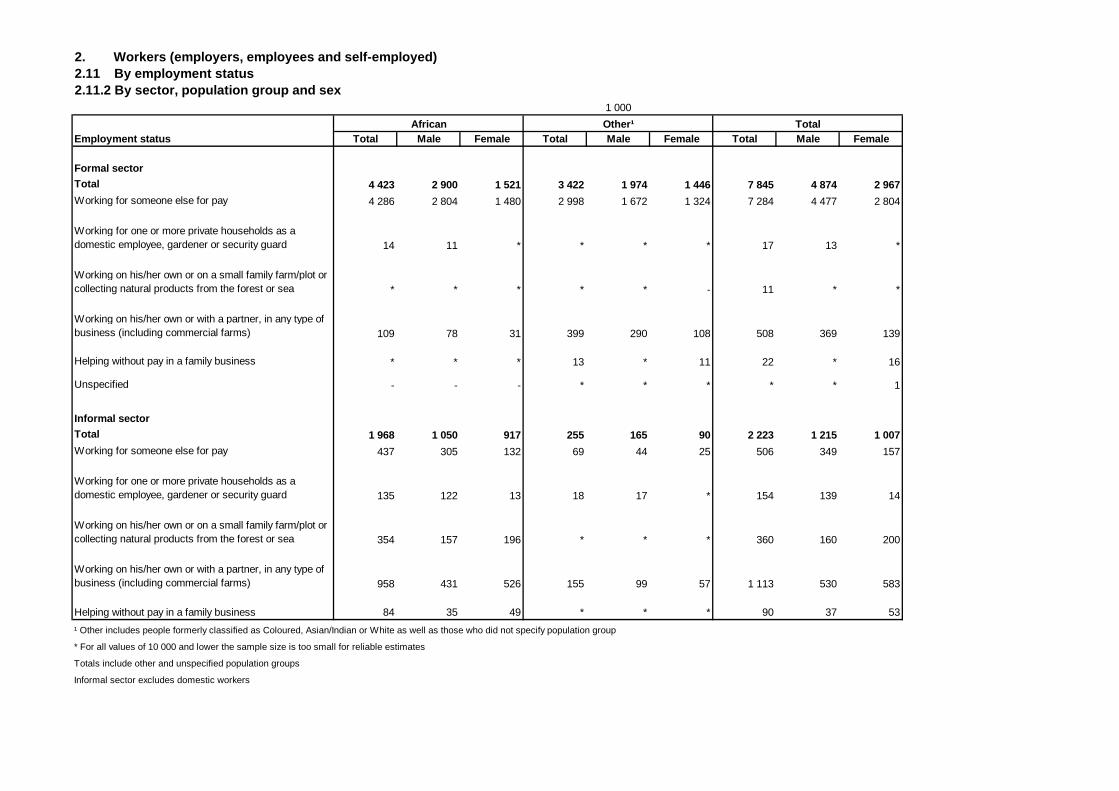
2. Workers (employers, employees and self-employed)2.11 By employment status 2.11.2 By sector, population group and sex
Total Male Female Total Male Female Total Male Female
Formal sectorTotal 4 423 2 900 1 521 3 422 1 974 1 446 7 845 4 874 2 967Working for someone else for pay 4 286 2 804 1 480 2 998 1 672 1 324 7 284 4 477 2 804
Working for one or more private households as a domestic employee, gardener or security guard 14 11 * * * * 17 13 *
Working on his/her own or on a small family farm/plot or collecting natural products from the forest or sea * * * * * - 11 * *
Working on his/her own or with a partner, in any type of business (including commercial farms) 109 78 31 399 290 108 508 369 139
Helping without pay in a family business * * * 13 * 11 22 * 16
Unspecified - - - * * * * * 1
Informal sectorTotal 1 968 1 050 917 255 165 90 2 223 1 215 1 007Working for someone else for pay 437 305 132 69 44 25 506 349 157
Working for one or more private households as a domestic employee, gardener or security guard 135 122 13 18 17 * 154 139 14
Working on his/her own or on a small family farm/plot or collecting natural products from the forest or sea 354 157 196 * * * 360 160 200
Working on his/her own or with a partner, in any type of business (including commercial farms) 958 431 526 155 99 57 1 113 530 583
Helping without pay in a family business 84 35 49 * * * 90 37 53
¹ Other includes people formerly classified as Coloured, Asian/Indian or White as well as those who did not specify population group
* For all values of 10 000 and lower the sample size is too small for reliable estimates
Totals include other and unspecified population groups
Informal sector excludes domestic workers
1 000
Employment statusAfrican Other¹ Total
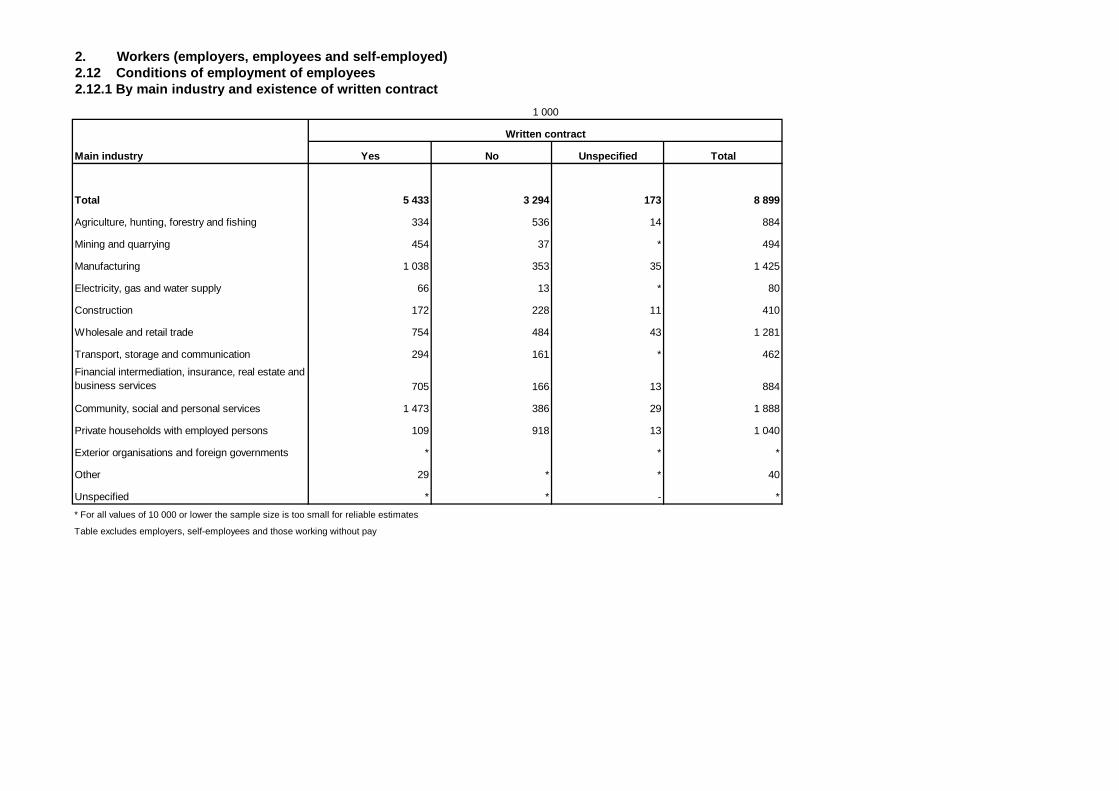
2. Workers (employers, employees and self-employed)2.12 Conditions of employment of employees2.12.1 By main industry and existence of written contract
Yes No Unspecified Total
Total 5 433 3 294 173 8 899
Agriculture, hunting, forestry and fishing 334 536 14 884
Mining and quarrying 454 37 * 494
Manufacturing 1 038 353 35 1 425
Electricity, gas and water supply 66 13 * 80
Construction 172 228 11 410
Wholesale and retail trade 754 484 43 1 281
Transport, storage and communication 294 161 * 462
Financial intermediation, insurance, real estate and business services 705 166 13 884
Community, social and personal services 1 473 386 29 1 888
Private households with employed persons 109 918 13 1 040
Exterior organisations and foreign governments * * *
Other 29 * * 40
Unspecified * * - *
* For all values of 10 000 or lower the sample size is too small for reliable estimates
Table excludes employers, self-employees and those working without pay
1 000
Main industry
Written contract
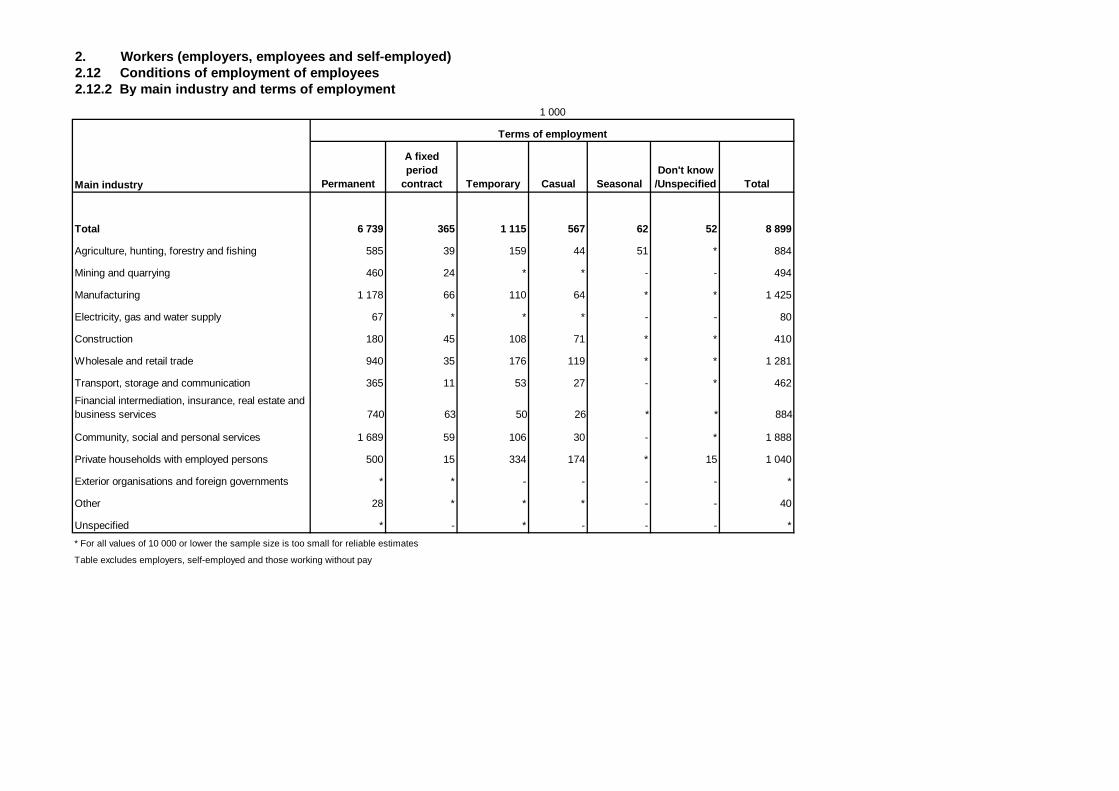
2. Workers (employers, employees and self-employed)2.12 Conditions of employment of employees2.12.2 By main industry and terms of employment
Permanent
A fixed period
contract Temporary Casual SeasonalDon't know
/Unspecified Total
Total 6 739 365 1 115 567 62 52 8 899
Agriculture, hunting, forestry and fishing 585 39 159 44 51 * 884
Mining and quarrying 460 24 * * - - 494
Manufacturing 1 178 66 110 64 * * 1 425
Electricity, gas and water supply 67 * * * - - 80
Construction 180 45 108 71 * * 410
Wholesale and retail trade 940 35 176 119 * * 1 281
Transport, storage and communication 365 11 53 27 - * 462
Financial intermediation, insurance, real estate and business services 740 63 50 26 * * 884
Community, social and personal services 1 689 59 106 30 - * 1 888
Private households with employed persons 500 15 334 174 * 15 1 040
Exterior organisations and foreign governments * * - - - - *
Other 28 * * * - - 40
Unspecified * - * - - - *
* For all values of 10 000 or lower the sample size is too small for reliable estimates
Table excludes employers, self-employed and those working without pay
1 000
Main industry
Terms of employment
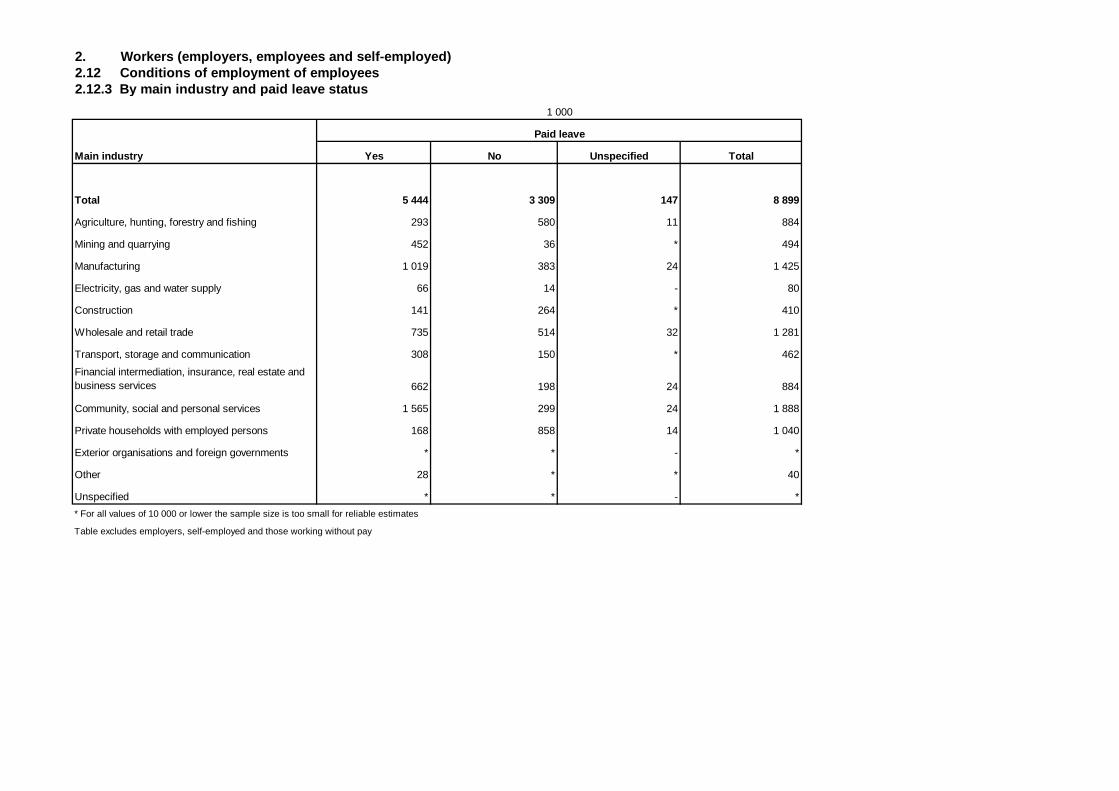
2. Workers (employers, employees and self-employed)2.12 Conditions of employment of employees2.12.3 By main industry and paid leave status
Yes No Unspecified Total
Total 5 444 3 309 147 8 899
Agriculture, hunting, forestry and fishing 293 580 11 884
Mining and quarrying 452 36 * 494
Manufacturing 1 019 383 24 1 425
Electricity, gas and water supply 66 14 - 80
Construction 141 264 * 410
Wholesale and retail trade 735 514 32 1 281
Transport, storage and communication 308 150 * 462
Financial intermediation, insurance, real estate and business services 662 198 24 884
Community, social and personal services 1 565 299 24 1 888
Private households with employed persons 168 858 14 1 040
Exterior organisations and foreign governments * * - *
Other 28 * * 40
Unspecified * * - *
* For all values of 10 000 or lower the sample size is too small for reliable estimates
Table excludes employers, self-employed and those working without pay
1 000
Main industry
Paid leave
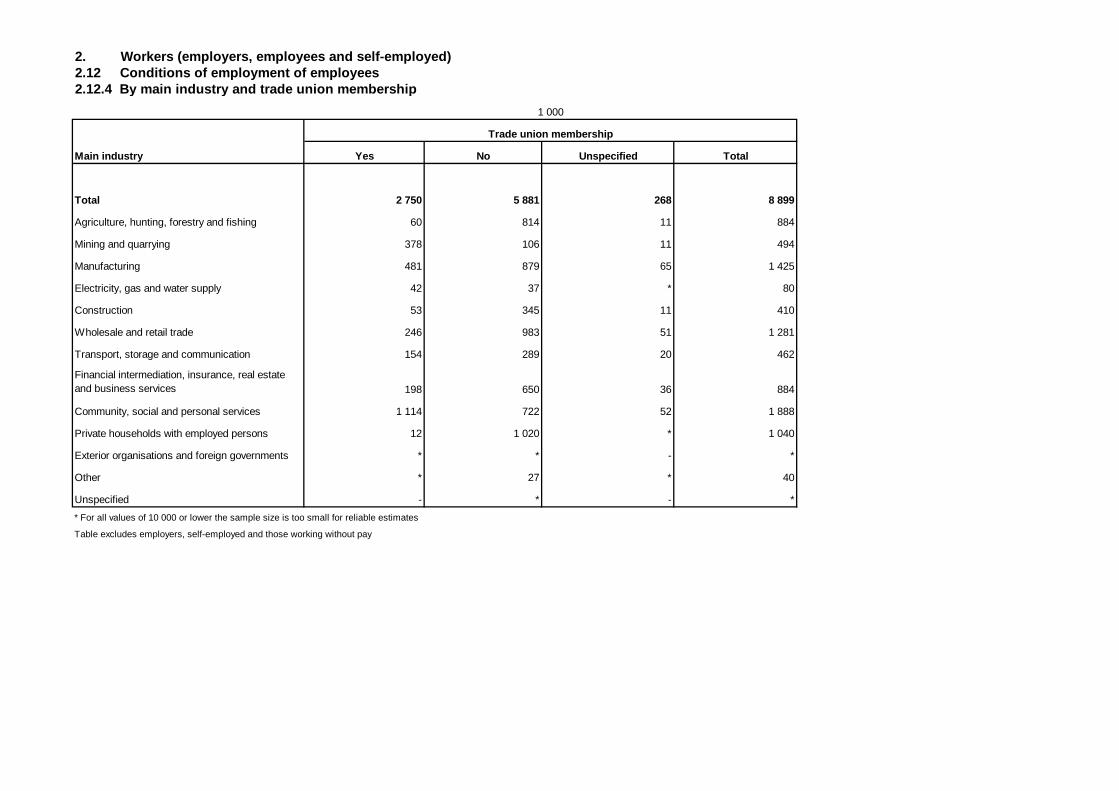
2. Workers (employers, employees and self-employed)2.12 Conditions of employment of employees2.12.4 By main industry and trade union membership
Yes No Unspecified Total
Total 2 750 5 881 268 8 899
Agriculture, hunting, forestry and fishing 60 814 11 884
Mining and quarrying 378 106 11 494
Manufacturing 481 879 65 1 425
Electricity, gas and water supply 42 37 * 80
Construction 53 345 11 410
Wholesale and retail trade 246 983 51 1 281
Transport, storage and communication 154 289 20 462
Financial intermediation, insurance, real estate and business services 198 650 36 884
Community, social and personal services 1 114 722 52 1 888
Private households with employed persons 12 1 020 * 1 040
Exterior organisations and foreign governments * * - *
Other * 27 * 40
Unspecified - * - *
* For all values of 10 000 or lower the sample size is too small for reliable estimates
Table excludes employers, self-employed and those working without pay
1 000
Main industry
Trade union membership
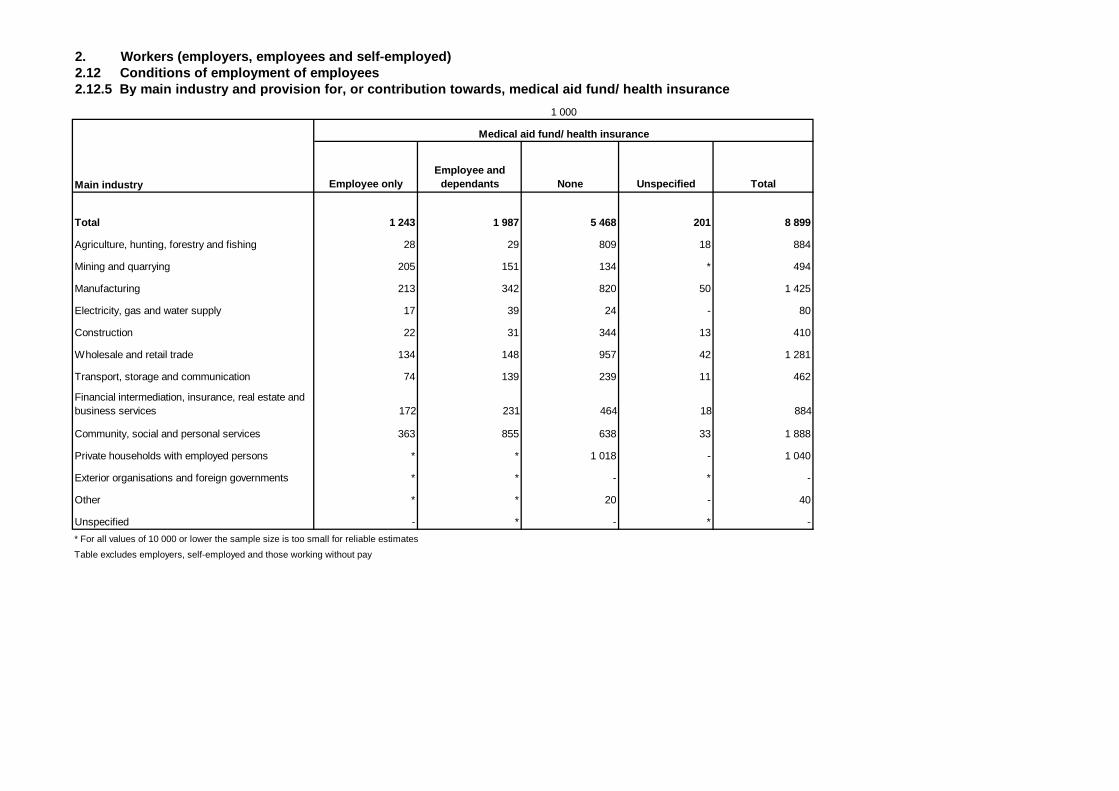
2. Workers (employers, employees and self-employed)2.12 Conditions of employment of employees2.12.5 By main industry and provision for, or contribution towards, medical aid fund/ health insurance
Employee onlyEmployee and
dependants None Unspecified Total
Total 1 243 1 987 5 468 201 8 899
Agriculture, hunting, forestry and fishing 28 29 809 18 884
Mining and quarrying 205 151 134 * 494
Manufacturing 213 342 820 50 1 425
Electricity, gas and water supply 17 39 24 - 80
Construction 22 31 344 13 410
Wholesale and retail trade 134 148 957 42 1 281
Transport, storage and communication 74 139 239 11 462
Financial intermediation, insurance, real estate and business services 172 231 464 18 884
Community, social and personal services 363 855 638 33 1 888
Private households with employed persons * * 1 018 - 1 040
Exterior organisations and foreign governments * * - * -
Other * * 20 - 40
Unspecified - * - * -
* For all values of 10 000 or lower the sample size is too small for reliable estimates
Table excludes employers, self-employed and those working without pay
1 000
Main industry
Medical aid fund/ health insurance
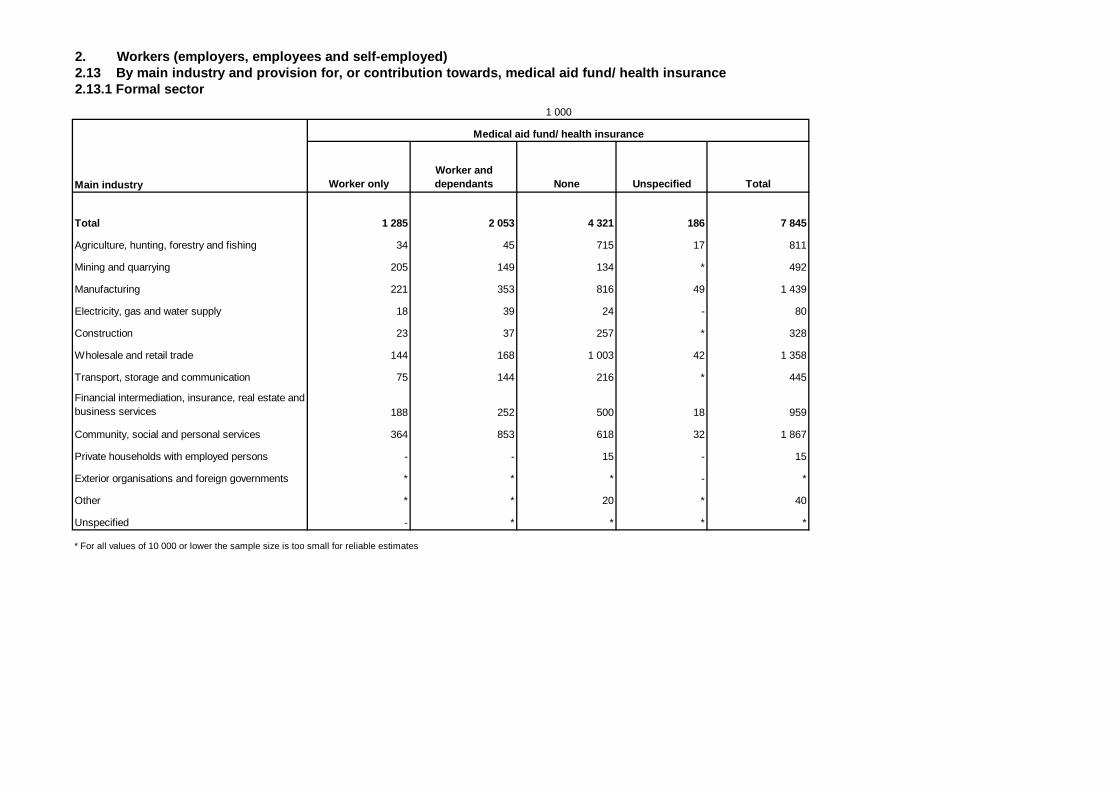
2. Workers (employers, employees and self-employed)2.13 By main industry and provision for, or contribution towards, medical aid fund/ health insurance2.13.1 Formal sector
Worker onlyWorker and dependants None Unspecified Total
Total 1 285 2 053 4 321 186 7 845
Agriculture, hunting, forestry and fishing 34 45 715 17 811
Mining and quarrying 205 149 134 * 492
Manufacturing 221 353 816 49 1 439
Electricity, gas and water supply 18 39 24 - 80
Construction 23 37 257 * 328
Wholesale and retail trade 144 168 1 003 42 1 358
Transport, storage and communication 75 144 216 * 445
Financial intermediation, insurance, real estate and business services 188 252 500 18 959
Community, social and personal services 364 853 618 32 1 867
Private households with employed persons - - 15 - 15
Exterior organisations and foreign governments * * * - *
Other * * 20 * 40
Unspecified - * * * *
* For all values of 10 000 or lower the sample size is too small for reliable estimates
1 000
Main industry
Medical aid fund/ health insurance
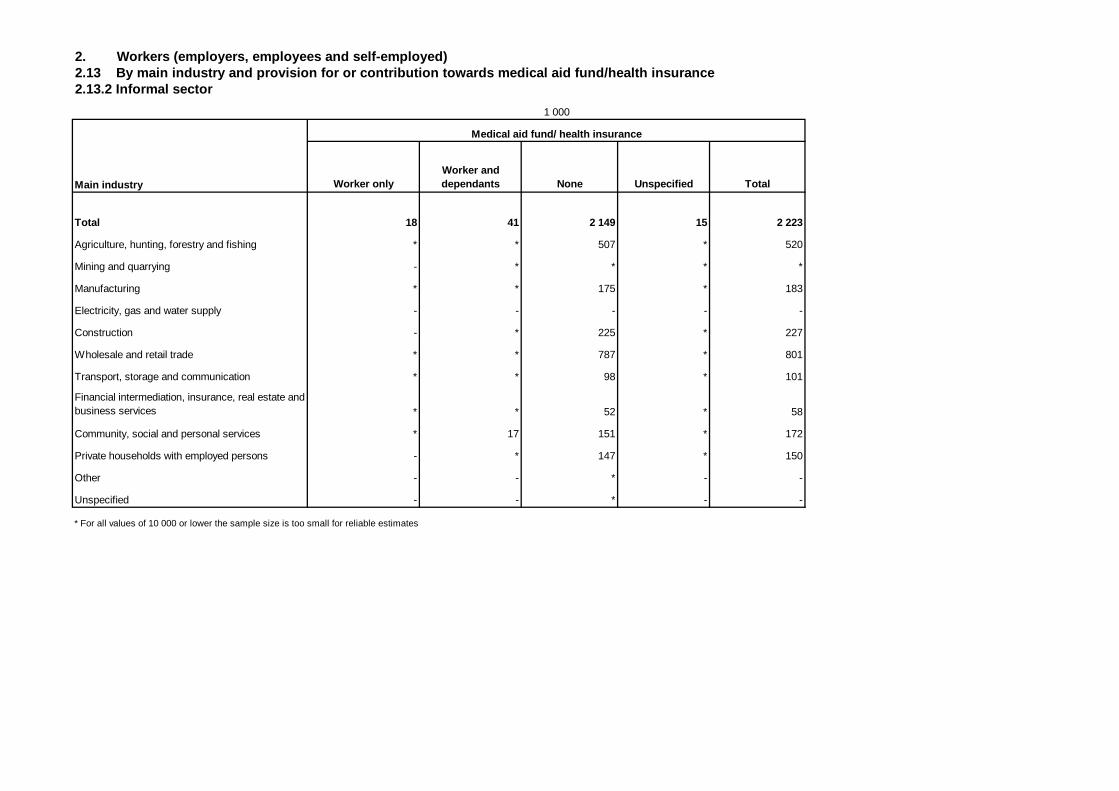
2. Workers (employers, employees and self-employed)2.13 By main industry and provision for or contribution towards medical aid fund/health insurance 2.13.2 Informal sector
Worker onlyWorker and dependants None Unspecified Total
Total 18 41 2 149 15 2 223
Agriculture, hunting, forestry and fishing * * 507 * 520
Mining and quarrying - * * * *
Manufacturing * * 175 * 183
Electricity, gas and water supply - - - - -
Construction - * 225 * 227
Wholesale and retail trade * * 787 * 801
Transport, storage and communication * * 98 * 101
Financial intermediation, insurance, real estate and business services * * 52 * 58
Community, social and personal services * 17 151 * 172
Private households with employed persons - * 147 * 150
Other - - * - -
Unspecified - - * - -
* For all values of 10 000 or lower the sample size is too small for reliable estimates
1 000
Main industry
Medical aid fund/ health insurance
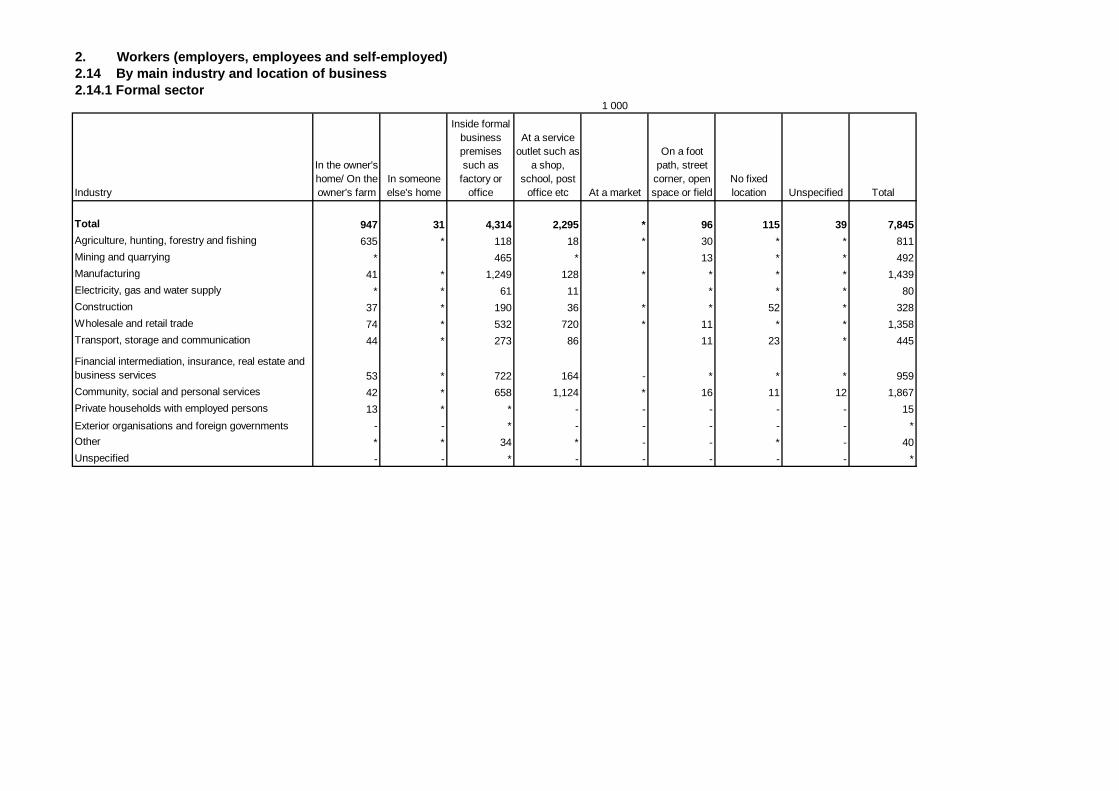
2. Workers (employers, employees and self-employed)2.14 By main industry and location of business2.14.1 Formal sector
Industry
In the owner's home/ On the owner's farm
In someone else's home
Inside formal business premises such as
factory or office
At a service outlet such as
a shop, school, post
office etc At a market
On a foot path, street
corner, open space or field
No fixed location Unspecified Total
Total 947 31 4,314 2,295 * 96 115 39 7,845Agriculture, hunting, forestry and fishing 635 * 118 18 * 30 * * 811
Mining and quarrying * 465 * 13 * * 492
Manufacturing 41 * 1,249 128 * * * * 1,439
Electricity, gas and water supply * * 61 11 * * * 80
Construction 37 * 190 36 * * 52 * 328
Wholesale and retail trade 74 * 532 720 * 11 * * 1,358
Transport, storage and communication 44 * 273 86 11 23 * 445
Financial intermediation, insurance, real estate and business services 53 * 722 164 - * * * 959
Community, social and personal services 42 * 658 1,124 * 16 11 12 1,867
Private households with employed persons 13 * * - - - - - 15
Exterior organisations and foreign governments - - * - - - - - *
Other * * 34 * - - * - 40
Unspecified - - * - - - - - *
1 000
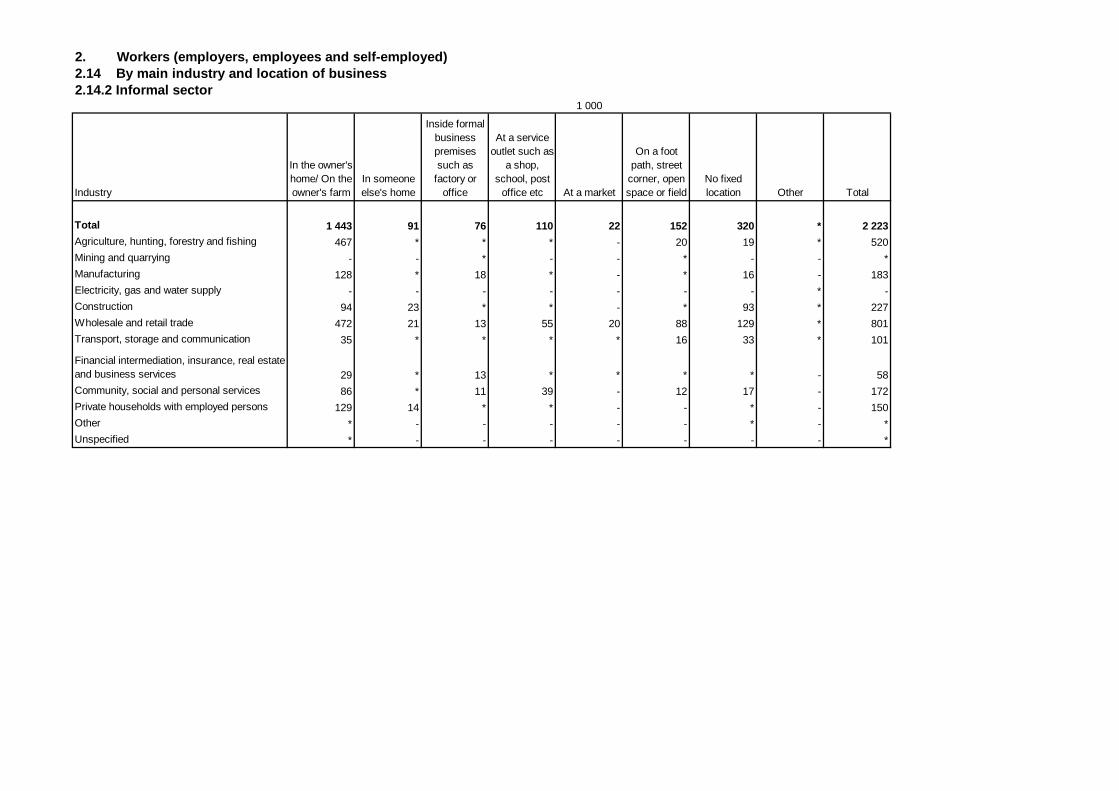
2. Workers (employers, employees and self-employed)2.14 By main industry and location of business2.14.2 Informal sector
Industry
In the owner's home/ On the owner's farm
In someone else's home
Inside formal business premises such as
factory or office
At a service outlet such as
a shop, school, post
office etc At a market
On a foot path, street
corner, open space or field
No fixed location Other Total
Total 1 443 91 76 110 22 152 320 * 2 223Agriculture, hunting, forestry and fishing 467 * * * - 20 19 * 520
Mining and quarrying - - * - - * - - *
Manufacturing 128 * 18 * - * 16 - 183
Electricity, gas and water supply - - - - - - - * -
Construction 94 23 * * - * 93 * 227
Wholesale and retail trade 472 21 13 55 20 88 129 * 801
Transport, storage and communication 35 * * * * 16 33 * 101
Financial intermediation, insurance, real estate and business services 29 * 13 * * * * - 58
Community, social and personal services 86 * 11 39 - 12 17 - 172
Private households with employed persons 129 14 * * - - * - 150
Other * - - - - - * - *
Unspecified * - - - - - - - *
1 000
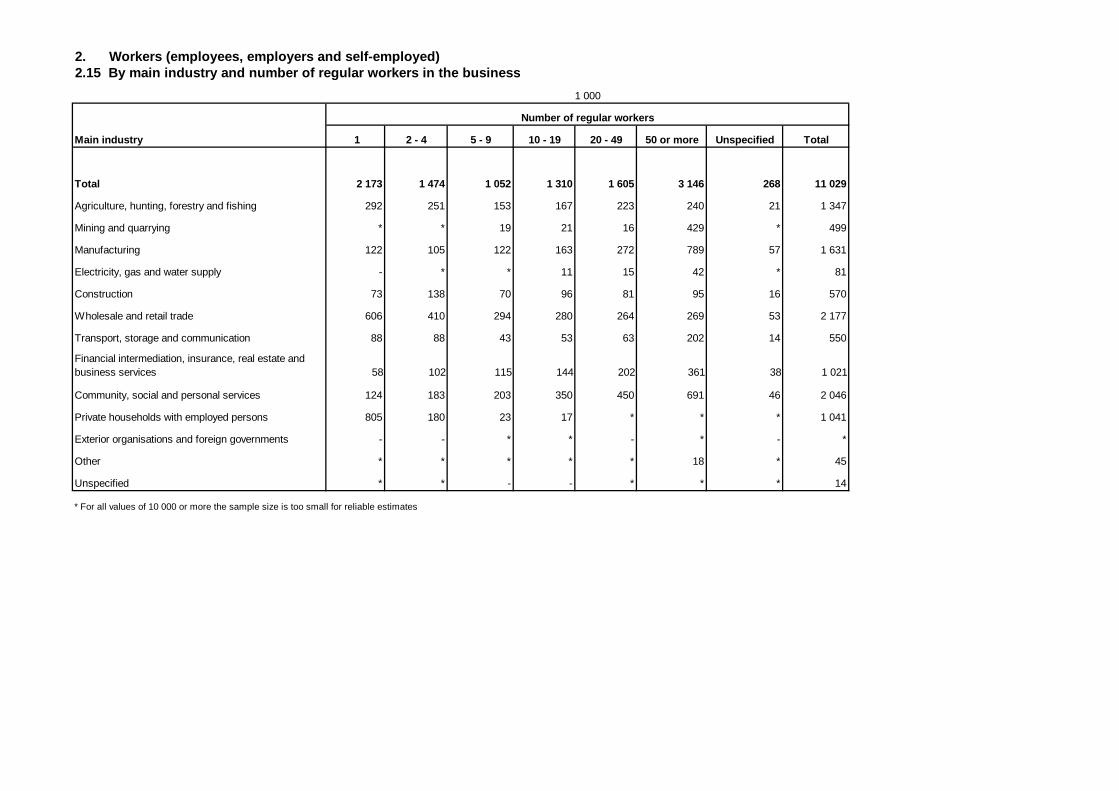
2. Workers (employees, employers and self-employed)2.15 By main industry and number of regular workers in the business
1 2 - 4 5 - 9 10 - 19 20 - 49 50 or more Unspecified Total
Total 2 173 1 474 1 052 1 310 1 605 3 146 268 11 029
Agriculture, hunting, forestry and fishing 292 251 153 167 223 240 21 1 347
Mining and quarrying * * 19 21 16 429 * 499
Manufacturing 122 105 122 163 272 789 57 1 631
Electricity, gas and water supply - * * 11 15 42 * 81
Construction 73 138 70 96 81 95 16 570
Wholesale and retail trade 606 410 294 280 264 269 53 2 177
Transport, storage and communication 88 88 43 53 63 202 14 550
Financial intermediation, insurance, real estate and business services 58 102 115 144 202 361 38 1 021
Community, social and personal services 124 183 203 350 450 691 46 2 046
Private households with employed persons 805 180 23 17 * * * 1 041
Exterior organisations and foreign governments - - * * - * - *
Other * * * * * 18 * 45
Unspecified * * - - * * * 14
* For all values of 10 000 or more the sample size is too small for reliable estimates
1 000
Main industry
Number of regular workers
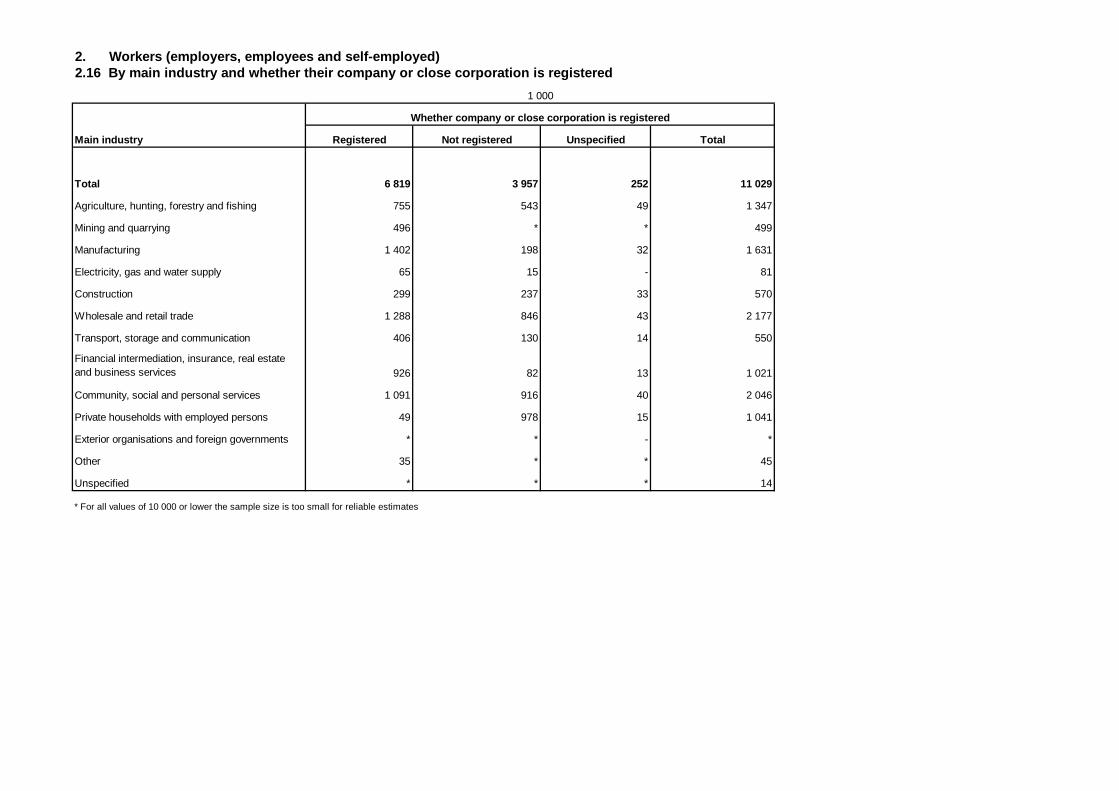
2. Workers (employers, employees and self-employed)2.16 By main industry and whether their company or close corporation is registered
Registered Not registered Unspecified Total
Total 6 819 3 957 252 11 029
Agriculture, hunting, forestry and fishing 755 543 49 1 347
Mining and quarrying 496 * * 499
Manufacturing 1 402 198 32 1 631
Electricity, gas and water supply 65 15 - 81
Construction 299 237 33 570
Wholesale and retail trade 1 288 846 43 2 177
Transport, storage and communication 406 130 14 550
Financial intermediation, insurance, real estate and business services 926 82 13 1 021
Community, social and personal services 1 091 916 40 2 046
Private households with employed persons 49 978 15 1 041
Exterior organisations and foreign governments * * - *
Other 35 * * 45
Unspecified * * * 14
* For all values of 10 000 or lower the sample size is too small for reliable estimates
1 000
Main industry
Whether company or close corporation is registered
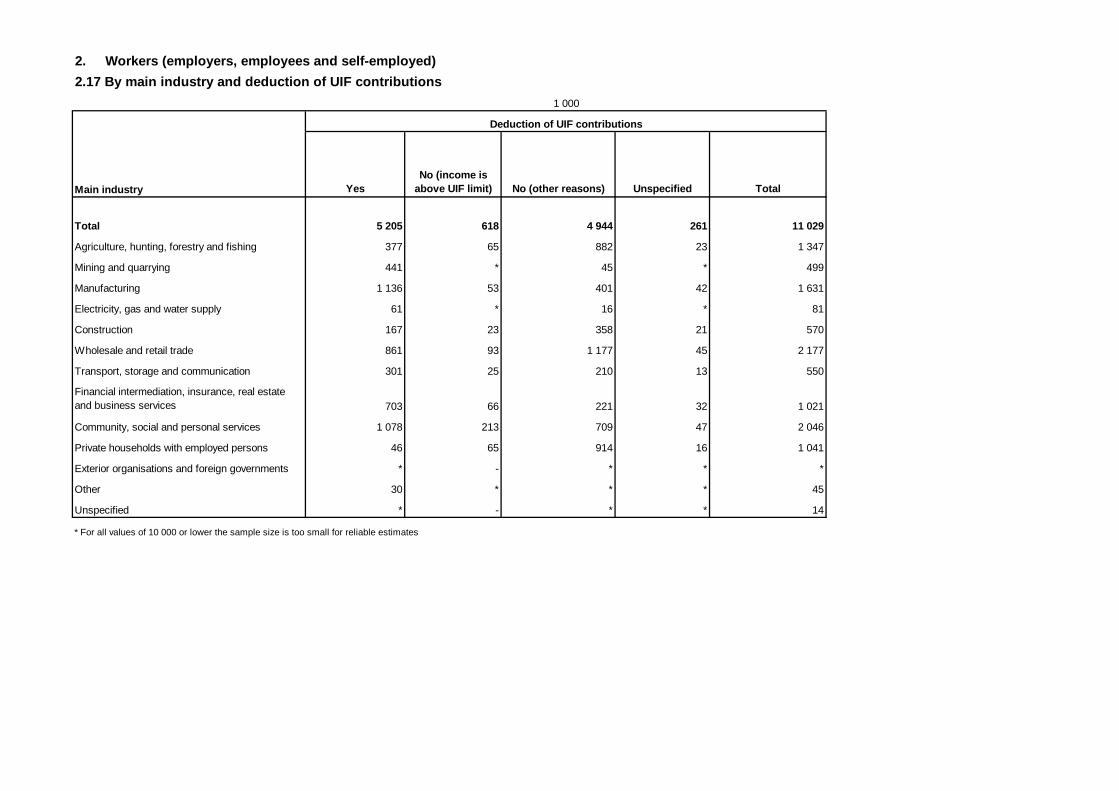
2. Workers (employers, employees and self-employed)
2.17 By main industry and deduction of UIF contributions
YesNo (income is
above UIF limit) No (other reasons) Unspecified Total
Total 5 205 618 4 944 261 11 029
Agriculture, hunting, forestry and fishing 377 65 882 23 1 347
Mining and quarrying 441 * 45 * 499
Manufacturing 1 136 53 401 42 1 631
Electricity, gas and water supply 61 * 16 * 81
Construction 167 23 358 21 570
Wholesale and retail trade 861 93 1 177 45 2 177
Transport, storage and communication 301 25 210 13 550
Financial intermediation, insurance, real estate and business services 703 66 221 32 1 021
Community, social and personal services 1 078 213 709 47 2 046
Private households with employed persons 46 65 914 16 1 041
Exterior organisations and foreign governments * - * * *
Other 30 * * * 45
Unspecified * - * * 14
* For all values of 10 000 or lower the sample size is too small for reliable estimates
1 000
Main industry
Deduction of UIF contributions
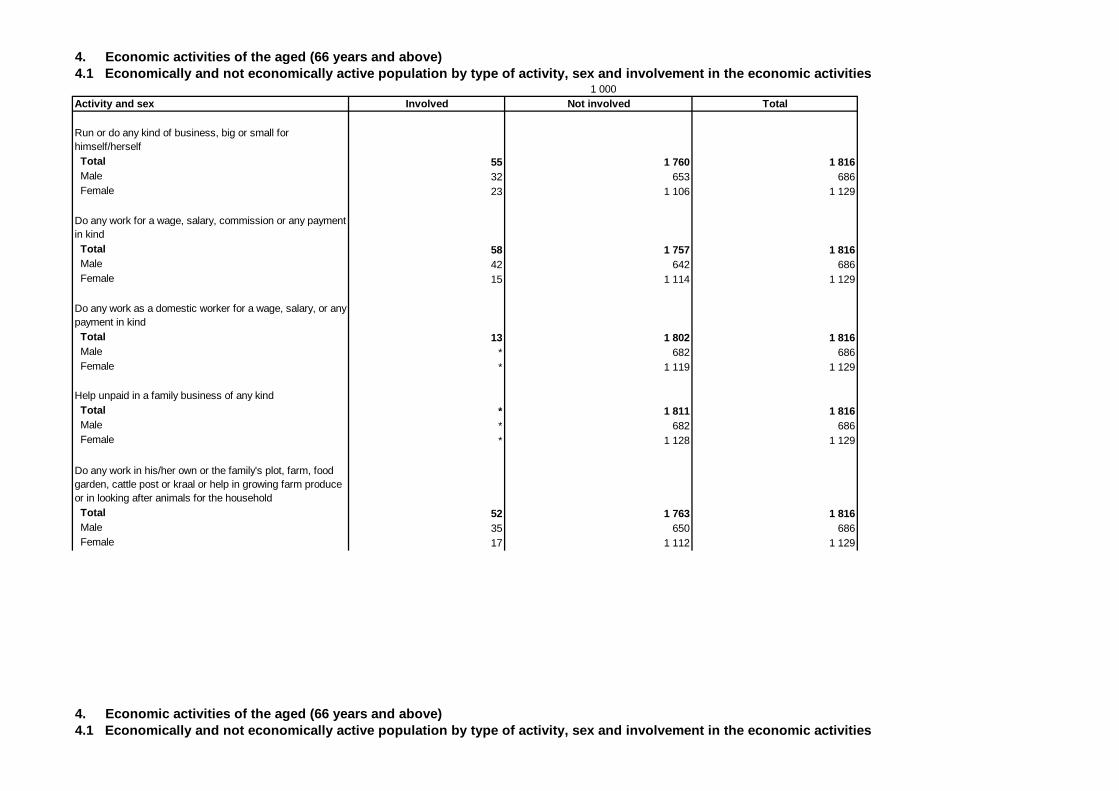
4. Economic activities of the aged (66 years and above)
Activity and sex Involved Not involved Total
Run or do any kind of business, big or small for himself/herself Total 55 1 760 1 816 Male 32 653 686 Female 23 1 106 1 129
Do any work for a wage, salary, commission or any payment in kind Total 58 1 757 1 816 Male 42 642 686 Female 15 1 114 1 129
Do any work as a domestic worker for a wage, salary, or any payment in kind Total 13 1 802 1 816 Male * 682 686 Female * 1 119 1 129
Help unpaid in a family business of any kind Total * 1 811 1 816 Male * 682 686 Female * 1 128 1 129
Do any work in his/her own or the family's plot, farm, food garden, cattle post or kraal or help in growing farm produce or in looking after animals for the household Total 52 1 763 1 816 Male 35 650 686 Female 17 1 112 1 129
4. Economic activities of the aged (66 years and above)
1 0004.1 Economically and not economically active population by type of activity, sex and involvement in the economic activities
4.1 Economically and not economically active population by type of activity, sex and involvement in the economic activities
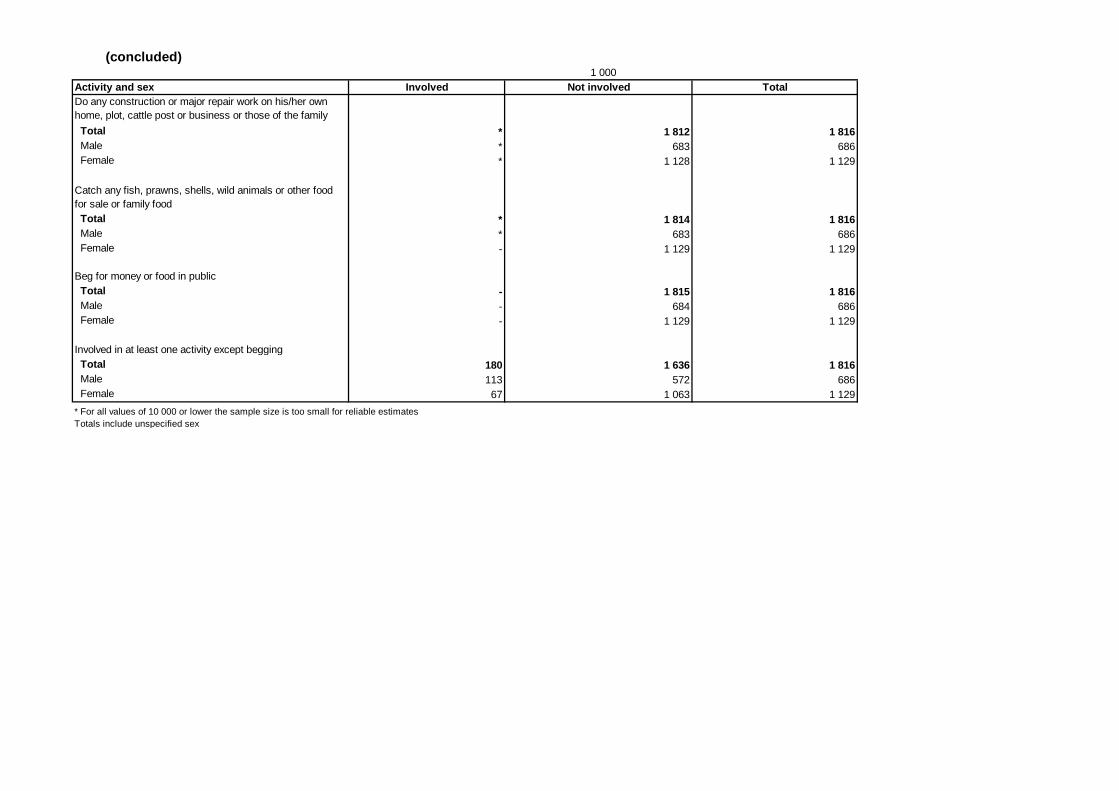
(concluded)
Activity and sex Involved Not involved TotalDo any construction or major repair work on his/her own home, plot, cattle post or business or those of the family
Total * 1 812 1 816 Male * 683 686 Female * 1 128 1 129
Catch any fish, prawns, shells, wild animals or other food for sale or family food Total * 1 814 1 816 Male * 683 686 Female - 1 129 1 129
Beg for money or food in public Total - 1 815 1 816 Male - 684 686 Female - 1 129 1 129
Involved in at least one activity except begging Total 180 1 636 1 816 Male 113 572 686 Female 67 1 063 1 129
Totals include unspecified sex* For all values of 10 000 or lower the sample size is too small for reliable estimates
1 000
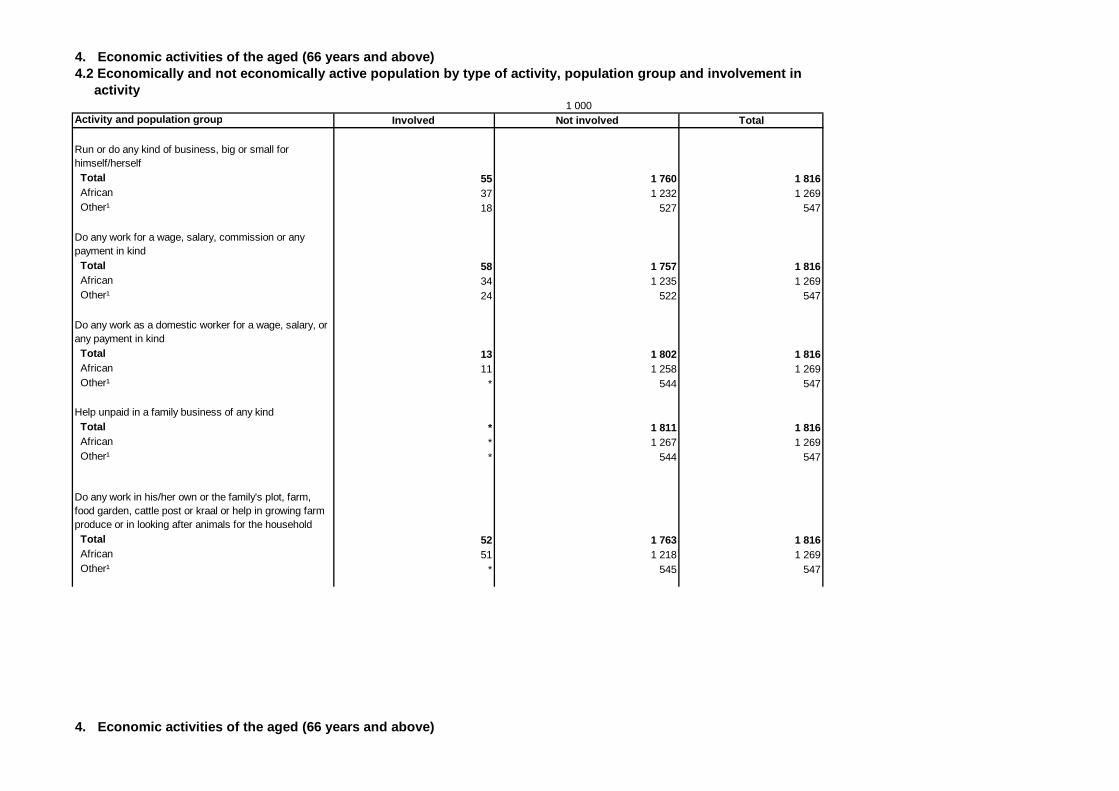
activity
Activity and population group Involved Not involved Total
Run or do any kind of business, big or small for himself/herself Total 55 1 760 1 816 African 37 1 232 1 269 Other¹ 18 527 547
Do any work for a wage, salary, commission or any payment in kind Total 58 1 757 1 816 African 34 1 235 1 269 Other¹ 24 522 547
Do any work as a domestic worker for a wage, salary, or any payment in kind Total 13 1 802 1 816 African 11 1 258 1 269 Other¹ * 544 547
Help unpaid in a family business of any kind Total * 1 811 1 816 African * 1 267 1 269 Other¹ * 544 547
Do any work in his/her own or the family's plot, farm, food garden, cattle post or kraal or help in growing farm produce or in looking after animals for the household Total 52 1 763 1 816 African 51 1 218 1 269 Other¹ * 545 547
4. Economic activities of the aged (66 years and above)4.2 Economically and not economically active population by type of activity, population group and involvement in
1 000
4. Economic activities of the aged (66 years and above)
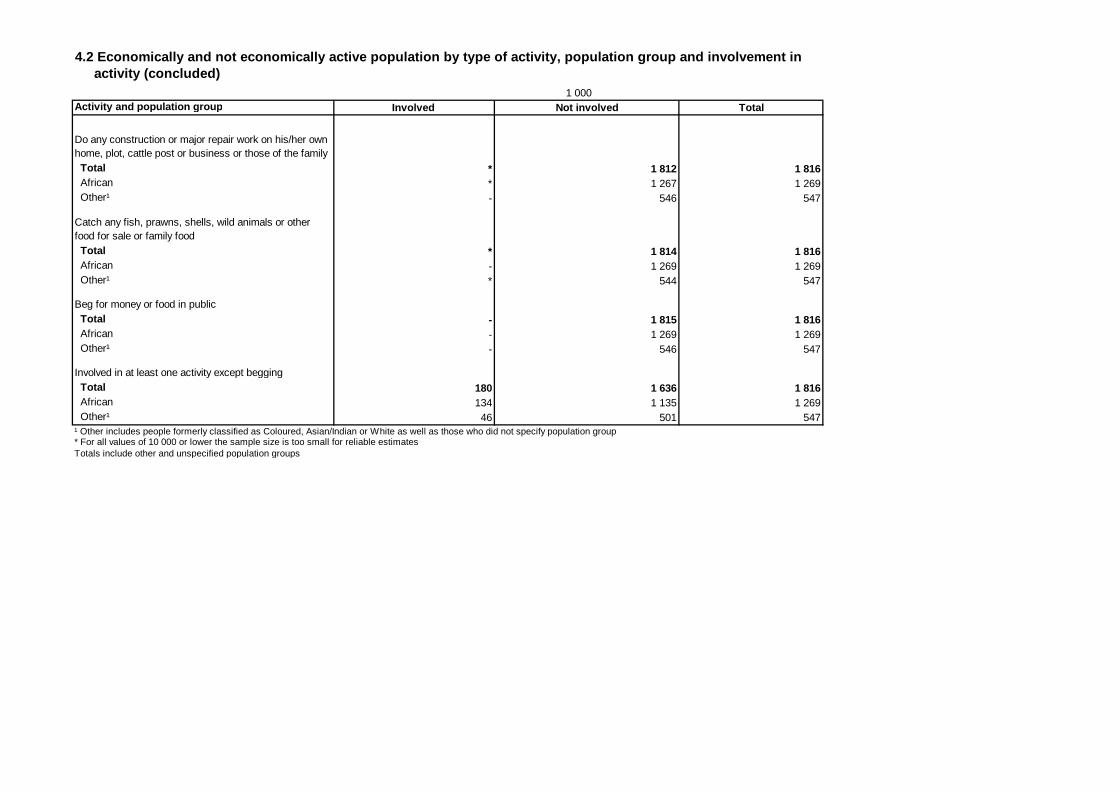
activity (concluded)
Activity and population group Involved Not involved Total
Do any construction or major repair work on his/her own home, plot, cattle post or business or those of the family Total * 1 812 1 816 African * 1 267 1 269 Other¹ - 546 547
Catch any fish, prawns, shells, wild animals or other food for sale or family food Total * 1 814 1 816 African - 1 269 1 269 Other¹ * 544 547
Beg for money or food in public Total - 1 815 1 816 African - 1 269 1 269 Other¹ - 546 547
Involved in at least one activity except begging Total 180 1 636 1 816 African 134 1 135 1 269 Other¹ 46 501 547
* For all values of 10 000 or lower the sample size is too small for reliable estimatesTotals include other and unspecified population groups
4.2 Economically and not economically active population by type of activity, population group and involvement in
1 000
¹ Other includes people formerly classified as Coloured, Asian/Indian or White as well as those who did not specify population group
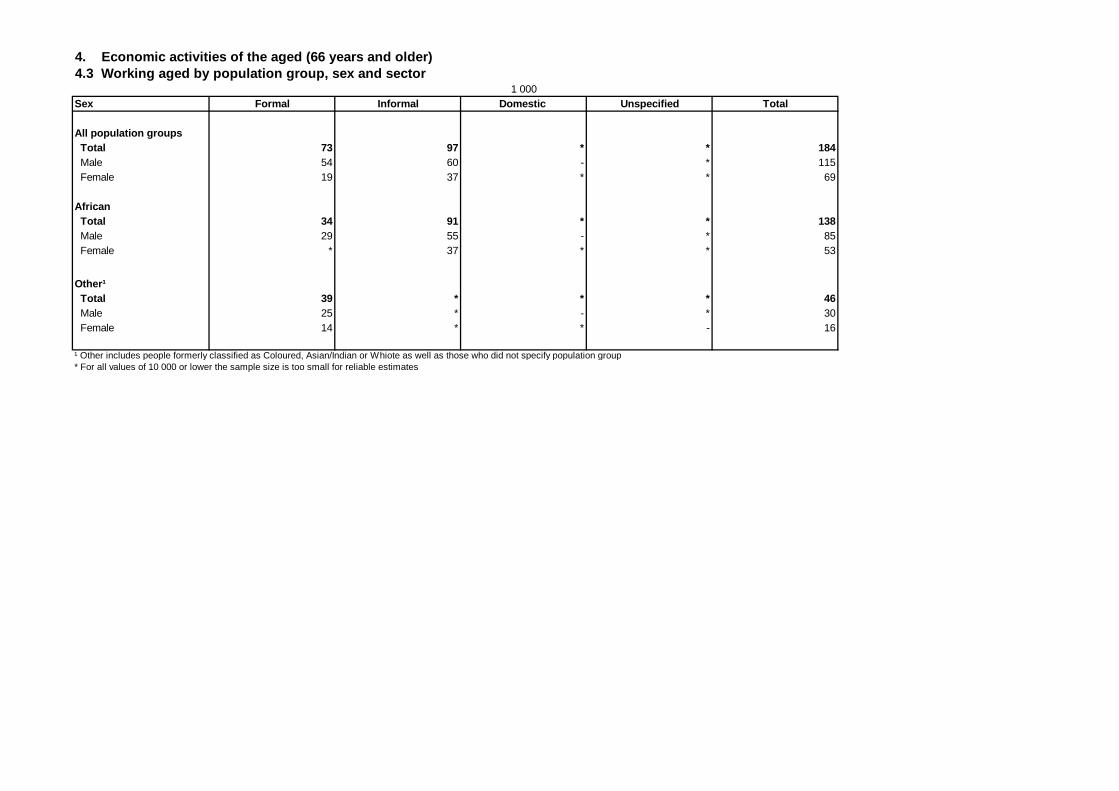
4. Economic activities of the aged (66 years and older)4.3 Working aged by population group, sex and sector
Sex Formal Informal Domestic Unspecified Total
All population groups Total 73 97 * * 184 Male 54 60 - * 115 Female 19 37 * * 69
African Total 34 91 * * 138 Male 29 55 - * 85 Female * 37 * * 53
Other¹ Total 39 * * * 46 Male 25 * - * 30 Female 14 * * - 16
¹ Other includes people formerly classified as Coloured, Asian/Indian or Whiote as well as those who did not specify population group* For all values of 10 000 or lower the sample size is too small for reliable estimates
1 000
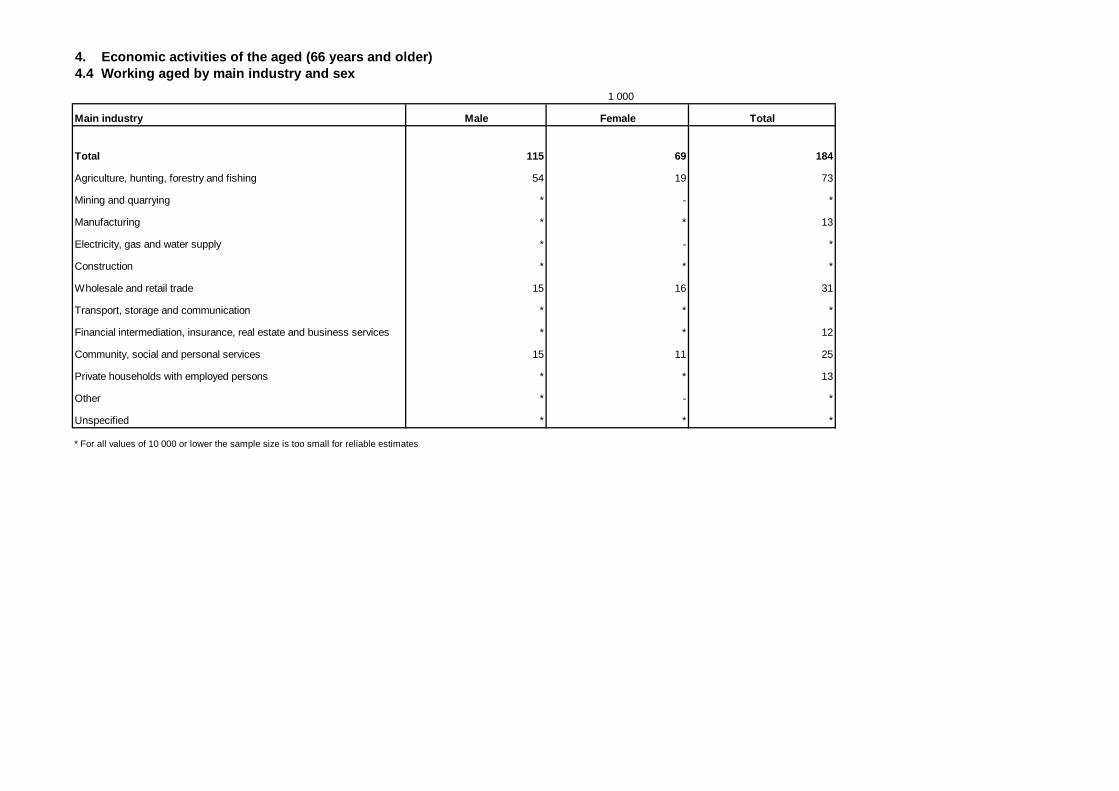
4. Economic activities of the aged (66 years and older)4.4 Working aged by main industry and sex
Main industry Male Female Total
Total 115 69 184
Agriculture, hunting, forestry and fishing 54 19 73
Mining and quarrying * - *
Manufacturing * * 13
Electricity, gas and water supply * - *
Construction * * *
Wholesale and retail trade 15 16 31
Transport, storage and communication * * *
Financial intermediation, insurance, real estate and business services * * 12
Community, social and personal services 15 11 25
Private households with employed persons * * 13
Other * - *
Unspecified * * *
* For all values of 10 000 or lower the sample size is too small for reliable estimates
1 000
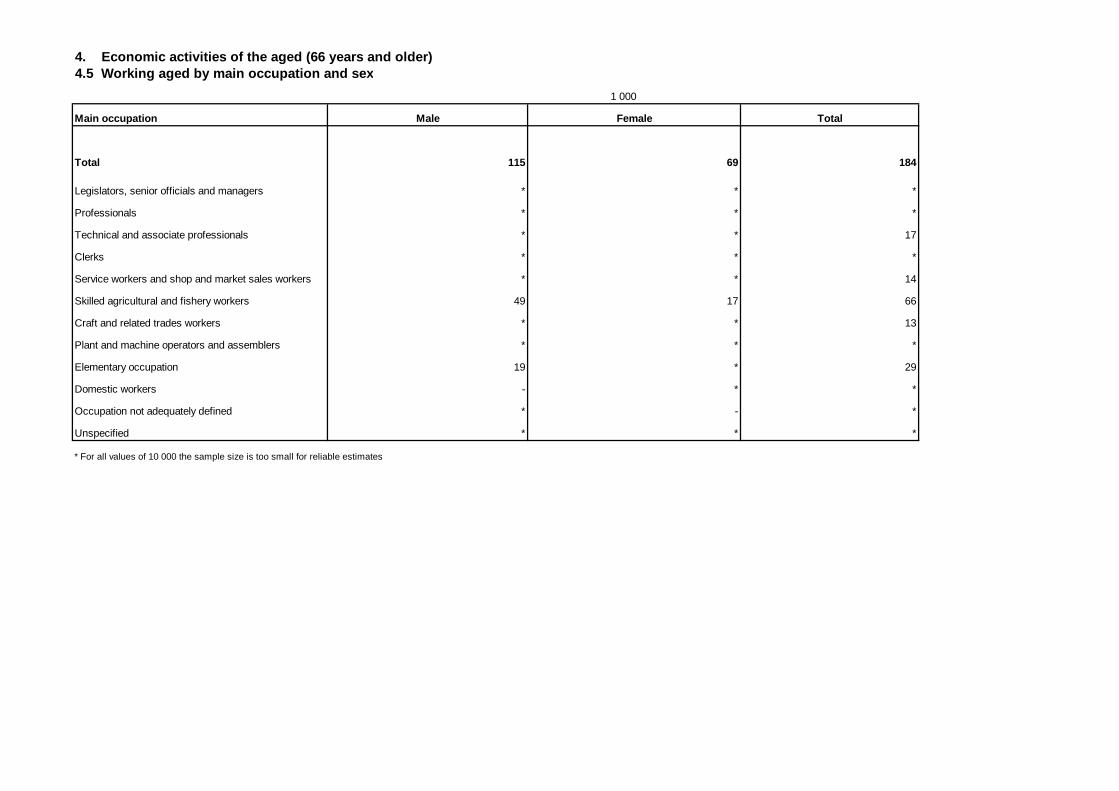
4. Economic activities of the aged (66 years and older)4.5 Working aged by main occupation and sex
Main occupation Male Female Total
Total 115 69 184
Legislators, senior officials and managers * * *
Professionals * * *
Technical and associate professionals * * 17
Clerks * * *
Service workers and shop and market sales workers * * 14
Skilled agricultural and fishery workers 49 17 66
Craft and related trades workers * * 13
Plant and machine operators and assemblers * * *
Elementary occupation 19 * 29
Domestic workers - * *
Occupation not adequately defined * - *
Unspecified * * *
* For all values of 10 000 the sample size is too small for reliable estimates
1 000
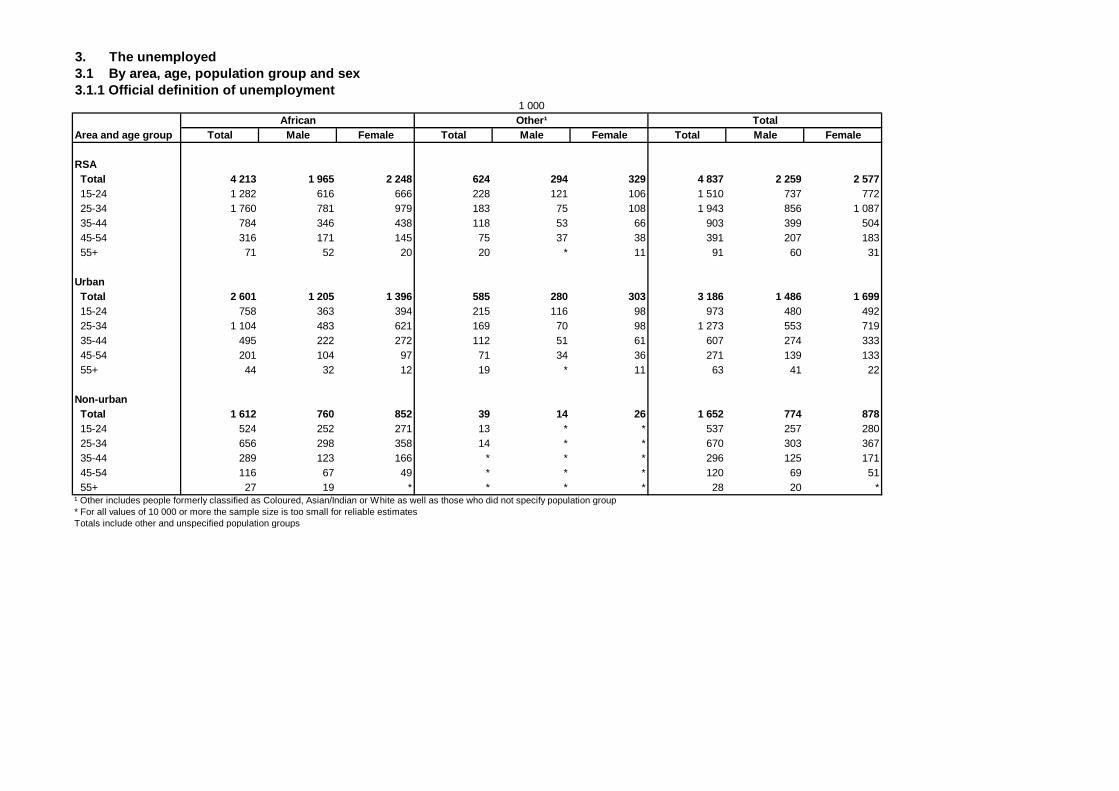
3. The unemployed3.1 By area, age, population group and sex3.1.1 Official definition of unemployment
Total Male Female Total Male Female Total Male Female
RSA Total 4 213 1 965 2 248 624 294 329 4 837 2 259 2 577 15-24 1 282 616 666 228 121 106 1 510 737 772 25-34 1 760 781 979 183 75 108 1 943 856 1 087 35-44 784 346 438 118 53 66 903 399 504 45-54 316 171 145 75 37 38 391 207 183 55+ 71 52 20 20 * 11 91 60 31
Urban Total 2 601 1 205 1 396 585 280 303 3 186 1 486 1 699 15-24 758 363 394 215 116 98 973 480 492 25-34 1 104 483 621 169 70 98 1 273 553 719 35-44 495 222 272 112 51 61 607 274 333 45-54 201 104 97 71 34 36 271 139 133 55+ 44 32 12 19 * 11 63 41 22
Non-urban Total 1 612 760 852 39 14 26 1 652 774 878 15-24 524 252 271 13 * * 537 257 280 25-34 656 298 358 14 * * 670 303 367 35-44 289 123 166 * * * 296 125 171 45-54 116 67 49 * * * 120 69 51 55+ 27 19 * * * * 28 20 *¹ Other includes people formerly classified as Coloured, Asian/Indian or White as well as those who did not specify population group* For all values of 10 000 or more the sample size is too small for reliable estimatesTotals include other and unspecified population groups
1 000
Area and age groupAfrican Other¹ Total
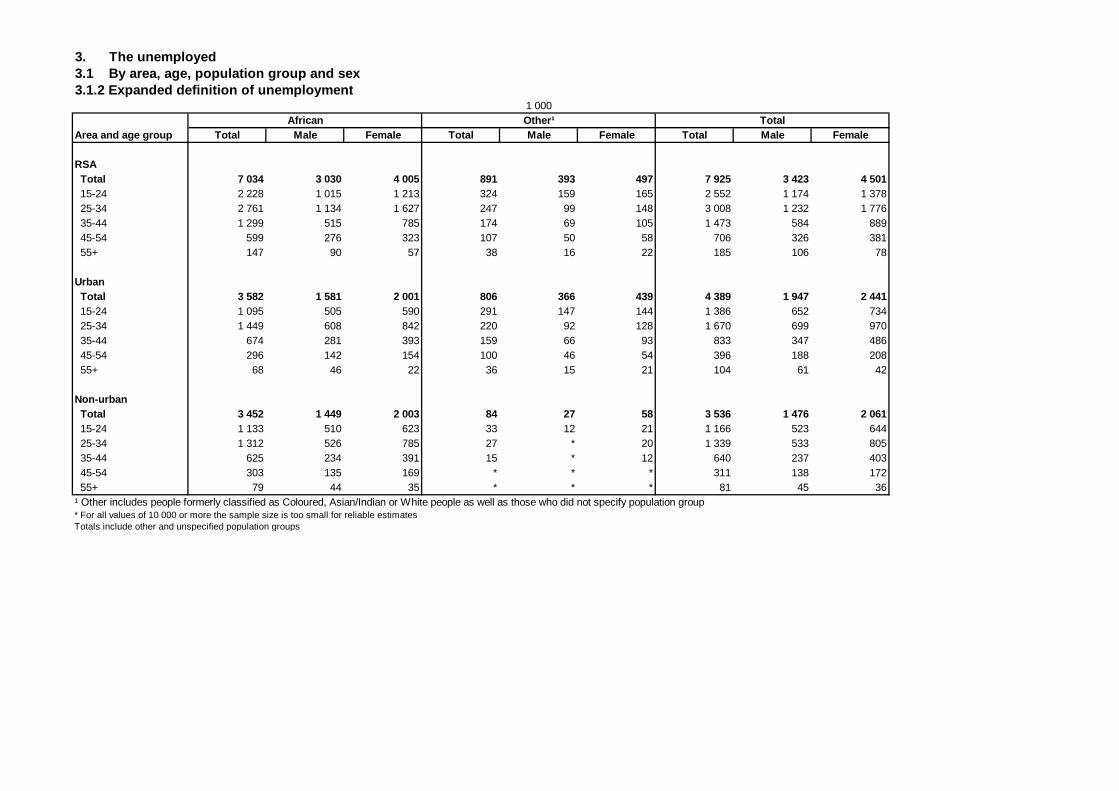
3. The unemployed3.1 By area, age, population group and sex3.1.2 Expanded definition of unemployment
Total Male Female Total Male Female Total Male Female
RSA Total 7 034 3 030 4 005 891 393 497 7 925 3 423 4 501 15-24 2 228 1 015 1 213 324 159 165 2 552 1 174 1 378 25-34 2 761 1 134 1 627 247 99 148 3 008 1 232 1 776 35-44 1 299 515 785 174 69 105 1 473 584 889 45-54 599 276 323 107 50 58 706 326 381 55+ 147 90 57 38 16 22 185 106 78
Urban Total 3 582 1 581 2 001 806 366 439 4 389 1 947 2 441 15-24 1 095 505 590 291 147 144 1 386 652 734 25-34 1 449 608 842 220 92 128 1 670 699 970 35-44 674 281 393 159 66 93 833 347 486 45-54 296 142 154 100 46 54 396 188 208 55+ 68 46 22 36 15 21 104 61 42
Non-urban Total 3 452 1 449 2 003 84 27 58 3 536 1 476 2 061 15-24 1 133 510 623 33 12 21 1 166 523 644 25-34 1 312 526 785 27 * 20 1 339 533 805 35-44 625 234 391 15 * 12 640 237 403 45-54 303 135 169 * * * 311 138 172 55+ 79 44 35 * * * 81 45 36¹ Other includes people formerly classified as Coloured, Asian/Indian or White people as well as those who did not specify population group* For all values of 10 000 or more the sample size is too small for reliable estimatesTotals include other and unspecified population groups
1 000
Area and age groupAfrican Other¹ Total
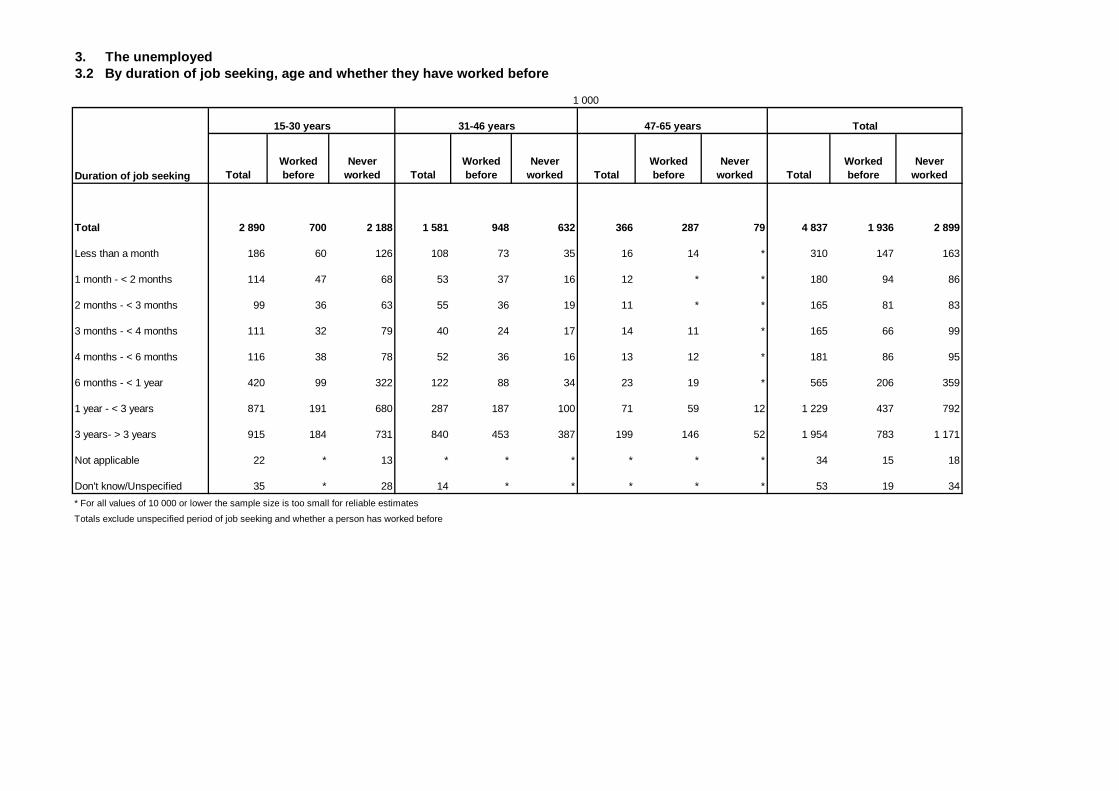
3. The unemployed3.2 By duration of job seeking, age and whether they have worked before
TotalWorked before
Never worked Total
Worked before
Never worked Total
Worked before
Never worked Total
Worked before
Never worked
Total 2 890 700 2 188 1 581 948 632 366 287 79 4 837 1 936 2 899
Less than a month 186 60 126 108 73 35 16 14 * 310 147 163
1 month - < 2 months 114 47 68 53 37 16 12 * * 180 94 86
2 months - < 3 months 99 36 63 55 36 19 11 * * 165 81 83
3 months - < 4 months 111 32 79 40 24 17 14 11 * 165 66 99
4 months - < 6 months 116 38 78 52 36 16 13 12 * 181 86 95
6 months - < 1 year 420 99 322 122 88 34 23 19 * 565 206 359
1 year - < 3 years 871 191 680 287 187 100 71 59 12 1 229 437 792
3 years- > 3 years 915 184 731 840 453 387 199 146 52 1 954 783 1 171
Not applicable 22 * 13 * * * * * * 34 15 18
Don't know/Unspecified 35 * 28 14 * * * * * 53 19 34
* For all values of 10 000 or lower the sample size is too small for reliable estimates
Totals exclude unspecified period of job seeking and whether a person has worked before
1 000
Duration of job seeking
15-30 years 31-46 years 47-65 years Total
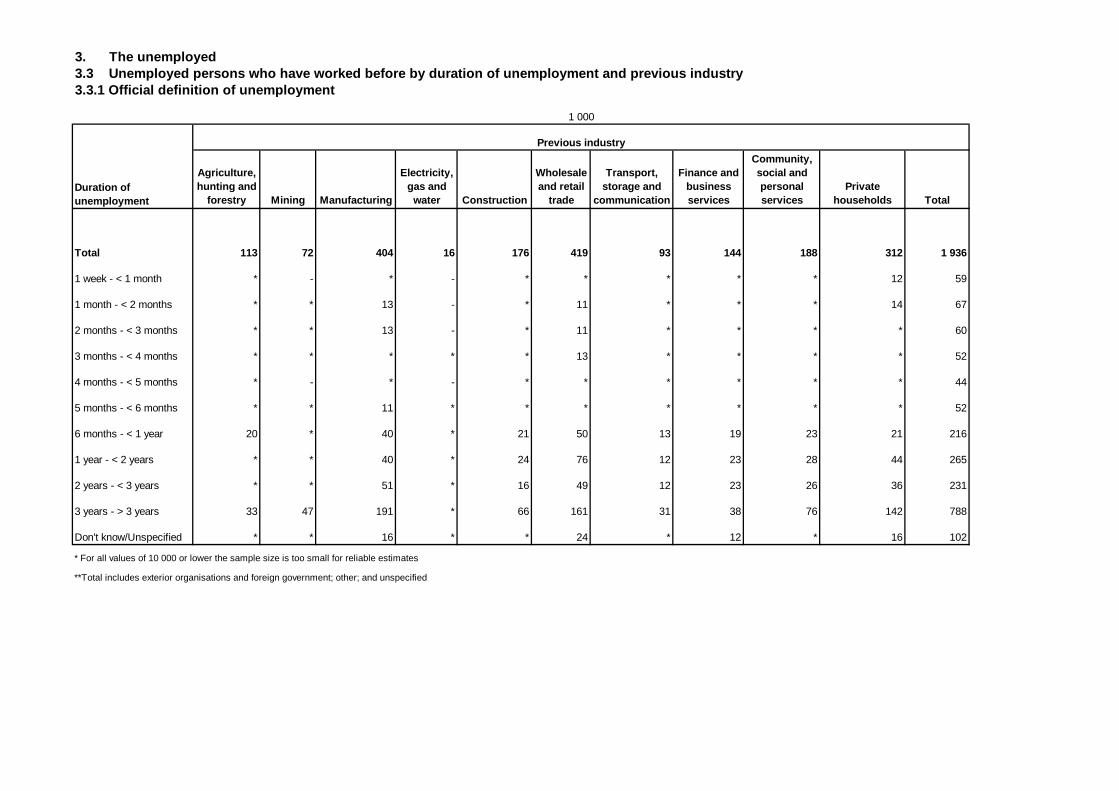
3. The unemployed3.3 Unemployed persons who have worked before by duration of unemployment and previous industry 3.3.1 Official definition of unemployment
Agriculture, hunting and
forestry Mining Manufacturing
Electricity, gas and
water Construction
Wholesale and retail
trade
Transport, storage and
communication
Finance and business services
Community, social and personal services
Private households Total
Total 113 72 404 16 176 419 93 144 188 312 1 936
1 week - < 1 month * - * - * * * * * 12 59
1 month - < 2 months * * 13 - * 11 * * * 14 67
2 months - < 3 months * * 13 - * 11 * * * * 60
3 months - < 4 months * * * * * 13 * * * * 52
4 months - < 5 months * - * - * * * * * * 44
5 months - < 6 months * * 11 * * * * * * * 52
6 months - < 1 year 20 * 40 * 21 50 13 19 23 21 216
1 year - < 2 years * * 40 * 24 76 12 23 28 44 265
2 years - < 3 years * * 51 * 16 49 12 23 26 36 231
3 years - > 3 years 33 47 191 * 66 161 31 38 76 142 788
Don't know/Unspecified * * 16 * * 24 * 12 * 16 102
* For all values of 10 000 or lower the sample size is too small for reliable estimates
**Total includes exterior organisations and foreign government; other; and unspecified
1 000
Duration of unemployment
Previous industry
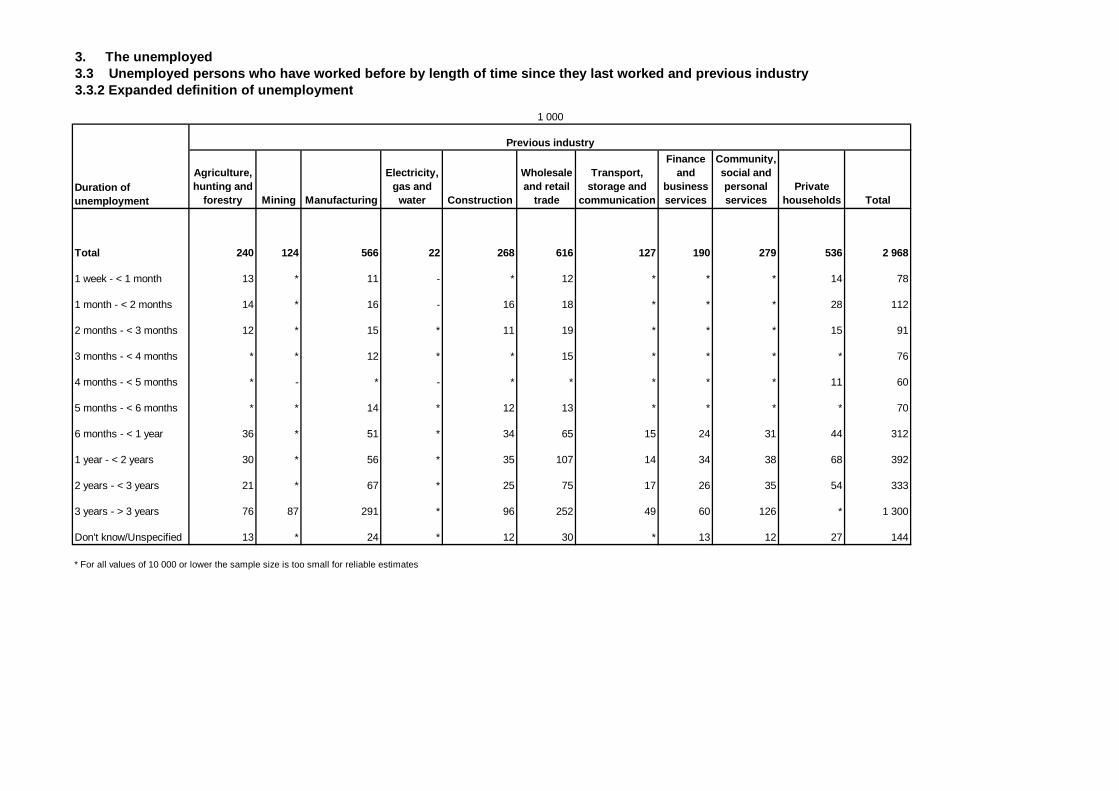
3. The unemployed3.3 Unemployed persons who have worked before by length of time since they last worked and previous industry 3.3.2 Expanded definition of unemployment
Agriculture, hunting and
forestry Mining Manufacturing
Electricity, gas and
water Construction
Wholesale and retail
trade
Transport, storage and
communication
Finance and
business services
Community, social and personal services
Private households Total
Total 240 124 566 22 268 616 127 190 279 536 2 968
1 week - < 1 month 13 * 11 - * 12 * * * 14 78
1 month - < 2 months 14 * 16 - 16 18 * * * 28 112
2 months - < 3 months 12 * 15 * 11 19 * * * 15 91
3 months - < 4 months * * 12 * * 15 * * * * 76
4 months - < 5 months * - * - * * * * * 11 60
5 months - < 6 months * * 14 * 12 13 * * * * 70
6 months - < 1 year 36 * 51 * 34 65 15 24 31 44 312
1 year - < 2 years 30 * 56 * 35 107 14 34 38 68 392
2 years - < 3 years 21 * 67 * 25 75 17 26 35 54 333
3 years - > 3 years 76 87 291 * 96 252 49 60 126 * 1 300
Don't know/Unspecified 13 * 24 * 12 30 * 13 12 27 144
* For all values of 10 000 or lower the sample size is too small for reliable estimates
1 000
Duration of unemployment
Previous industry
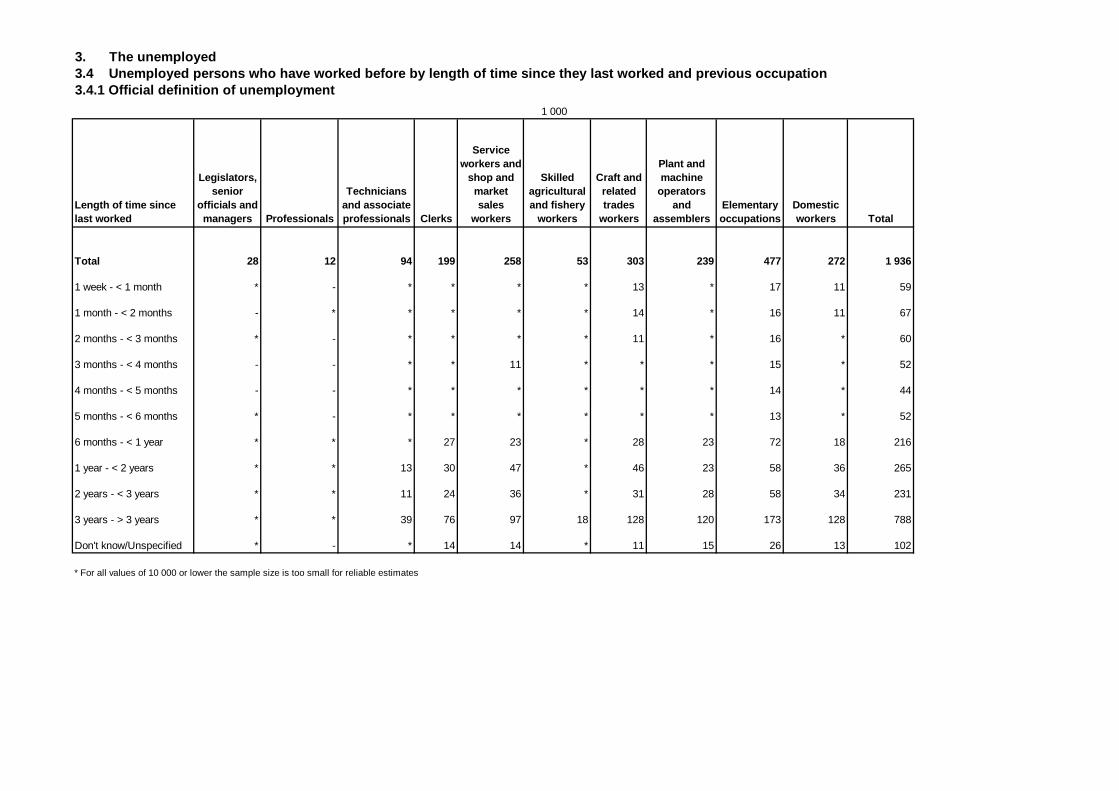
3. The unemployed3.4 Unemployed persons who have worked before by length of time since they last worked and previous occupation 3.4.1 Official definition of unemployment
Length of time since last worked
Legislators, senior
officials and managers Professionals
Technicians and associate professionals Clerks
Service workers and
shop and market sales
workers
Skilled agricultural and fishery
workers
Craft and related trades
workers
Plant and machine
operators and
assemblersElementary occupations
Domestic workers Total
Total 28 12 94 199 258 53 303 239 477 272 1 936
1 week - < 1 month * - * * * * 13 * 17 11 59
1 month - < 2 months - * * * * * 14 * 16 11 67
2 months - < 3 months * - * * * * 11 * 16 * 60
3 months - < 4 months - - * * 11 * * * 15 * 52
4 months - < 5 months - - * * * * * * 14 * 44
5 months - < 6 months * - * * * * * * 13 * 52
6 months - < 1 year * * * 27 23 * 28 23 72 18 216
1 year - < 2 years * * 13 30 47 * 46 23 58 36 265
2 years - < 3 years * * 11 24 36 * 31 28 58 34 231
3 years - > 3 years * * 39 76 97 18 128 120 173 128 788
Don't know/Unspecified * - * 14 14 * 11 15 26 13 102
* For all values of 10 000 or lower the sample size is too small for reliable estimates
1 000
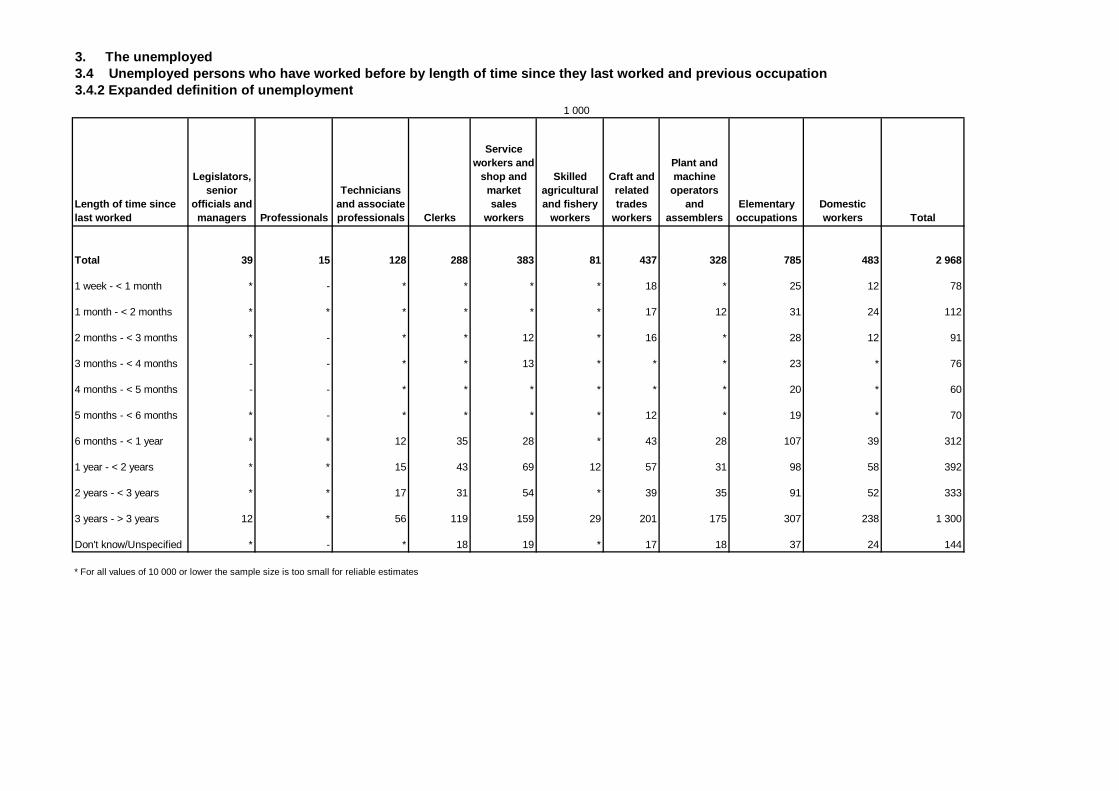
3. The unemployed3.4 Unemployed persons who have worked before by length of time since they last worked and previous occupation 3.4.2 Expanded definition of unemployment
Length of time since last worked
Legislators, senior
officials and managers Professionals
Technicians and associate professionals Clerks
Service workers and
shop and market sales
workers
Skilled agricultural and fishery
workers
Craft and related trades
workers
Plant and machine
operators and
assemblersElementary occupations
Domestic workers Total
Total 39 15 128 288 383 81 437 328 785 483 2 968
1 week - < 1 month * - * * * * 18 * 25 12 78
1 month - < 2 months * * * * * * 17 12 31 24 112
2 months - < 3 months * - * * 12 * 16 * 28 12 91
3 months - < 4 months - - * * 13 * * * 23 * 76
4 months - < 5 months - - * * * * * * 20 * 60
5 months - < 6 months * - * * * * 12 * 19 * 70
6 months - < 1 year * * 12 35 28 * 43 28 107 39 312
1 year - < 2 years * * 15 43 69 12 57 31 98 58 392
2 years - < 3 years * * 17 31 54 * 39 35 91 52 333
3 years - > 3 years 12 * 56 119 159 29 201 175 307 238 1 300
Don't know/Unspecified * - * 18 19 * 17 18 37 24 144
* For all values of 10 000 or lower the sample size is too small for reliable estimates
1 000
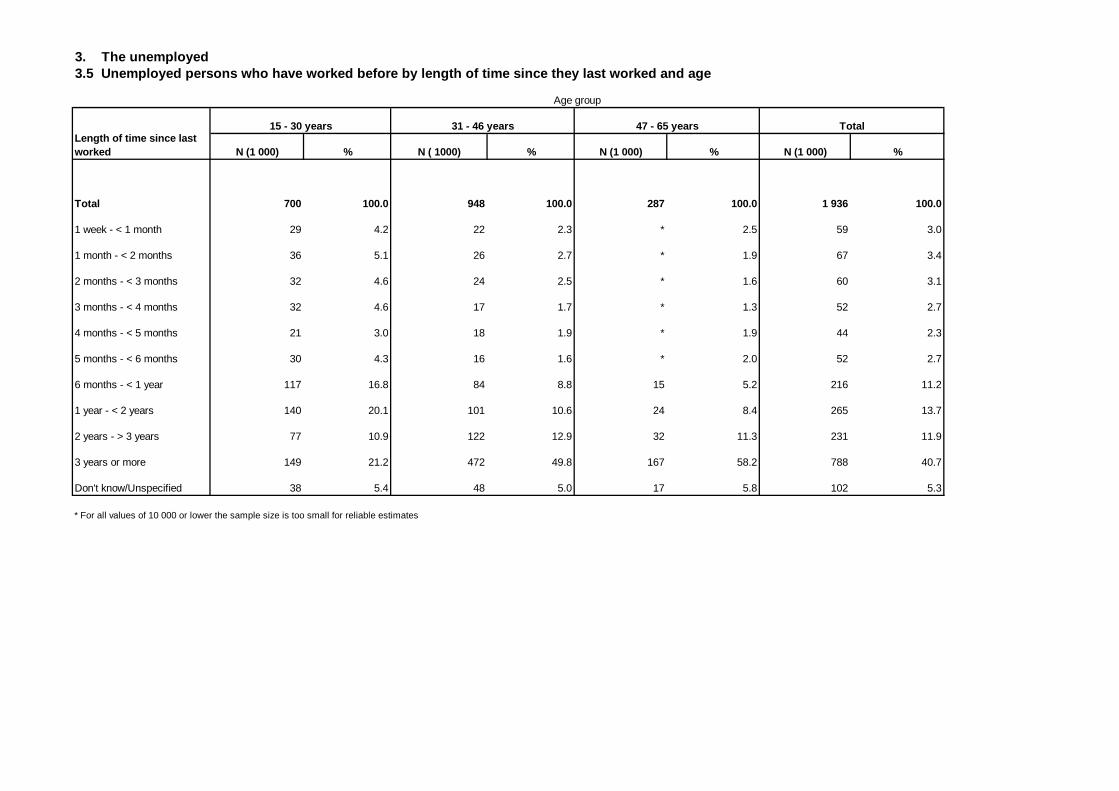
3. The unemployed3.5 Unemployed persons who have worked before by length of time since they last worked and age
N (1 000) % N ( 1000) % N (1 000) % N (1 000) %
Total 700 100.0 948 100.0 287 100.0 1 936 100.0
1 week - < 1 month 29 4.2 22 2.3 * 2.5 59 3.0
1 month - < 2 months 36 5.1 26 2.7 * 1.9 67 3.4
2 months - < 3 months 32 4.6 24 2.5 * 1.6 60 3.1
3 months - < 4 months 32 4.6 17 1.7 * 1.3 52 2.7
4 months - < 5 months 21 3.0 18 1.9 * 1.9 44 2.3
5 months - < 6 months 30 4.3 16 1.6 * 2.0 52 2.7
6 months - < 1 year 117 16.8 84 8.8 15 5.2 216 11.2
1 year - < 2 years 140 20.1 101 10.6 24 8.4 265 13.7
2 years - > 3 years 77 10.9 122 12.9 32 11.3 231 11.9
3 years or more 149 21.2 472 49.8 167 58.2 788 40.7
Don't know/Unspecified 38 5.4 48 5.0 17 5.8 102 5.3
* For all values of 10 000 or lower the sample size is too small for reliable estimates
Age group
Length of time since last worked
15 - 30 years 31 - 46 years 47 - 65 years Total
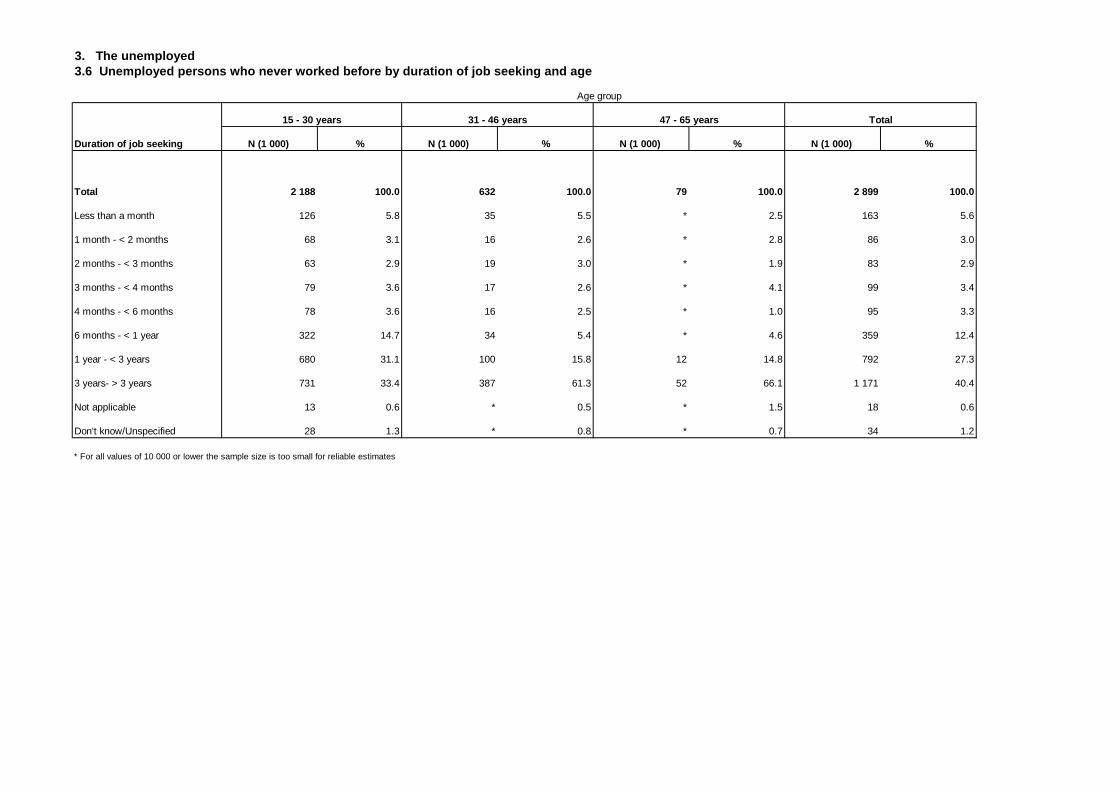
3. The unemployed3.6 Unemployed persons who never worked before by duration of job seeking and age
N (1 000) % N (1 000) % N (1 000) % N (1 000) %
Total 2 188 100.0 632 100.0 79 100.0 2 899 100.0
Less than a month 126 5.8 35 5.5 * 2.5 163 5.6
1 month - < 2 months 68 3.1 16 2.6 * 2.8 86 3.0
2 months - < 3 months 63 2.9 19 3.0 * 1.9 83 2.9
3 months - < 4 months 79 3.6 17 2.6 * 4.1 99 3.4
4 months - < 6 months 78 3.6 16 2.5 * 1.0 95 3.3
6 months - < 1 year 322 14.7 34 5.4 * 4.6 359 12.4
1 year - < 3 years 680 31.1 100 15.8 12 14.8 792 27.3
3 years- > 3 years 731 33.4 387 61.3 52 66.1 1 171 40.4
Not applicable 13 0.6 * 0.5 * 1.5 18 0.6
Don't know/Unspecified 28 1.3 * 0.8 * 0.7 34 1.2
* For all values of 10 000 or lower the sample size is too small for reliable estimates
Age group
Duration of job seeking
15 - 30 years 31 - 46 years 47 - 65 years Total
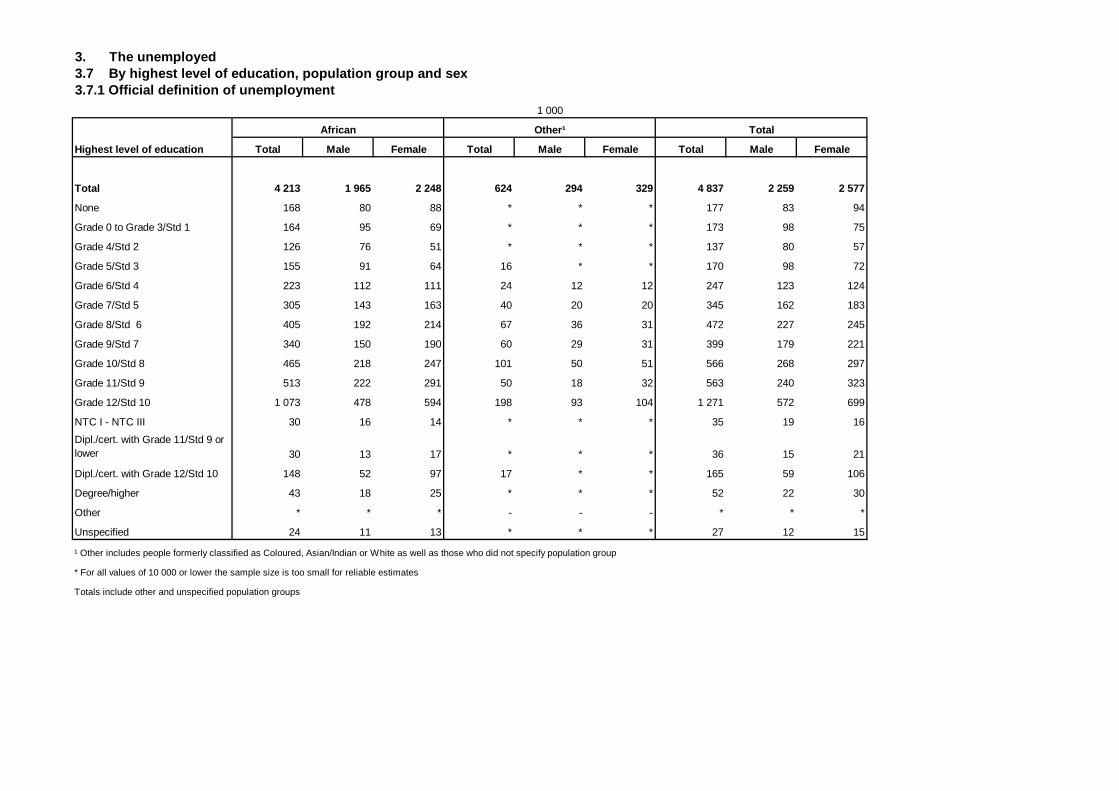
3. The unemployed3.7 By highest level of education, population group and sex 3.7.1 Official definition of unemployment
Total Male Female Total Male Female Total Male Female
Total 4 213 1 965 2 248 624 294 329 4 837 2 259 2 577
None 168 80 88 * * * 177 83 94
Grade 0 to Grade 3/Std 1 164 95 69 * * * 173 98 75
Grade 4/Std 2 126 76 51 * * * 137 80 57
Grade 5/Std 3 155 91 64 16 * * 170 98 72
Grade 6/Std 4 223 112 111 24 12 12 247 123 124
Grade 7/Std 5 305 143 163 40 20 20 345 162 183
Grade 8/Std 6 405 192 214 67 36 31 472 227 245
Grade 9/Std 7 340 150 190 60 29 31 399 179 221
Grade 10/Std 8 465 218 247 101 50 51 566 268 297
Grade 11/Std 9 513 222 291 50 18 32 563 240 323
Grade 12/Std 10 1 073 478 594 198 93 104 1 271 572 699
NTC I - NTC III 30 16 14 * * * 35 19 16
Dipl./cert. with Grade 11/Std 9 or lower 30 13 17 * * * 36 15 21
Dipl./cert. with Grade 12/Std 10 148 52 97 17 * * 165 59 106
Degree/higher 43 18 25 * * * 52 22 30
Other * * * - - - * * *
Unspecified 24 11 13 * * * 27 12 15
¹ Other includes people formerly classified as Coloured, Asian/Indian or White as well as those who did not specify population group
* For all values of 10 000 or lower the sample size is too small for reliable estimates
Totals include other and unspecified population groups
1 000
Highest level of education
African Other¹ Total
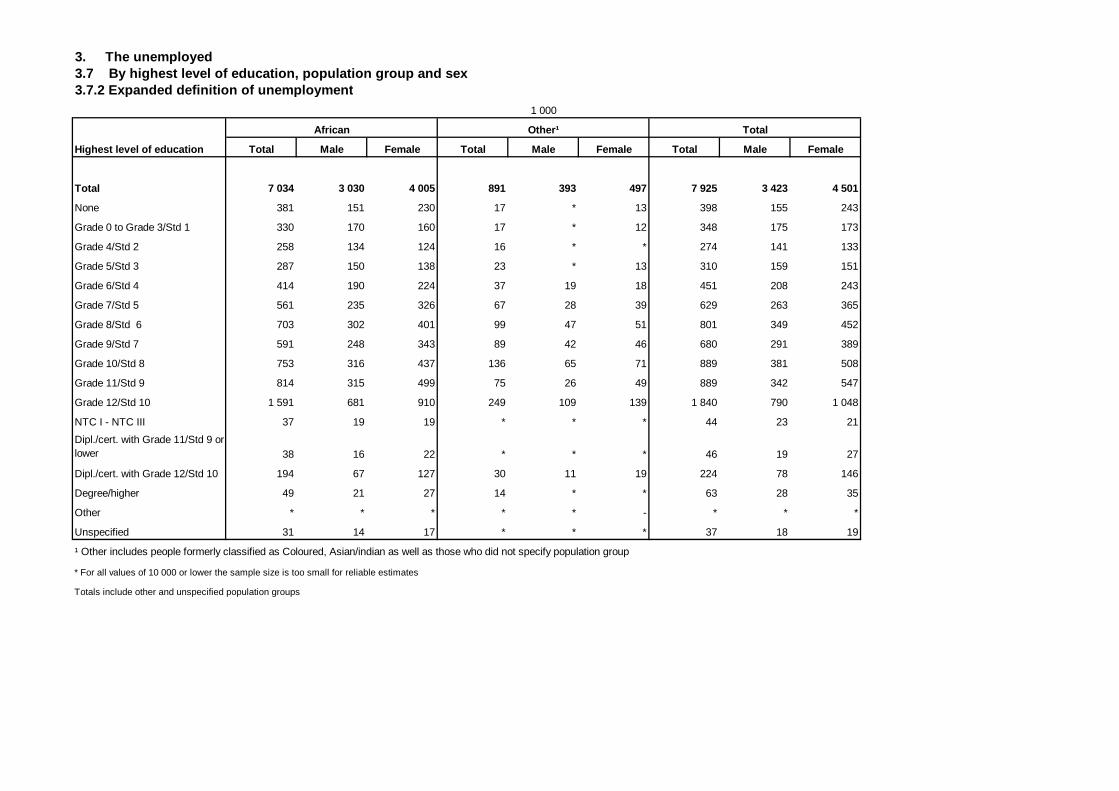
3. The unemployed3.7 By highest level of education, population group and sex 3.7.2 Expanded definition of unemployment
Total Male Female Total Male Female Total Male Female
Total 7 034 3 030 4 005 891 393 497 7 925 3 423 4 501
None 381 151 230 17 * 13 398 155 243
Grade 0 to Grade 3/Std 1 330 170 160 17 * 12 348 175 173
Grade 4/Std 2 258 134 124 16 * * 274 141 133
Grade 5/Std 3 287 150 138 23 * 13 310 159 151
Grade 6/Std 4 414 190 224 37 19 18 451 208 243
Grade 7/Std 5 561 235 326 67 28 39 629 263 365
Grade 8/Std 6 703 302 401 99 47 51 801 349 452
Grade 9/Std 7 591 248 343 89 42 46 680 291 389
Grade 10/Std 8 753 316 437 136 65 71 889 381 508
Grade 11/Std 9 814 315 499 75 26 49 889 342 547
Grade 12/Std 10 1 591 681 910 249 109 139 1 840 790 1 048
NTC I - NTC III 37 19 19 * * * 44 23 21
Dipl./cert. with Grade 11/Std 9 or lower 38 16 22 * * * 46 19 27
Dipl./cert. with Grade 12/Std 10 194 67 127 30 11 19 224 78 146
Degree/higher 49 21 27 14 * * 63 28 35
Other * * * * * - * * *
Unspecified 31 14 17 * * * 37 18 19
¹ Other includes people formerly classified as Coloured, Asian/indian as well as those who did not specify population group
* For all values of 10 000 or lower the sample size is too small for reliable estimates
Totals include other and unspecified population groups
1 000
Highest level of education
African Other¹ Total
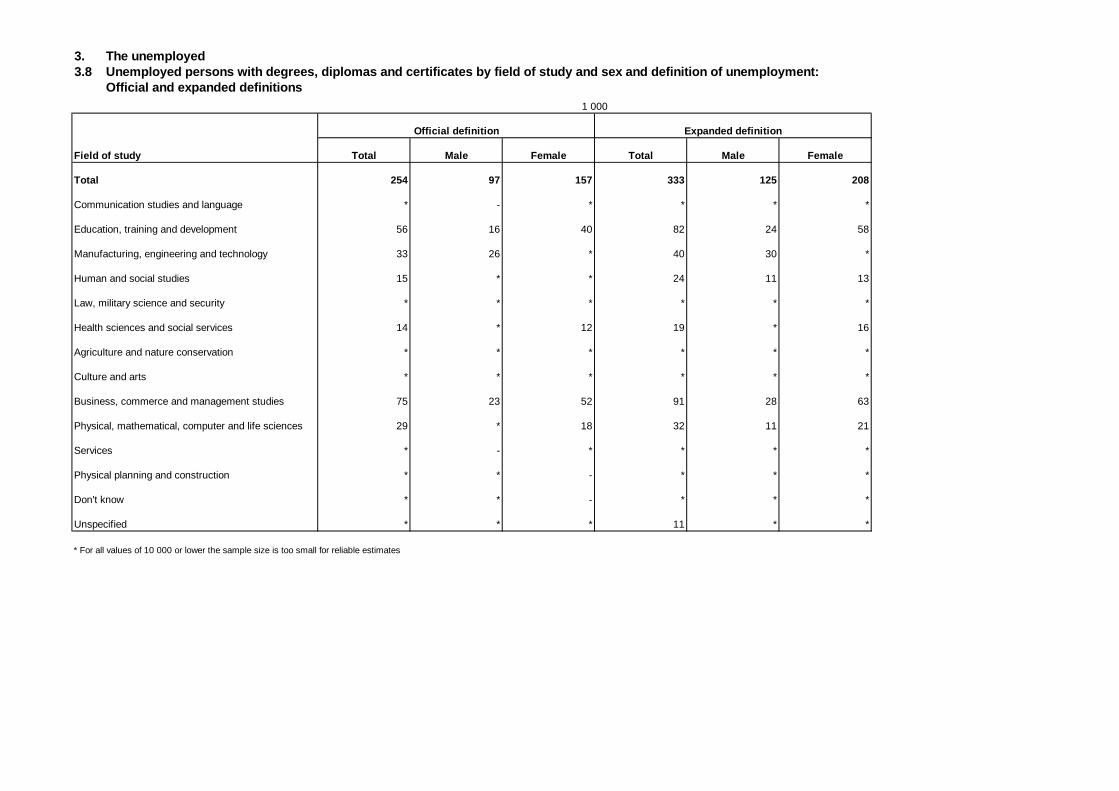
3. The unemployed3.8 Unemployed persons with degrees, diplomas and certificates by field of study and sex and definition of unemployment: Official and expanded definitions
Total Male Female Total Male Female
Total 254 97 157 333 125 208
Communication studies and language * - * * * *
Education, training and development 56 16 40 82 24 58
Manufacturing, engineering and technology 33 26 * 40 30 *
Human and social studies 15 * * 24 11 13
Law, military science and security * * * * * *
Health sciences and social services 14 * 12 19 * 16
Agriculture and nature conservation * * * * * *
Culture and arts * * * * * *
Business, commerce and management studies 75 23 52 91 28 63
Physical, mathematical, computer and life sciences 29 * 18 32 11 21
Services * - * * * *
Physical planning and construction * * - * * *
Don't know * * - * * *
Unspecified * * * 11 * *
* For all values of 10 000 or lower the sample size is too small for reliable estimates
1 000
Field of study
Official definition Expanded definition
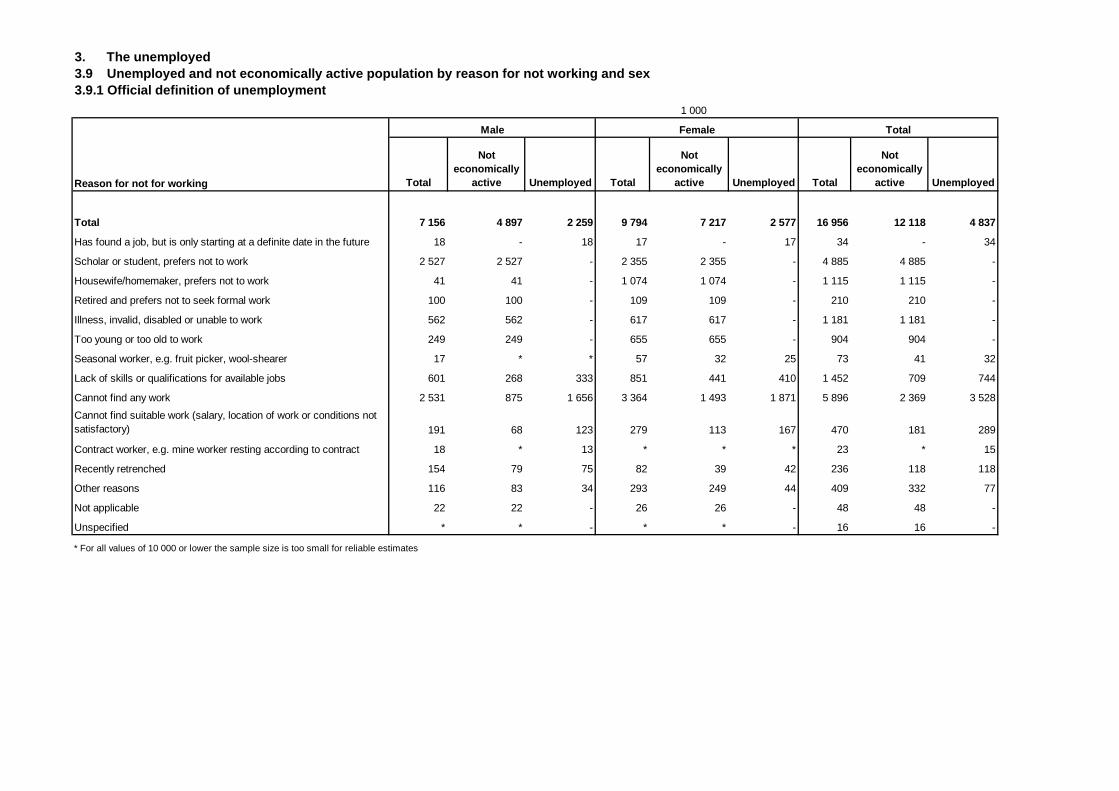
3. The unemployed3.9 Unemployed and not economically active population by reason for not working and sex 3.9.1 Official definition of unemployment
Total
Not economically
active Unemployed Total
Not economically
active Unemployed Total
Not economically
active Unemployed
Total 7 156 4 897 2 259 9 794 7 217 2 577 16 956 12 118 4 837
Has found a job, but is only starting at a definite date in the future 18 - 18 17 - 17 34 - 34
Scholar or student, prefers not to work 2 527 2 527 - 2 355 2 355 - 4 885 4 885 -
Housewife/homemaker, prefers not to work 41 41 - 1 074 1 074 - 1 115 1 115 -
Retired and prefers not to seek formal work 100 100 - 109 109 - 210 210 -
Illness, invalid, disabled or unable to work 562 562 - 617 617 - 1 181 1 181 -
Too young or too old to work 249 249 - 655 655 - 904 904 -
Seasonal worker, e.g. fruit picker, wool-shearer 17 * * 57 32 25 73 41 32
Lack of skills or qualifications for available jobs 601 268 333 851 441 410 1 452 709 744
Cannot find any work 2 531 875 1 656 3 364 1 493 1 871 5 896 2 369 3 528
Cannot find suitable work (salary, location of work or conditions not satisfactory) 191 68 123 279 113 167 470 181 289
Contract worker, e.g. mine worker resting according to contract 18 * 13 * * * 23 * 15
Recently retrenched 154 79 75 82 39 42 236 118 118
Other reasons 116 83 34 293 249 44 409 332 77
Not applicable 22 22 - 26 26 - 48 48 -
Unspecified * * - * * - 16 16 -
* For all values of 10 000 or lower the sample size is too small for reliable estimates
1 000
Reason for not for working
Male Female Total
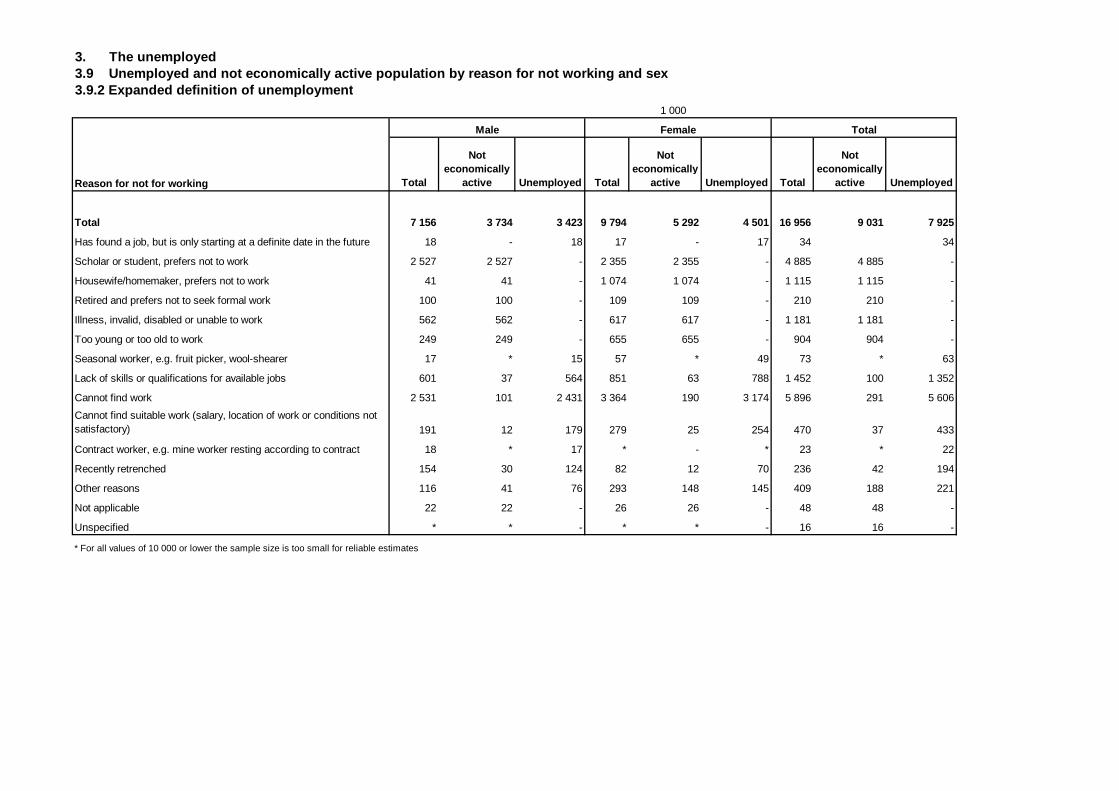
3. The unemployed3.9 Unemployed and not economically active population by reason for not working and sex 3.9.2 Expanded definition of unemployment
Total
Not economically
active Unemployed Total
Not economically
active Unemployed Total
Not economically
active Unemployed
Total 7 156 3 734 3 423 9 794 5 292 4 501 16 956 9 031 7 925
Has found a job, but is only starting at a definite date in the future 18 - 18 17 - 17 34 34
Scholar or student, prefers not to work 2 527 2 527 - 2 355 2 355 - 4 885 4 885 -
Housewife/homemaker, prefers not to work 41 41 - 1 074 1 074 - 1 115 1 115 -
Retired and prefers not to seek formal work 100 100 - 109 109 - 210 210 -
Illness, invalid, disabled or unable to work 562 562 - 617 617 - 1 181 1 181 -
Too young or too old to work 249 249 - 655 655 - 904 904 -
Seasonal worker, e.g. fruit picker, wool-shearer 17 * 15 57 * 49 73 * 63
Lack of skills or qualifications for available jobs 601 37 564 851 63 788 1 452 100 1 352
Cannot find work 2 531 101 2 431 3 364 190 3 174 5 896 291 5 606
Cannot find suitable work (salary, location of work or conditions not satisfactory) 191 12 179 279 25 254 470 37 433
Contract worker, e.g. mine worker resting according to contract 18 * 17 * - * 23 * 22
Recently retrenched 154 30 124 82 12 70 236 42 194
Other reasons 116 41 76 293 148 145 409 188 221
Not applicable 22 22 - 26 26 - 48 48 -
Unspecified * * - * * - 16 16 -
* For all values of 10 000 or lower the sample size is too small for reliable estimates
1 000
Reason for not for working
Male Female Total
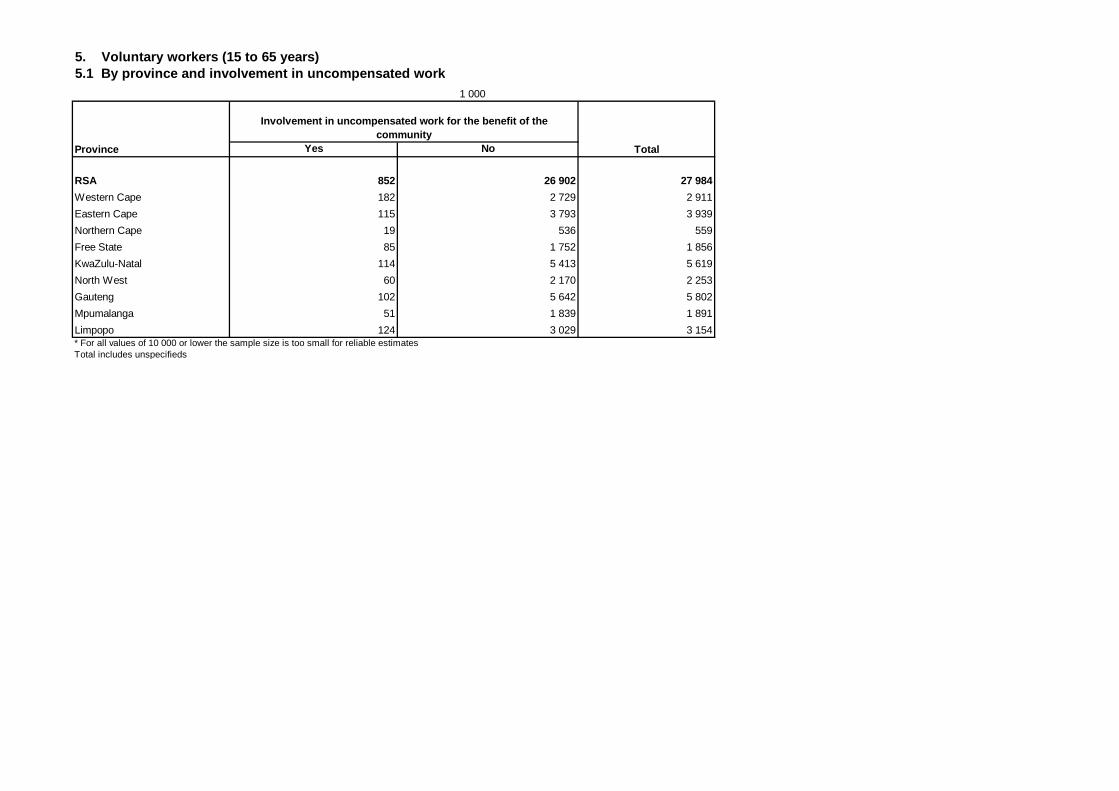
5. Voluntary workers (15 to 65 years)5.1 By province and involvement in uncompensated work
Yes No
RSA 852 26 902 27 984
Western Cape 182 2 729 2 911
Eastern Cape 115 3 793 3 939
Northern Cape 19 536 559
Free State 85 1 752 1 856
KwaZulu-Natal 114 5 413 5 619
North West 60 2 170 2 253
Gauteng 102 5 642 5 802
Mpumalanga 51 1 839 1 891
Limpopo 124 3 029 3 154* For all values of 10 000 or lower the sample size is too small for reliable estimatesTotal includes unspecifieds
Province
Involvement in uncompensated work for the benefit of the community
Total
1 000
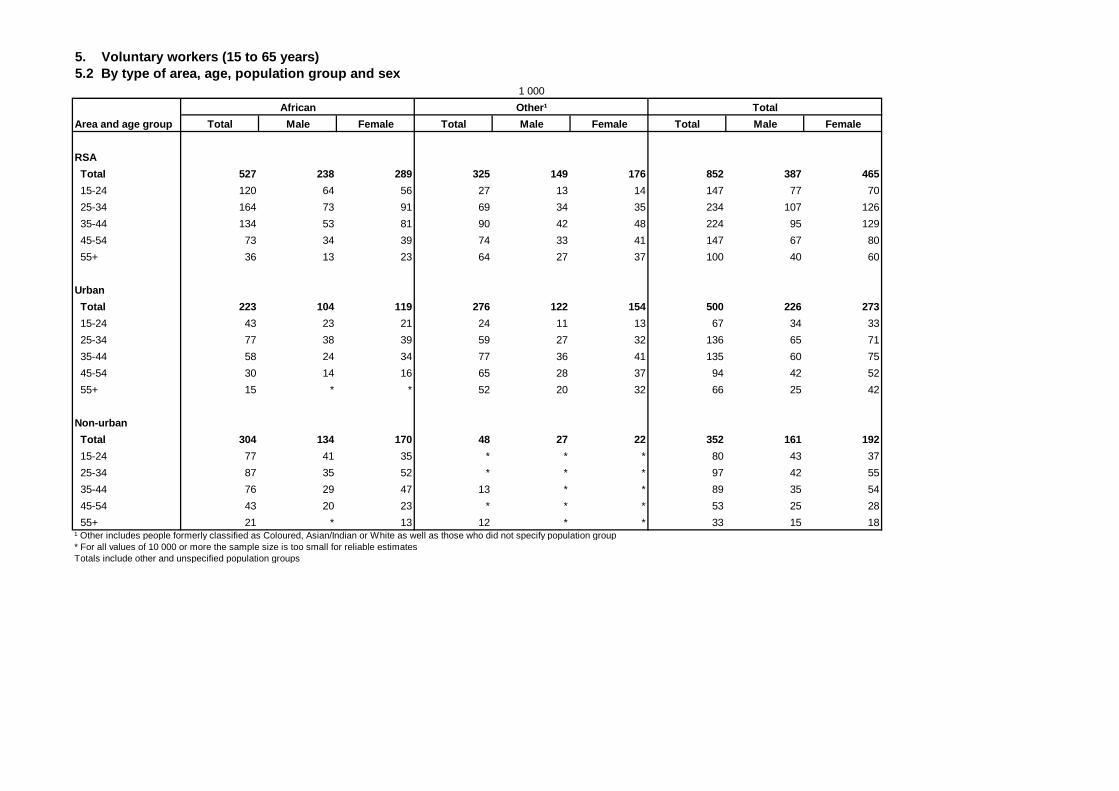
5. Voluntary workers (15 to 65 years)5.2 By type of area, age, population group and sex
Total Male Female Total Male Female Total Male Female
RSA
Total 527 238 289 325 149 176 852 387 465
15-24 120 64 56 27 13 14 147 77 70
25-34 164 73 91 69 34 35 234 107 126
35-44 134 53 81 90 42 48 224 95 129
45-54 73 34 39 74 33 41 147 67 80
55+ 36 13 23 64 27 37 100 40 60
Urban
Total 223 104 119 276 122 154 500 226 273
15-24 43 23 21 24 11 13 67 34 33
25-34 77 38 39 59 27 32 136 65 71
35-44 58 24 34 77 36 41 135 60 75
45-54 30 14 16 65 28 37 94 42 52
55+ 15 * * 52 20 32 66 25 42
Non-urban
Total 304 134 170 48 27 22 352 161 192
15-24 77 41 35 * * * 80 43 37
25-34 87 35 52 * * * 97 42 55
35-44 76 29 47 13 * * 89 35 54
45-54 43 20 23 * * * 53 25 28
55+ 21 * 13 12 * * 33 15 18¹ Other includes people formerly classified as Coloured, Asian/Indian or White as well as those who did not specify population group* For all values of 10 000 or more the sample size is too small for reliable estimatesTotals include other and unspecified population groups
1 000
Area and age group
African Other¹ Total
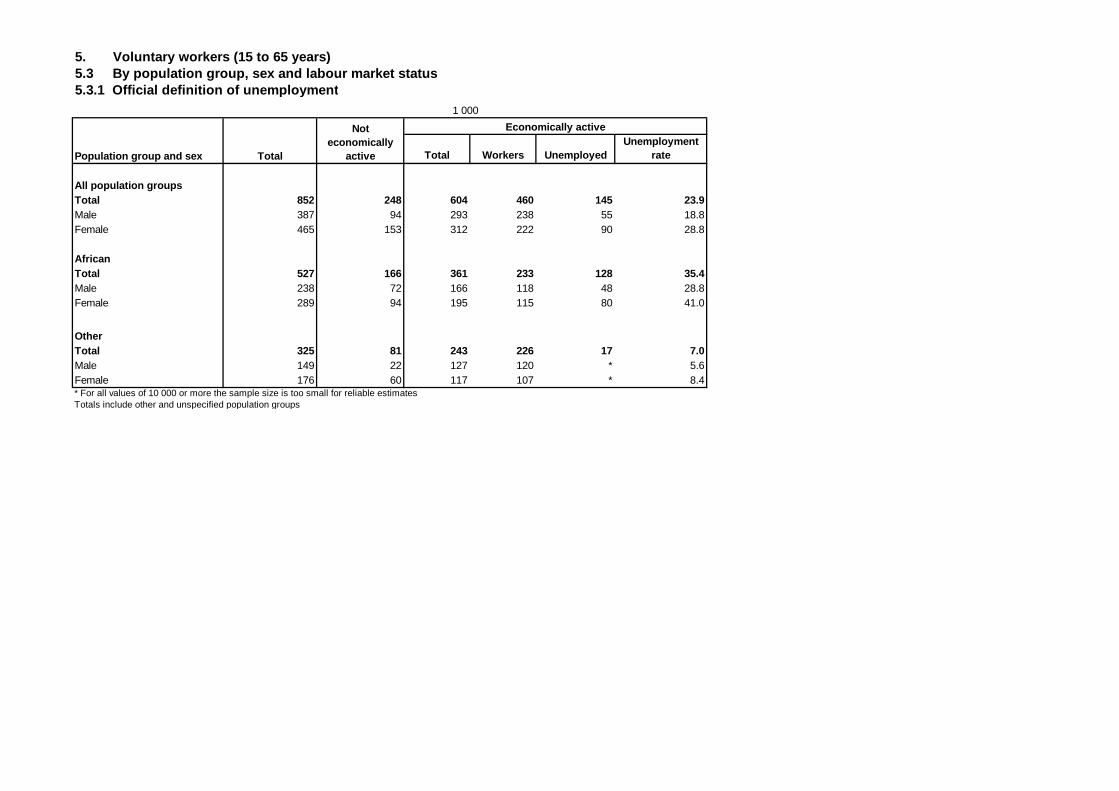
5. Voluntary workers (15 to 65 years)5.3 By population group, sex and labour market status5.3.1 Official definition of unemployment
Total Workers UnemployedUnemployment
rate
All population groupsTotal 852 248 604 460 145 23.9Male 387 94 293 238 55 18.8Female 465 153 312 222 90 28.8
AfricanTotal 527 166 361 233 128 35.4Male 238 72 166 118 48 28.8Female 289 94 195 115 80 41.0
OtherTotal 325 81 243 226 17 7.0Male 149 22 127 120 * 5.6Female 176 60 117 107 * 8.4* For all values of 10 000 or more the sample size is too small for reliable estimatesTotals include other and unspecified population groups
1 000
Population group and sex Total
Not economically
active
Economically active
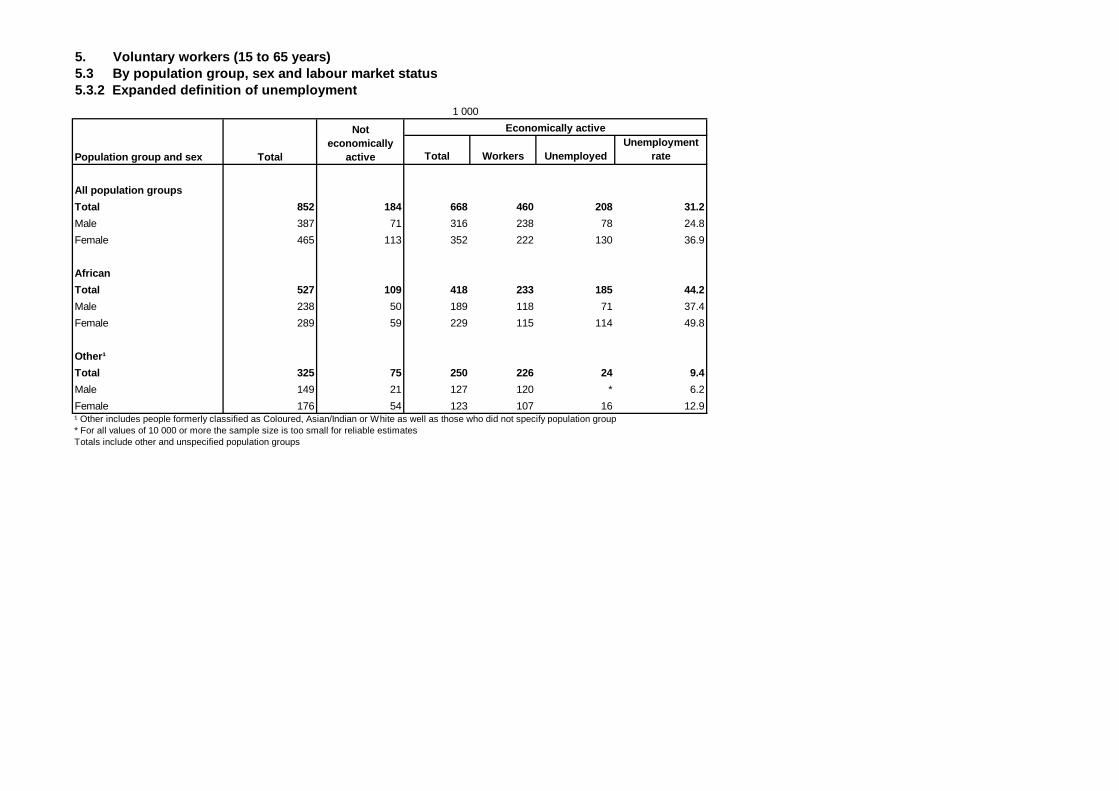
5. Voluntary workers (15 to 65 years)5.3 By population group, sex and labour market status5.3.2 Expanded definition of unemployment
Total Workers UnemployedUnemployment
rate
All population groups
Total 852 184 668 460 208 31.2
Male 387 71 316 238 78 24.8
Female 465 113 352 222 130 36.9
African
Total 527 109 418 233 185 44.2
Male 238 50 189 118 71 37.4
Female 289 59 229 115 114 49.8
Other¹
Total 325 75 250 226 24 9.4
Male 149 21 127 120 * 6.2
Female 176 54 123 107 16 12.9¹ Other includes people formerly classified as Coloured, Asian/Indian or White as well as those who did not specify population group* For all values of 10 000 or more the sample size is too small for reliable estimatesTotals include other and unspecified population groups
1 000
Population group and sex Total
Not economically
active
Economically active
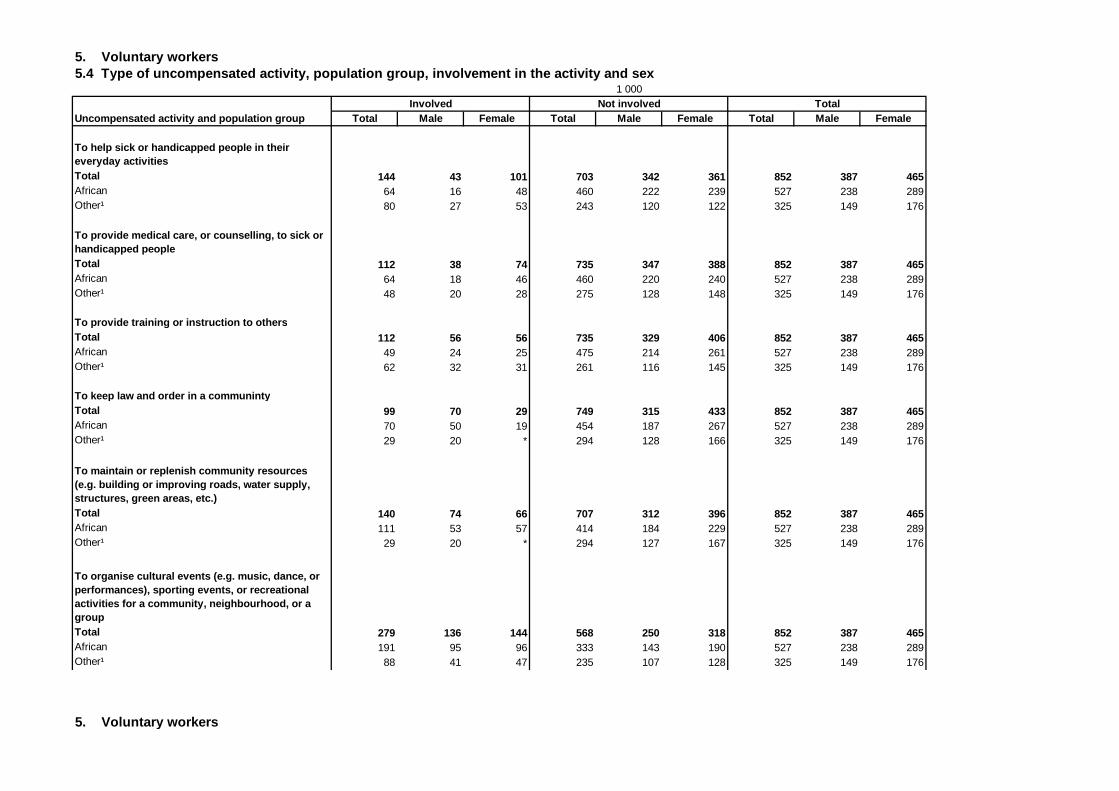
5. Voluntary workers5.4 Type of uncompensated activity, population group, involvement in the activity and sex
Total Male Female Total Male Female Total Male Female
To help sick or handicapped people in their everyday activitiesTotal 144 43 101 703 342 361 852 387 465African 64 16 48 460 222 239 527 238 289Other¹ 80 27 53 243 120 122 325 149 176
To provide medical care, or counselling, to sick or handicapped peopleTotal 112 38 74 735 347 388 852 387 465African 64 18 46 460 220 240 527 238 289Other¹ 48 20 28 275 128 148 325 149 176
To provide training or instruction to othersTotal 112 56 56 735 329 406 852 387 465African 49 24 25 475 214 261 527 238 289Other¹ 62 32 31 261 116 145 325 149 176
To keep law and order in a communintyTotal 99 70 29 749 315 433 852 387 465African 70 50 19 454 187 267 527 238 289Other¹ 29 20 * 294 128 166 325 149 176
To maintain or replenish community resources (e.g. building or improving roads, water supply, structures, green areas, etc.)Total 140 74 66 707 312 396 852 387 465African 111 53 57 414 184 229 527 238 289Other¹ 29 20 * 294 127 167 325 149 176
To organise cultural events (e.g. music, dance, or performances), sporting events, or recreational activities for a community, neighbourhood, or a groupTotal 279 136 144 568 250 318 852 387 465African 191 95 96 333 143 190 527 238 289Other¹ 88 41 47 235 107 128 325 149 176
5. Voluntary workers
1 000
Uncompensated activity and population groupInvolved Not involved Total
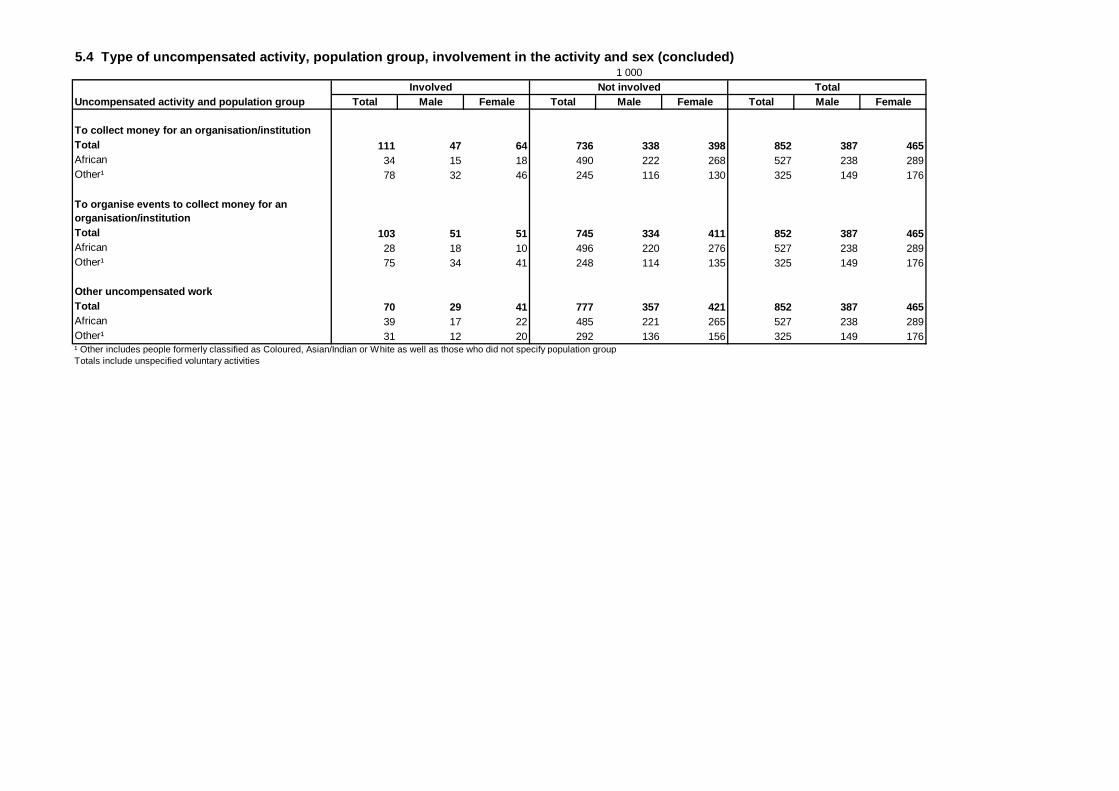
5.4 Type of uncompensated activity, population group, involvement in the activity and sex (concluded)
Total Male Female Total Male Female Total Male Female
To collect money for an organisation/institutionTotal 111 47 64 736 338 398 852 387 465African 34 15 18 490 222 268 527 238 289Other¹ 78 32 46 245 116 130 325 149 176
To organise events to collect money for an organisation/institutionTotal 103 51 51 745 334 411 852 387 465African 28 18 10 496 220 276 527 238 289Other¹ 75 34 41 248 114 135 325 149 176
Other uncompensated workTotal 70 29 41 777 357 421 852 387 465African 39 17 22 485 221 265 527 238 289Other¹ 31 12 20 292 136 156 325 149 176¹ Other includes people formerly classified as Coloured, Asian/Indian or White as well as those who did not specify population groupTotals include unspecified voluntary activities
1 000
Uncompensated activity and population groupInvolved Not involved Total
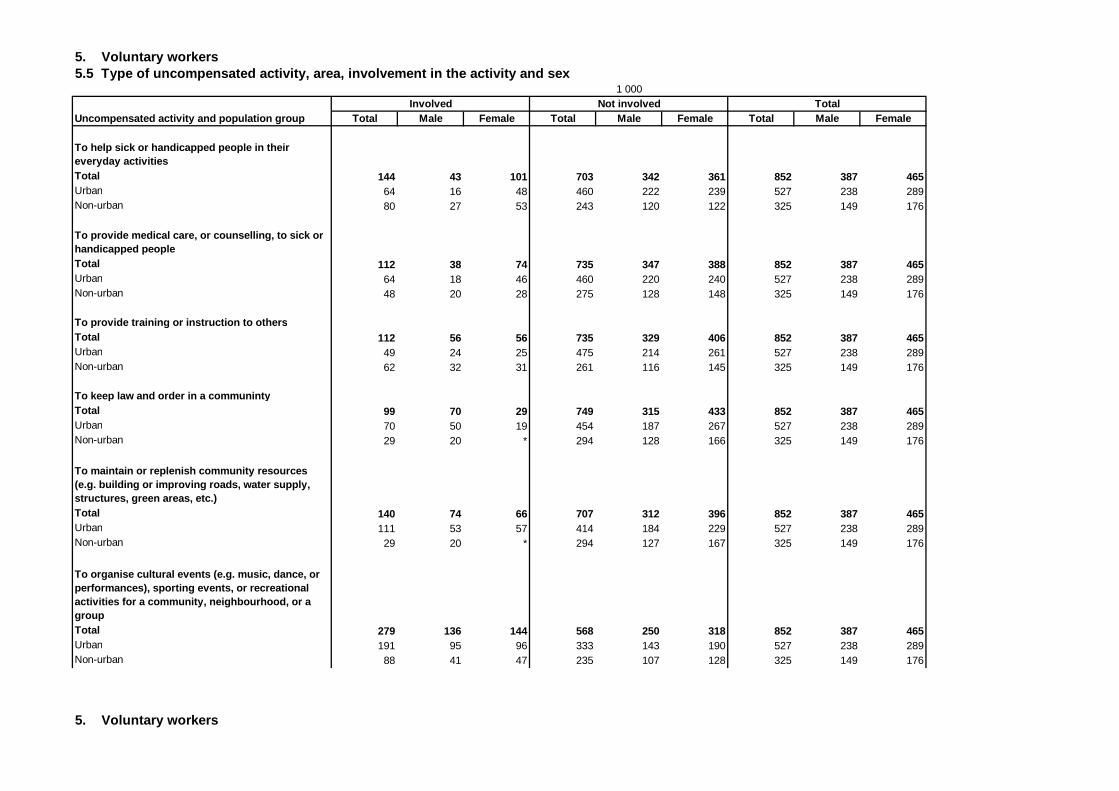
5. Voluntary workers5.5 Type of uncompensated activity, area, involvement in the activity and sex
Total Male Female Total Male Female Total Male Female
To help sick or handicapped people in their everyday activitiesTotal 144 43 101 703 342 361 852 387 465Urban 64 16 48 460 222 239 527 238 289Non-urban 80 27 53 243 120 122 325 149 176
To provide medical care, or counselling, to sick or handicapped peopleTotal 112 38 74 735 347 388 852 387 465Urban 64 18 46 460 220 240 527 238 289Non-urban 48 20 28 275 128 148 325 149 176
To provide training or instruction to othersTotal 112 56 56 735 329 406 852 387 465Urban 49 24 25 475 214 261 527 238 289Non-urban 62 32 31 261 116 145 325 149 176
To keep law and order in a communintyTotal 99 70 29 749 315 433 852 387 465Urban 70 50 19 454 187 267 527 238 289Non-urban 29 20 * 294 128 166 325 149 176
To maintain or replenish community resources (e.g. building or improving roads, water supply, structures, green areas, etc.)Total 140 74 66 707 312 396 852 387 465Urban 111 53 57 414 184 229 527 238 289Non-urban 29 20 * 294 127 167 325 149 176
To organise cultural events (e.g. music, dance, or performances), sporting events, or recreational activities for a community, neighbourhood, or a groupTotal 279 136 144 568 250 318 852 387 465Urban 191 95 96 333 143 190 527 238 289Non-urban 88 41 47 235 107 128 325 149 176
5. Voluntary workers
1 000
Uncompensated activity and population groupInvolved Not involved Total
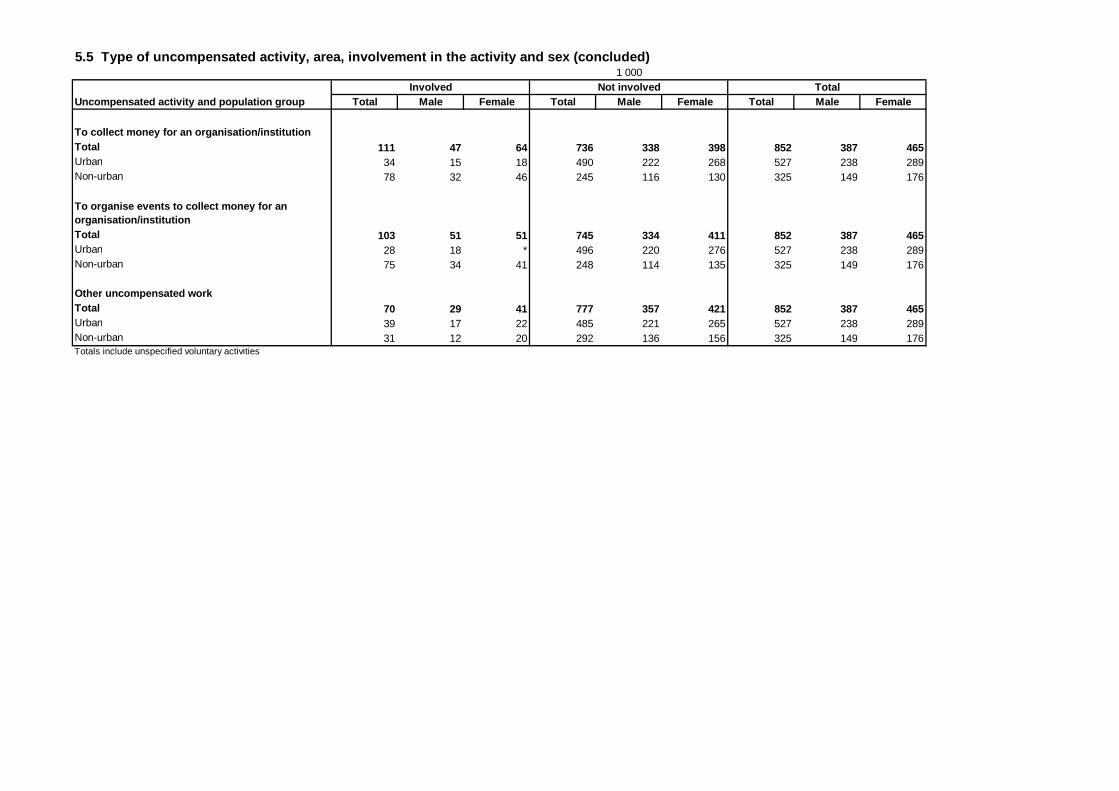
5.5 Type of uncompensated activity, area, involvement in the activity and sex (concluded)
Total Male Female Total Male Female Total Male Female
To collect money for an organisation/institutionTotal 111 47 64 736 338 398 852 387 465Urban 34 15 18 490 222 268 527 238 289Non-urban 78 32 46 245 116 130 325 149 176
To organise events to collect money for an organisation/institutionTotal 103 51 51 745 334 411 852 387 465Urban 28 18 * 496 220 276 527 238 289Non-urban 75 34 41 248 114 135 325 149 176
Other uncompensated workTotal 70 29 41 777 357 421 852 387 465Urban 39 17 22 485 221 265 527 238 289Non-urban 31 12 20 292 136 156 325 149 176Totals include unspecified voluntary activities
1 000
Uncompensated activity and population groupInvolved Not involved Total
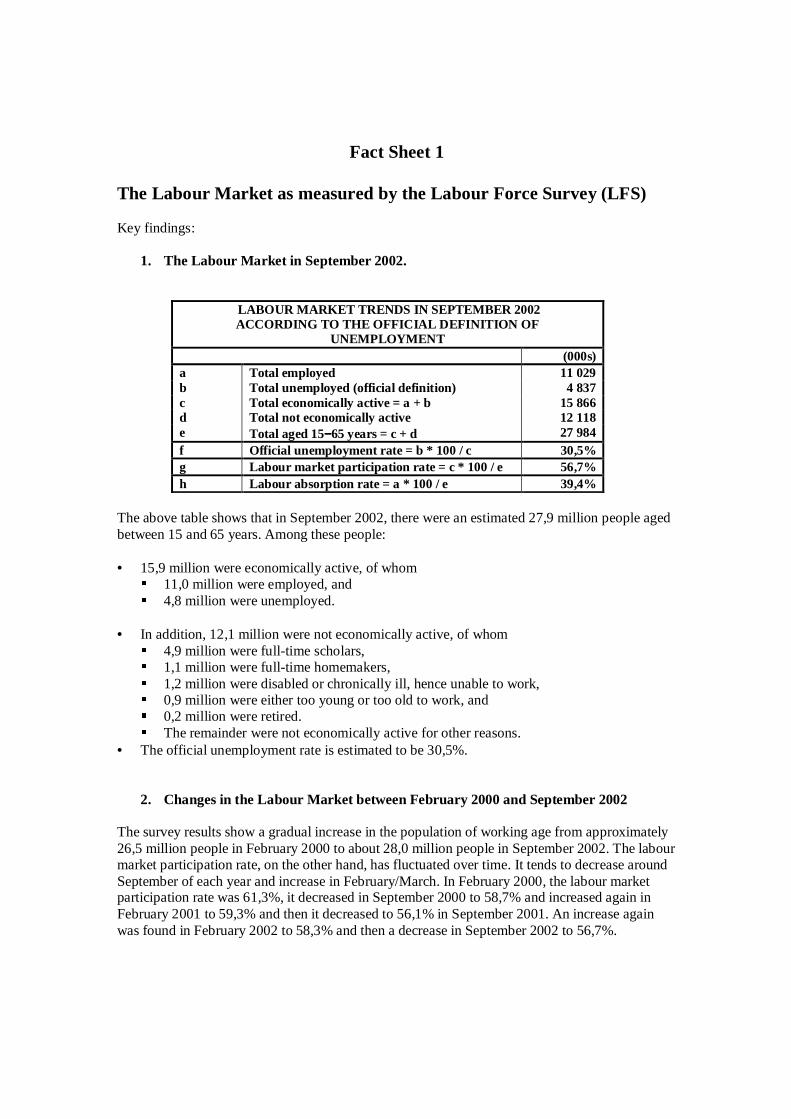
Fact Sheet 1 The Labour Market as measured by the Labour Force Survey (LFS) Key findings:
1. The Labour Market in September 2002.
LABOUR MARKET TRENDS IN SEPTEMBER 2002 ACCORDING TO THE OFFICIAL DEFINITION OF
UNEMPLOYMENT (000s) a Total employed 11 029 b Total unemployed (official definition) 4 837 c Total economically active = a + b 15 866 d Total not economically active 12 118 e Total aged 15−−−−65 years = c + d 27 984 f Official unemployment rate = b * 100 / c 30,5% g Labour market participation rate = c * 100 / e 56,7% h Labour absorption rate = a * 100 / e 39,4%
The above table shows that in September 2002, there were an estimated 27,9 million people aged between 15 and 65 years. Among these people: • 15,9 million were economically active, of whom
� 11,0 million were employed, and � 4,8 million were unemployed.
• In addition, 12,1 million were not economically active, of whom
� 4,9 million were full-time scholars, � 1,1 million were full-time homemakers, � 1,2 million were disabled or chronically ill, hence unable to work, � 0,9 million were either too young or too old to work, and � 0,2 million were retired. � The remainder were not economically active for other reasons.
• The official unemployment rate is estimated to be 30,5%.
2. Changes in the Labour Market between February 2000 and September 2002 The survey results show a gradual increase in the population of working age from approximately 26,5 million people in February 2000 to about 28,0 million people in September 2002. The labour market participation rate, on the other hand, has fluctuated over time. It tends to decrease around September of each year and increase in February/March. In February 2000, the labour market participation rate was 61,3%, it decreased in September 2000 to 58,7% and increased again in February 2001 to 59,3% and then it decreased to 56,1% in September 2001. An increase again was found in February 2002 to 58,3% and then a decrease in September 2002 to 56,7%.

Furthermore, the results indicate that there are no significant changes between February/March 2002 and September 2002 among the employed, unemployed, not economically active and economically active population. Employment in different economic sectors remained stable between March 2002 and September 2002 except for a significant decrease in domestic services and subsistence or small-scale agriculture employment. A decrease of about 0,3 million people is found in subsistence or small scale agriculture employment and approximately 0,1 million decrease in domestic services.
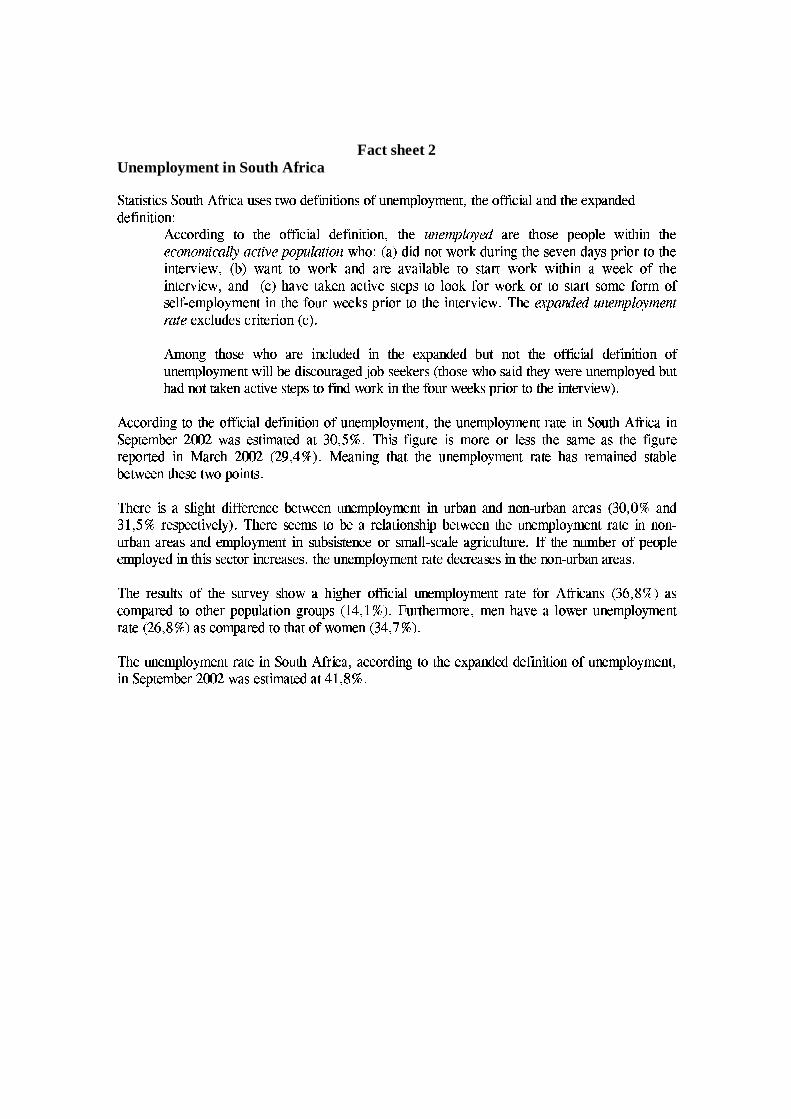
Fact sheet 2 Unemployment in South Africa ������������� ��������������������� ����������� ��!��#"����$� %��&�'�(��%��)�*�+��%���,#-/. ��0�,1�2%���34� �/��������&�*� ��.���%�"#��������56-���%�"���""��6��(%�� �7�(�6%98
�����2���:";�(%�<=���>���/�?�����$��������.@"��6��(%/�&����/%A3B���/�>C�D�EGF+H)I�JLKAENMO���P�?�(���/�P�Q-/����-/.�Q!1� �����(%R� ���E�S2J6D�J6FUT�SNV�I I KWV�SNX�T�Y�EZH[J:H[C�I(V�X�TJ6D\!]�4�98A^���_`"/�("�%��6�a!����:bc"��4�L�(%�<c���/�d�P��e/�2%�"/�20/��-/�����/�����f� ����(%6�����Le/�(��!c3�^7g/_h!���%6�c���i!����:bi��%�"i�6���j��e/���(.��2g;.��k���i�������l�m!����Lbn!U�&���o�(%i�j!p����bn�/�\� �4��(%6�����Le/�(��!c3q��%�"r^7��_s�/��e��W�'��b��t%@�2������e��u�����2-o�p���v.����/b@���/�#!����:b@���U���v�l�����P���$��,c�h�����P,w����P��.��x���,#-4. �/0�,c��%6�`�(%\���/�c�����/�U!s�t�6b/�q-4�L�(���]���\���/�m�(%6�����:e;�&��!zy {+����EP|LH)V�D�MoE}MuC�D/ENF+H~IJ�K�F1END�X� V�X�E���5/��.(�/"*���[�6�L�&��6�L�(�/%�^7��_Ny
��,#�*%�<>�(�;�/�l��!s�/�>�t�P���(%6��.���"��6"��&%>����Q�t56-/�t%�"6��"Qg/���@%����B� �/�Q������&������.B"��t�$�(%/�&�'�(��%�����/%��t,p-�.(�*06,1�6%6�o!1�&.�./g/�U"/�������6�;���6<���"]�l��gm�l���tb��2���`^'�����/���U!��;���l���("#����t0z!]�2�$����%��t,#-�.���0��2"#g*�������"#%*�;�����tb���%#���2�7� e��1�l���2-�� ���c�$��%�"c!]���Pb�� %#�(�/�����6�/�[!��t�2b/�Z-/���(���)�'�#�����1�(%����t�:e/����!�_Ny
�]�����6�L"/�&%/<z�'��� �����/���$�����&��.Z"*���$�&%��&�'�(��%��/���/%*�2,p-�. ��0�,#��%6�$3+��/�f�*%��t,p-�.(�*06,1�6%6� �P�2��h��%B�/���/���W�p����� ���W�(%���2-����,pg/�t�\�/�6�*��!����z���l�7�&,1��� ��"j�2�1�6�o3��+�hy�{��o�(�z�$� <6�/�$������,c�6�$���*�\.(���L�f�(�����l��,1�@���f���*����(<6�/�$��$�2-��/������"i� %��u�2�$�N�i�����*�i^��6�A3 �)�U_2y1�u�2��%/�(%�<n�����2�c� �/����%���,p-/.�60�,1�2%�������� ���;���B����,#����%���"i��'�Ng�.(�g*���'!s�t��%#�(�/��������!]�#-�����%;�'��y
{+�/�t�P�v� �#�v�P.�(<�����";�(����������%6���hg�����!]���2%v�/%6�t,#-/.���06,1�6%��U��%��*�Pg���%v�2%/"@%/��%4x(����g/�t%����$�2�*�z^����o3�� ���2%�"�+��3 � ���$���-*���2���(e���.(0*_2y`{+�/�2�$�@�����t,��p����g*�h�h�P��. �2���(��%���o� -vg/�2��!]�2��%@���/���*%6��,U-/.���0*,#�2%��]�$�2����� %�%*��%�x�/��g*�6%u���P�t���U�2%�"@�t,#-/.(�/0�,#�t%;��� %�����g��$���l���%6���u�6����,#��..�x��P�t�6.��h��<��}� �2�/.(���/�$��y`����� �/�h%��/,#g*���#�*�s-/����-4. ��t,#-/.���06��"��&%#� �o�(�q�����2�����q�(%����$�2�������23����*�s��%6��,U-/.���0�,#�t%��A���2���U"����2�$�2�*�����`�&%#���;��%6�/%*x7����g/�t%#����������y
{+�/�v�����7��.����\���c�������l�*�:e���0�������!����o��<6�����\�������(������.���%���,p-;.���0�,1�2%��U�������v�����m�p����� ����%��h^��6�A3��+�1_#�*��t��,#-�������"@������ �/�2�#-/��-��/. �2���&�/%@<��$�6��-o�c^N�:�A3:���1_Ny`�A�/����������,c�*���43�,1��%B�/��e��h�h.���!]���p��%��2,#-/.���0�,#��%6��$�2���1^����A3��Z�U_9���[���6,U-�������"#���#� �/�2�A���a!s��,1�2%�^����93& [�1_Ny
{+�/�#�*%��2,#-;.(�/0�,#�2%��[�$�2����(%h���6�/���u������� ���/39���2�����:"/��%�<\�������/�#��5�-���%�"*�2"\"��6��(%�� �7�(�6%m�����/%���,p-/.���0�,1��%;�3�(%����2-���2,#g;�2���*�6���c!]���)�*�����&,1�2����"1�����[��3�a�hy