laboratory treatability testing of soils contaminated with lead and pcbs using particle-size...
TRANSCRIPT

Ž .Journal of Hazardous Materials 66 1999 137–150
Laboratory treatability testing of soils contaminatedwith lead and PCBs using particle-size separation
and soil washing
Richard G. Sheets, Berit A. Bergquist )
Soil Technology, 7865 NE Day Road W., Bainbridge Island, WA 98110, USA
Abstract
A soil treatability study was conducted using particle-size separation and soil washing toŽ .reduce the volume of material contaminated with polychlorinated biphenyls PCBs and lead at a
Superfund site. Soil washing using surfactant was effective at removing 95% of PCBs into finematerial and residual wash water. Results indicate that almost 80% of the material contaminatedwith up to 140 mgrkg PCBs could be treated to concentrations below 10 mgrkg using soilwashing with surfactant. There did not appear to be a difference in lead removal using eitherparticle size separation or soil washing, although the lead data have high uncertainty because ofsoil heterogeneity. Lead concentrations in soil were reduced from as high as 1700 to F150mgrkg and from 560 to F220 mgrkg in about half of the material using particle size separation.q 1999 Elsevier Science B.V. All rights reserved.
Keywords: Soil; Particle-size separation; PCBs; Lead; Washing; Treatability
1. Introduction
This paper presents a case study of a treatability testing program for remediation ofsoils contaminated with lead and PCBs at a Superfund site. Soils at the site werecontaminated from metal recycling and salvage activities including handling and stock-piling of various ferrous materials, PCB transformers, and lead acid batteries. Soilwashing and particle-size separation technologies were selected as potential clean-up
) Corresponding author. Tel.: q1-206-842-8977; fax: q1-206-842-9014; e-mail: [email protected]
0304-3894r99r$ - see front matter q 1999 Elsevier Science B.V. All rights reserved.Ž .PII: S0304-3894 99 00009-6
( )R.G. Sheets, B.A. BergquistrJournal of Hazardous Materials 66 1999 137–150138
methods at the site because of their effectiveness at concentrating contaminants into arelatively small mass of fine-grained material and therefore reducing the volume ofcontaminated material needing further treatment or disposal. In addition, these methodscan be used to treat a wide variety of contaminants which was considered important atthis site containing both PCBs and lead.
The goal of this treatability study was to determine if preliminary treatment goals forsite soils could be achieved from particle size separation, a simple separation of materialinto coarse and fine fractions, or from soil washing, a process involving high energycontact between the soil and an aqueous wash solution. The contaminant removalefficiencies and potential volume reduction of both methods was evaluated. Theeffectiveness of soil washing was tested using water alone, water with surfactant, andwater with lowered pH. Surfactants have been found to be effective in soil washing forremoving organic contaminants including PCBs, pentachlorophenol, and creosote at
w xconcentrations of 0.2 to 1.0% in wash water 1,2 . Lowering the pH of water has shownw xto be effective at extracting lead from soils 3–6 . The soil treatability study was
conducted following EPA’s guidance for conducting soil washing studies under CER-w xCLA 7 .
2. Experimental procedures
2.1. Sample preparation
A compositing scheme was devised to create three composite soil samples torepresent low, average, and high concentrations of PCBs and lead within the area beinginvestigated. First, thirteen soil samples were collected at the site. PCB immunoassaytesting was conducted on six samples; those results and field observations were used toselect seven samples for laboratory analysis of PCBs, lead, and grain size distribution.Based on the analytical results of the seven soil samples, the soils were composited intothree samples—Samples L, A, and H. Concentrations of PCBs in the three samplesranged from 52 to 670 mgrkg and concentrations of lead ranged from 560 to 5200
Ž .mgrkg Table 1 . The grain size of the original samples was also considered in creatingthe composite scheme so the samples would have grain-size ranges that have been
w xdetermined to be suitable for soil washing 7 . Prior to compositing, all soil samples
Table 1Concentrations of PCBs and lead in composite soil samples
PCBs LeadŽ . Ž .mgrkg mgrkg
Sample L 52 560Sample A 140 1700Sample H 670 5200
Ž .Sample H duplicate 700 na
na: Not analyzed.
( )R.G. Sheets, B.A. BergquistrJournal of Hazardous Materials 66 1999 137–150 139
were prescreened over a US 1 in. sieve. Grain size and specific gravity of Samples L, A,and H are shown in Table 2.
2.2. Particle size separation
ŽFor the separation procedure, 5000 g of each sample L, A, and H, plus one duplicate.of Sample A was washed through a set of sieves using 20 l of wash water consisting of
carbon-filtered and deionized water at a 1:2.5 ratio. The wash water pH was adjusted to8.0–8.2 using ammonium hydroxide to approximate the pH of water at the site. Eachsample was separated into five particle size ranges as follows: )4.75 mm, 4.75–2.0mm, 2.0–0.425 mm, 0.425–0.074 mm, and -0.074 mm. The four coarser size fractionswere air-dried and then subsampled for chemical analysis. The fine material less than0.074 mm, including the wash water, was allowed to settle for 6 h. The supernatant andfine-grained material were then subsampled for chemical analysis. All samples wereanalyzed for PCBs and lead. In addition, three particle size fractions were analyzed forspecific gravity to evaluate its potential relationship with the concentration of lead. Thematerial )4.75 mm was examined visually for the presence of particulate lead.
2.3. Sample prescreening for soil washing
Six samples, two each of L, A, and H, were prepared for soil washing testing. Thesoil samples were prescreened to remove fines from the soil prior to washing as the fines
Table 2Grain size and specific gravity of composite soil samples
Percent of sample Specific gravity
Sample L)4.75 mm 37 na4.75–2.0 mm 13 na2.0–0.425 mm 19 na0.425–0.074 mm 16 na-0.074 mm 15 na
Sample A)4.75 mm 39 na4.75–2.0 mm 14 2.652.0–0.425 mm 25 2.720.425–0.074 mm 14 2.66-0.074 mm 8 na
Sample H)4.75 mm 35 na4.75–2.0 mm 15 2.672.0–0.425 mm 21 2.750.425–0.074 mm 17 2.74-0.074 mm 12 na
na: not analyzed.

( )R.G. Sheets, B.A. BergquistrJournal of Hazardous Materials 66 1999 137–150140
interfered with the operation of the soil washing unit. The samples were prescreened byagitating 2000 g of material with approximately 8 l of wash water prepared as describedpreviously for the particle size separation step. The agitation was performed to aid in thebreakdown of soil agglomerates and to remove some of the fine material and organicmatter. Material was then passed through a sieve to remove fine material less than 0.425mm diameter for Samples A and H and less than 0.125 mm diameter for Sample L. Thewash water from the agitation of each sample was settled for approximately 4 h. Thesettled fines and sludge were saved to combine with fines produced later during the soilwashing step.
2.4. Soil washing procedure
The apparatus used to conduct the soil washing was a pilot-type rotating trommelwasher. The soil was fed through the hopper and dropped into the wash chamber. In thewash chamber, wash water was recirculated continuously to the soil mix through a spraybar with four nozzles extending the length of the chamber. As material passed throughthe wash chamber, additional spray nozzles assisted in the removal of finer materialpassing through a series of slotted screen sections ranging in size from 0.005 to 0.10 cm.The finer materials passing through the screen sections was collected on shallow traysequipped with a No. 320 screen. This allowed water and fines to pass through a filterhousing unit equipped with a 0.025-mm-rating welded liquid filter bag. The filteredwash water was recirculated to the spray bar through a 50 gpm pump. The coarser
Ž .material approximately 1 mm and larger passed out the end of the trommel barrel intoa collection container. The material passing through selected trommel screen sectionscould be removed for analysis or composited with the coarse material exiting the end ofthe trommel barrel. The water pressure of the spray bars was set at 30–40 psi and thewater temperature at 388C. For each wash, 60 l of wash water were added to thetrommel reservoir and reused throughout the wash cycle. The duration of the wash cyclewas 50 min.
2.5. Water wash
One 2000 g subsample of each of the three soil samples L, A, and H was subjected tosoil washing using water only. The wash water was prepared combining carbon-filteredand deionized water at a 1:2.5 ratio and adjusting the pH to 8.0–8.1 with ammoniumhydroxide to represent site water.
Ž .Samples L and H were each subjected to one cycle of water washing Fig. 1 . SampleA was subjected to three cycles to evaluate the effect of multiple cycles. For Samples Land H, soil, residual fine material and residual water samples were collected after onewash cycle. For Sample A, soil was collected after each of the three cycles and analyzedseparately. Fine material was collected after each cycle, and composited into one samplefor analysis. Residual water was collected for analysis after the first cycle. The finematerial samples from L, A, and H were combined with their respective fine material

( )R.G. Sheets, B.A. BergquistrJournal of Hazardous Materials 66 1999 137–150 141
Fig. 1. Schematic diagram of sample treatment and collection for water washing of soil.
samples collected from the prescreening step. All samples were analyzed for lead andŽ .PCBs. Toxicity Characteristic Leaching Procedure TCLP extractions for lead were
performed on soil samples collected at the end of each test, and in all fine materialsamples.
2.6. Surfactant and pH-adjusted wash
One 2000 g subsample of each of the three soil samples L, A, and H was subjected toa surfactant wash followed by a pH-adjusted wash. The surfactant wash water consistedof a 0.5% by weight solution of Witconol 1206 in carbon-filteredrdeionized waterprepared as described previously. The pH-adjusted water consisted of the wash wateradjusted to a pH of less than 4 by adding nitric acid.
Samples L and H were each subjected to one cycle of surfactant washing followed byŽ .one cycle of pH-adjusted washing Fig. 2 . Sample A was subjected to three cycles of
surfactant washing followed by three cycles of pH-adjusted washing. For Samples L andH, residual water samples were collected after each surfactant and pH-adjusted cycle.Soil samples were collected after the pH-adjusted cycle. For Sample A, residual watersamples were collected after the first surfactant and first pH-adjusted cycles and soilsamples were collected after the third surfactant and third pH-adjusted cycles. Two soilsubsamples were crushed and analyzed to evaluate the effect of laboratory subsampling

( )R.G. Sheets, B.A. BergquistrJournal of Hazardous Materials 66 1999 137–150142
Fig. 2. Schematic diagram of sample treatment and collection for chemically enhanced soil washing.
bias. Fine material was not collected. All samples were analyzed for PCBs and lead. Soilsamples collected in the final cycle of each test were analyzed for TCLP-lead.
3. Results and discussion
3.1. Particle size separation
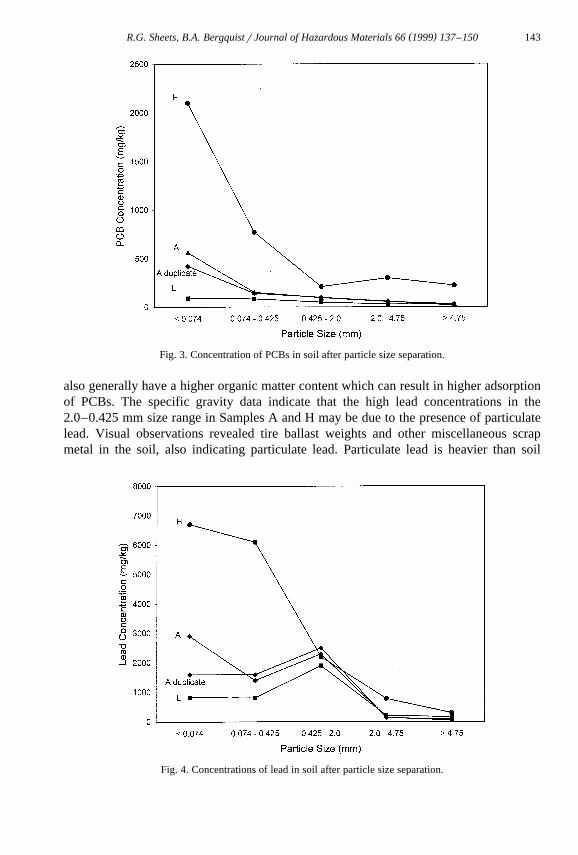
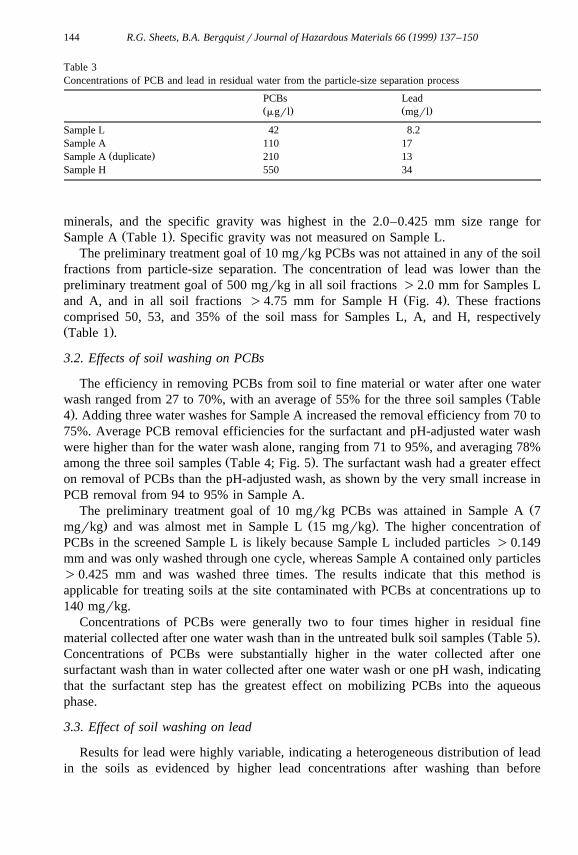
Concentrations of PCBs were higher in the finer size fractions than in the coarser sizeŽ .fractions for all of the samples Fig. 3 , with the exception of the 2.0–0.425 mm range
for Sample H. Concentrations of lead also showed a general increasing trend with finersize fractions with the exception of the 2.0–0.425 mm range for Samples A and L,
Ž .where concentrations of lead were higher than in the two smaller size fractions Fig. 4 .Concentrations of lead and PCBs in residual water increased with higher soil concentra-
Ž .tions Table 3 .The higher concentrations of PCBs in smaller particle size fractions is likely due to
the higher surface area-to-volume ratio in soils with finer grain size. Finer grained soils
( )R.G. Sheets, B.A. BergquistrJournal of Hazardous Materials 66 1999 137–150 143
Fig. 3. Concentration of PCBs in soil after particle size separation.
also generally have a higher organic matter content which can result in higher adsorptionof PCBs. The specific gravity data indicate that the high lead concentrations in the2.0–0.425 mm size range in Samples A and H may be due to the presence of particulatelead. Visual observations revealed tire ballast weights and other miscellaneous scrapmetal in the soil, also indicating particulate lead. Particulate lead is heavier than soil
Fig. 4. Concentrations of lead in soil after particle size separation.
( )R.G. Sheets, B.A. BergquistrJournal of Hazardous Materials 66 1999 137–150144
Table 3Concentrations of PCB and lead in residual water from the particle-size separation process
PCBs LeadŽ . Ž .mgrl mgrl
Sample L 42 8.2Sample A 110 17
Ž .Sample A duplicate 210 13Sample H 550 34
minerals, and the specific gravity was highest in the 2.0–0.425 mm size range forŽ .Sample A Table 1 . Specific gravity was not measured on Sample L.
The preliminary treatment goal of 10 mgrkg PCBs was not attained in any of the soilfractions from particle-size separation. The concentration of lead was lower than thepreliminary treatment goal of 500 mgrkg in all soil fractions )2.0 mm for Samples L
Ž .and A, and in all soil fractions )4.75 mm for Sample H Fig. 4 . These fractionscomprised 50, 53, and 35% of the soil mass for Samples L, A, and H, respectivelyŽ .Table 1 .
3.2. Effects of soil washing on PCBs
The efficiency in removing PCBs from soil to fine material or water after one waterŽwash ranged from 27 to 70%, with an average of 55% for the three soil samples Table
.4 . Adding three water washes for Sample A increased the removal efficiency from 70 to75%. Average PCB removal efficiencies for the surfactant and pH-adjusted water washwere higher than for the water wash alone, ranging from 71 to 95%, and averaging 78%
Ž .among the three soil samples Table 4; Fig. 5 . The surfactant wash had a greater effecton removal of PCBs than the pH-adjusted wash, as shown by the very small increase inPCB removal from 94 to 95% in Sample A.
ŽThe preliminary treatment goal of 10 mgrkg PCBs was attained in Sample A 7. Ž .mgrkg and was almost met in Sample L 15 mgrkg . The higher concentration of
PCBs in the screened Sample L is likely because Sample L included particles )0.149mm and was only washed through one cycle, whereas Sample A contained only particles)0.425 mm and was washed three times. The results indicate that this method isapplicable for treating soils at the site contaminated with PCBs at concentrations up to140 mgrkg.
Concentrations of PCBs were generally two to four times higher in residual fineŽ .material collected after one water wash than in the untreated bulk soil samples Table 5 .
Concentrations of PCBs were substantially higher in the water collected after onesurfactant wash than in water collected after one water wash or one pH wash, indicatingthat the surfactant step has the greatest effect on mobilizing PCBs into the aqueousphase.
3.3. Effect of soil washing on lead
Results for lead were highly variable, indicating a heterogeneous distribution of leadin the soils as evidenced by higher lead concentrations after washing than before
( )R.G. Sheets, B.A. BergquistrJournal of Hazardous Materials 66 1999 137–150 145
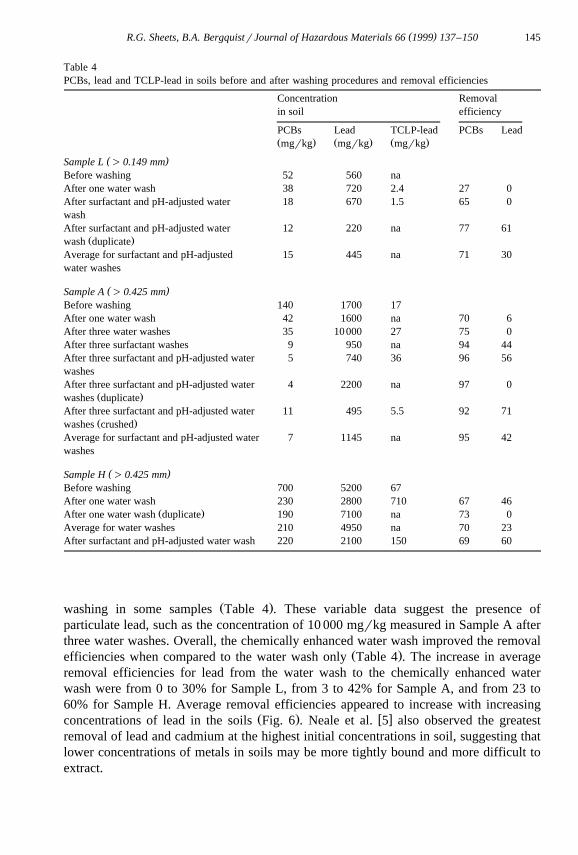
Table 4PCBs, lead and TCLP-lead in soils before and after washing procedures and removal efficiencies
Concentration Removalin soil efficiency
PCBs Lead TCLP-lead PCBs LeadŽ . Ž . Ž .mgrkg mgrkg mgrkg
( )Sample L )0.149 mmBefore washing 52 560 naAfter one water wash 38 720 2.4 27 0After surfactant and pH-adjusted water 18 670 1.5 65 0washAfter surfactant and pH-adjusted water 12 220 na 77 61
Ž .wash duplicateAverage for surfactant and pH-adjusted 15 445 na 71 30water washes
( )Sample A )0.425 mmBefore washing 140 1700 17After one water wash 42 1600 na 70 6After three water washes 35 10000 27 75 0After three surfactant washes 9 950 na 94 44After three surfactant and pH-adjusted water 5 740 36 96 56washesAfter three surfactant and pH-adjusted water 4 2200 na 97 0
Ž .washes duplicateAfter three surfactant and pH-adjusted water 11 495 5.5 92 71
Ž .washes crushedAverage for surfactant and pH-adjusted water 7 1145 na 95 42washes
( )Sample H )0.425 mmBefore washing 700 5200 67After one water wash 230 2800 710 67 46
Ž .After one water wash duplicate 190 7100 na 73 0Average for water washes 210 4950 na 70 23After surfactant and pH-adjusted water wash 220 2100 150 69 60
Ž .washing in some samples Table 4 . These variable data suggest the presence ofparticulate lead, such as the concentration of 10 000 mgrkg measured in Sample A afterthree water washes. Overall, the chemically enhanced water wash improved the removal
Ž .efficiencies when compared to the water wash only Table 4 . The increase in averageremoval efficiencies for lead from the water wash to the chemically enhanced waterwash were from 0 to 30% for Sample L, from 3 to 42% for Sample A, and from 23 to60% for Sample H. Average removal efficiencies appeared to increase with increasing
Ž . w xconcentrations of lead in the soils Fig. 6 . Neale et al. 5 also observed the greatestremoval of lead and cadmium at the highest initial concentrations in soil, suggesting thatlower concentrations of metals in soils may be more tightly bound and more difficult toextract.
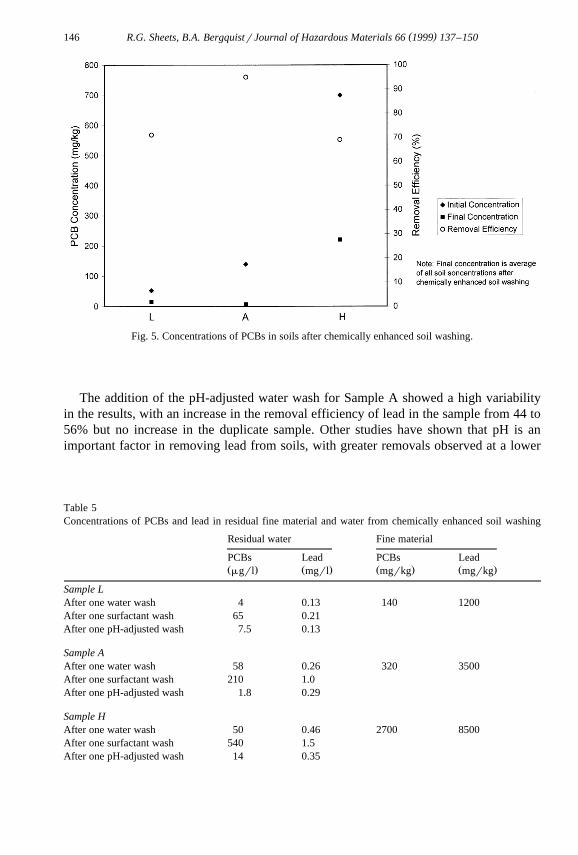
( )R.G. Sheets, B.A. BergquistrJournal of Hazardous Materials 66 1999 137–150146
Fig. 5. Concentrations of PCBs in soils after chemically enhanced soil washing.
The addition of the pH-adjusted water wash for Sample A showed a high variabilityin the results, with an increase in the removal efficiency of lead in the sample from 44 to56% but no increase in the duplicate sample. Other studies have shown that pH is animportant factor in removing lead from soils, with greater removals observed at a lower
Table 5Concentrations of PCBs and lead in residual fine material and water from chemically enhanced soil washing
Residual water Fine material
PCBs Lead PCBs LeadŽ . Ž . Ž . Ž .mgrl mgrl mgrkg mgrkg
Sample LAfter one water wash 4 0.13 140 1200After one surfactant wash 65 0.21After one pH-adjusted wash 7.5 0.13
Sample AAfter one water wash 58 0.26 320 3500After one surfactant wash 210 1.0After one pH-adjusted wash 1.8 0.29
Sample HAfter one water wash 50 0.46 2700 8500After one surfactant wash 540 1.5After one pH-adjusted wash 14 0.35

( )R.G. Sheets, B.A. BergquistrJournal of Hazardous Materials 66 1999 137–150 147
Fig. 6. Concentrations of lead in soils after chemically enhanced soil washing.
w x w xpH 4,6 . Grasso et al. 4 also observed that the number of soil washing stages neededfor lead removal decreased with lowered pH. In that particular study using Connecticut
w xsoils, a pH of 3.25 required five equiliburium stages 4 . These data indicate that a lowerpH used with this method or an increased number of wash cycles may improve theremoval of lead. In addition, increased residence time of the solution with the soil toallow time for equilibrium may improve the removal efficiency.
TCLP results showed that washed soil from Sample L met the EPA limit of 5 mgrlŽ .after both the water wash and chemically enhanced wash Table 4 . TCLP-lead
concentrations in washed soil from Samples A and H exceeded the EPA limit, whichwould require these materials to be regulated as a hazardous waste and subject to landdisposal restrictions. The results were highly variable and showed higher concentrationsafter washing than before washing in Samples A and H.
Chemically enhanced washed soil from Sample L contained lower concentrations ofŽ . Ž .lead 445 mgrkg than the preliminary treatment goal 500 mgrkg , but washed soil
from Samples A and H did not meet the treatment goal. These data indicate a practicallimiting concentration of about 560 mgrkg for treatment of lead-contaminated soils toconcentrations below 500 mgrkg without prior particulate lead removal. If particulatemetals such as lead are present in soils, a specific gravity separation step should precedeany enhanced chemical leaching step to maximize metal leachability and to reduce totalconcentrations remaining in the soil.
Concentrations of lead were generally about two times higher in residual fine materialŽ .than in the untreated bulk soil samples Table 5 . Concentrations of lead were slightly
higher in the water collected after one surfactant wash than in water collected after onewater wash or one pH wash. Lead concentrations were much lower in residual watercollected after the chemically enhanced wash than water collected from the particle-size
Ž .separation process Tables 3 and 5 .

( )R.G. Sheets, B.A. BergquistrJournal of Hazardous Materials 66 1999 137–150148
3.4. Comparison of particle-size separation and chemically enhanced washing
The relative removal of chemical mass from coarser soil particles is shown for thethree different soil washing procedures in Fig. 7. For all samples, the percentage ofPCBs removed from soil was generally lowest with particle size separation and highestwith chemically enhanced soil washing. The three cycles of chemically enhanced soilwashing had a positive effect on removing PCBs from Sample A, compared to theresults observed for Samples L and H which only had one cycle. For lead, soil washingwith either water or additives did not improve contaminant removal from the soil. Ingeneral, the most highly contaminated soil, Sample H, had the highest amount ofcontaminant removed using each treatment method.
Table 6 compares the lowest final contaminant concentrations reached for the particlesize separation and the chemically enhanced soil washing along with the percentage oftotal material the soil comprises. Particle-size separation reduced the amount of materialabove the lead preliminary treatment goal by 35 to 53%. In the chemically enhanced soilwashing which only separates material into fines and soil, the lead preliminary treatmentgoal was only achieved in the soil with the lowest initial concentration of lead.
The chemically enhanced soil washing method using three surfactant washes wassuccessful at cleaning 78% of the material to concentrations below the preliminarytreatment goal for Sample A. Surfactant cleaning of Sample L reduced soil PCBconcentrations to 15 mgrkg, very close to the preliminary treatment goals. Those resultsindicate that Sample L would likely reach the treatment goal of 10 mgrkg with
Fig. 7. Mass of PCBs and lead remaining in soils after particle size separation and soil washing.
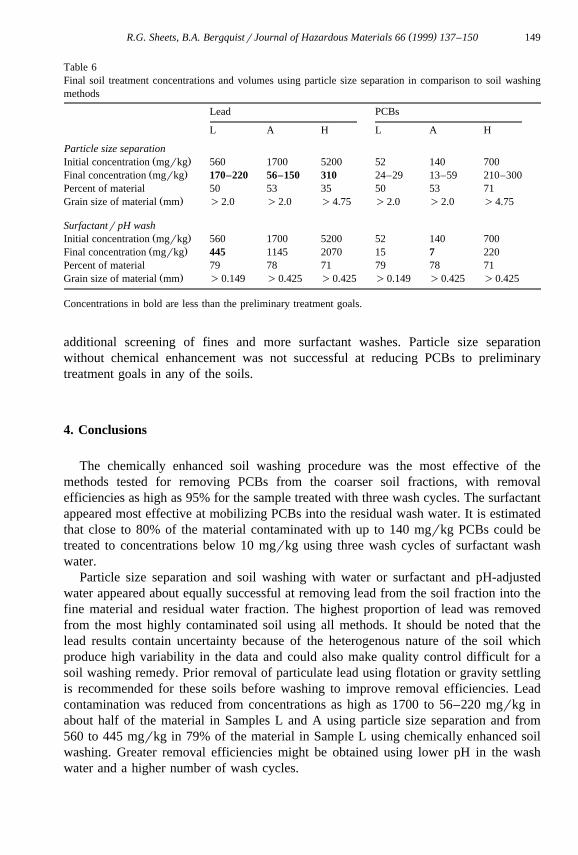
( )R.G. Sheets, B.A. BergquistrJournal of Hazardous Materials 66 1999 137–150 149
Table 6Final soil treatment concentrations and volumes using particle size separation in comparison to soil washingmethods
Lead PCBs
L A H L A H
Particle size separationŽ .Initial concentration mgrkg 560 1700 5200 52 140 700Ž .Final concentration mgrkg 170–220 56–150 310 24–29 13–59 210–300
Percent of material 50 53 35 50 53 71Ž .Grain size of material mm )2.0 )2.0 )4.75 )2.0 )2.0 )4.75
Surfactantr pH washŽ .Initial concentration mgrkg 560 1700 5200 52 140 700Ž .Final concentration mgrkg 445 1145 2070 15 7 220
Percent of material 79 78 71 79 78 71Ž .Grain size of material mm )0.149 )0.425 )0.425 )0.149 )0.425 )0.425
Concentrations in bold are less than the preliminary treatment goals.
additional screening of fines and more surfactant washes. Particle size separationwithout chemical enhancement was not successful at reducing PCBs to preliminarytreatment goals in any of the soils.
4. Conclusions
The chemically enhanced soil washing procedure was the most effective of themethods tested for removing PCBs from the coarser soil fractions, with removalefficiencies as high as 95% for the sample treated with three wash cycles. The surfactantappeared most effective at mobilizing PCBs into the residual wash water. It is estimatedthat close to 80% of the material contaminated with up to 140 mgrkg PCBs could betreated to concentrations below 10 mgrkg using three wash cycles of surfactant washwater.
Particle size separation and soil washing with water or surfactant and pH-adjustedwater appeared about equally successful at removing lead from the soil fraction into thefine material and residual water fraction. The highest proportion of lead was removedfrom the most highly contaminated soil using all methods. It should be noted that thelead results contain uncertainty because of the heterogenous nature of the soil whichproduce high variability in the data and could also make quality control difficult for asoil washing remedy. Prior removal of particulate lead using flotation or gravity settlingis recommended for these soils before washing to improve removal efficiencies. Leadcontamination was reduced from concentrations as high as 1700 to 56–220 mgrkg inabout half of the material in Samples L and A using particle size separation and from560 to 445 mgrkg in 79% of the material in Sample L using chemically enhanced soilwashing. Greater removal efficiencies might be obtained using lower pH in the washwater and a higher number of wash cycles.
( )R.G. Sheets, B.A. BergquistrJournal of Hazardous Materials 66 1999 137–150150
Acknowledgements
The authors would like to thank Shannon Kulp for laboratory assistance andWoodward Clyde Consultants for asistance with data reduction, validation, and interpre-tation. Some of this work was previously published in a Soil Treatability Study Reportprepared for the US EPA.
References
w x Ž .1 R.A. Griffiths, Journal of Hazardous Materials 40 1995 175.w x Ž .2 A.S. Abdul, T.L. Gibson, Environ. Sci. Technol. 25 1991 665.w x Ž .3 I.A. Legiec, Environmental Progress 16 1997 88.w x Ž .4 D. Grasso, M.A. Butkus, D. O’Sullivan, N.P. Nikolaidis, Water Res. 31 1997 3045.w x Ž .5 C.N. Neale, R.M. Bricka, A.C. Chao, Environmental Progress 16 1997 274.w x Ž .6 J.E. van Benshchoten, M.R. Matsumoto, W.H. Young, Journal of Environmental Engineering 123 1997
217.w x Ž .7 US EPA, Guide for Conducting Treatability Studies under CERCLA: Soil Washing Interim Guidance ,
EPAr540r2-91r020A, 1991.