la viticultura de precisión en la mejora de la calidad del
TRANSCRIPT

Valencia, 12 de junio de 2015
JORNADA INTERNACIONAL
VINTAGE
La viticultura de precisión en la mejora de la calidad del vino
EDITORIAL
EDITORIAL Jornada organizada porel Máster International Vintage
(Erasmus Mundus)y el Vintage Master Club

JORNADA INTERNACIONAL VINTAGE“La viticultura de precisión en la mejora de la calidad del vino”
Jornada organizada porel Máster International Vintage (Erasmus Mundus)
y el Vintage Master Club
Valencia, 12 de junio de 2015
EDITORIALUNIVERSITAT POLITÈCNICA DE VALÈNCIA

Jornadas UPV
© Editores : José Luís Aleixandre Benavent Juan Francisco Giner Gonzálbez
© de los textos: los autores
© 2015, de la presente edición: Editorial Universitat Politècnica de València
www.lalibreria.upv.es / Ref: 6238_01_01_01
ISBN: 978-84-9048-362-6 (versión CD)Depósito Legal: V-1517-2015
Queda prohibida la reproducción, la distribución, la comercialización, la transformación y, en general, cualquier otra forma de explotación, por cualquier procedimiento, de la totalidad o de cualquier parte de esta obra sin autorización expresa y por escrito de los autores.

3
Contenido
5 Analysis and historical retrospective of precision viticultureOphélie Diebolt, Claudia Miranda, and José Luis Aleixandre-Tudó
16 Within-fieldvariabilityandvariableratenitrogenfertilizationinaBarberavineyardMatteo Gatti and Stefano Poni
30 VineRobot:roboticsforprecisionviticultureFrancisco Rovira-Más
33 Cartografía del vigor con medida NDVI y aplicaciones prácticas sobre el viñedoBordelésRichard Vanrenterghem
39 Tecnologíasemergentesinviticulturadeprecisiónparamejorarlacalidaddelauvaydel vinoJavier Tardáguila y María Paz Diago
4
Ponencias

5
“La
vitic
ultu
ra d
e pr
ecis
ión
en la
mej
ora
de la
cal
idad
del
vino
”
JO
RN
ADA
INTE
RN
ACI
ON
AL
VIN
TAG
E
ANALysIs AND hIsTORICAL RETROspECTIVE Of pRECIsION VITICuLTuRE
Ophélie Diebolt, Claudia Miranda, and José Luis Aleixandre-Tudó
Universidad Politécnica de Valencia (Spain)
ABSTRACT: Since the beginning of technical precision viticulture in combination with the appearance of sensors and monitors performance, particularly in Australia and the United States back in 1999, there have been major advances in the analysis of vineyard variability and in the optimization of grapes production. Considering the last decade, wireless technologies have been increasingly applied in precision agriculture. In particular, wireless monitoring systems have been used in precision viticulture in order to understand vineyard variability, and therefore suggest appropriate management practices to improve grapes quality. Precision viticulture has been developed according to consumer needs, environmental conditions and tech-nological advancement.
Keywords: Precision viticulture, Precision agriculture, Vineyard, Technology
1. INTRODUCTIONIt has been well recognized that there is an increasing need in agriculture to adopt site-specific management practices because of economic and environmental pressures (Frogbrook and Oliver, 2007; Ortega et al., 2003). Moreover, during the last fifteen years many new technologies have been developed for, or adapted to, agricultural use (Tisseyre and Taylor, 2004). For example, part of the information gathered with this technology could enhance interpretation of plant growth and improve site-specific management practices (Zaman and Salyani, 2004).
Nevertheless, this management requires accurate knowledge about the spatial variation of soil properties within determinate fields. In viticulture the understanding of the nature, extent and causes of vineyard variability may help grape-growers and winemakers to use precision farming tools to improve management practices such as irrigation, fertilization, pruning and harvesting (Bramley and Lamb, 2006).
PA (precision agriculture) may be defined as a management strategy that uses information technologies to bring data from multiple sources to bear on decisions associated with crop production. Under the scope of PA new terms has been produced e.g. PV (precision viticulture) (Li and Chung, 2015). PA innovation, technology and the consequent extended adoption by other areas are still an issue of interest and discussion for future direction of PA and PV implementation in
Analysis and historical retrospective of precision viticultureOphélie Diebolt, Claudia Miranda, and José Luis Aleixandre-Tudó
6
“La
vitic
ultu
ra d
e pr
ecis
ión
en la
mej
ora
de la
cal
idad
del
vino
”
JO
RN
ADA
INTE
RN
ACI
ON
AL
VIN
TAG
E
different countries and regions. Also, new developments in computer hardware and software, global navigation satellite systems (GNSS), canopy sensors and remote sensing offer opportunities for fast and inexpensive crop controls (Zaman and Salyani, 2004; Llorens et al., 2010).
PV is a production system that promotes variable management practices within a field according to site conditions (Morais et al., 2008). PV is recommend to simple or very unique fields that poses very specific challenges, mostly due to the topographic profile, pronounced climatic variations, variability of grape and complex soil characteristics (Morais et al., 2008; Matese et al., 2009). Grape harvest and disease predictions as well as the assessment of the grape value are currently left to the grape growers, without the help of decision-support mechanisms (Matese et al., 2009).
Considering that the main goal of PV is to simultaneously maximize both quality and yield production (Morais et al., 2008; Matese et al., 2009), PV needs an array of sensors that monitors the environmental, climatic and physiological parameters, factors that allow, in an adequate combination, to achieve high efficacy and efficiency values (Morais et al., 2008; Llorens et al., 2010).
This paper will present a brief review of the history of PV and the application of new related technologies. It focusses, in its first section, in climate, soil, and plant quality monitoring systems. In the following section, some current PV applications, tools and methods applied to improve the production system which takes into account fertilization, irrigation, pruning and harvest are also presented.
2. HISTORY Traditionally, viticultural practices have been performed in the vineyards in a constant manner. The same intensity or dose in operations such as pruning, fertilizing, phytosanitary treatments, irrigation, etc., has been applied regardless of the exact location within the vineyard (Arno et al., 2009).
However, under the arguments of how PV can be positively used by vine growers and wine makers, McConnell et al. (1983) and Giles et al. (1989), studied the use of electronic devices to measure crop dimensions and pesticide application. Both studies concluded that control based upon target measurement, rather than simple target detection resulted in substantial increases in savings of applied spray liquid.
In further research related with treatment efficiency Solanelles et al. (2002) reported the effect of different shapes, sizes and foliar densities in tree crops during the same growing season and found that a continuous adjustment of the applied dose rate is required to optimize the spray application efficiency and reduce environmental contamination. Thereby, the importance of the information, equipment or people geolocation within vineyards plays a critical role, highly influencing grape and wine production (Tisseyre and Taylor, 2004).
Despite the relative infancy of PV, many research projects exist in practically all the significant wine production areas of the world; including, France (Tisseyre et al., 2005; Goutouly and Gaudillière, 2006, Bobillet et al., 2005), Spain (Arno et al., 2005), U.S.A (Johnson et al., 2003), Chile (Ortega-Farias et al., 2003; Ortega et al., 2003; Best et al., 2005), South Africa (Strever, 2004), New Zealand (Pratt et al., 2004) and Australia, country where the basses of PV seems to be most advanced (Lamb et al., 2004; Bramley and Hamilton, 2004; Taylor et al., 2005).
Some of the current research projects are aimed to develop and analyse sensing systems, such as biomass or leaf area index sensors, yield sensors and quality sensors to provide accrued information, a very desirable goal to achieve in viticulture. Nevertheless, the appearance of other projects to quantify the within vineyard variability in combination with data processing tools to assist winegrowers in decision-making, are also possible now with the use of PV. With a combination of these technologies and methodologies winegrowers will thus be able to improve and optimise the production process by taking into account technical and economic management aspects as well as environmental concerns.
An example of such an improvement is the site-specific management with the objective to optimize fertilizer applications or water use efficiency in irrigated vineyards (Tisseyre and Taylor, 2004).
Analysis and historical retrospective of precision viticultureOphélie Diebolt, Claudia Miranda, and José Luis Aleixandre-Tudó
7
“La
vitic
ultu
ra d
e pr
ecis
ión
en la
mej
ora
de la
cal
idad
del
vino
”
JO
RN
ADA
INTE
RN
ACI
ON
AL
VIN
TAG
E
3. APPLICATION OF PRECISION VITICULTURE
3.1.Climatemonitoring
Weather station
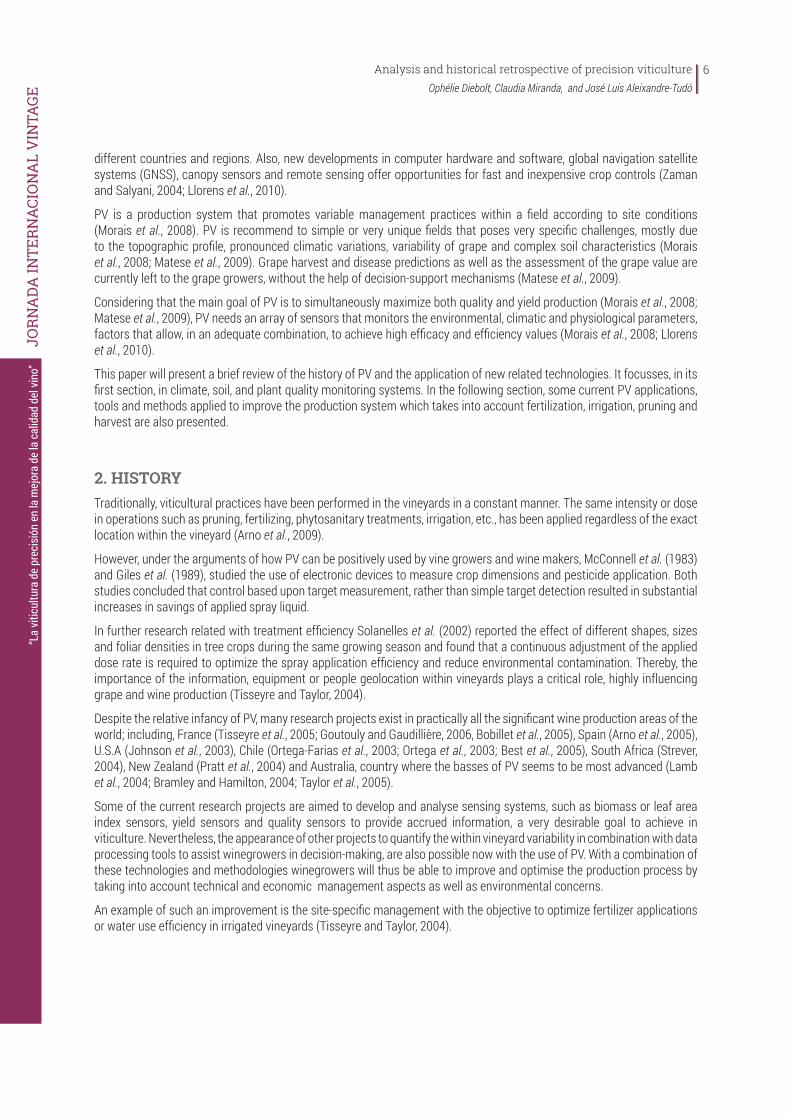
The climate is one the variables that influences annual variability. Moreover, microclimates within vineyard are one of the reasons of plot variability. Hail, drought or rainfall can represent a big threat for grapes quality also highly influencing diseases development. Weather stations allow to measure climatic factors such us temperature, relative humidity, UV ray, wind direction, wind strength and evapotranspiration. Predictive models are then built using the recorded information. Winegrowers have thus available valuable information that can be used in the definition of the irrigation regime and/or phytosanitary treatments.
Figure 1 | Weather station components. Source: www-k12.atmos.washington.edu
Applicationtophytosanitarytreatments
The application of predictive models of disease, based on climate records appears as a very useful tool in modern crop management. First of all it allows a reduction in the number of pesticide treatments to apply since it provides a better monitoring of the diseases cycles and secondly because it permits to use less aggressive preventive treatments which are more respectful to the ecosystem balance than curative ones. Finally it is also important the selection of a suitable prediction model always based on the climatic characteristics of the area.
Applicationtoirrigation
In the same way as phytosanitary treatments, irrigation programs can be based on rainfall accumulated historical analysis and also on weather forecasting in the area over a certain period of time. This can be of high importance for irrigation regime decision-making.
Analysis and historical retrospective of precision viticultureOphélie Diebolt, Claudia Miranda, and José Luis Aleixandre-Tudó
8
“La
vitic
ultu
ra d
e pr
ecis
ión
en la
mej
ora
de la
cal
idad
del
vino
”
JO
RN
ADA
INTE
RN
ACI
ON
AL
VIN
TAG
E
3.2.SoilmonitoringThe variability of a vineyard is linked to the variability of the complex soil composition. Soil properties can vary with space, time and physical and microbiological reactions. Soil characterization can be complicated and expensive. This is probably the main reason why almost every vineyard has been planted without a study of soil variability. This thus leads to heterogeneous plantations together with heterogeneous quality of the grapes within a plot. Soil variability studies might help to rectify this problem by measuring vigour, fertility, yield, and soil characteristics at different sample spots. The transcription of the recorded information into maps will help to identify homogeneous crop units. Once plot variability is known treatments such us irrigation, nutrition and canopy management could be adapted accordingly to each unit fitting the exact needs of each location.
Mappingspatialvariability
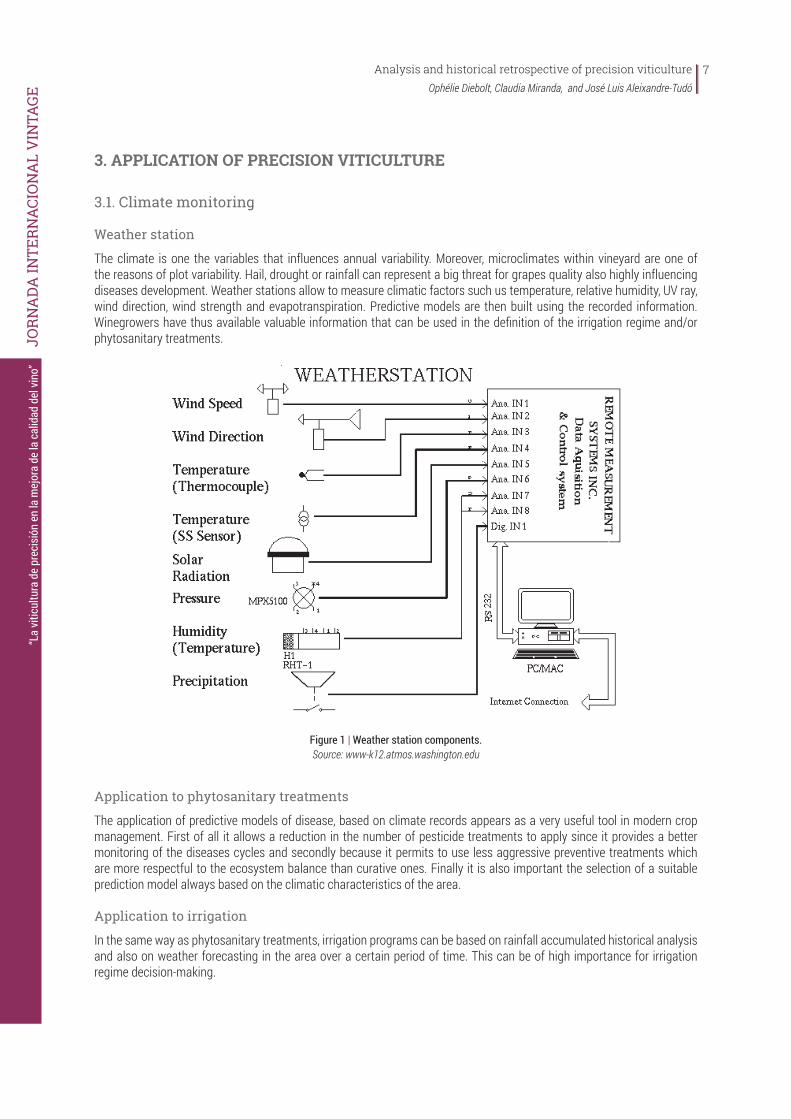
Soil properties can be measured based on the soil electro-magnetic properties. The apparent soil electrical conductivity (ECa) (Corwin and Lesch, 2005; Samouellian et al., 2005) is thus measured using this technology. This parameter is strongly correlated with the texture of the soil, the water retention capacity, the organic matter content, the salinity and the depth of the soil. In practice, sensors are placed on a tractor connected to a GPS (global positioning system) which does continual measurements. All this information can also be used in the spatial variability maps drawing. Three types of ECa sensors are available:
· Electrical Resistivity (ER) sensors. Utilise invasive electrodes to provide information on the form of subsurface heterogeneities and their electrical properties (Samouellian et al., 2005). Commercial examples of ER sensors include the Automatic Resistivity Profiling device (ARP) and the Veris 3100 (Veris Technologies, Salina Kansas, USA).
· Non-invasive Electromagnetic Induction (EMI or EM) sensors. Commercial examples of EMI sensors include the EM-31 and EM-38 soil conductivity meters (Geonics Ltd, Mississauga, ON. Canada) and DualEM systems (DualEM, Milton, ON, Canada).
· Time domain reflectometry (TDR) sensors.
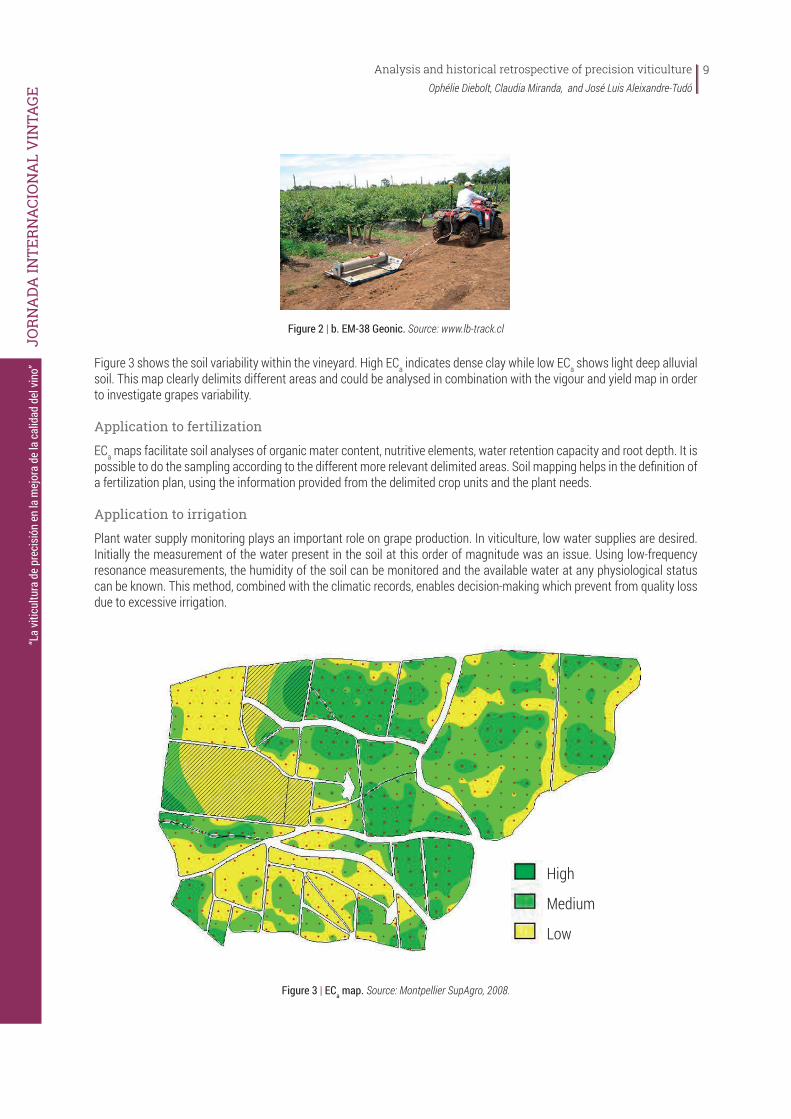
ER and EM technologies are largely used in viticulture. Barbeau et al. (2005) used ER to compare the effect of grass cover on soil water distribution. Taylor (2004), Best et al. (2005) and Bramley (2005) have used ECa information to delineate within-field soil zones. However the distortion of the values caused by trellis wire, especially for vineyards with small row spacing (<2.5 m) has been identified as the main drawback of this approach (Lamb et al. 2005).
Figure 2 | a. Veris 3100. Source: www.ext.colostate.edu.
Analysis and historical retrospective of precision viticultureOphélie Diebolt, Claudia Miranda, and José Luis Aleixandre-Tudó
9
“La
vitic
ultu
ra d
e pr
ecis
ión
en la
mej
ora
de la
cal
idad
del
vino
”
JO
RN
ADA
INTE
RN
ACI
ON
AL
VIN
TAG
E
Figure 2 | b. EM-38 Geonic. Source: www.lb-track.cl
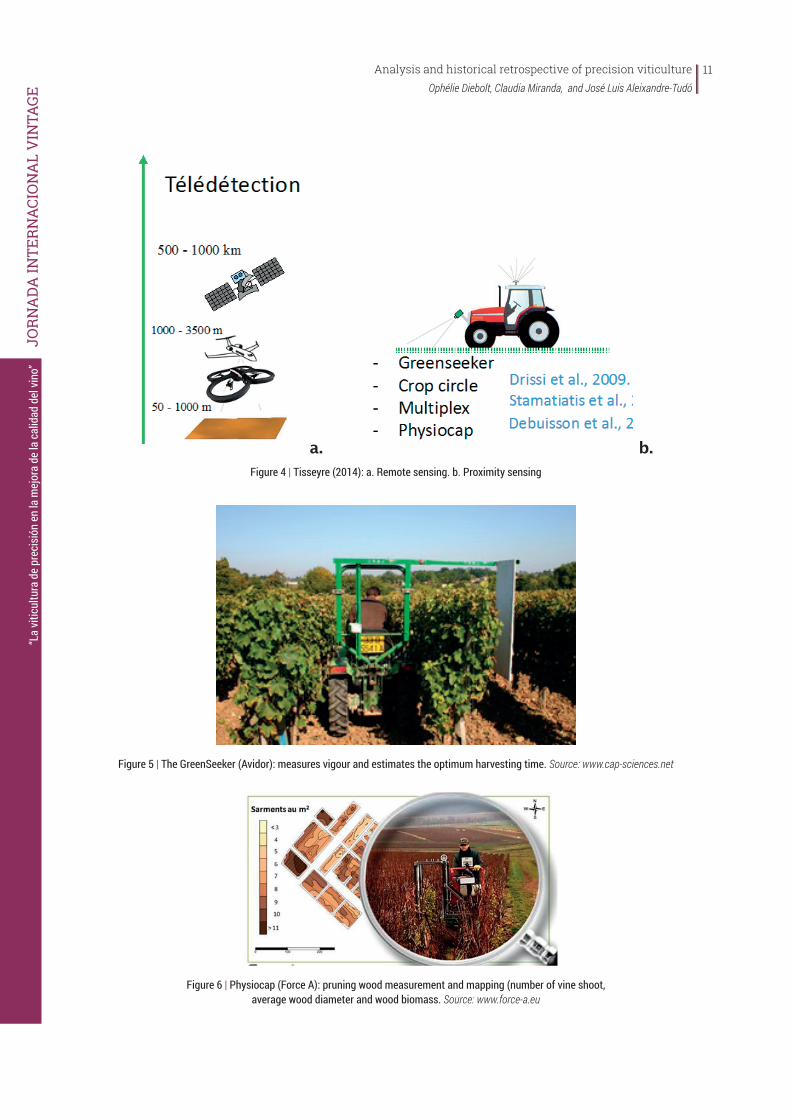
Figure 3 shows the soil variability within the vineyard. High ECa indicates dense clay while low ECa shows light deep alluvial soil. This map clearly delimits different areas and could be analysed in combination with the vigour and yield map in order to investigate grapes variability.
Applicationtofertilization
ECa maps facilitate soil analyses of organic mater content, nutritive elements, water retention capacity and root depth. It is possible to do the sampling according to the different more relevant delimited areas. Soil mapping helps in the definition of a fertilization plan, using the information provided from the delimited crop units and the plant needs.
Applicationtoirrigation
Plant water supply monitoring plays an important role on grape production. In viticulture, low water supplies are desired. Initially the measurement of the water present in the soil at this order of magnitude was an issue. Using low-frequency resonance measurements, the humidity of the soil can be monitored and the available water at any physiological status can be known. This method, combined with the climatic records, enables decision-making which prevent from quality loss due to excessive irrigation.
Figure 3 | ECa map. Source: Montpellier SupAgro, 2008.
High
Medium
Low

Analysis and historical retrospective of precision viticultureOphélie Diebolt, Claudia Miranda, and José Luis Aleixandre-Tudó
10
“La
vitic
ultu
ra d
e pr
ecis
ión
en la
mej
ora
de la
cal
idad
del
vino
”
JO
RN
ADA
INTE
RN
ACI
ON
AL
VIN
TAG
E
3.3.PlantmonitoringSite-specific plant monitoring is nowadays widely extended in grape production. Especially vigour and canopy management are monitored using different types of sensors.
Earthremotesensing
Earth remote sensing collects data with sensors positioned in the air or in earth orbit. In precision viticulture satellite high-resolution pictures (1,85-3,2 m/pixel) are used (Ikonos, QuickBird, WorldView-2, etc.). Moreover, pictures taken by small planes or drones with multispectral cameras (0,2-0,5m/pixel) or aerial infrared photography contribute heat maps drawing. This data collection combined with a geographic information system (GIS) provides useful information by means of real data. The use of earth remote sensing data often constitutes a relevant and low cost information source to perform vigour zoning at a within-field level.
Aerial and satellite images are generally processed to estimate vine vigour with vegetative indices, such as Normalised Difference Vegetative Index (NDVI), Plant Cell Density (PCD) and Photosynthetic Vigour Ratio (PVR) (Lamb and Bramley, 2004). In remote sensing, vigour is understood as a combination of plant biomass (vine size) and photosynthetically active biomass (PAB) (=photosynthetic activity) (Bramley, 2001). These indexes therefore allow for the identification and delimitation of different vigour areas where for example vigorous vines are characterised by larger and denser canopies than lower vigour vines. Many authors have shown relationships between NDVI and vine parameters including Leaf Area Index (LAI) (Johnson et al., 2003), annual pruning weight (Dobrowski et al., 2003), or other vine parameters (Lamb et al., 2004) at a within vineyard level. However, although zones based on these indexes correspond to more or less vegetative crop growth, and even performance, the correlation between the quality of the grapes and the different areas delimited is not always achieved (Santesteban et al., 2010).
However, the combination of vegetative indexes with others variables such us fertility maps, vegetative development maps (number of buds), fruit loading, pruning weight, etc. can counterbalance this limit of multispectral remote sensing (Martínez-Casasnovas et al., 2012).
The use of hyperspectral and thermal remote sensing represents a jump to a better determination of physiological indexes and hydric status of the plant, with much more precision. Recent studies show the use of physiological indexes calculated from hyperspectral images as possible indicators to assess the quality of the grapes in vineyards affected by iron deficiency (chlorosis) (Martin et al., 2007; Meggio et al., 2010), or by water deficit (Pons et al., 2013). Thus, the increase of carotenes and anthocyanins which occurs in water stress or micronutrient deficiencies (iron), and can be detected from hyperspectral index, is a good indicator of the grape phenolic maturity (Meggio et al., 2010). Moreover, the estimated water deficit through indices such as the so-called Water Index, better predicts the composition of grapes in terms of sugar content and acidity vegetation indices (Pons et al., 2013).
Although scientific advances have been observed in the last years, hyper spectral and thermal imaging application development on a commercial scale is still incipient. Despite its limitation to predict grape quality, multispectral maps are used for decision-making in precision viticulture.
Proximitysensing
New systems have recently been developed to analyse vigour using sensors for pedestrians or vehicles combined with a positioning system.
Analysis and historical retrospective of precision viticultureOphélie Diebolt, Claudia Miranda, and José Luis Aleixandre-Tudó
11
“La
vitic
ultu
ra d
e pr
ecis
ión
en la
mej
ora
de la
cal
idad
del
vino
”
JO
RN
ADA
INTE
RN
ACI
ON
AL
VIN
TAG
E
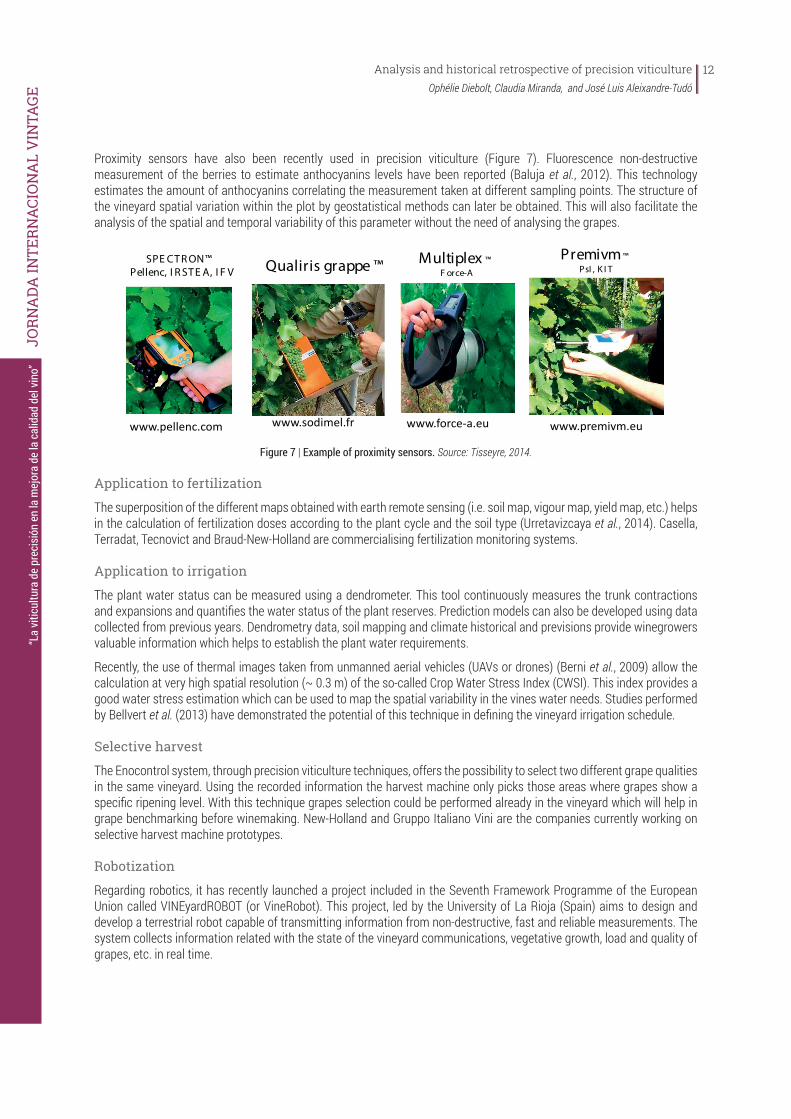
a. b.Figure 4 | Tisseyre (2014): a. Remote sensing. b. Proximity sensing
Figure 5 | The GreenSeeker (Avidor): measures vigour and estimates the optimum harvesting time. Source: www.cap-sciences.net
Figure 6 | Physiocap (Force A): pruning wood measurement and mapping (number of vine shoot,
average wood diameter and wood biomass. Source: www.force-a.eu
Analysis and historical retrospective of precision viticultureOphélie Diebolt, Claudia Miranda, and José Luis Aleixandre-Tudó
12
“La
vitic
ultu
ra d
e pr
ecis
ión
en la
mej
ora
de la
cal
idad
del
vino
”
JO
RN
ADA
INTE
RN
ACI
ON
AL
VIN
TAG
E
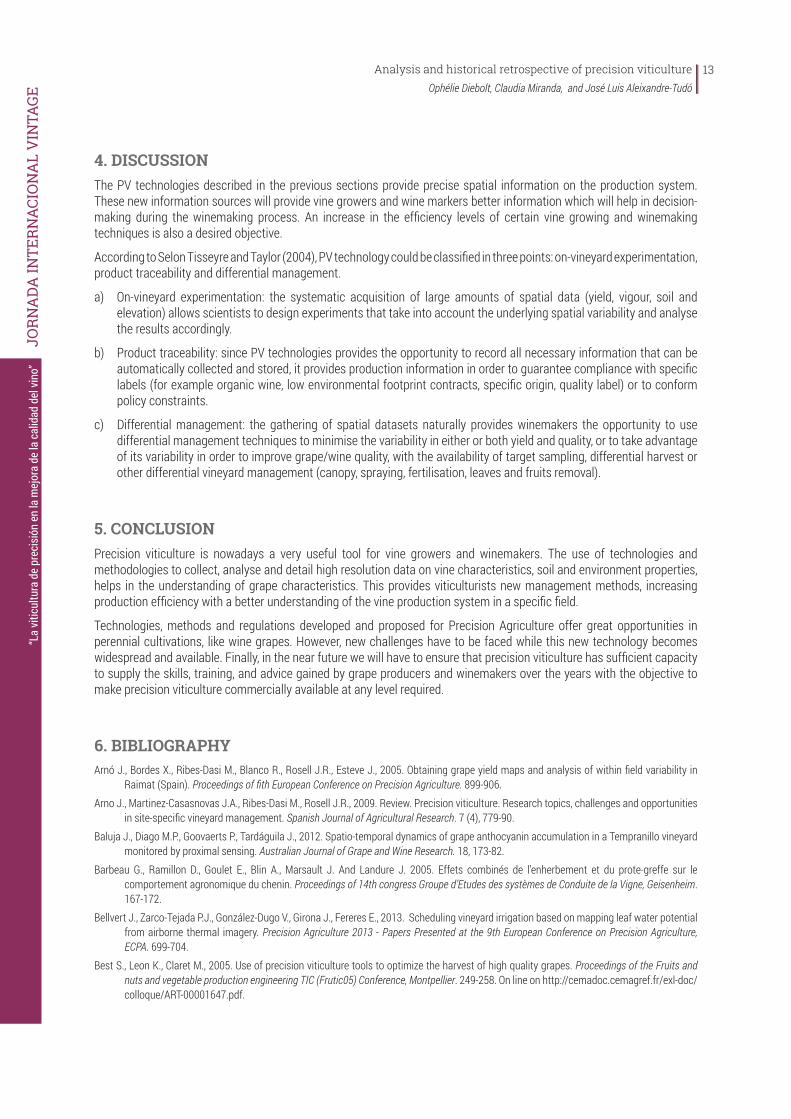
Proximity sensors have also been recently used in precision viticulture (Figure 7). Fluorescence non-destructive measurement of the berries to estimate anthocyanins levels have been reported (Baluja et al., 2012). This technology estimates the amount of anthocyanins correlating the measurement taken at different sampling points. The structure of the vineyard spatial variation within the plot by geostatistical methods can later be obtained. This will also facilitate the analysis of the spatial and temporal variability of this parameter without the need of analysing the grapes.
Vers des capteurs embarqués sur piéton, géo-référencés permettant des mesures non destructives (spectrometries, fluorescence, analyse d’image)
Multiplex ™F orce-A
SPE CT R ON™ Pellenc, I R ST E A, I F V
www.pellenc.com www.force-a.eu
Qualiris grappe ™
www.sodimel.frBaluja et al., 2012.Geraudie et al., 2010 Serrano et al., 2005
Premivm™PsI , K I T
www.premivm.euNavratil et al., 2012.
Exemples de produits et services
Figure 7 | Example of proximity sensors. Source: Tisseyre, 2014.
Applicationtofertilization
The superposition of the different maps obtained with earth remote sensing (i.e. soil map, vigour map, yield map, etc.) helps in the calculation of fertilization doses according to the plant cycle and the soil type (Urretavizcaya et al., 2014). Casella, Terradat, Tecnovict and Braud-New-Holland are commercialising fertilization monitoring systems.
Applicationtoirrigation
The plant water status can be measured using a dendrometer. This tool continuously measures the trunk contractions and expansions and quantifies the water status of the plant reserves. Prediction models can also be developed using data collected from previous years. Dendrometry data, soil mapping and climate historical and previsions provide winegrowers valuable information which helps to establish the plant water requirements.
Recently, the use of thermal images taken from unmanned aerial vehicles (UAVs or drones) (Berni et al., 2009) allow the calculation at very high spatial resolution (~ 0.3 m) of the so-called Crop Water Stress Index (CWSI). This index provides a good water stress estimation which can be used to map the spatial variability in the vines water needs. Studies performed by Bellvert et al. (2013) have demonstrated the potential of this technique in defining the vineyard irrigation schedule.
selective harvest
The Enocontrol system, through precision viticulture techniques, offers the possibility to select two different grape qualities in the same vineyard. Using the recorded information the harvest machine only picks those areas where grapes show a specific ripening level. With this technique grapes selection could be performed already in the vineyard which will help in grape benchmarking before winemaking. New-Holland and Gruppo Italiano Vini are the companies currently working on selective harvest machine prototypes.
Robotization
Regarding robotics, it has recently launched a project included in the Seventh Framework Programme of the European Union called VINEyardROBOT (or VineRobot). This project, led by the University of La Rioja (Spain) aims to design and develop a terrestrial robot capable of transmitting information from non-destructive, fast and reliable measurements. The system collects information related with the state of the vineyard communications, vegetative growth, load and quality of grapes, etc. in real time.
Analysis and historical retrospective of precision viticultureOphélie Diebolt, Claudia Miranda, and José Luis Aleixandre-Tudó
13
“La
vitic
ultu
ra d
e pr
ecis
ión
en la
mej
ora
de la
cal
idad
del
vino
”
JO
RN
ADA
INTE
RN
ACI
ON
AL
VIN
TAG
E
4. DISCUSSION The PV technologies described in the previous sections provide precise spatial information on the production system. These new information sources will provide vine growers and wine markers better information which will help in decision-making during the winemaking process. An increase in the efficiency levels of certain vine growing and winemaking techniques is also a desired objective.
According to Selon Tisseyre and Taylor (2004), PV technology could be classified in three points: on-vineyard experimentation, product traceability and differential management.
a) On-vineyard experimentation: the systematic acquisition of large amounts of spatial data (yield, vigour, soil and elevation) allows scientists to design experiments that take into account the underlying spatial variability and analyse the results accordingly.
b) Product traceability: since PV technologies provides the opportunity to record all necessary information that can be automatically collected and stored, it provides production information in order to guarantee compliance with specific labels (for example organic wine, low environmental footprint contracts, specific origin, quality label) or to conform policy constraints.
c) Differential management: the gathering of spatial datasets naturally provides winemakers the opportunity to use differential management techniques to minimise the variability in either or both yield and quality, or to take advantage of its variability in order to improve grape/wine quality, with the availability of target sampling, differential harvest or other differential vineyard management (canopy, spraying, fertilisation, leaves and fruits removal).
5. CONCLUSION Precision viticulture is nowadays a very useful tool for vine growers and winemakers. The use of technologies and methodologies to collect, analyse and detail high resolution data on vine characteristics, soil and environment properties, helps in the understanding of grape characteristics. This provides viticulturists new management methods, increasing production efficiency with a better understanding of the vine production system in a specific field.
Technologies, methods and regulations developed and proposed for Precision Agriculture offer great opportunities in perennial cultivations, like wine grapes. However, new challenges have to be faced while this new technology becomes widespread and available. Finally, in the near future we will have to ensure that precision viticulture has sufficient capacity to supply the skills, training, and advice gained by grape producers and winemakers over the years with the objective to make precision viticulture commercially available at any level required.
6. BIBLIOGRAPHYArnó J., Bordes X., Ribes-Dasi M., Blanco R., Rosell J.R., Esteve J., 2005. Obtaining grape yield maps and analysis of within field variability in
Raimat (Spain). Proceedings of fith European Conference on Precision Agriculture. 899-906.Arno J., Martinez-Casasnovas J.A., Ribes-Dasi M., Rosell J.R., 2009. Review. Precision viticulture. Research topics, challenges and opportunities
in site-specific vineyard management. Spanish Journal of Agricultural Research. 7 (4), 779-90.Baluja J., Diago M.P., Goovaerts P., Tardáguila J., 2012. Spatio-temporal dynamics of grape anthocyanin accumulation in a Tempranillo vineyard
monitored by proximal sensing. Australian Journal of Grape and Wine Research. 18, 173-82. Barbeau G., Ramillon D., Goulet E., Blin A., Marsault J. And Landure J. 2005. Effets combinés de l’enherbement et du prote-greffe sur le
comportement agronomique du chenin. Proceedings of 14th congress Groupe d’Etudes des systèmes de Conduite de la Vigne, Geisenheim. 167-172.
Bellvert J., Zarco-Tejada P.J., González-Dugo V., Girona J., Fereres E., 2013. Scheduling vineyard irrigation based on mapping leaf water potential from airborne thermal imagery. Precision Agriculture 2013 - Papers Presented at the 9th European Conference on Precision Agriculture, ECPA. 699-704.
Best S., Leon K., Claret M., 2005. Use of precision viticulture tools to optimize the harvest of high quality grapes. Proceedings of the Fruits and nuts and vegetable production engineering TIC (Frutic05) Conference, Montpellier. 249-258. On line on http://cemadoc.cemagref.fr/exl-doc/colloque/ART-00001647.pdf.
Analysis and historical retrospective of precision viticultureOphélie Diebolt, Claudia Miranda, and José Luis Aleixandre-Tudó
14
“La
vitic
ultu
ra d
e pr
ecis
ión
en la
mej
ora
de la
cal
idad
del
vino
”
JO
RN
ADA
INTE
RN
ACI
ON
AL
VIN
TAG
E
Bobillet W., Da Costa J.P., Germain C., Lavialle O., Grenier G., 2003. Row detection in high resolution remote sensing images of vine fields. Proceeding of the 4th European conference on Precision Agriculture, Berlin. 81-87.
Bramley R. G. V. Hamilton R.P., 2004. Understanding variability in winegrape production systems 1. Within vineyard variation in yield over several vintages. Australian Journal of Grape and Wine Research. 10, 32-45.
Bramley R.G.V., 2005. Understanding variability in winegrape production systems 2. Within vineyrad variation in quality over several vintages, Australian Journal of Grape and Wine Research. 11, 33-45.
Bramley R.G.V., Lanyon D.M., Panten K., 2005. Whole-of vineyard experimentation: an improved basis knowledge generation and decision-making. Proceedings of Fifth European Conference on Precision Agriculture, Uppsala. 907-915.
Bramley, R.G.V., Lamb, D.W., 2006. Precision Viticulture - making sense of vineyard variability. Final Report on Project No. CRV99/5 N to the Grape and Wine Research and Development Corporation. Cooperative Research Centre for Viticulture/GWRDC, Adelaide, Australia.
Corwin D.L., Lesch S.M., 2005. Characterizing soil spatial variability with apparent soil electrical conductivity I. soil survey. Computers and Electronics in Agriculture. 46, 32-45.
Dobrowski S.Z., Ustin S.L., Wolpert J.A., 2003. Grapevine dormant pruning weight prediction using remotely sensed data. Australian Journal of Grape and Wine Research. 9, 177-182.
Frogbrook Z.L., Oliver M.A., 2007. Identifying management zones in agricultural fields using spatially constrained classification of soil and ancillary data. Soil Use Management. 23 (1), 40–51.
Giles D.K., Delwiche M.J., Dodd R.B., 1989. Sprayer control by sensing orchard crop characteristics: orchard architecture and spray liquid savings. Journal Agriculture Engineering Res. 43, 271–289.
Goutouly J.P., Drissi R., Forget D., Gaudillière J.P., 2006. Characterisation of vine vigor by ground based NDVI measurements. In proceeding of VIth International Terroir Congress. ENITA, Bordeaux. 237-242.
Johnson L. F., Roczen D. E., Youkhana S. K., Nemani R. R., Bosch D. F., 2003. Mapping vineyard leaf area with multispectral satellite imagery. Computers and Electronics in Agriculture. 38, 33-44.
Lamb D.W., Mitchell A., Hyde G., 2005. Vineyard trellising with steel posts distorts data form EM soil surveys. Australian Journal of Grape and Wine Research.11, 24-32.
Lamb D.W., Weedon M.M., Bramley R.G.V., 2004. Using remote sensing to predict phenolics and colour at harvest in a Cabernet Sauvignon vineyard: Timing observations against vine phenology and optimising image resolution. Australian Journal of Grape and Wine Research. 10, 46-54.
Lamb D.W., Weedon M.M., Bramley R.G.V., 2004. Using remote sensing to predict phenolics and colour at harvest in a Cabernet Sauvignon vineyard: Timing observations against vine phenology and optimising image resolution. Australian Journal of Grape and Wine Research. 10, 46-54.
Li M. & Chung S., 2015. Computers and Electronics in Agriculture. Special issue on precision agriculture. 112, 1.Llorens J., Gil E., Lop J., Escolà A., 2010. Variable rate dosing in precision viticulture: Use of electronic devices to improve application efficiency.
Crop Protection. 29, 239-248.Martín P., Zarco-Tejada P.J., González M.R., Berjón A., 2007. Using hyperspectral remote sensing to map grape quality in ‘Tempranillo’ vineyards
affected by iron chlorosis. Vitis. 46 (1), 7-14.Martínez-Casasnovas J.A., Agelet-Fernández J., Arnó J., Ramos M.C., 2012. Analysis of vineyard differential management zones and relation to
vine development, grape maturity and quality. Spanish Journal of Agricultural Research. 10 (2), 326-37.Matese A., Di Gennaro S.F., Zaldei A., Genesio L., Vaccari F.P., 2009. A wireless sensor network for precision viticulture: The NAV system. Istituto
di Biometeorologia (IBIMET – CNR), Consiglio Nazionale delle Ricerche, via Caproni 8, 50145 Firenze, Italy. Computers and Electronics in Agriculture. 69, 51–58.
McConnell R.L., Elliot K.C., Blizzard S.H., Koster K.H., 1983. Electronic measurement of tree row volume. Agriculture Electronics. 1, 85–90.Meggio F., Zarco-Tejada P.J., Núñez L.C., Sepulcre-Cantó G., González M.R., Martín P., 2010. Grape quality assessment in vineyards affected by
iron deficiency chlorosis using narrow-band physiological remote sensing indices. Remote Sensing of Environment. 114, 1968-86.Morais R., Fernández M., Matos S., Carlos Serodio C., Ferreira P.J.S.G., Reis M.J.C.S., 2008. A ZigBee multi-powered wireless acquisition device for
remote sensing applications in precision viticulture. Computers and electronics in agriculture. 62, 94–106.Ortega R., Esser A., Santibañez O., 2003. Spatial variability of wine grape yield and quality in Chilean vineyards: economic and environmental
impacts. In: Stafford, J., Werner, A. (Eds.), Precision Agriculture, Proceedings of the 4th European Conference on Precision Agriculture. Wageningen Academic Publishers, the Netherlands. 499–506.
Ortega R., Esser, A., Santibanes O., 2003. Spatial variability of wine grape yield and quality in Chilean vineyards: economic and environmental impacts. Proceedings of the 4th European Conference on Precision Agriculture, Berlin. 499-506.
Ortega-Farias S., Rigetti T., Sasso F., Acevedo C., Matus F., Moreno Y., 2003. Site-specific management of irrigation water in grapevines. IX Latin American Congress on Viticulture and Enology; Symposium on Precision Viticulture, Pontificia Universidad Católica de Chile, Santiago. 55-71.
Analysis and historical retrospective of precision viticultureOphélie Diebolt, Claudia Miranda, and José Luis Aleixandre-Tudó
15
“La
vitic
ultu
ra d
e pr
ecis
ión
en la
mej
ora
de la
cal
idad
del
vino
”
JO
RN
ADA
INTE
RN
ACI
ON
AL
VIN
TAG
E
Pons J.M., Serrano L., Gonzales-Flor C., Gorchs G., 2013. Is PCD a Reliable Indicator of Berry Quality Attributes in Water Stressed Vineyards? En: Proc 1st IW on Vineyard Mechanization & Grape & Wine Quality. S. Poni, ed. ISHS 2013. Acta Hort. 978.
Praat J.P., Bollen F., Irie K., 2004. New approaches to the management of vineyard variability in New Zealand, 12th Australian Wine Industry Technical Conference.
Samouelian A., Cousin I., Tabbagh A., Bruand A., Richard G., 2005. Electrical resistivity survey in soil science: a review. Soil and Tillage research. 83, 173-193.
Santesteban L.G., Miranda C., Jiménez C., Fuentemilla M., Urretavizcaya I., Tisseyre B., 2010. Evaluación del interés del índice NDVI para la delimitación de unidades de manejo diferenciado en una explotación vitícola. Revista de Teledetección. 33, 11-6.
Solanelles F., Planas S., Escolà A., Rosell J.R., 2002. Spray application efficiency of an electronic control system for proportional application to the canopy volume. International advances in pesticide application. Aspects Applied Biology. 66, 139–146.
Strever A., 2004. Assessing and managing within-vineyard variability in south Africa with remote sensing- a tool for resaerch and practice, 12th Australian Wine Industry Technical Conference.
Taylor J., Tisseyre B., Praat J.P., 2005. Bottling Good Information: mixing Tradition and Technology in vineyards. Proceedings of the Fruits and nuts and vegetable production engineering TIC (Frutic05) Conference, Montpellier. 719-736. On line on http://cemadoc.cemagref.fr/exl-doc/colloque/ART-00001747.pdf)
Taylor J.A., 2004. Digital Terroirs and Precision Viticulture. PhD Thesis, The University of Sydney. Tisseyre B., Taylor J., 2004. An overview of methodologies and technologies for implementing. XII Congresso Brasileiro de Viticultura e Enología
– Anais. Recife e Petrolina, PE, Brasil. 45-54. On line on http://www.cnpuv.embrapa.br/publica/anais/cbve12/Tisseyre B., Ojeda H., Carillo N., Deis L., Heywang M., 2005. Precision viticulture and water status: mapping the predawn water potential to define
within vineyard zones. Proceedings of the Fruits and nuts and vegetable production engineering TIC (Frutic05) Conference, Montpellier. 719-736. On line on http://cemadoc.cemagref.fr/exl-doc/colloque/ART-00001663.pdf.
Tisseyre B., 2014, Séminaire Viticulture de précision, “Principe et état des lieux”.Urretavizcaya I., Santesteban L.G., Tisseyre B., Guillaume S., Miranda C., Royo J.B., 2014. Oenological significance of vineyard management zones
delineated using early grape sampling. Precision Agriculture. 15, 111-29.Zaman Q.U., Salyani M., 2004. Effects of foliage density and ground speed on ultrasonic measurement of citrus tree volume. Applied Engineering
in Agriculture. 20 (2), 173–178.
16
“La
vitic
ultu
ra d
e pr
ecis
ión
en la
mej
ora
de la
cal
idad
del
vino
”
JO
RN
ADA
INTE
RN
ACI
ON
AL
VIN
TAG
E
WIThIN-fIElDVARIABIlITyANDVARIABlERATENITRogENfERTIlIzATIoNINABARBERAVINEyARD
Matteo Gatti and Stefano Poni
Department of Sustainable Crop Production – DI.PRO.VE.S., Università Cattolica del Sacro Cuore, Piacenza (Italy)
ABSTRACT: Within-vineyard variability is known to deeply affect vine performance. Precision viticulture (PV) is a precious tool to describe and manage it through innovative variable rate technologies (VRT) that deliver a calibrated input according to the real vine need. Very few comparisons are still available between standard and VRT protocols. The present study aims to: i) describe within-field variability in a vineyard sited in the NW of Italy through a standard NDVI approach; ii) provide agronomical ground truthing on a two year basis (2012-2013) of the NDVI vigor levels; iii) evaluate mid-term effects of VRT-assisted N-supply. A multis-pectral image by remote sensing was taken on July 2010 (full canopy) on a mature, Guyot trained, cv. Barbera/K5BB vineyard planted at 4167 vines/ha. Experimental layout was a vigor level x N-supply strategy factorial. Three vigor levels (low-LV, medium-MV and high-HV) were derived from the NDVI map, whereas the N stra-tegy included traditional, VRA (VR application) and control. The N-supply (kg of N/ha) varied as it follows: control (0 kg/ha), traditional (60 kg/ha), VRT (0, 60 and 120 kg/ha in HV, MV and LV vigor blocks, respectively). In HV, pruning weight was higher than LV (895 vs. 485 g/vine), whereas berry and cluster weight and yield decreased from HV to LV (3 vs. 2.3 g, 291 vs. 181 g and 5.9 vs. 3.2 kg/vine, respectively). Cluster rot intensity varied according to compactness (12 vs. 57% and 17.5 vs. 23.5 g/cm in LV and HV, respectively). Total soluble solids, anthocyanins and phenols were higher in LV than HV (24.9 vs. 22 Brix, 1.56 vs. 0.89 g/kg and 2.66 vs. 1.74 g/kg), while malic acid was highest in HV (4.7 g/L). NDVI was closely correlated with pruning weigh, late-rals growth, berry weight, cluster compactness and must pH. Vines from LV were most balanced and able to provide the best fruit quality in a context of long-aging red wine production. The VRA reduced N waste in HV while vines from LV blocks showed a low sensitivity to increased N supply.
Keywords: Precision Viticulture, Remote Sensing, Ground-truthing, Vineyard Sustainability, Fruit Composition.
INTRODUCTIONLooking at the factors that more than others have influenced viticulture over the last decade, the effects of climate change on grapevine physiology and the spread of precision farming emerge as the most relevant. Precision viticulture (PV) is a precious tool aiming at describing within-field variability and, through variable rate technologies (VRT), delivering inputs (i.e. water or fertilizers) proportionally to real vine needs. Since vineyards are often “variable”, a rising interest in
Within-field variability and variable rate nitrogen fertilization in a Barbera vineyardMatteo Gatti and Stefano Poni
17
“La
vitic
ultu
ra d
e pr
ecis
ión
en la
mej
ora
de la
cal
idad
del
vino
”
JO
RN
ADA
INTE
RN
ACI
ON
AL
VIN
TAG
E
this issue is occurring and several links to grapevine physiology can be discussed. Geological and pedological origins are certainly the main reason of this phenomenon; in effect, variations in soil texture and water holding capacity, soil depth, slope and aspect are just an example of factors that naturally modulate vine performance. Conversely, variability may also arise from questionable agronomical decisions as concerning drainage, land preparation, young vines training, canopy management, shoot positioning and training system selection. A typical example is given by the high variability in shoot growth that typically occurs along a long cane-pruned Merlot that almost disappears when converted to a spur-pruned cordon. So, PV appears as a valid tool that growers can use aiming to manage the natural variability even if it does not represent a solution to a rough vineyard management.
Although the majority of PV experiences are still based on remotely sensed multispectral images by using satellites, aircrafts and unmanned aerial vehicles (generally known as drones), over the last years different manufacturers patented more flexible new devices for proximal sensing based on vision systems, laser scanning, ultrasonic and spectral acquisitions (Wei and Salyani, 2004; Llorens et al., 2011; Tagarakis et al., 2013).
Post-processing is commonly based on the calculation of the NDVI index (Normalized Difference Vegetation Index) allowing vineyard mapping as a function of a variable number of classes (2, 3, 5 or 10) within which vine performance is assumed to be similar. NDVI is based on the sunlight reflectance in red (R) and infrared (IR) wavelength according to the equation (IR-R)/(IR+R); it represents a good indicator of the photosintetically active biomass (PAB) that is related to canopy size (vigor) as well as health and stress status of grapevines (Bramley, 2010). As PV is a relatively new science, its agronomical ground-truthing is still implementing and the closeness of correlations between the more common parameters used in vigor assessment and NDVI values is quite variable and, for instance, sensitive to trellising (Hall et al., 2008). Working on VSP (Vertical Shoot Positioning) trained vines, NDVI was correlated with the leaf area index (Johnson et al., 2003), whilst Dobrowsky et al. (2003) reported medium-high coefficient of determination between pruning weight and PCD (IR/R) that, in turn, is well correlated with NDVI. Preliminary studies have showed that remote sensing might be useful at predicting fruit composition although correlations with color and phenolics are still poor (Lamb et al., 2004). Most recently, characterizing the spatial and temporal changes in Sauvignon blanc fruit composition, Trought and Bramley (2011) reported that PCD index was positively correlated with TA and negatively correlated with total soluble solids and must pH.
As a general approach, it is important that the biological meaning of “vigor” is verified despite that, according to the standard PV protocol, vigor classes are generally labelled as “low”, “medium” and “high”. For example, in a relative low vigor Sangiovese vineyard (Tuscany, Italy) the pruning weight in high vigor blocks was about 500 g per meter of cordon meter (Fiorillo et al., 2012), a value that is agronomically associated to medium-low vigor vines. Conversely, under the high vigor conditions of Marlborough (New Zealand), the PCD was poorly related to Sauvignon blanc yields so that low and high vigor classes showed similar crop load (Bramley et al., 2011).
Besides the characterization of within-field variability, PV offers bases for a targeted vineyard management aiming to a most efficient and sustainable viticulture. In case of selecting harvest, this variability is exploited in order to split the picking of grapes from two areas showing different vegetative and ripening patterns. Accordingly, the selected grapes are processed differently obtaining two wine styles and a potential increase in the retail value (Bramley et al., 2005). As discussed by Bramley et al., (2005), the application of selective harvest is not just limited to mechanized systems but can be also adopted in case of hand picking. Additionally, this strategy may not be appropriated everywhere like in case the product typicality is related to a blend of different ferments (Bramley 2010). Although their diffusion is currently limited, the variable rate applications (VRA) can be used in order to reduce the within-field variability like in case of targeted fertilization, spray, irrigation or canopy management. Proffitt and Malcolm (2005) have reported a reduction in canopy management costs as following the adoption of VRA-irrigation that induced a more balanced vigor, whilst Liakos et al. (2013) assessed the application of variable rate fertilization in a commercial apple orchard describing a 32.4% reduction of fertilizers and a 21% farmer’s profit increase vs. traditional fertilization.
The present study aims to: i) describe within-field variability in a vineyard sited in the NW of Italy through a standard NDVI approach; ii) provide agronomical ground truthing on a two year basis (2012-2013) of the NDVI vigor levels; iii) evaluate mid-term effects of VRT- assisted N-supply.
Within-field variability and variable rate nitrogen fertilization in a Barbera vineyardMatteo Gatti and Stefano Poni
18
“La
vitic
ultu
ra d
e pr
ecis
ión
en la
mej
ora
de la
cal
idad
del
vino
”
JO
RN
ADA
INTE
RN
ACI
ON
AL
VIN
TAG
E
MATERIALS AND METHODS
Plantmaterial,vigormapandexperimentallayout.The trial was carried out in 2012 and 2013 in a commercial, non-irrigated vineyard of Vitis vinifera L. cv. Barbera standard material grafted onto Kober 5BB established in 1990 at Ziano Piacentino, Colli Piacentini DOC area, Malvicini Paolo Estate, (44°59’ N, 9° 22’E, 262 m a.s.l.), Italy. The vineyard is located on a East-facing site having 15% maximum slope with East-West oriented rows; vine spacing is 2.4 m x 2.0 m (inter- and intra-row) with two vines coupled at each position within the row, for a resulting density of 4,167 plants/ha. The parcel area was of about 6404 m2.Vines were single-cane-pruned Guyot trellis with a bud-load of about 10 nodes per vine and trained by vertical shoot positioning (VSP). The cane was raised 70 cm from the ground with three catching wires for a canopy wall extending approximately 1.3 m above the cordon.
The minimum, mean and maximum daily air temperatures (°C) and daily rainfall (mm) from 1 April to 31 October were measured in each season by a nearby weather station.
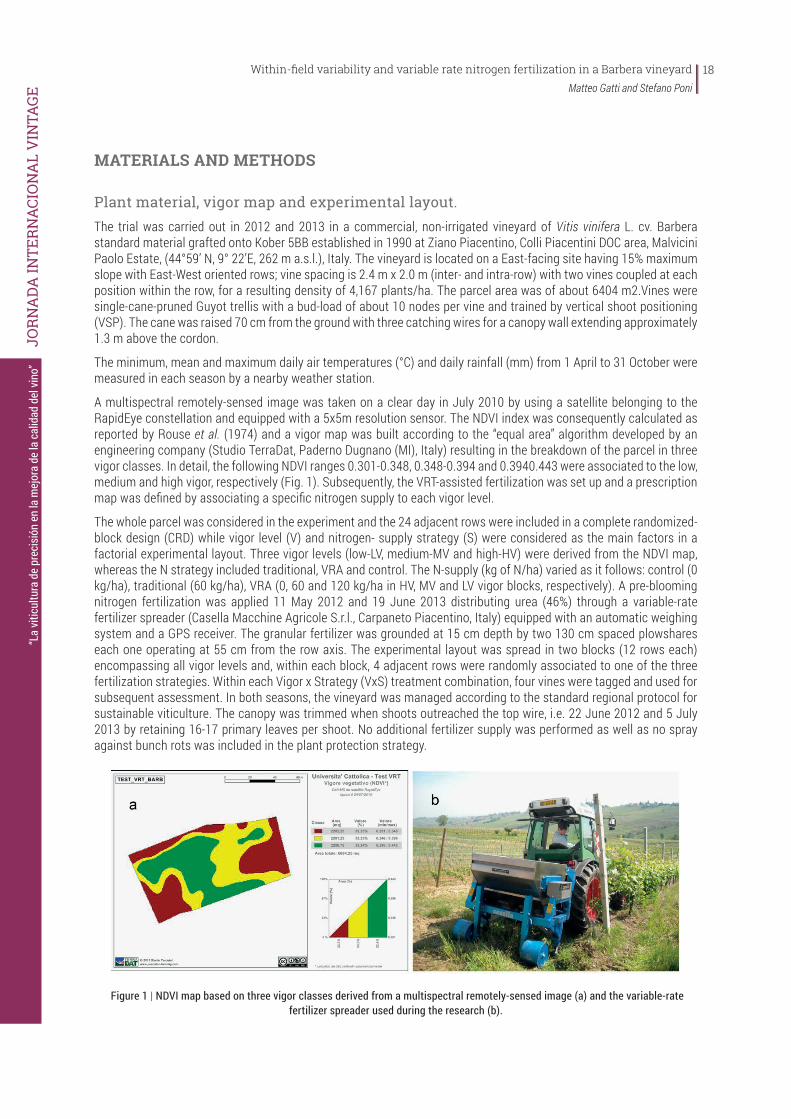
A multispectral remotely-sensed image was taken on a clear day in July 2010 by using a satellite belonging to the RapidEye constellation and equipped with a 5x5m resolution sensor. The NDVI index was consequently calculated as reported by Rouse et al. (1974) and a vigor map was built according to the “equal area” algorithm developed by an engineering company (Studio TerraDat, Paderno Dugnano (MI), Italy) resulting in the breakdown of the parcel in three vigor classes. In detail, the following NDVI ranges 0.301-0.348, 0.348-0.394 and 0.3940.443 were associated to the low, medium and high vigor, respectively (Fig. 1). Subsequently, the VRT-assisted fertilization was set up and a prescription map was defined by associating a specific nitrogen supply to each vigor level.
The whole parcel was considered in the experiment and the 24 adjacent rows were included in a complete randomized-block design (CRD) while vigor level (V) and nitrogen- supply strategy (S) were considered as the main factors in a factorial experimental layout. Three vigor levels (low-LV, medium-MV and high-HV) were derived from the NDVI map, whereas the N strategy included traditional, VRA and control. The N-supply (kg of N/ha) varied as it follows: control (0 kg/ha), traditional (60 kg/ha), VRA (0, 60 and 120 kg/ha in HV, MV and LV vigor blocks, respectively). A pre-blooming nitrogen fertilization was applied 11 May 2012 and 19 June 2013 distributing urea (46%) through a variable-rate fertilizer spreader (Casella Macchine Agricole S.r.l., Carpaneto Piacentino, Italy) equipped with an automatic weighing system and a GPS receiver. The granular fertilizer was grounded at 15 cm depth by two 130 cm spaced plowshares each one operating at 55 cm from the row axis. The experimental layout was spread in two blocks (12 rows each) encompassing all vigor levels and, within each block, 4 adjacent rows were randomly associated to one of the three fertilization strategies. Within each Vigor x Strategy (VxS) treatment combination, four vines were tagged and used for subsequent assessment. In both seasons, the vineyard was managed according to the standard regional protocol for sustainable viticulture. The canopy was trimmed when shoots outreached the top wire, i.e. 22 June 2012 and 5 July 2013 by retaining 16-17 primary leaves per shoot. No additional fertilizer supply was performed as well as no spray against bunch rots was included in the plant protection strategy.
Figure 1 | NDVI map based on three vigor classes derived from a multispectral remotely-sensed image (a) and the variable-rate fertilizer spreader used during the research (b).

Within-field variability and variable rate nitrogen fertilization in a Barbera vineyardMatteo Gatti and Stefano Poni
19
“La
vitic
ultu
ra d
e pr
ecis
ión
en la
mej
ora
de la
cal
idad
del
vino
”
JO
RN
ADA
INTE
RN
ACI
ON
AL
VIN
TAG
E
NutritionalstatusandbunchrotassessmentIn both seasons, the nutritional status was determined at veraison for the eighteen “treatment x block” combinations. According to Bavaresco et al. (2010), 50 leaves were randomly collected from the node opposite to the basal cluster of medium-vigor shoots. Leaves were then taken to the laboratory, blades were cut from the petiole and dried at 75 °C until constant weight. Nitrogen, phosphorus, potassium, magnesium, calcium, sulfur, iron and boron concentrations were determined by an external laboratory according to official methods.
At harvest, bunch rot incidence was visually assessed on all bunches of each tagged vine on the basis of the following fractions of damage: healthy (0%), 1-5%, 6-25%, 26-50%, 51-75% and 76-100%. The bunch rot severity was then calculated by multiplying mean fractional damage within class by frequency.
Vegetativegrowth,yieldandfruitcompositionEach season, when inflorescences were clearly visible (stage 53, BBCH scale) the total number of shoots and inflorescences per plant were calculated in order to determine the shoot fruitfulness.
On 13 September 2013, two 30-leaf samples from each “VxS” combination were separately collected from main and lateral shoots and the area of each leaf determined with a leaf area meter LI-COR 3000 (LI-COR Bioscience, Lincoln, NE). At leaf fall, main and lateral nodes were separately counted and then multiplied by the mean leaf area in order to determine the total leaf area on each tagged vine. At the same time, the pruning weight was recorded separately for main and lateral canes.. Vine balance was given as the yield-to- pruning weight ratio (Ravaz index) and the leaf-to-fruit ratio.
At harvest, 11 September 2012 and 25 September 2013, all clusters per vine were counted and their total weight was immediately recorded; mean cluster weight was than calculated. A three-basal-clusters sample was collected from each tagged vine, transported to the laboratory and processed for subsequent determinations.
All berries per cluster were counted and rachis length was measured to assess cluster compactness expressed as total berry fresh mass/ rachis plus main wing length ratio (g/cm). Two sub-samples were separated by grouping healthy and whole berries then processed as it follows. A 21-berry sub-sample was collected from the three clusters and, after recording fresh weight of each individual berry, immediately frozen at -20 °C. Then, each berry was sliced in half with a razor blade, the seeds and flesh carefully removed from each berry half using a small metal spatula without rupturing any pigmented hypodermal cells and the seeds then carefully separated by hand from the flesh. Both skins and seeds were rinsed in de- ionized water, blotted dry and weighed. A second 50-berries sub-sample was processed for total anthocyanins and phenols concentration after Iland (1988). Total anthocyanins and phenolics were expressed as mg per g of fresh berry mass.
The remainder of each three-bunch sample was crushed and the concentration of total soluble solids (Brix) was determined by a temperature-compensating refractometer (RX-5000 ATAGO U.S.A., Bellevue, WA). Titratable acidity (TA) was measured by titration with 0.1 N NaOH to a pH 8.2 end-point and expressed as g/L of tartaric acid equivalents. Tartrate was assessed on must by the colorimetric method based on silver nitrate and ammonium vanadate reactions (Lipka and Tanner, 1974). Malate was determined with a kit (Megazyme Int., Bray, Ireland), which uses L-malic dehydrogenase to catalyze the reaction between malate and NAD+ to oxaloacetate and NADH. The reaction products were measured spectrophotometrically by the change in absorbance at 340 nm from the reduction of NAD+ to NADH.
Ripening curves of berry weight, must total soluble solids (°Brix), titratable acidity, pH, malic and tartaric acid concentration were also built each season by processing, according to the methods described above and at weekly intervals beginning from veraison, a 100-berry sample per each “vigor x strategy” combination.
DatatreatmentVine performance data were subjected to a three-way analysis of variance using the SigmaStat software package (Systat Software, Inc. San Jose, CA, USA). Year was considered as a random variable. When significant at ANOVA, treatment comparison was performed by Student-Neuman-Keuls test at P ≤ 0.05. Vigor x Strategy, Vigor x Year and Strategy x Year interactions was partitioned only in case of F test significance and mean values compared by standard error. Visual ratings of bunch compactness, rot incidence and severity were subjected to square root transformation prior to ANOVA.

Within-field variability and variable rate nitrogen fertilization in a Barbera vineyardMatteo Gatti and Stefano Poni
20
“La
vitic
ultu
ra d
e pr
ecis
ión
en la
mej
ora
de la
cal
idad
del
vino
”
JO
RN
ADA
INTE
RN
ACI
ON
AL
VIN
TAG
E
RESULTSShowing a Winkler index of 1895°C and seasonal rainfall of 256 mm, the 2012 season was the warmest and driest. In 2013, the growing degree days cumulated from April to October was slightly lower (1799°C) as compared to 2012, and total rainfall from April to September, the highest (340 mm). Despite this trend, in 2012 some rainstorms occurred late in the summer bringing 64 mm of rain from 30 August to 5 September whilst just moderate rainfall was recorded in 2013 prior harvest, 24 and 26 August (13 and 19 mm, respectively), 11 and 15 September (8 and 18 mm, respectively).
The nitrogen and calcium leaf content in LV blocks was the lowest (1.36% and 3.09%, respectively) whilst the phosphorous (0.13%) and sulphur (0.4%) content was lower than HV (Tab. 1). The potassium and magnesium content were unaffected by vigor even though the first one stood at optimal levels and the second one showed a general deficiency status especially in LV (0.16%). The fertilization strategy (S) did not affect leaf mineral nutrition as assessed at veraison. In detail, the nitrogen supply significantly reduced the leaf potassium concentration in both traditional (0.9%) and VRA (0.81%) protocols in comparison with control (1.04%). Iron and boron were unaffected by all sources of variation (Table 1).
Table 1 | Leaf blade mineral composition of Barbera vines determined at veraison as a function of vigor level (V) and nitrogen-supply strategy (S). (Data 2012-2013).
N (%) P (%) K (%) Mg (%) Ca (%) S (%) Fe (ppm) B (ppm)VigorHV 1.59 a 0.20 a 0.99 0.19 3.58 a 0.50 a 92 60MV 1.50 a 0.16 b 0.89 0.18 3.50 a 0.44 b 98 54LV 1.36 b 0.13 b 0.87 0.16 3.09 b 0.40 b 87 55StrategyControl 1.45 0.19 a 1.04 a 0.16 3.44 0.49 a 90 59Traditional 1.52 0.16 b 0.90 b 0.18 3.43 0.43b 94 52VRA 1.49 0.15 b 0.81 b 0.19 3.30 0.43 b 93 58ANOVAVigor (V) ** ** n.s. n.s. ** ** n.s. n.s.Strategy (S) n.s. * ** n.s. n.s. * n.s. n.s.Year (Y) ** ** ** n.s. n.s. ** n.s. n.s.S x Y n.s. n.s. n.s. n.s. n.s. n.s. n.s. n.s.V x Y n.s. * n.s. n.s. n.s. n.s. n.s. n.s.V x S n.s. n.s. n.s. n.s. n.s. n.s. n.s. n.s.
Within each column means are separated by Student Newman Keuls test (P<0.05). *,**, ns: Significant per p ≤ 0.05, 0.01, or not significant, respectively.
The pruning weight was different in all vigor classes ranging between 485 g/vine (LV) and 895 g/vine (HV) (Tab. 2). Accordingly, both components referred to main and lateral canes increased from LV (420 and 65 g/vine, respectively) to HV (706 and 189 g/vine). Total leaf area was higher in HV and MV (4.54 and 4.35 m2/vine) as compared to LV vines (3.45 m2/vine). Lateral leaf area was different among treatments and almost doubled from LV (0.61 m2/vine) to HV (1.32 m2/vine). The above mentioned variables were unaffected by the N- supply strategy as reported in table 2. Shoots per vine were similar among treatments (data not reported) and their fruitfulness, quantified at 1.8 inflorescences per shoot, was steady over years, vigor and N-supply strategy (Tab. 3).
Yield per vine increased according to vigor showing the lowest level in LV (3.2 kg) and the highest in HV (5.9 kg). Such figures corresponded to an estimated yield per hectare ranging from 13.3 to 24.6 t/ha, respectively. Although HV and MV showed similar yield per vine, cluster and berry weights were positively correlated to vigor showing significant differences among treatments. LV vines had the smallest berries (2.3 g) and clusters (181 g), HV the biggest (3 g and 291 g, respectively), whilst MV gave an intermediate response (Tab. 3). Accordingly, the highest the vigor the highest the cluster compactness that ranged from 17.5 (LV) to 23.5 g/cm (HV).

Within-field variability and variable rate nitrogen fertilization in a Barbera vineyardMatteo Gatti and Stefano Poni
21
“La
vitic
ultu
ra d
e pr
ecis
ión
en la
mej
ora
de la
cal
idad
del
vino
”
JO
RN
ADA
INTE
RN
ACI
ON
AL
VIN
TAG
E
Table 2 | Vegetative growth of Barbera vines as a function of vigor level (V) and nitrogen-supply strategy (S). (Data 2012-2013).
Main canes pruning wt. Lateral pruning wt. Total pruning wt. Main LA Lateral LA Total LA LA/Yield Ravaz index
(g/vine) (g/vine) (g/vine) (m2) (m2) (m2) (m2/kg) (kg/kg) Vigor HV 706 a 189 a 895 a 3.214 a 1.321 a 4.535 a 0.99 7.9 MV 607 b 147 b 754 b 3.247 a 1.098 b 4.345 a 1.03 7.5 LV 420 c 65 c 485 c 2.846 b 0.605 c 3.451 b 1.29 7.2 Strategy Control 573 131 704 3.208 0.930 4.138 1.20 7.0 b
Traditional 569 124 693 3.014 1.003 4.017 1.20 7.0 b
VRA 590 146 736 3.086 1.089 4.175 0.92 8.5 a
ANOVAVigor (V) ** ** ** ** ** ** * n.s.Strategy (S) n.s. n.s. n.s. n.s. n.s. n.s. n.s. *Year (Y) ** ** * n.s. ** n.s. ** **S x Y n.s. n.s. n.s. n.s. n.s. n.s. n.s. *V x Y n.s. n.s. n.s. n.s. n.s. n.s. n.s. n.s.V x S n.s. n.s. n.s. n.s. n.s.
Within each column means are separated by Student Newman Keuls test (P<0.05). *,**, ns: Significant per p ≤0.05, 0.01, or not significant, respectively.
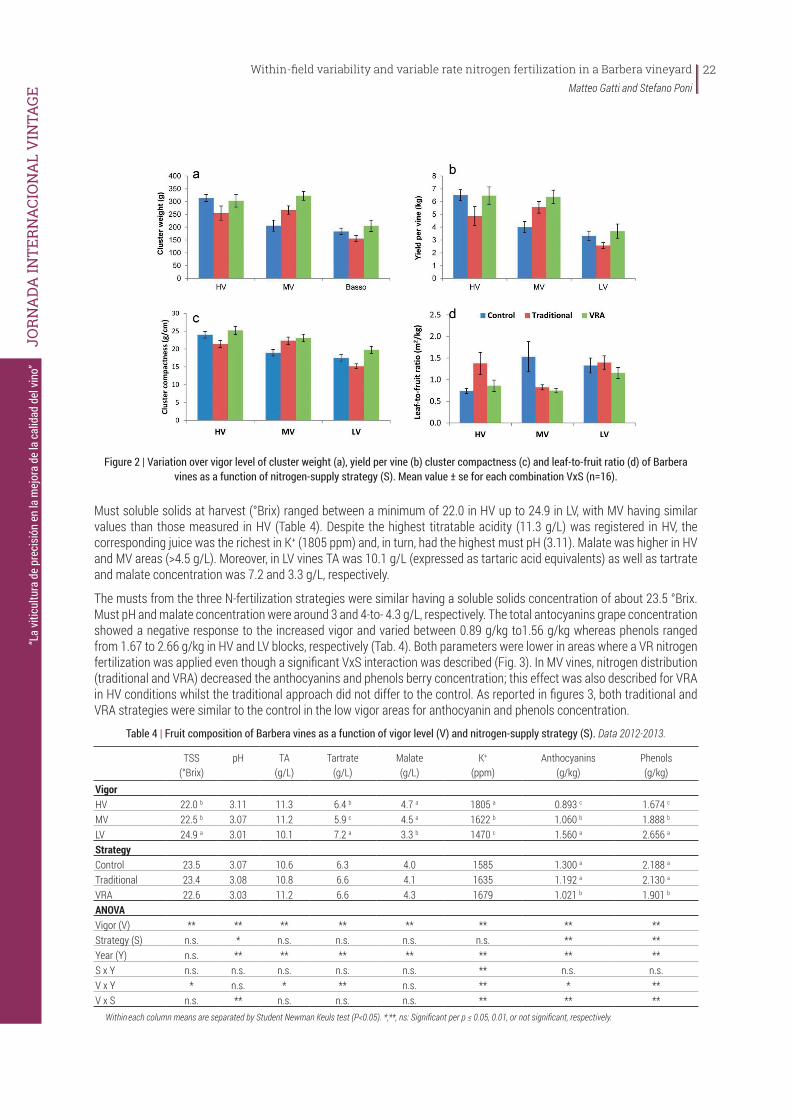
The N-supply strategy did not affect bunch count per vine whilst VRA showed the highest yield per vine (5.5 kg/vine) and cluster compactness (22.7 g/cm) due to increased cluster (277 g) and berry (2.8) weight as compared to other treatments. The VxS interaction was significant for yield per vine, cluster weight and compactness (Fig. 2). Although in MV cluster weight increased in response to N-supply, in HV and LV blocks it was smaller than control. Nitrogen fostered yield and bunch compactness in MV vines (traditional and VRA approach), the latter decreased in HV as a response to traditional strategy. Surprisingly, the same response was observed in LV blocks where vines were subjected to a rising dose. The leaf-to-fruit ratio was 1.5 m2/kg in control MV vines and decreased according to the N-supply in traditional and VRA strategies. The same index increased according to traditional N- fertilization of HV vines, whilst it was unaffected by the increasing N-dose in LV vines (Fig. 2d). The strategy (S) also affected the Ravaz index that was higher in VRA (8.5) as compared to control and traditionally fertilized vines (Tab. 3).
Table 3 | Yield components and cluster compactness of Barbera vines as a function of vigor level (V) and nitrogen-supply strategy (S). (Data 2012-2013).
Shoot fruitfulness Clusters/vine Cluster wt. (g)
Berry wt. (g)
Yield (kg/vine)
Cluster compactness (g/cm)
VigorHV 1.8 19.9 a 291 a 3.0 a 5.9 a 23.5 a
MV 1.8 19.8 a 265 b 2.6 b 5.3 a 21.5 b
LV 1.7 17.0 b 181 c 2.3 c 3.2 b 17.5 c
StrategyControl 1.8 19.1 234 b 2.5 b 4.6 b 20.1 b
Traditional 1.8 18.4 226 b 2.5 b 4.3 b 19.6 b
VRA 1.8 19.3 277 a 2.8 a 5.5 a 22.7 a
ANOVAVigor (V) n.s. ** ** ** ** **Strategy (S) n.s. n.s. ** ** ** **Year (Y) n.s. ** ** ** ** **S x Y n.s. n.s. n.s. n.s. n.s. **V x Y n.s. n.s. * n.s. ** n.s.V x S n.s. n.s. ** n.s. ** **
Within each column means are separated by Student Newman Keuls test (P<0.05). *,**, ns: Significant per p ≤ 0.05, 0.01, or not significant, respectively.
Within-field variability and variable rate nitrogen fertilization in a Barbera vineyardMatteo Gatti and Stefano Poni
22
“La
vitic
ultu
ra d
e pr
ecis
ión
en la
mej
ora
de la
cal
idad
del
vino
”
JO
RN
ADA
INTE
RN
ACI
ON
AL
VIN
TAG
E
Figure 2 | Variation over vigor level of cluster weight (a), yield per vine (b) cluster compactness (c) and leaf-to-fruit ratio (d) of Barbera vines as a function of nitrogen-supply strategy (S). Mean value ± se for each combination VxS (n=16).
Must soluble solids at harvest (°Brix) ranged between a minimum of 22.0 in HV up to 24.9 in LV, with MV having similar values than those measured in HV (Table 4). Despite the highest titratable acidity (11.3 g/L) was registered in HV, the corresponding juice was the richest in K+ (1805 ppm) and, in turn, had the highest must pH (3.11). Malate was higher in HV and MV areas (>4.5 g/L). Moreover, in LV vines TA was 10.1 g/L (expressed as tartaric acid equivalents) as well as tartrate and malate concentration was 7.2 and 3.3 g/L, respectively.
The musts from the three N-fertilization strategies were similar having a soluble solids concentration of about 23.5 °Brix. Must pH and malate concentration were around 3 and 4-to- 4.3 g/L, respectively. The total antocyanins grape concentration showed a negative response to the increased vigor and varied between 0.89 g/kg to1.56 g/kg whereas phenols ranged from 1.67 to 2.66 g/kg in HV and LV blocks, respectively (Tab. 4). Both parameters were lower in areas where a VR nitrogen fertilization was applied even though a significant VxS interaction was described (Fig. 3). In MV vines, nitrogen distribution (traditional and VRA) decreased the anthocyanins and phenols berry concentration; this effect was also described for VRA in HV conditions whilst the traditional approach did not differ to the control. As reported in figures 3, both traditional and VRA strategies were similar to the control in the low vigor areas for anthocyanin and phenols concentration.
Table 4 | Fruit composition of Barbera vines as a function of vigor level (V) and nitrogen-supply strategy (S). Data 2012-2013.
TSS (°Brix)
pH TA (g/L)
Tartrate (g/L)
Malate (g/L)
K+ (ppm)
Anthocyanins (g/kg)
Phenols (g/kg)
VigorHV 22.0 b 3.11 11.3 6.4 b 4.7 a 1805 a 0.893 c 1.674 c
MV 22.5 b 3.07 11.2 5.9 c 4.5 a 1622 b 1.060 b 1.888 b
LV 24.9 a 3.01 10.1 7.2 a 3.3 b 1470 c 1.560 a 2.656 a
StrategyControl 23.5 3.07 10.6 6.3 4.0 1585 1.300 a 2.188 a
Traditional 23.4 3.08 10.8 6.6 4.1 1635 1.192 a 2.130 a
VRA 22.6 3.03 11.2 6.6 4.3 1679 1.021 b 1.901 b
ANOVAVigor (V) ** ** ** ** ** ** ** **Strategy (S) n.s. * n.s. n.s. n.s. n.s. ** **Year (Y) n.s. ** ** ** ** ** ** **S x Y n.s. n.s. n.s. n.s. n.s. ** n.s. n.s.V x Y * n.s. * ** n.s. ** * **V x S n.s. ** n.s. n.s. n.s. ** ** ** Within each column means are separated by Student Newman Keuls test (P<0.05). *,**, ns: Significant per p ≤ 0.05, 0.01, or not significant, respectively.

Within-field variability and variable rate nitrogen fertilization in a Barbera vineyardMatteo Gatti and Stefano Poni
23
“La
vitic
ultu
ra d
e pr
ecis
ión
en la
mej
ora
de la
cal
idad
del
vino
”
JO
RN
ADA
INTE
RN
ACI
ON
AL
VIN
TAG
E
Figure 3 | Variation over vigor level of total anthocyanins (a) and phenols (b) of Barbera vines as a function of nitrogen-supply strategy (S). Mean value ± se for each combination VxS (n=16).
Figure 4 | Ripening curves referred to berry weight (a), soluble solids (b), total anthocyanins (c) and malate degradation (d) of Barbera vines as a function vigor (V). Mean value ± se. (data 2013, n=4).
Ripening curves referred to the 2013 season are reported in figure 4. From pre-veraison to harvest the berry weight in HV was significantly higher that LV as previously described in 2012 (data not reported). Sugar accumulation patterns were similar in HV and MV vines and different to LV conditions; the latter was always the highest in sugar fostering a final concentration of 24.7 °Brix (slightly higher than 22 °Brix in HV and MV). The anthocyanins accumulation varied within vigor classes according to soluble solids even though differences between LV and HV were grater in proximity of harvest. In both seasons, HV had a significantly higher malate concentration than LV at the onset of veraison that was kept over time until harvest. According to the final fruit composition described for main factors at harvest, the N-supply strategy showed similar patterns between treatments as concerning all variables describing the technological maturity. According to data reported in table 4, the final anthocyanin concentration in VRA was lower than control but differences were built over time just late in the season.
Vigor affected the berry morphology as expressed as single components of berry growth (skin, flesh and seeds). The relative skin weight increased according to a decreasing in vine vigor and values ranged between 7.5% in HV and 11.4%

Within-field variability and variable rate nitrogen fertilization in a Barbera vineyardMatteo Gatti and Stefano Poni
24
“La
vitic
ultu
ra d
e pr
ecis
ión
en la
mej
ora
de la
cal
idad
del
vino
”
JO
RN
ADA
INTE
RN
ACI
ON
AL
VIN
TAG
E
in LV (Tab. 5). Consequently, the relative flesh weight varied the opposite way scoring the highest value in HV (88.7%). Any fertilization strategy did not result in any significant variation in the growth of berry organs and the relative skin weight was settled at 9.6%.
At harvest, the bunch rot infections varied as a function of both factors (Tab. 5). The rot incidence increased according to the vigor producing significant differences among all classes. The percentage of infected clusters was the lowest in LV blocks (11.6%) rising up to 56.9% in HV. Consequently, the highest the vigor, the highest the bunch rot severity (0.9 and 9.3% in LV and HV, respectively). The N-supply strategy affected both infection incidence and severity scores that increased in VRT and traditional protocols as compared to the unfertilized control vines.
Table 5 | Relative growth of berry components and cluster rot incidence and severity of Barbera vines as a function of vigor level (V) and nitrogen-supply strategy (S). (Data 2012-2013).
Relative skin wt. (%) Relative flesh wt. (%) Relative seed wt. (%) Incidence (%) Severity (%)VigorHV 7.50 c 88.72 a 3.78 56.9 a 9.3 a
MV 10.11 b 86.29 b 3.61 43.9 b 6.6 b
LV 11.41 a 85.10 c 3.49 11.6 c 0.9 c
StrategyControl 9.61 86.91 3.48 29.9 b 2.9 b
Traditional 9.93 86.34 3.72 37.6 a 6.4 a
VRA 9.48 86.84 3.68 45.0 a 7.6 a
ANOVAVigor (V) ** ** n.s. ** **Strategy (S) n.s. n.s. n.s. ** **Year (Y) ** ** * n.s. *S x Y n.s. n.s. n.s. * n.s.V x Y ** ** n.s. ** n.s.V x S * n.s. n.s. n.s n.s. Within each column means are separated by Student Newman Keuls test (P<0.05). *,**, ns: Significant per p ≤ 0.05, 0.01, or not significant, respectively.
Table 6 shows significant linear correlations between the central NDVI value referred to vigor levels and the corresponding 2-years values for agronomical parameters including single cane weight, lateral leaf area, and winter pruning weight which were strongly and positively correlated with NDVI as described by a R2 ranging between 0.95 and 1.
Additionally, NDVI was positively correlated with berry and cluster weight, yield per vine and cluster compactness (R2>0,91).
Table 6 | Slope, Y interception, Pearson coefficient (r) and coefficient of determination (R2) referred to the linear regressions between NDVI index and agronomical variables assessed in the 2012-2013 period (n=3).
Variable Slope Interception R R2 SignificanceMain pruning wt. (g/vine) 3012.06 -542.8966 0.9844 0.9690 *Lateral pruning wt. (g/vine) 1303.94 -351.2698 0.9834 0.9672 *Pruning wt. (g/vine) 4316.00 -894.1664 0.9841 0.9685 *Cane wt. (g) 298.668 -519.389 1.0000 1.0000 **Lateral leaf area (m2) 7.5364 -1.7961 0.9771 0.9547 *Yield (kg/vine) 28.9736 -5.9631 0.9551 0.9123 *Cluster wt. (g) 1149.86 -181.8584 0.9562 0.9143 *Berry wt. (g) 7.7797 -0.2678 0.9905 0.9810 **Cluster compactness (g/cm) 63.7206 -2.8746 0.9840 0.9683 *Must pH 1.1359 2.6383 0.9971 0.9943 **Must K+ (ppm) 3520.37 323.1399 0.9985 0.9970 **Total anthocyanins (mg/kg) -7.0176 3.7813 -0.9609 0.9233 *Phenols (mg/kg) -10.342 5.9203 -0.9509 0.9042 *Relative skin wt. (%) -41.159 24.9869 -0.9820 0.9643 *Relative seed wt. (%) 3.0263 2.5003 0.9969 0.9939 **Relative flesh wt. (%) 38.1327 72.5128 0.9803 0.9610 *Cluster rot incidence (%) 476.924 -139.9286 0.9714 0.9435 *Cluster rot severity (%) 88.5839 -27.3286 0.9807 0.9617 *

Within-field variability and variable rate nitrogen fertilization in a Barbera vineyardMatteo Gatti and Stefano Poni
25
“La
vitic
ultu
ra d
e pr
ecis
ión
en la
mej
ora
de la
cal
idad
del
vino
”
JO
RN
ADA
INTE
RN
ACI
ON
AL
VIN
TAG
E
DISCUSSIONThe results presented in this work underscores the importance of providing a detailed ground- truthing of remotely sensed NDVI-based vigor maps which, in the present case, referred to a small Barbera vineyard of about 6400 m2 area. Although a relative low image resolution was allowed (5 m pixel), many agronomical variables were strongly correlated with NDVI (Tab. 6) suggesting that “mixels” (i.e. mixed pixels including vine and non-vine signals) can be an optimal resolution for describing the within-field variability as previously discussed by Lamb et al. (2004).
Before shoot trimming, at least two different canopy development models occurred within the vineyard. A strong lateral growth was observed from basal and medial nodes in HV and MV vines as shown in figure 5 and, as a matter of fact, lateral leaf area and pruning weight increased 2 and 3 fold, respectively, going from LV to HV (Tab. 2). Accordingly, LV canopies showed the lowest vine capacity as well as they were more open as compared to HV. Data reported in table 2 suggest as the vigor classes method pursued by PV is effective within parcel and is difficult to be adopted in order to perform any comparison among vineyards.
Figure 5 | Before shoot trimming, two different canopy development models occurred within the vineyard as described in HV-MV (a) and in LV (b) conditions.
Although relating to two diverse varieties, comparing the low vigor Sangiovese vineyard (Fiorillo et al., 2012) and our experimental parcel, we can argue as in both LV blocks vine performance were different so, vigor in HV Sangiovese (Tuscany) was similar to the LV Barbera under Northern conditions. Consequently, in case of similar image resolution a comparison between two vineyard vigor maps might also consider the NDVI variation that in our research ranged between 0.301 and 0.443.
Although we expect a mid-term effect as a response to the fertilization, in this context the nitrogen supply did not affect the vegetative growth of vines treated with both traditional and VRT-assisted strategies as compared to the unfertilized control.
As previously analyzed, NDVI was positively correlated with different yield components (Tab. 6). The 66% increase of yield per vine in HV as compared to LV was associated to an increasing of berry and cluster weight according to previous researches (Bramley and Hamilton, 2004; Profitt and Pearse, 2004; Fiorillo et al., 2012). Working on a less than hectare parcel, it is reasonable to assume that climate influence is limited and the observed variability is primarily due to variation in soil fertility (Lamb et al., 2004) which, in turn, depends on water and mineral availability (Jackson and Lombard, 1993), soil depth, texture and organic matter content (Keller et al., 2005).
As expected, cluster compactness increased according to the vigor and, despite the rachis length also increased, the enlargement in berry size was more than proportional (Fig. 6). The highest relative skin weight described in LV conditions is probably related to the smallest berry size. Additionally, because in HV blocks the fruit zone was more shaded, the microclimatic conditions likely did not promote skin thickening (Steel, 2001). Conversely, the more open LV canopies and the higher radiation in the fruit zone, favored a gradual adaptation to the sunlight as a result of the increased skin thickness and phenolic accumulation (i.e. flavonols) (Jansen et al., 1996; 1998; Haselgrove et al., 2000; Gatti et al., 2012; 2015). Vigor affected cluster rot sensitivity according to previous findings (Keller et al., 2001; Elmer and Michailides 2007) and, under the experimental conditions the highest infection rates were associated to dense canopies, compact bunches, big size and thin skin berries (Tab. 3 and 5). So, the fruit zone microclimate as well as the berry and bunch morphology seems to be the

Within-field variability and variable rate nitrogen fertilization in a Barbera vineyardMatteo Gatti and Stefano Poni
26
“La
vitic
ultu
ra d
e pr
ecis
ión
en la
mej
ora
de la
cal
idad
del
vino
”
JO
RN
ADA
INTE
RN
ACI
ON
AL
VIN
TAG
E
key factors. It is well demonstrated that the cuticolar waxes and thickness (Marois et al., 1986; Fermaud et al., 2001) as well as the epidermal and hypodermal cell layers (Gabler et al., 2003) are related to an increased tolerance against botrytis. The high compactness of HV clusters increased contacts between berries that are associated to a cuticle thinning and decreasing in wax deposition (Marois et al., 1986; Rosenquist and Morrison, 1989). Additionally, as botrytis infections are promoted by cluster wetness (Broome et al., 1995), the lower cluster rot incidence and severity observed in small vines could also be associated to increased canopy ventilation (English et al., 1989). Finally, the more dense canopy may have partially filtered the UV radiation that is well known to be promoter of cuticolar wax thickness (Steel, 2001).
Figure 6 | Barbera’s cluster morphology and compactness was different in high (a), medium (b) and low (c) vigor conditions.
An interesting discussion about the effects induced by the nitrogen fertilization is offered by the interaction vigor x strategy (VxS) and the leaf-to-fruit ratio appears a good indicator of vine balance as a function of both factors. Because the leaf area was not affected by strategy (Tab. 2), the index variability observed in figure 2d was mainly associated to yield components. Consequently, in MV vines, the LA/Yield index decreased because the nitrogen supply fostered big clusters and increased crop load (Fig. 2a-b). The traditional strategy increased the leaf-to-fruit ratio in MV vines as a consequence of a reduced crop load; yield per vine and cluster weight were lower as compared to VRT and control vines and, even though we did not measure fruit-set, we can assume that nitrogen promoted vigor as well as coulure and berry drop (Bell et al., 1979; May, 2004; Bell and Hensheke, 2005). This hypothesis is also supported by the lower cluster compactness induced by the traditional fertilization (60 kg of N/ha) as compared to the VRT-assisted and the control (in both 0 kg of N/ha). Despite an increasing in N supply (0, 60 and 120 kg of N /ha in control, traditional and VRA, respectively), the most interesting scenario emerge in LV conditions where all N- fertilization strategies resulted in similar leaf area and vine balance. Agronomical and enological parameters generally showed ideal values under low vigor conditions suggesting that LV is the target and any corrective action need to be addressed to the HV and MV vines. Additionally, a ground nitrogen fertilization in low vigor areas is unnecessary, expensive and probably a not sustainable practice.
The delayed ripening has been described in MV and HV conditions as concerning sugar and anthocyanins accumulation (Fig. 4) can be related to differences in soil properties as mineral and water availability affecting canopy growth and yield (Jackson and Lombard., 1993; Weeler and Pickering, 2003). Accordingly, TSS in LV vines were ≈ 3°Brix higher than HV (Tab. 4) and searching for the reasons of such variability, several factors need to be taken into account. Although the leaf-to-fruit ratio was unaffected by vigor and leveled around the optimal threshold, it is possible to assume that canopy efficiency was different. According to (Smart 1973; 1985) the proportion of exterior LA to total LA ranged between 76 and 79% in HV and MV vines whilst was 100% in LV plants indicating an higher frequency of interior and shaded leaf layers in the large canopies. So, we can assume that the proportion of leaves with a negative assimilation rate increases according to the NDVI in more dense canopies resulting in a less efficient sugar accumulation in the fruit.
Although TA was significantly higher in HV and MV blocks, the must pH and K+ concentration were the lowest in LV vines. This observation is supported by a different organic acid profile mainly characterized by tartrate (pK1 = 2.98; pK2 = 4.34) and malate (pK1 = 3.40; pK2 = 5.22) in LV and HV juices, respectively. Factors affecting the within-field variability (soil water

Within-field variability and variable rate nitrogen fertilization in a Barbera vineyardMatteo Gatti and Stefano Poni
27
“La
vitic
ultu
ra d
e pr
ecis
ión
en la
mej
ora
de la
cal
idad
del
vino
”
JO
RN
ADA
INTE
RN
ACI
ON
AL
VIN
TAG
E
availability and the nitrogen concentration) seems to have a slight effect on the seasonal tartaric accumulation whilst are crucial in the control of malate metabolism (Stevens et al., 1995; Keller et al., 2005). So, because the decrease in tartrate levels from veraison to harvest is mainly regulated by dilution (Ruffner 1982a; Dai et al., 2011), we can assume that this phenomenon was more intense in HV in comparison with LV. Additionally, in the high density canopies from HV and MV, the interior leaves were probably less efficient and promoted a K+ migration to the vacuoles as described by Iland (2011) whilst the higher shading exerted by leaves may have mitigated the cluster temperature and consequently the rate of malate degradation (Ruffner 1982b; Jackson and Lombard, 1993; Dai et al., 2011). Variation in anthocyanin and phenols content are probably dependent on soil fertility and fruiting-zone microclimate (Jackson and Lombard, 1993; Delas and Pouget, 1984; Downey et al., 2006).
Despite a lower crop load measured in MV vines, the anthocyanins concentration was similar between all fertilization strategies adopted in the high vigor blocks suggesting as in these conditions the N-supply can foster vigor and canopy density respect to the secondary metabolism (Fig. 3a). Nitrogen produced a negative effect in MV as well that neutralized the effect related to vigor decreasing. Finally, any difference among treatments was not observed in low vigor vines for the same reasons already discussed about vine balance.
CONCLUSIONSThe study of the within-field variability of a Barbera vineyard was successfully supported by remote sensing. Three vigor classes were distinguished as a function of the natural and anthropic soil variability and specific vine performance were described based on growth, yield and fruit composition behaviors. The NDVI index was strongly and significantly correlated with cane weight, pruning weight, lateral leaf area and berry size.
Affecting canopy development, fruit zone microclimate as well as bunch and berry morphology varied within the vineyard according to vigor; cluster rot sensitivity varied among vigor classes resulting the highest in high vigor blocks.
Fruit ripening and berry composition at harvest were affected by vigor suggesting that the introduction of selective harvest in the Tidone Valley might reveal to be economically viable. Grapes from low vigor vines were riper, TA was more balanced and the anthocyanin and phenolic content were the highest. Additionally, vigor enhanced the vine productivity and was negatively correlated with TSS, anthocyanins and phenols whereas a positive correlation with malate and K+ was described.
The N-fertilization strategy did not affected canopy growth whilst a higher reaction to the N-supply was described for yield components and vine balance. In HV and MV blocks, the VRT-assisted fertilization induced a similar crop load than control and traditional strategies, respectively. Under low vigor conditions, the vine balance was optimal and the nitrogen supply did not affect the vine performance regardless of the adopted strategy.
Although the vineyard description as a function of the vine vigor seems to be consistent over years, further studies are required in order understand the mid-to-long term effects of nitrogen supply as a function of different fertilization strategies.
REFERENCESBavaresco L., Gatti M., Fregoni M. (2010). Nutritional deficiencies. In Methodologies and Results in Grapevine Research. Delrot S., Medrano H., Or
E., Bavaresco L., Grando S. (Eds.), Springer Science+Business Media. pp-165-191.Bell A.A., Ough C.S., Kliewer, W.M. (1979). Effects on must and wine composition, rates of fermentation, and wine quality of nitrogen fertilization
of Vitis vinifera var. Thompson Seedless grapevines. American Journal of Enology and Viticulture 30, 124-129.Bell S. J. Hensheke P.A. (2005). Implications of nitrogen nutrition for grapes, fermentation and wine. Australian Journal of Grape and Wine
Research II, 242-295.Bergqvist J., Dokoozlian N. Ebisuda N. (2001). Sunlight exposure and temperature effects on berry growth and composition of Cabernet
Sauvignon and Grenache in the San Joaquin Valley of California. American Journal of Enology and Viticulture 52, 1-7.Bramley R.G., Hamilton R.P. (2004). Understanding variability in winegrape production systems. 1. Within vineyard variation in quality over
several vintages. Australian Journal of Grape and Wine Research 10, 32-45.Bramley R.G.V. (2005). A protocol for the contruction of yields maps from data collected using commercially available grape yield monitors,
Supplement No. 1, February 2005, available at: http://www.cse.csiro.au/client_serv/resources/protocol_suppl1.pdf (accessed November 2009).

Within-field variability and variable rate nitrogen fertilization in a Barbera vineyardMatteo Gatti and Stefano Poni
28
“La
vitic
ultu
ra d
e pr
ecis
ión
en la
mej
ora
de la
cal
idad
del
vino
”
JO
RN
ADA
INTE
RN
ACI
ON
AL
VIN
TAG
E
Bramley R.G.V. (2010). Precision Viticulture: managing vineyard variability for improved quality outcomes. In Managing wine quality, Volume I – Viticulture and wine quality. A.G. Reynolds (Ed.). Woodhead Publishing Ltd., Cambridge, UK.
Bramley R.G.V., Trought M.C.T., Praat J.P. (2011) Vineyard variability in Marlborough, New Zealand: characterising variation in vineyard performance and options for the implementation of Precision Viticulture. Australian Journal of Grape and Wine Research 17, 72–78.
Broom J.C. et al., 1995. Development of an infection model for Botrytis Bunch Rot of grapes based on wetness duration and temperature. The American Phytopathological Society, 85(1), 97-102.
Dai Z.W. et al., 2011. Ecophysiological, genetical and molecular causes of variation in grape berry weight and composition. American Journal of Enology and Viticulture 62, 413-425. Delas J., Pouget, P. (1984). Effect of nutrient solution concentration on some physiological and technological characteristics of Vitis vinifera L. cv. “Cabernet-Sauvignon”. Mineral composition of vegetative organs, must and wine [grapevine, rootstock, excess of nitrogen, fertiliza. Agronomie, Volume 4.
Dobrowski, S. Z., Ustin, S. L., & Wolpert, J. A. (2003). Grapevine dormant pruning weight prediction using remotely sensed data. Australian Journal of Grape and Wine Research, 9(3), 177−182
Downey M.O., Dokoozlian N. K., Krstic, M.P. (2006). Cultural Practice and Environmental Impacts on the Flavonoid Composition of Grapes and Wine: A Review of Recent Research. American Journal of Enology and Viticulture 57 (3), 257-268.
Elmer P.A., Michailides T.J. (2007). Epidemiology of Botrytis cinerea in orchard and vine crops. In: Botrytis: Biology, Pathology and Control. Dordrecht: Kluwer Academic Publishers, pp. 195-222.
English J.T., Thomas C.S., Marois J.J., Gubler W.D. (1989). Microclimates of grapevine canopies associated with leaf removal and control of Botrytis bunch rot. Phytopatology 79, 395-401.
Fermaud M., Liminana J.M., Froidefond G., Pieri, P. (2001). Grape clusters microclimate and architecture affect severity of Botrytis rot of ripening berries. Bullettin of IOBC/WPRS, Volume 24, pp. 7-10.
Fiorillo E., Crisci A., De Filippis T., Di Gennaro S.F., Di Blasi S., Matese A., Primicerio J., Vaccari F.P., Genesio L. (2012). Airborne high-resolution images for grape classification: changes in correlation between technological and late maturity in a Sangiovese vineyard in Central Italy. Australian Journal of Grape and Wine Research, 18, 80-90.
Gabler F.M. et al., 2003. Correlations of Morphological, Anatomical, and Chemical Features of Grape Berries with Resistance to Botrytis cinerea. Phytopathology 93(10), 1263-1273.
Gatti M., Civardi S., Bernizzoni F., Poni S. (2012). Effects of cluster thinning and preflowering leaf removal on growth and grape composition in cv. Sangiovese. American Journal of Enology and Viticulture, 63(4), 325-331.
Gatti, M., Garavani, A; Cantatore, A; Parisi, M G; Bobeica, N; Merli, M C; Vercesi, A; Poni, S. (2015). Interactions of summer pruning techniques and vine performance in the white cultvar Ortrugo (Vitis vinifera L.). Australian Journal of Grape and Wine Research 21, 80-89.
Graham R.D. (1983). Effects of nutrient stress on susceptibility of plants to disease with particular reference to the trace elements. Adv. Bot. Res. 10, 221-276.
Hall et al., 2008Haselgrove L. et al., 2000. Canopy microclimate and berry composition: The effect of bunch exposure on the phenolic composition of Vitis vinifera
L. cv. Shiraz grape berries. Australian Journal of Grape and Wine Research 6, 141-149.Hilbert G. et al., 2003. Effects of nitrogen supply on must quality and anthocyanins accumulation in berries of cv. Merlot. Vitis 42, 69-76.Iland P.G. (1988). Leaf removal effects on fruit composition. In: Proc. 2nd Int. Cool Climate Vitic. Enol. Symp.. Aukland, New Zealand: s.n., pp.
137-138.Iland P., Dry P., Proffitt T., Tyerman S. (2011). The Grapevine: from the science to the practice of growing vines for wine. Adelaide: Patrick Iland
Wine Promotions.Jackson D.I., Lombard P.B. (1993). Environmental and management practices affecting grape composition and wine quality – A review. American
Journal of Enology and Viticulture 44, 409-430.Jansen M.A. et al., (1996). Ultraviolet-B effects on Spirodela oligorriza: induction of different protection mechanisms. Plant Sciences 115, 217-223.Jansen M.A., Gaba V., Greenberg B.M. (1998). Higher plants and UV-B radiation: balancing damage, repair and acclimation. Trends Plant Sci.
3(4), 131-135.Johnson L.F., Roczen D.E., Youkhana S.K., Nemani R.R. Bosch D.F. (2003). Mapping vineyard leaf area with multispectral satellite imagery.
Computers and Electronics in Agriculture, 38, 33 – 44.Keller M. (2005). Deficit Irrigation and Vine Mineral Nutrition. American Journal of Enology and Viticulture 56(3), 267-283.Keller M., Arnink K.J., Hrazdina G. (1998). Interaction of nitrogen availability during bloom and light intensity during veraison. I. Effects on
grapevine growth, fruit development and ripening. American Journal of Enology and Viticulture 49, 333-340.Keller M., Kummer M., Carmo Vasconcelos M. (2001). Reproductive growth of grapevines in response to nitrogen supply and rootstock. Australian
Journal of Grape and Wine Research 7, 12-18.
Within-field variability and variable rate nitrogen fertilization in a Barbera vineyardMatteo Gatti and Stefano Poni
29
“La
vitic
ultu
ra d
e pr
ecis
ión
en la
mej
ora
de la
cal
idad
del
vino
”
JO
RN
ADA
INTE
RN
ACI
ON
AL
VIN
TAG
E
Lamb D.W., Weedon M.M., Bramley R.G. (2004). Using remote sensing to predict grape phenolics and colour at harvest in a Cabernet Sauvignon vineyard. Timing observations against vine phenology and optimizing image resolution. Australian Journal of Grape and Wine Research 10, 46-54.
Liakos V., Tagarakis A., Vatsanidou A., Fountas S., Nanos G., Gemtos T. (2013). Application of variable rate fertilizer in a commercial apple orchard. Proceedings of the 9th European Conference on Precision Viticulture. Lleida. Stafforf J.V. (Ed.). Wagheningen Academic Publishers, The Nederlands. pp. 675-681.
Lipka Z., Tanner H. (1974). Une nouvelle méthode de dosage rapide de l’acide tartrique dans les moûts, les vins at autres boissons (selon Rebelein). Revue Suisse d’Agriculture, de Viticulture et d’Arboriculture 6:5–10.
Llorens J., Gil E., Llop J., Queraltó M. (2011). Georeferenced LiDAR 3D Vine Plantation Map Generation. Sensors 11, 6237-6256.Marois J.J. et al., (1986). The influence of berry contact within grape clusters on the development of Botrytis cinerea and epicuticular wax.
American Journal of Enology and Viticulture 37, 293-296.May P. (2004). Flowering and fruit set in the grapevines. SA: Lythrum Press.Poni S., Gatti M., Dosso P. (2013). Fisiologia e viticoltura di precisione basata su dati da Remote Sensity: quale grado di parentela?. Italus Hortus
20(1), 15-30.Proffitt T., Pearse B. (2004). Adding value to the wine business precisely: using precision viticulture technology in Margaret River. The Australian
& New Zealand Grapegrower & Winemaker, Issue Dec, 40-44.Profitt T., Malcolm A. (2005). Zonal vineyard management through airborne remote sensing. The Australian and New Zealand Grapegrower &
Winemaker, Issue 502, 22-27.Rosenquist J.K., Morrison J.C. (1989). Some factors affecting cuticle and wax accumulation on grape berries. American Journal of Enology and
Viticulture 40, 241-244.Rouse J., Center G.S.F. (1974). Monitoring the vernal advancement and retrogradation (greenwave effect) of natural vegetation. Texas A & M
University, USA, Remote Sensing Center.Ruffner H.P. (1982a). Metabolism of tartaric and malic acids in Vitis: a review Part B. Vitis, 21, 346-358.Ruffner H.P. (1982a). Metabolism of tartaric and malic acids in Vitis: a review Part A. Vitis, 21, 247-259.Smart R.E. (1973). Sunlight interception by vineyards. American Journal of Enology and Viticulture 24, 141-147.Smart R.E. (1985). Principles of Grapevine Canopy Microclimate Manipulation with Implications for Yield and Quality. A Review. American Journal
of Enology and Viticulture 36(3), 230-239.Steel C.C. (2001). Effects of altered UV light and climate change on the susceptibility of grapevines to fungal disease. The Australian Grapegrower
and Winemamaker, Volume June, 13-15.Tagarakis A., Liakos V., Chatzinikos T., Koundouras S., Fountas S., Gemtos T. (2013). Using laser scanner to map pruning wood in vineyards.
Proceedings of the 9th European Conference on Precision Viticulture. Lleida. Stafforf J.V. (Ed.). Wagheningen Academic Publishers, The Nederlands. pp. 633-639.
Trought M.C.T., Bramley R.G.V. (2011). Vineyard variability in Marlborough, New Zealand: Characterising spatial and temporal changes in fruit composition and juice quality in the vineyard. Australian Journal of Grape and Wine Research, 17, 72–81.
Wei J., Salyani M. (2004). Development of a laser scanner for measuring tree canopy characteristics: phase 1. Prototype development. Transaction of the ASAE 47 (6), 2101-2107.
Wheeler S.J., Pickering G.J. (2003). Optimizing grape quality through soil management practices. Food Agrc. Environ. 1, 190-197.
30
“La
vitic
ultu
ra d
e pr
ecis
ión
en la
mej
ora
de la
cal
idad
del
vino
”
JO
RN
ADA
INTE
RN
ACI
ON
AL
VIN
TAG
E
VINERoBoT:RoBoTICSfoRPRECISIoNVITICulTuRE
Francisco Rovira-Más
INTRODUCTIONThe advent of new technologies together with the growing demand for greater competitiveness and sustainability have led to an increasing interest in precision viticulture, which proposes a differentiated vineyard management based on the spatial variability of vegetative development and production to improve grape and wine quality. Sustainable viticulture requires objective and continuous key parameter monitoring for rational decision- making with advanced technologies and sensors in the fields that allow the observation of crops and the quantification of important vineyards factors such as grape yield, leaf development, disease incidence, and stress issues related to water, nutrition, etc. All this information can be globally referenced with GPS, enabling the assessment of spatial variability for key agronomical parameters in the vineyard. At present, there is no practical system that integrates multiple sensors capable of acquiring information on agronomical, physiological and fruit composition simultaneously and on-the-fly. Only some remote sensing solutions have included the simultaneous acquisition of spectral information in the visible and infrared ranges allowing for the assessment of grapevine vigour and water status. Aerial platforms or satellites have also been used to gather agronomical and physiological data on vast vineyard plots. However, the small spatial resolution of multispectral devices together with the discrete architecture of grapevine cultivation in rows rather than continuous crop, the limited weather flexibility, and the elevated cost of aerial monitoring are important drawbacks, which have practically led to discard these techniques for most small- and medium-size European vineyards. The use of drones for commercial applications presents serious limitations such as reduced payload, severe restrictions in autonomy, liability issued related to flight control and safety, as well as the lack of official regulations for these aerial vehicles.
All the previous issues associated to remote sensing and aerial monitoring, namely low resolution, low update rate, high cost, little controllability, and limited accessibility may be surmounted by the VineRobot, an autonomous vehicle big enough to carry the necessary payload but light enough to be safe even at the unlikelihood of severe failures in the navigation system. Crop maps constructed by the robot will be updatable in real-time with the data extracted instantaneously by the robot’s perception and localization engines. The perception system will be able to gather and transmit key parameters for a successful vineyard management to end-users, especially vine growth and grape properties. The careful selection of perception sensors to obtain as much optic information as possible from the canopy in combination with a GPS receiver, will create global crop-management maps fully compatible with maps generated over previous seasons. Therefore, a promising and solid alternative to remote sensing for vineyard monitoring is proximal sensing, through which all the inconveniences mentioned above are expected to be tackled by the VineRobot. In particular, it is being designed to integrate three crucial

VineRobot: robotics for precision viticulture Francisco Rovira-Más
31
“La
vitic
ultu
ra d
e pr
ecis
ión
en la
mej
ora
de la
cal
idad
del
vino
”
JO
RN
ADA
INTE
RN
ACI
ON
AL
VIN
TAG
E
sensing technologies—chlorophyll-based fluorescence, RGB machine vision, and IR thermography—to map important agronomical and physiological parameters non-invasively, on-the-fly, and in real time. Additionally, the robot
must be capable of covering large fields autonomously and safely. The end-user will eventually be provided with standardized multi-parameter crop maps, downloadable from the robot upon ending the scouting mission or alternatively transferrable wirelessly from the robot to smart phones or tablets. Overall, the VineRobot will add valuable insights to grape wine producers, improving the vineyard’s strategic decision-making and management actions according to the most advanced technological tools currently available worldwide. Figure 1 illustrates the conceptual design behind the VineRobot Project, and Figure 2 shows the prototype used in the field tests conducted in May 2015 in Les Vignerons de Buzet, France. The VineRobot is a European Project financed under Grant agreement 610953.
Figure 1 | Conceptual design representing the VineRobot Project participants.
Figure 2 | Current prototype during field testing (Les Vignerons de Buzet, France, May 2015).
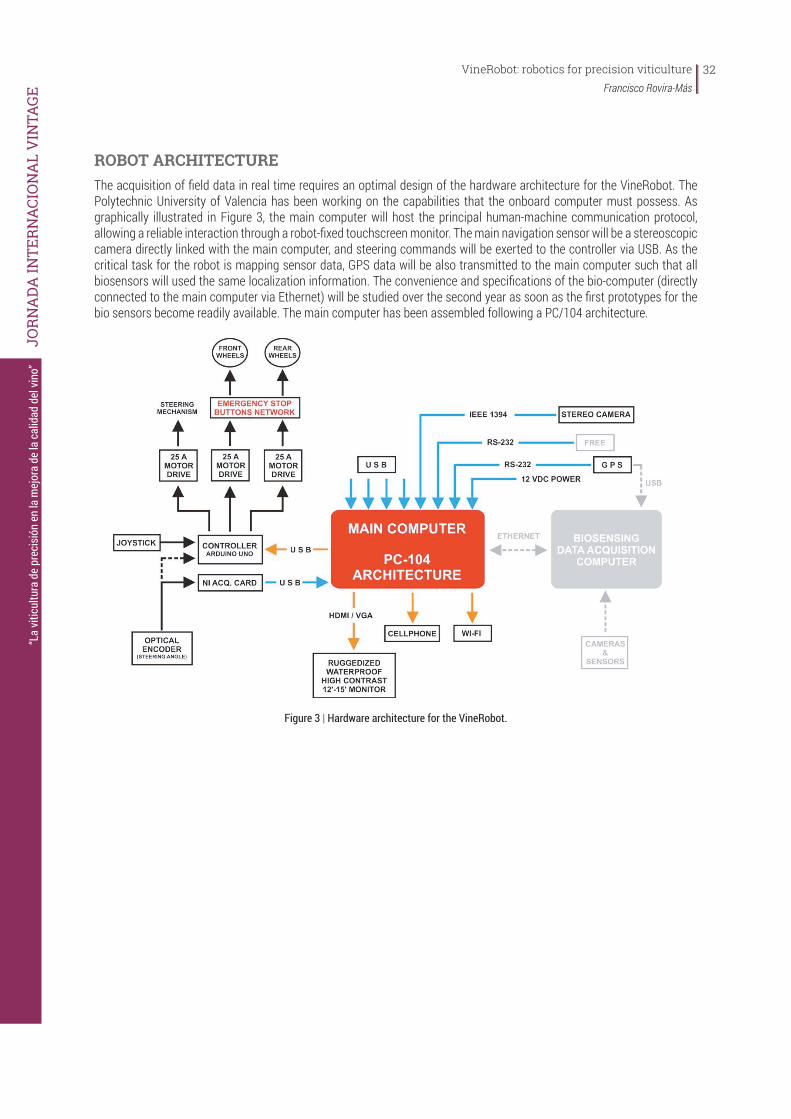
VineRobot: robotics for precision viticulture Francisco Rovira-Más
32
“La
vitic
ultu
ra d
e pr
ecis
ión
en la
mej
ora
de la
cal
idad
del
vino
”
JO
RN
ADA
INTE
RN
ACI
ON
AL
VIN
TAG
E
ROBOT ARCHITECTURE The acquisition of field data in real time requires an optimal design of the hardware architecture for the VineRobot. The Polytechnic University of Valencia has been working on the capabilities that the onboard computer must possess. As graphically illustrated in Figure 3, the main computer will host the principal human-machine communication protocol, allowing a reliable interaction through a robot-fixed touchscreen monitor. The main navigation sensor will be a stereoscopic camera directly linked with the main computer, and steering commands will be exerted to the controller via USB. As the critical task for the robot is mapping sensor data, GPS data will be also transmitted to the main computer such that all biosensors will used the same localization information. The convenience and specifications of the bio-computer (directly connected to the main computer via Ethernet) will be studied over the second year as soon as the first prototypes for the bio sensors become readily available. The main computer has been assembled following a PC/104 architecture.
Figure 3 | Hardware architecture for the VineRobot.

33
“La
vitic
ultu
ra d
e pr
ecis
ión
en la
mej
ora
de la
cal
idad
del
vino
”
JO
RN
ADA
INTE
RN
ACI
ON
AL
VIN
TAG
E
CARTOGRAfíA DEL VIGOR CON mEDIDA NDVI y APlICACIoNESPRáCTICASSoBREElVIñEDoBoRDEléS
Richard Vanrenterghem
RVS Consultants viticoles, Bordeux (Francia)
1. INTRODUCCIÓNNuestra empresa consultora RVS Consultants Viticoles aconseja varias viñedos en la región de Burdeos, desde la producción, con los aspectos agronómicos o fitosanitarios por ejemplo, hasta la estrategia global, técnica, económica y medio ambiantal.
Desde 2012, nuestro equipo de 4 asesores esta trabajando en las nuevas técnicas de imagen al viñedo, que sea satelital, aérea o con material embarcado. Es ahora un servicio que proponemos a nuestros clientes en complemento de un importante trabajo de campo.
Escogimos estudiar el material Green Seeker, utilizado hace años en los grandes cultivos. Hace una medida de reflectancia sobre las hojas, con las longitudes de onda infrarroja y próximo infrarrojo, dando un Índice de variabilidad (NDVI) que es localizado por GPS.
Esas informaciones (variabilidad dentro de la parcela o entre las parcelas) permiten cartografiar un viñedo, de manera muy precisa, en un estado fenológico, un año o un clima, determinados. La medida es rápida y no destructiva, y puede ser realizada al mismo tiempo que otro trabajo mecánico, por ejemplo, en el cuidado del suelo.
Las correlaciones con el vigor de la vid y la calidad de la uva, estan conocidas. Las aplicaciones prácticas son numerosas, alrededor de la cosecha, de la fertilización, del cuidado del suelo, del fitosanitario,…
Queremos ante todo quedar concretos, en nuestros consejos. Hemos trabajados mucho la facilidad de medida, con la instalación del equipo con todo tipo de tractor, y toda densidad de plantación.
Son pocos los viñedos bordeleses que tratan de usar esa técnica, y todavía más raros los con la configuración correcta de uso.
Desde 2012, hemos comparado el NDVI con datos que estamos acostumbrados a tener, como los análisis de peciolo, el Índice clorofílico (N-tester), la maduración de la uva. Sobre todo, hemos medido el material con nuestra percepción del vigor en el viñedo. No es la máquina la que nos dice como tenemos que percibir las cosas.

Cartografía del vigor con medida NDVI y aplicaciones prácticas sobre el viñedo Bordelés Richard Vanrenterghem
34
“La
vitic
ultu
ra d
e pr
ecis
ión
en la
mej
ora
de la
cal
idad
del
vino
”
JO
RN
ADA
INTE
RN
ACI
ON
AL
VIN
TAG
E
Así, las cartografías son adecuadas y justificadas. Por consiguiente, traen precisión en nuestro análisis, y pues, en nuestros asesoramientos.
Concretamente, entonces se puede ajustar y localizar las dosis de abonos o acondicionadores, particularmente en materia orgánica o nitrógeno, pero también en potasio o manganeso. Se pueden además actuar sobre el trabajo mecánico del suelo o sembrar gramíneas competidoras. La cosecha puede tener en cuenta diferentes partes de parcela, optimizando la producción de « Premier Vin ».
Al nivel fitosanitario, es siempre difícil ajustar las dosis porque las reglas de decisión no son bastante definidas y el peligro de perder la cosecha se queda muy elevado. Sin embargo, es posible aplicar algunos fitosanitarios de modo binario, a saber, limitando la aplicación a una zona bien identificada. Esto es realizable con el tratamiento contra Botrytis o los activadores del color (etephon).
Una cartografía NDVI es una información de más que tenemos que tratar y administrar con todas las otras, producidas al nivel de un viñedo.
Nuestros proyectos para 2015/2016 son consolidar nuestra utilización del Green Seeker, y estudiar la complementariedad de la medida con un dron, todavía privilegiando la acción de terreno.
2. LA EMPRESAUna red de competencias con 4 asesores independientes
Desde la producción …hasta la estrategia global
· Agronomía / pedologia prácticas
· Gestión fitosanitaria, hasta el residuo en los vinos
· Proxydetección y applicaciones concretas (Morgane Jourjon, Mémoire Fin Etudes ESA Angers 2012).
· Organización de los trabajos y parque de material
· Certificación, riesgo laboral
· Estrategia técnica, económica y medioambiental
· Cerca de 100 viñedos clientes
A. Appollot – M. Delemotte – Y. Reyrel – R. Vanrenterghem
3. PRINCIPIO DEL GREENSEEKERa) Medida de la reflectancia sobre la hojas - 2 longitudes de onda : infrarojo y PIR.
b) Medida geoespacial de un Índice de variabilidad : NDVI
c) Correlación con la vigor de la vid y la calidad de la uva.
Para una aplicación concreta
· Cartografia de la variabilidad dentro de la parcela y entre las parcelas
· Medida rápida, no destructiva, paso no específico, accesible (costo, facilitad)

Cartografía del vigor con medida NDVI y aplicaciones prácticas sobre el viñedo Bordelés Richard Vanrenterghem
35
“La
vitic
ultu
ra d
e pr
ecis
ión
en la
mej
ora
de la
cal
idad
del
vino
”
JO
RN
ADA
INTE
RN
ACI
ON
AL
VIN
TAG
E
Aplicaciones en: COSECHA, FERTILIZACIÓN, CUIDADO DEL SUELO, FITO…
3.1.EstudioTécnico2012El estudio se realizó en 7 parcelas y 3 viñedos de Burdeos:

Cartografía del vigor con medida NDVI y aplicaciones prácticas sobre el viñedo Bordelés Richard Vanrenterghem
36
“La
vitic
ultu
ra d
e pr
ecis
ión
en la
mej
ora
de la
cal
idad
del
vino
”
JO
RN
ADA
INTE
RN
ACI
ON
AL
VIN
TAG
E
3.2.VariabilidadintrayinterconmedidaNDVI
V- : vigor baja V+: vigor fuerte

Cartografía del vigor con medida NDVI y aplicaciones prácticas sobre el viñedo Bordelés Richard Vanrenterghem
37
“La
vitic
ultu
ra d
e pr
ecis
ión
en la
mej
ora
de la
cal
idad
del
vino
”
JO
RN
ADA
INTE
RN
ACI
ON
AL
VIN
TAG
E
3.3.objetivosgreenseeker
Objetivo : homogeneizar las variabilidades intra/inter para optimizar las prácticas en el viñedo
optimización económica,
médioambiental y agronómica
Cartografiar la variabilidad intra/inter las parcelas
Beneficio económico
Necesidad de la vid
Impacto medioambiental
Adaptación de la gestión técnica

Cartografía del vigor con medida NDVI y aplicaciones prácticas sobre el viñedo Bordelés Richard Vanrenterghem
38
“La
vitic
ultu
ra d
e pr
ecis
ión
en la
mej
ora
de la
cal
idad
del
vino
”
JO
RN
ADA
INTE
RN
ACI
ON
AL
VIN
TAG
E
4. FOTOGRAFÍA AÉREA A ESCALA DE UN VIÑEDO
Importancia de la confrontación del terreno
5. CONCLUSIONES
Nuestros proyectos para el bienio 2015-2016 se pueden resumir en:
a) Consolidar nuestras medidas Green Seeker
b) Complementariedad de la medida con un dron
c) Aconsejar el viticultor para equiparse
d) Comunicar y transmitir
e) Privilegiar la acción de terreno, práctica, para un resultado tangible

39
“La
vitic
ultu
ra d
e pr
ecis
ión
en la
mej
ora
de la
cal
idad
del
vino
”
JO
RN
ADA
INTE
RN
ACI
ON
AL
VIN
TAG
E
TECNOLOGíAs EmERGENTEs IN VITICuLTuRA DE pRECIsIóN pARA mEJORAR LA CALIDAD DE LA uVA y DEL VINO
Javier Tardáguila y María Paz Diago
Universidad de La Rioja
El grupo de investigación Televitis (televitis.unirioja.es) de la Universidad de La Rioja y del Instituto de Ciencias de la Vid y el Vino (ICVV) trabaja en la aplicación de tecnologías emergentes en viticultura. Participa en dos proyectos europeos en viticultura (INNOVINE y RESOLVE) y lidera el proyecto VINEROBOT. Este importante proyecto europeo coordinado por el profesor Javier Tardaguila tiene como objeto el desarrollo de un robot autónomo para la monitorización del viñedo, utilizando técnicas no invasivas. Además, el grupo Televitis participa en el proyecto “Vineyard of the future” con Universidades de Australia y de Chile, y ha obtenido cuatro patentes sobre la aplicación de la visión artificial en viticultura.
INTRODUCCIÓNUna viticultura moderna y sostenible requiere una monitorización objetiva y continua del viñedo, y eso sólo es posible aplicando nuevas tecnologías. Los recientes avances en las tecnologías de la información y las comunicaciones (TICs) y la electrónica han permitido el desarrollo de nuevos sensores para monitorizar el viñedo. Las posibilidades de estas nuevas tecnologías para monitorizar el viñedo y cuantificar parámetros como el rendimiento productivo, el desarrollo foliar, la incidencia de enfermedades y/o la detección de diferentes factores de estrés (hídrico, nutricional, etc.) son enormes.
Es importante destacar que el carácter no destructivo de buena parte de estas tecnologías implica la ausencia de daño o modificación del material vegetal analizado. Entre los principales sensores terrestres no destructivos de detección avanzada utilizados para la monitorización del cultivo y/o de la composición de los frutos se encuentran los siguientes: cámaras RGB, cámaras termográficas, cámaras multi e hiperespectrales, sensores basados en la fluorescencia de la clorofila y espectroscopía NIR (infrarrojo cercano). Toda esta información puede obtenerse de forma georreferenciada, con lo que podría utilizarse para determinar la variabilidad espacial del viñedo, en el marco de la viticultura de precisión.
En este trabajo se presentan algunos ejemplos de la estimación de parámetros vitícolas importantes mediante diferentes tecnologías no destructivas, en los que ha trabajado activamente el grupo Televitis de la Universidad de La Rioja

Tecnologías emergentes in viticultura de precisión para mejorar la calidad de la uva y del vino Javier Tardáguila y María Paz Diago
40
“La
vitic
ultu
ra d
e pr
ecis
ión
en la
mej
ora
de la
cal
idad
del
vino
”
JO
RN
ADA
INTE
RN
ACI
ON
AL
VIN
TAG
E
SUELO El suelo es un importante factor vitícola. En los últimos años se ha producido un notable avance en el desarrollo de tecnologías que permiten la monitorización del suelo vitícola de forma continua o en marcha (“on-the-go”), como alternativa a la realización de calicatas. Nuestro grupo de investigación Televitis ha sido pionero en España en la aplicación de sensores de resistividad eléctrica aparente del suelo, arrastrado por un quad (Figura 1). Este tipo de sensores permiten tomar gran cantidad datos (25.000 datos por hectárea), a tres profundidades, de forma rápida y georreferenciada. Por tanto, es posible generar mapas de suelo, zonificar el viñedo en función del suelo y su aplicación en viticultura de precisión.
Figura 1 | Monitorización en continuo de la resistividad eléctrica aparente del suelo, con el sensor ARP, utilizado en viñedos de La Rioja y Navarra por el grupo Televitis.
ESTADO VEGETATIVO DEL VIÑEDOHemos comenzado a desarrollar metodologías basadas en el análisis de imágenes RGB, con diversos algoritmos de clasificación de imágenes, para la detección y cuantificación de diferentes parámetros de interés a nivel de planta, tales como la superficie foliar expuesta, la porosidad de la espaldera, la exposición de los racimos y la proporción de hojas dañadas o senescentes (Figura 2).
Figura 2 | Identificación y cuantificación de parámetros vegetativos y productivos de la cepa mediante análisis de imagen RGB.
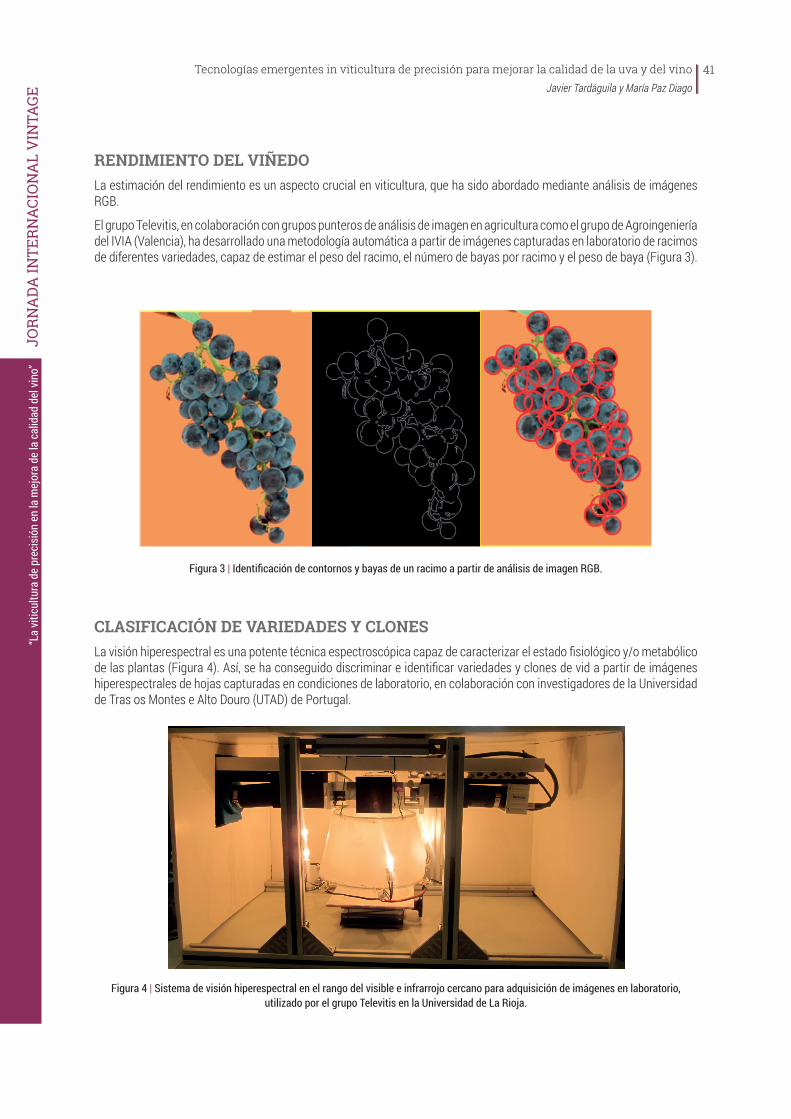
Tecnologías emergentes in viticultura de precisión para mejorar la calidad de la uva y del vino Javier Tardáguila y María Paz Diago
41
“La
vitic
ultu
ra d
e pr
ecis
ión
en la
mej
ora
de la
cal
idad
del
vino
”
JO
RN
ADA
INTE
RN
ACI
ON
AL
VIN
TAG
E
RENDIMIENTO DEL VIÑEDOLa estimación del rendimiento es un aspecto crucial en viticultura, que ha sido abordado mediante análisis de imágenes RGB.
El grupo Televitis, en colaboración con grupos punteros de análisis de imagen en agricultura como el grupo de Agroingeniería del IVIA (Valencia), ha desarrollado una metodología automática a partir de imágenes capturadas en laboratorio de racimos de diferentes variedades, capaz de estimar el peso del racimo, el número de bayas por racimo y el peso de baya (Figura 3).
Figura 3 | Identificación de contornos y bayas de un racimo a partir de análisis de imagen RGB.
CLASIFICACIÓN DE VARIEDADES Y CLONESLa visión hiperespectral es una potente técnica espectroscópica capaz de caracterizar el estado fisiológico y/o metabólico de las plantas (Figura 4). Así, se ha conseguido discriminar e identificar variedades y clones de vid a partir de imágenes hiperespectrales de hojas capturadas en condiciones de laboratorio, en colaboración con investigadores de la Universidad de Tras os Montes e Alto Douro (UTAD) de Portugal.
Figura 4 | Sistema de visión hiperespectral en el rango del visible e infrarrojo cercano para adquisición de imágenes en laboratorio, utilizado por el grupo Televitis en la Universidad de La Rioja.

Tecnologías emergentes in viticultura de precisión para mejorar la calidad de la uva y del vino Javier Tardáguila y María Paz Diago
42
“La
vitic
ultu
ra d
e pr
ecis
ión
en la
mej
ora
de la
cal
idad
del
vino
”
JO
RN
ADA
INTE
RN
ACI
ON
AL
VIN
TAG
E
ESTADO HÍDRICOEl conocimiento del estado hídrico del viñedo de cara a establecer estrategias racionales de riego es un aspecto de gran importancia en la viticultura moderna. La termografía ha sido propuesta en numerosos estudios como una metodología capaz de caracterizar el estado hídrico del viñedo así como de ayudar a la planificación del riego. Cuando los estomas están abiertos, la planta transpira y la temperatura de la hoja desciende, mientras que tras el cierre estomático la temperatura foliar aumenta. De este modo, la temperatura de la hoja puede considerarse un indicador de la conductancia estomática y por ende, del estado hídrico de la planta. La Figura 5 muestra sendas imágenes térmicas de dos cepas con diferente estado hídrico.
Figura 5 | Imágenes térmicas y RGB de cepas con estrés hídrico (arriba) y, sin estrés hídrico (abajo.
Los últimos trabajos de nuestro grupo de investigación han contribuido a clarificar algunos aspectos metodológicos, sugiriendo las horas centrales del día y el lado menos expuesto de la pared vegetativa de la cepa como las condiciones más adecuadas para determinar el estado hídrico mediante termografía.
GRADO ALCOHÓLICO PROBABLE EN EL CAMPOLa espectroscopía de infrarrojo cercano (NIR) es un método no destructivo que ha sido ampliamente utilizado para caracterizar la composición de numerosos productos. Recientemente, el grupo Televitis ha comenzado a utilizar sensores NIR portátiles que han posibilitado la determinación de parámetros de la composición de la uva, como la concentración de azúcares en la baya, en pleno campo, directamente en el viñedo (Figura 6). En la actualidad, estamos trabajando para poder determinar en el viñedo, sin necesidad de muestrear y analizar la uva en el laboratorio, otros parámetros como la acidez total, pH, etc.
Figura 6 | Utilización de un sensor NIR portátil para la determinación en el viñedo del contenido en azúcares en la baya.
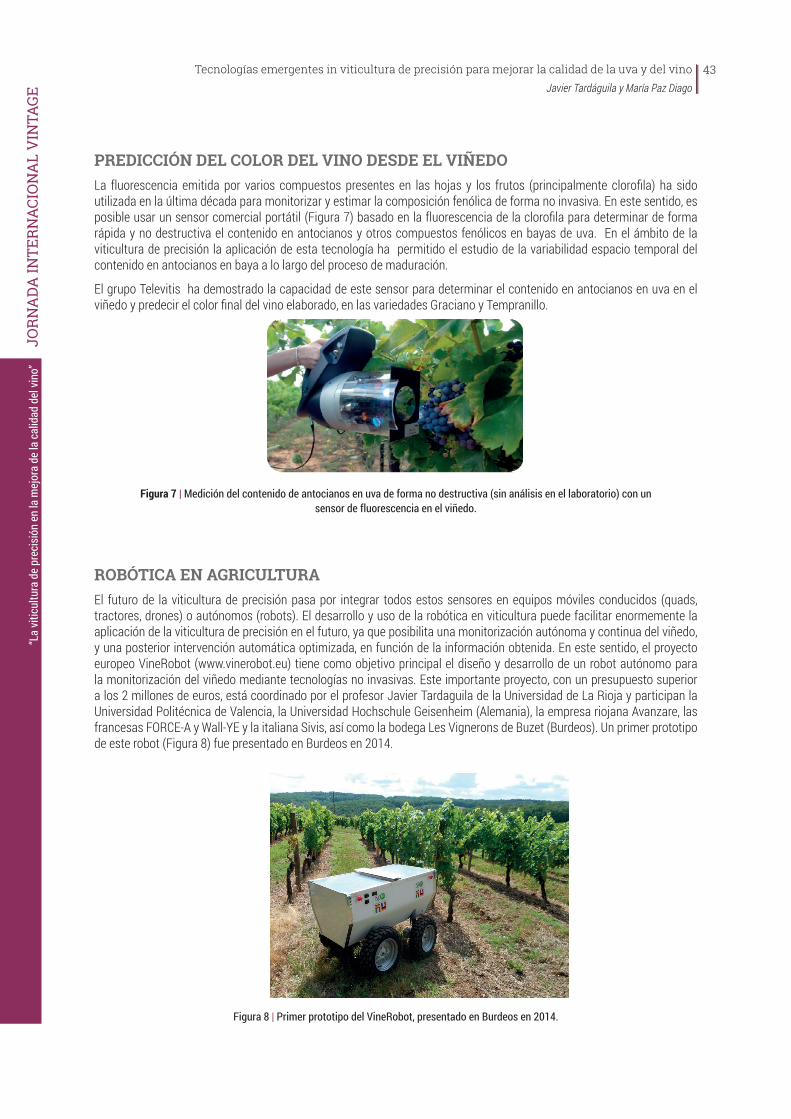
Tecnologías emergentes in viticultura de precisión para mejorar la calidad de la uva y del vino Javier Tardáguila y María Paz Diago
43
“La
vitic
ultu
ra d
e pr
ecis
ión
en la
mej
ora
de la
cal
idad
del
vino
”
JO
RN
ADA
INTE
RN
ACI
ON
AL
VIN
TAG
E
PREDICCIÓN DEL COLOR DEL VINO DESDE EL VIÑEDOLa fluorescencia emitida por varios compuestos presentes en las hojas y los frutos (principalmente clorofila) ha sido utilizada en la última década para monitorizar y estimar la composición fenólica de forma no invasiva. En este sentido, es posible usar un sensor comercial portátil (Figura 7) basado en la fluorescencia de la clorofila para determinar de forma rápida y no destructiva el contenido en antocianos y otros compuestos fenólicos en bayas de uva. En el ámbito de la viticultura de precisión la aplicación de esta tecnología ha permitido el estudio de la variabilidad espacio temporal del contenido en antocianos en baya a lo largo del proceso de maduración.
El grupo Televitis ha demostrado la capacidad de este sensor para determinar el contenido en antocianos en uva en el viñedo y predecir el color final del vino elaborado, en las variedades Graciano y Tempranillo.
Figura 7 | Medición del contenido de antocianos en uva de forma no destructiva (sin análisis en el laboratorio) con un sensor de fluorescencia en el viñedo.
ROBÓTICA EN AGRICULTURAEl futuro de la viticultura de precisión pasa por integrar todos estos sensores en equipos móviles conducidos (quads, tractores, drones) o autónomos (robots). El desarrollo y uso de la robótica en viticultura puede facilitar enormemente la aplicación de la viticultura de precisión en el futuro, ya que posibilita una monitorización autónoma y continua del viñedo, y una posterior intervención automática optimizada, en función de la información obtenida. En este sentido, el proyecto europeo VineRobot (www.vinerobot.eu) tiene como objetivo principal el diseño y desarrollo de un robot autónomo para la monitorización del viñedo mediante tecnologías no invasivas. Este importante proyecto, con un presupuesto superior a los 2 millones de euros, está coordinado por el profesor Javier Tardaguila de la Universidad de La Rioja y participan la Universidad Politécnica de Valencia, la Universidad Hochschule Geisenheim (Alemania), la empresa riojana Avanzare, las francesas FORCE-A y Wall-YE y la italiana Sivis, así como la bodega Les Vignerons de Buzet (Burdeos). Un primer prototipo de este robot (Figura 8) fue presentado en Burdeos en 2014.
Figura 8 | Primer prototipo del VineRobot, presentado en Burdeos en 2014.
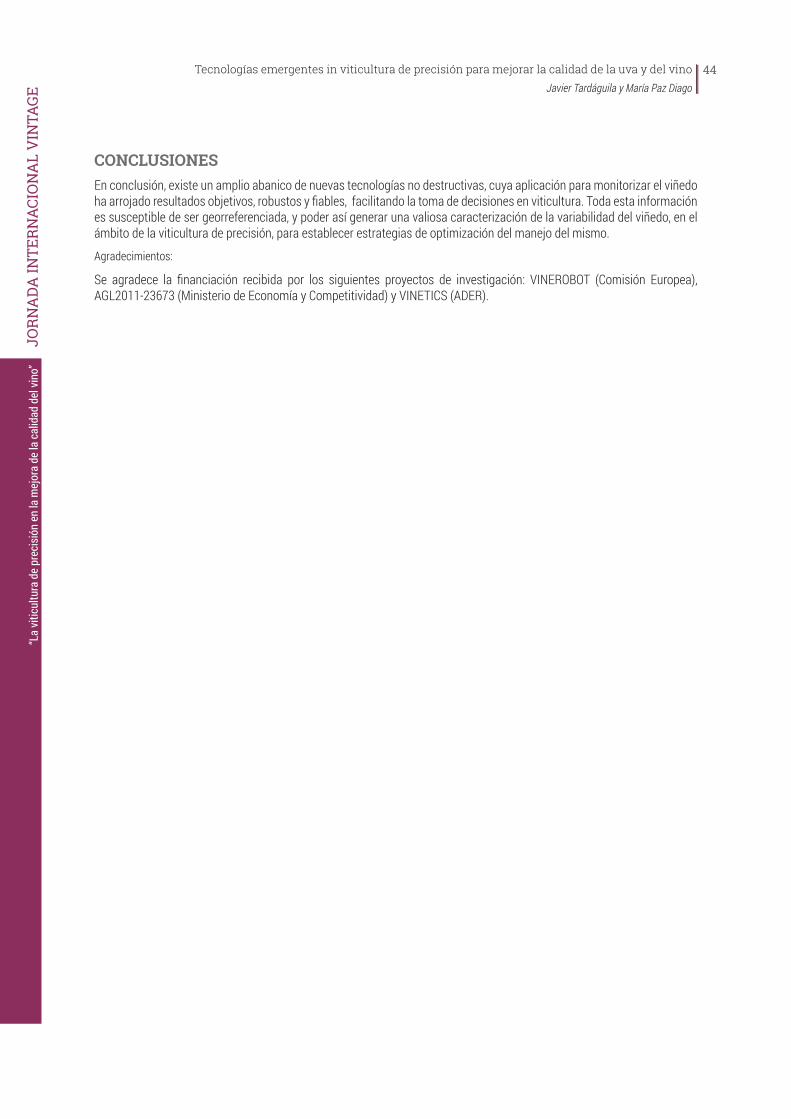
Tecnologías emergentes in viticultura de precisión para mejorar la calidad de la uva y del vino Javier Tardáguila y María Paz Diago
44
“La
vitic
ultu
ra d
e pr
ecis
ión
en la
mej
ora
de la
cal
idad
del
vino
”
JO
RN
ADA
INTE
RN
ACI
ON
AL
VIN
TAG
E
CONCLUSIONESEn conclusión, existe un amplio abanico de nuevas tecnologías no destructivas, cuya aplicación para monitorizar el viñedo ha arrojado resultados objetivos, robustos y fiables, facilitando la toma de decisiones en viticultura. Toda esta información es susceptible de ser georreferenciada, y poder así generar una valiosa caracterización de la variabilidad del viñedo, en el ámbito de la viticultura de precisión, para establecer estrategias de optimización del manejo del mismo.
Agradecimientos:
Se agradece la financiación recibida por los siguientes proyectos de investigación: VINEROBOT (Comisión Europea), AGL2011-23673 (Ministerio de Economía y Competitividad) y VINETICS (ADER).