la dynamique moléculaire dans les globules rouges
TRANSCRIPT
HAL Id: tel-00442206https://tel.archives-ouvertes.fr/tel-00442206
Submitted on 18 Dec 2009
HAL is a multi-disciplinary open accessarchive for the deposit and dissemination of sci-entific research documents, whether they are pub-lished or not. The documents may come fromteaching and research institutions in France orabroad, or from public or private research centers.
L’archive ouverte pluridisciplinaire HAL, estdestinée au dépôt et à la diffusion de documentsscientifiques de niveau recherche, publiés ou non,émanant des établissements d’enseignement et derecherche français ou étrangers, des laboratoirespublics ou privés.
La Dynamique Moléculaire dans les Globules RougesAndreas Stadler
To cite this version:Andreas Stadler. La Dynamique Moléculaire dans les Globules Rouges. Biophysique [physics.bio-ph].Université Joseph-Fourier - Grenoble I, 2009. Français. tel-00442206

Université Joseph Fourier – Grenoble 1 Ecole Doctorale de Physique
THESE
Andreas STADLER
Pour obtenir le titre de Docteur en Sciences
de l’Université Joseph Fourier – Grenoble 1
Spécialité : Biophysique
Molecular Dynamics in Red Blood Cells
La Dynamique Moléculaire dans les Globules Rouges
Composition du jury:
Prof. Dr. Alessandro Paciaroni Rapporteur PD. Dr. Wolfgang Doster Rapporteur Prof. Dr. Judith Peters Président Prof. Dr. Gerhard Artmann Examinateur Dr. Moeava Tehei Examinateur Dr. Frank Gabel Examinateur Prof. Dr. Georg Büldt Directeur de thèse Dr. Giuseppe Zaccai Directeur de thèse Prof. Dr. Fritz Parak Invité
Thèse préparée à l’Institut Laue-Langevin, Grenoble, et au Forschungszentrum Jülich


Dedicated to Estela Suarez Garcia, Helga and Max Stadler


Acknowledgements
The thesis would not have been possible without the help of a number of people.
First of all, I would like to thank my supervisors Dr. Giuseppe Zaccai and Prof. Dr. Georg
Büldt for their friendly guidance, continuous support and their openness for discussion
throughout my thesis. I always had the opportunity to explore my own ideas some of which
gave very interesting results.
I want to thank the members of the jury: Alessandro Paciaroni and Wolfgang Doster for
kindly having accepted to be referee, Judith Peters for being president, Moeava Tehei, Frank
Gabel, Gerhard Artmann, Fritz Parak for being part of the jury and Georg Büldt and Giuseppe
Zaccai for being directors of my thesis.
Special thanks go to Moeava Tehei, Elisa Fabiani, Marion Jasnin, Frank Gabel and Martin
Weik for inspiring discussions, the good atmosphere in the group and the nice moments spent
together at workshops and conferences. In particular, I want to thank Moeava who helped me
a lot during my first neutron scattering experiments and who was always open for discussion.
I also want to thank Gerhard Artmann, Ilya Digel, Kay Zerlin, Peter Kayser and Dariusz Porst
for their help with sample preparation and organisation. I always spent a nice time in the lab
in Jülich and the pool party is simply unforgettable. I also want to thank Birgit Gehrmann for
all the help and support in many administrative issues.
I want to thank Jan Peter Embs, Fanni Juranyi, Tobias Unruh, Franz Demmel, Judith Peters
and Francesca Natali who helped me as local contacts during the neutron experiments.
I want to thank Katy Wood, Alexander Grünwald, Beate Brüning, Tinka Spehr, Lola Ruiz
Martin, Navid Qureshi, Audrey Schollier, Estelle Mossou, Clara Gonzalez Jimenez, Marc
Laver and Amy Dee for all the nice moments spent together at ILL and in Grenoble.

Ich möchte mich besonders bei meiner Familie bedanken. Meinen Eltern Helga und Max für
ihre Unterstützung und große Hilfe in allen Dingen, bei Gabi und Rainald und bei Korbinian
und Carolina für die gemeinsam verbrachte Zeit.
Besonderer Dank gilt meiner Freundin Estela für ihre Gedult, ihre Unterstützung und ihre
Liebe während all dieser Zeit.

i
Table of Contents
1. Introduction Générale/ General Introduction…………………....…………....………....1
2. Hemoglobin and Red Blood Cells………………………………………………....………9
2.1 Biological Background……………………………………………………....……..9
2.2 Body Temperature Transition of Hemoglobin……………………………....……11
2.3 References…………………………………………………………………….......12
3. Neutron Scattering to Study Biomolecular Dynamics……………………....………….15
3.1 Protein and Water Dynamics………………………………………....…………...15
3.2 Properties, Production and Detection of Neutrons…………………....…………..22
3.3 Scattering Processes and Observational Limits………………………...………...25
3.4 Elements of Neutron Scattering Theory………………………………....………..29
3.5 Connecting Theory with Experiments…………………...……….…....………….33
3.6. Elastic and Quasielastic Incoherent Neutron Scattering........................................35
3.7 Instruments Used for Incoherent Neutron Spectroscopy........................................38
3.8 Mean Square Displacements and Force Constants
obtained from Elastic Incoherent Neutron Scattering...................................................41
3.9 Models for Quasielastic Neutron Scattering...........................................................44
3.9.1 Long Range Translational Diffusion……………………...................….44
3.9.2 Rotational Diffusion…………………………………………...………..46
3.9.3 Diffusion within Confined Space.............................................................47
3.10 References.............................................................................................................50
4. Hemoglobin Dynamics in Red Blood Cells: Correlation to Body Temperature...........55
4.1 Abstract...................................................................................................................58
4.2 Introduction.............................................................................................................58
4.3 Materials and Methods............................................................................................62
4.3.1 Sample preparation...................................................................................62
4.3.2 Neutron scattering experiments................................................................63

ii
4.3.3 Data analysis.............................................................................................64
4.3.4 Dynamic light scattering measurement....................................................68
4.4 Results.....................................................................................................................68
4.4.1 Neutron Scattering....................................................................................68
4.4.2 Global Motions.........................................................................................70
4.4.3 Internal Motions.......................................................................................75
4.4.4 Dynamic light scattering...........................................................................80
4.5 Discussion...............................................................................................................80
4.5.1 Global Motions.........................................................................................80
4.5.2 Internal Motions.......................................................................................87
4.6 Conclusion...............................................................................................................90
4.7 Acknowledgements.................................................................................................91
4.8 References...............................................................................................................91
5. From Powder to Solution: Hydration Dependence
of Human Hemoglobin Dynamics Correlated to Body Temperature................................97
5.1 Abstract.................................................................................................................100
5.2 Introduction...........................................................................................................101
5.3 Material and Methods............................................................................................104
5.3.1 Sample preparation.................................................................................104
5.3.2 Neutron scattering experiments..............................................................104
5.3.3 Quasielastic Neutron Scattering Analysis..............................................105
5.3.4 Elastic Neutron Scattering Analysis.......................................................107
5.4 Results...................................................................................................................108
5.4.1 Quasielastic Neutron Scattering.............................................................108
5.4.2 Elastic Neutron Scattering......................................................................116
5.5 Discussion.............................................................................................................117
5.6 Conclusion.............................................................................................................120
5.7 Acknowledgments.................................................................................................121
5.8 References.............................................................................................................121
6. Cytoplasmic Water and Hydration Layer Dynamics in Human Red Blood Cells......127
6.1 Introduction...........................................................................................................130

iii
6.2 Material and Methods............................................................................................130
6.3 Results...................................................................................................................132
6.4 Discussion.............................................................................................................135
6.5 Acknowledgment..................................................................................................135
6.6 Supporting Information.........................................................................................136
6.6.1 Sample preparation.................................................................................136
6.6.2 Neutron experiments..............................................................................137
6.6.3 Data analysis...........................................................................................138
6.6.4 Surface Area Calculations......................................................................143
6.7 References.............................................................................................................144
7. Conclusions Générales et Perspectives /General Conclusion and Perspectives……..147
8. Abbreviations....................................................................................................................159
9. References..........................................................................................................................161
10. Appendix..........................................................................................................................171
10.1 From shell to cell: neutron scattering studies of biological
water dynamics and coupling to activity.....................................................................173
10.2 Dynamics of apomyoglobin in the α-to-β transition and of
partially unfolded aggregated protein.........................................................................191
10.3 Hemoglobin senses body temperature.................................................................201

iv

Introduction Générale
1
1. Introduction Générale
Cette thèse a été effectuée à l’Institut Laue-Langevin, Grenoble, et au Centre de Recherche
Jülich, Allemagne, sous la direction du Dr. Joseph Zaccai et du Prof. Dr. Georg Büldt. Le
sujet de la thèse concerne l’étude de la dynamique de l’hémoglobine et de l’eau in-vivo dans
les globules rouges comparée à la dynamique de l’hémoglobine isolée en fonction de
l’hydratation, mesurée par diffusion incohérente quasiélastique et élastique de neutrons. Le
manuscrit est basé sur trois articles scientifiques. Deux sont déjà publiés, respectivement dans
Biophysical Journal et Journal of the American Chemical Society, le troisième a été soumis
pour publication à Biophysical Journal en janvier 2009.
Tous les organismes vivants sont formés par des cellules. Une thématique de recherche
importante vise à comprendre les processus moléculaires qui ont lieu dans les cellules. Le but
de la biophysique moléculaire est de comprendre la fonction, la structure, la dynamique et
l’interaction avec le solvant des systèmes biomoléculaires comme les protéines, l’ADN, ou les
membranes au niveau atomique. Les protéines sont des macromolécules qui sont produites
dans les cellules et qui sont responsables d’une grande partie des fonctions dans l’organisme.
Le génome humain contient l’information pour des dizaines de milliers de protéines
différentes. Chacune a sa ou ses fonctions spécifiques. Quelques protéines fonctionnent
comme des enzymes et catalysent des réactions chimiques. D’autres forment le tissu et des
structures comme les muscles, la peau ou le cytosquelette. Des protéines spécialisées
transforment l’énergie solaire en énergie chimique via la photosynthèse. D’autres encore
transportent et stockent des substances de façon vivement régulée, comme c’est le cas de
l’hémoglobine avec l’oxygène. Les protéines font souvent partie de grands assemblages avec
d’autres protéines, l’ADN, l’ARN, des sucres, ou des lipides. La connaissance de la structure
au niveau atomique est nécessaire pour comprendre comment les protéines peuvent réaliser
toutes leurs fonctions. Néanmoins, les protéines ne sont pas des objets statiques mais leur
structure est animée par des fluctuations permanentes. Elles sont des objets mous et
Introduction Générale
2
déformables. La dynamique et les fluctuations ont une importance fondamentale pour la
fonction biologique.
La technique de diffusion incohérente des neutrons est très bien adaptée pour étudier la
dynamique des biomolécules dans la gamme de temps de la picoseconde à la nanoseconde et
la gamme de longueur de l’Ångstrom. La section efficace de diffusion incohérente de
l’hydrogène est d’un ordre de grandeur plus élevé que celles des autres éléments qui
constituent normalement la matière biologique, ainsi que celle du deutérium. Les atomes
d’hydrogène sont distribués quasi-uniformément dans les protéines. Pratiquement, un atome
sur deux dans une protéine est un atome d’hydrogène. En conséquence, la diffusion
incohérente de neutrons mesure la dynamique moyenne des protéines. La technique de
diffusion quasiélastique de neutrons est particulièrement bien adaptée pour mesurer la
dynamique de l’eau dans la gamme de temps correspondant aux mouvements rapides de l’eau
volumique à ceux plus lents de l’eau interfaciale. Le système biologique choisi pour cette
thèse est l’hémoglobine dans les globules rouges. L’hémoglobine est le constituant
macromoléculaire principal des globules rouges. La protéine transporte, avec une régulation
extrêmement fine, l’oxygène des poumons aux tissus. Les globules rouges sont des cellules
plutôt simples, comme ils ne possèdent pas de noyau ou d’organelles et ils ne sont pas
capables de synthétiser des protéines. Des expériences d’aspiration de globules rouges
humains individuels utilisant des micropipettes ont montré qu’il existe une transition de
passage à la température physiologique (Artmann et al. 1998). Des expériences de
viscosimétrie avec des solutions d’hémoglobine très concentrées ont montré qu’il y a une
transition colloïdale d’un gel à un état fluidique également à la température physiologique
(Kelemen et al. 2001). Des expériences de dichroïsme circulaire et de diffusion dynamique de
la lumière ont été effectuées sur l’hémoglobine de différentes espèces à températures
physiologiques différentes. Elles ont montré que la température de transition est corrélée
directement à la température physiologique (Digel et al. 2006 ; Zerlin et al. 2007). Le but de la
thèse était d’étudier par diffusion des neutrons s’il y a une transition dans le comportement
dynamique de l’hémoglobine ou du solvant autour de la température du corps. Une série
d’expériences de diffusion de neutrons ont été faites sur des globules rouges entiers et
comparées à des expériences sur des poudres d’hémoglobine hydratées et sur l’hémoglobine
en solution concentrée.

Introduction Générale
3
Suite à l’introduction générale, le deuxième chapitre de la thèse présente une introduction à
l’hémoglobine et aux globules rouges. Les expériences sur la transition de l’hémoglobine à la
température physiologique sont résumées dans ce chapitre.
Le troisième chapitre décrit la diffusion des neutrons appliquée à l’étude de la dynamique des
biomolécules. La dynamique des protéines en générale et les propriétés de la dynamique de
l’eau dans les systèmes biologiques sont présentées. Les propriétés du neutron et les méthodes
de production et de détection des neutrons sont données. Des éléments de la théorie de
diffusion de neutrons qui sont nécessaires pour la compréhension de la thèse sont résumés.
Les méthodes de la diffusion élastique et quasiélastique de neutrons et les instruments sont
décrits. Finalement, les concepts de déplacement carré moyen et constante de force obtenus
par diffusion élastique de neutrons sont expliqués et les modèles utilisés pour interpréter les
expériences quasiélastiques sont résumés.
Le quatrième chapitre est basé sur un article publié dans Biophysical Journal. Il présente une
étude sur la dynamique de l’hémoglobine dans les globules rouges mesurée par diffusion
quasiélastique de neutrons.
Hemoglobin Dynamics in Red Blood Cells: Correlation to Body Temperature (2008) Stadler
A. M., I. Digel, G. M. Artmann, J. P. Embs, G. Zaccai, and G. Büldt. Biophysical Journal 95:
5449–5461
Dans l’étude, la dynamique interne de l’hémoglobine et la diffusion macromoléculaire globale
ont été mesurées. L’expérience a montré qu’il y a une transition dans la géométrie des
mouvements internes à 36.9°C. À des températures plus élevées que la température du corps,
la dynamique des chaînes latérales des acides amimés occupent des volumes plus grands que
prévu par l’effet normal de la température. La diffusion macromoléculaire globale a été
interprétée avec des concepts théoriques pour des particules colloïdales.
Le cinquième chapitre présente un article basé sur la dynamique de l’hémoglobine en fonction
de l’hydratation. L’article a été soumis au Biophysical Journal.
From Powder to Solution: Hydration Dependence of Human Hemoglobin Dynamics
Correlated to Body Temperature. Stadler A. M., I. Digel, J. P. Embs, T. Unruh, M. Tehei, G.
Zaccai, G. Büldt, and G. M. Artmann.
L’influence de l’hydratation sur la dynamique de l’hémoglobine a été mesurée par diffusion
élastique et quasiélastique de neutrons. Les temps de résidence entre les sauts locaux, de
Introduction Générale
4
l’ordre de quelques picosecondes, sont réduits en solution concentrée et augmentés en poudre
d’hémoglobine hydratée. La transition dans la géométrie des mouvements internes à la
température du corps a été trouvée dans la solution concentrée mais non dans la poudre
hydratée. Ceci indique que les mouvements rapides impliqués dans la transition sont activés
seulement à partir d’un certain niveau d’hydratation. Un résultat annexe est que les poudres
hydratées ne pourraient pas montrer tous les aspects dynamiques dans l’ordre de quelques
picosecondes, qui pourraient être nécessaires pour la fonction biologique.
Le sixième chapitre est basé sur un article scientifique publié dans Journal of the American
Chemical Society qui décrit des expériences sur la dynamique de l’eau cellulaire dans les
globules rouges.
Cytoplasmic Water and Hydration Layer Dynamics in Red Blood Cells (2008) Andreas M.
Stadler, Jan P. Embs, Ilya Digel, Gerhard M. Artmann, Tobias Unruh, Georg Büldt, and
Giuseppe Zaccai. Journal of the American Chemical Society 130 (50): 16852–16853
La dynamique de l’eau dans les globules rouges a été mesurée par diffusion quasiélastique de
neutrons. Des spectromètres de neutrons à résolution en temps de 40, 13 et 7 picosecondes ont
été combinés pour couvrir l’échelle de temps des mouvements de l’eau volumique et de l’eau
interfaciale. Une fraction d’eau cellulaire d’environ 90% est caractérisée par un coefficient de
diffusion translationnel similaire à l’eau volumique. Une partie de l’eau cellulaire (~10%)
montre par contre une dynamique significativement ralentie. Le ralentissement a été attribué à
l’interaction avec la surface de l’hémoglobine. La fraction de l’eau ralentie correspond à
environ la moitié des molécules d’eau dans la première couche d’hydratation.
Le septième chapitre présente un résumé du travail, les conclusions et les perspectives.
General Introduction
5
1. General Introduction
The present PhD thesis was carried out at the Institut Laue-Langevin, Grenoble, and at the
Research Centre Jülich, Germany, under the joint supervision of Dr. Giuseppe Zaccai and
Prof. Dr. Georg Büldt. The subject concerns incoherent quasielastic and elastic neutron
scattering experiments on the dynamics of hemoglobin and water in whole red blood cells in-
vivo, and as a comparison, hemoglobin dynamics in response to hydration. The document is
based on three scientific articles. Two of them are published in Biophysical Journal and
Journal of the American Chemical Society, respectively. The third one has been submitted for
publication to Biophysical Journal, in January 2009.
All living organisms consist of cells. One subject of research lies in a detailed understanding
of the molecular processes that occur in cells. Molecular biophysics focuses on the
investigation of biological systems at the atomic level, such as for example proteins,
membranes, DNA and their interactions with the surrounding solvent. Proteins are responsible
for a large variety of different functions. The human genome contains the information for
several tens of thousands of different proteins. Each one has got one or more specific
functions. Some proteins work as enzymes and catalyse chemical reactions. Others form
tissues and structures such as muscles, skin or the cytoskeleton. Specialised proteins convert
solar energy via photosynthesis into chemical energy, or transport and store substances in a
sophisticated way, as it is the case for hemoglobin that carries oxygen. Proteins are often part
of complex macromolecular assemblies that consist of other proteins, DNA, RNA, sugar or
lipid molecules. The knowledge of its structure at the atomic level is necessary to understand
how a protein can fulfil its specific task. However, proteins are not static structures but they
are soft and deformable. The dynamics and fluctuations of proteins are of fundamental
importance for biological function.

General Introduction
6
Incoherent neutron scattering is a particular well suited technique to study biomolecular
dynamics in the picosecond to nanosecond time and Ångstrom length scale. The incoherent
scattering cross section of hydrogen is one order of magnitude larger than all other elements
that usually occur in biological matter, and deuterium. Hydrogen atoms are uniformly
distributed in proteins and constitute nearly every second atom. Neutron scattering therefore
probes average protein dynamics. The technique of quasielastic incoherent neutron scattering
is especially useful for the study of the dynamics of water in the time scales of fast motions of
bulk water to slower dynamics of interfacial water. The biological system that was studied in
the thesis is hemoglobin in red blood cells. Hemoglobin is the main macromolecular
constituent of red blood cells. The protein transports oxygen from the lungs to the tissues in a
highly coordinated and regulated way. Red blood cells are simple cells as they do not contain
a nucleus or organelles, and are not able to synthesize proteins. Micropipette experiments on
single red blood cells identified a passage transition at body temperature (Artmann et al.
1998). Viscosity measurements of hemoglobin solutions at high concentration showed that
there equally occurs a colloidal gel to fluid transition of hemoglobin solutions at body
temperature (Kelemen et al. 2001). Circular dichroism and dynamic light scattering
experiments further revealed that the temperature transition of hemoglobin is directly
correlated to the body temperature of different species (Digel et al. 2006; Zerlin et al. 2007).
The aim of the thesis was to study if a transition in the dynamics of hemoglobin or solvent
occurs at body temperature. This was achieved in a series of incoherent neutron scattering
experiments on whole red blood cells that were compared to results of hydrated hemoglobin
powder, and concentrated hemoglobin solution samples.
Following the general introduction, the second chapter of the thesis gives an introduction to
hemoglobin and red blood cells. Recent experiments on the temperature transition of
hemoglobin at body temperature are summarized.
The third chapter deals with neutron scattering applied to the study of biomolecular dynamics.
Protein dynamics and the dynamic properties of water in biological systems are presented.
The general properties of the neutron and methods of neutron production and detection are
described. The elements of neutron scattering theory that are necessary for the further
understanding of the thesis are summarized. The methods of elastic and quasielastic
incoherent neutron scattering are presented and the commonly used instruments are described.
Finally, the concepts of mean square displacements and force constants that are obtained from
General Introduction
7
elastic incoherent neutron scattering are explained and typical models that are used for
quasielastic neutron scattering are summarized.
The fourth chapter is based on a published article in Biophysical Journal about hemoglobin
dynamics in red blood cells measured with quasielastic incoherent neutron scattering:
Hemoglobin Dynamics in Red Blood Cells: Correlation to Body Temperature (2008) Stadler
A. M., I. Digel, G. M. Artmann, J. P. Embs, G. Zaccai, and G. Büldt. Biophysical Journal 95:
5449–5461
Internal protein dynamics and global macromolecular diffusion were separated. The
experiments revealed a change in the geometry of internal protein dynamics above 36.9°C.
Above this temperature amino acid side-chain dynamics occupy larger volumes than expected
from normal temperature dependence. Global macromolecular diffusion was interpreted
favourable with theoretical concepts for short-time self-diffusion of non-charged hard sphere
colloids.
The fifth chapter presents an article about hemoglobin dynamics as response to hydration. The
article has been submitted to Biophysical Journal.
From Powder to Solution: Hydration Dependence of Human Hemoglobin Dynamics
Correlated to Body Temperature. Stadler A. M., I. Digel, J. P. Embs, T. Unruh, M. Tehei, G.
Zaccai, G. Büldt, and G. M. Artmann.
The influence of hydration on hemoglobin dynamics was studied with elastic and quasielastic
incoherent neutron scattering. The residence times of localized jumps in the order of a few
picoseconds were found to be significantly reduced in concentrated solution compared to fully
hydrated powder. The body temperature transition in protein dynamics was found in the
concentrated solution sample but was absent in the fully hydrated powder, indicating that
picosecond protein dynamics responsible for the transition is activated only at a sufficient
level of hydration. A collateral result from the study is that fully hydrated protein powder
samples do not accurately describe all aspects of protein picosecond dynamics that might be
necessary for biological function.
The sixth chapter deals with the dynamic properties of cellular water in red blood cells in the
form of a scientific article that was published in Journal of the American Chemical Society.

General Introduction
8
Cytoplasmic Water and Hydration Layer Dynamics in Red Blood Cells (2008) Andreas M.
Stadler, Jan P. Embs, Ilya Digel, Gerhard M. Artmann, Tobias Unruh, Georg Büldt, and
Giuseppe Zaccai. Journal of the American Chemical Society 130 (50): 16852–16853
The dynamics of water in human red blood cells was measured with quasielastic incoherent
neutron scattering. Neutron spectrometers with time resolutions of 40, 13, and 7 ps were
combined to cover time scales of bulk water dynamics to reduced mobility interfacial water
motions. A major fraction of around 90% of cell water is characterized by a translational
diffusion coefficient similar to bulk water. A minor fraction of around 10% of cellular water
exhibits reduced dynamics. The slow water fraction was attributed to dynamically bound
water on the surface of hemoglobin, which accounts for approximately half of the hydration
layer.
The seventh chapter gives a summary of the performed work and presents an outlook on
future perspectives.

Hemoglobin and Red Blood Cells
9
2. Hemoglobin and Red Blood Cells
2.1 Biological Background The main natural environment of proteins is within the cell, and protein function necessarily is
adapted to these conditions. In bacteria and eukaryotic cells macromolecular interactions are
likely to be influenced by the high cellular protein concentration (Hall and Minton 2003;
Minton 2001; Zimmerman and Minton 1993). This effect, called ‘crowding’, results from
high volume occupancy and steric hindrance of the protein molecules between each other. The
free distance between macromolecules in the cell is in the order of a few Ångstroms (Krueger
and Nossal 1988) and intercellular water is in close vicinity to the protein surfaces. There is
much interest and discussion about similarities and differences in structure and dynamics of
cytoplasmic and bulk water (Ball 2008). Little is still known on how protein dynamics is
influenced by the crowded cytoplasmic environment and the special properties of cellular
water.
The main protein constituent of red blood cells is hemoglobin (92% of dry weight) (see
Figure 1). Its biological function is to carry oxygen from the lungs to the tissues. The X-ray
structure of hemoglobin is shown in Figure 2. The protein is a tetramer with a molecular
weight of around 64 kDa. It consists of two α-chains and two β-chains, each having 141 and
146 amino acid residues, respectively. The α-chains contain seven and the β-chains eight
helices (Perutz 1987). Each chain carries one heme group, in a pocket, to which oxygen and
several other small molecules can bind reversibly. The concentration of hemoglobin in the red
blood cells is around 330 mg/ml (Krueger and Nossal 1988).

Hemoglobin and Red Blood Cells
10
Figure 1: Illustration of a red blood cell in the lower half of the picture with surrounding
blood serum proteins in the upper half. The red blood cell is densely filled with hemoglobin,
drawn in red. The cell wall with membrane proteins is coloured purple. (Goodsell 2000).
Figure 2: Hemoglobin is a tetrameric protein. It consists of two α- and two β-chains. Every
chain carries one heme molecule in a pocket to which oxygen binds reversible. (PDB code
1G09)

Hemoglobin and Red Blood Cells
11
2.2 Body Temperature Transition of Hemoglobin
Hemoglobin at high concentration shows a variety of interesting effects. Micropipette
experiments with aspirated single human red blood cells revealed a sudden change in the
behaviour of the cells from blockage of the pipette below TPipette=36.4 ± 0.4 °C to easy
passage above. The transition temperature TPipette of cell passage was surprisingly very close
to human body temperature. During the micropipette experiment water is pressed out of the
red blood cell and the hemoglobin concentration rises to values of more than 500 mg/ml
(Kelemen et al. 2001).
Viscosity measurements were performed on human hemoglobin solutions between 330 mg/ml
and 500 mg/ml to study the flow properties at such concentrations (Artmann et al. 1998). The
experiments found a sharp drop in viscosity in Arrhenius plots, at concentrations higher than
450 mg/ml at body temperature. The drop was absent at the physiological concentration of
330 mg/ml. The results were interpreted as a colloidal phase transition in highly concentrated
hemoglobin solution from a gel-like to a fluid state at body temperature (Artmann et al. 1998;
Kelemen et al. 2001). In the fluid-like state, above body temperature, hemoglobin exhibits
pronounced aggregation, whereas at lower temperatures hemoglobin aggregation is
suppressed (Artmann et al. 1998).
Further studies with circular dichroism investigated changes of the protein secondary structure
around the transition temperature. A partial loss of alpha-helical content was found at a
temperature TCD=37.2 ± 0.6 °C for human hemoglobin (Artmann et al. 2004). The loss of
hemoglobin alpha-helical structure at a specific temperature TCD was also observed for
hemoglobin molecules of a large variety of different species (Digel et al. 2006; Zerlin et al.
2007). Amazingly, the transition temperatures TCD were directly correlated to the body
temperature of the animals ranging from 34 °C, for the duck-billed platypus, to 42 °C for a
bird, the spotted nutcracker. It was excluded that the partial loss of protein structure at TCD
results from irreversible protein denaturation which occurs at distinctly higher temperatures.
Independently of these experiments, two-dimensional infrared correlation spectroscopy
suggested a structural perturbation stage of bovine hemoglobin between 30 °C and 44 °C (Yan
et al. 2004). The observed perturbations were assigned to hydrogen-bonded extended chains
that connect the helices. It was concluded that the passage transition of red blood cells is
caused by hemoglobin molecules and that the observed small structural changes of
Hemoglobin and Red Blood Cells
12
hemoglobin at TCD might be the cause for the drop of viscosity at TPipette (Kelemen et al.
2001). It has been speculated that partial unfolding of the α-helical structure at body
temperature goes in hand with an increase in surface hydrophobicity that promotes protein
aggregation (Digel et al. 2006), which causes a drop in colloidal osmotic pressure (Artmann et
al. 2008).
2.3 References
Artmann GM, Burns L, Canaves JM, Temiz-Artmann A, Schmid-Schonbein GW, Chien S,
Maggakis-Kelemen C (2004) Circular dichroism spectra of human hemoglobin reveal
a reversible structural transition at body temperature. Eur. Biophys. J. 33:490-6
Artmann GM, Kelemen C, Porst D, Büldt G, Chien S (1998) Temperature transitions of
protein properties in human red blood cells. Biophys. J. 75:3179-83
Artmann GM, Zerlin KF, Digel I (2008) Hemoglobin Senses Body Temperature. In: Artmann
GM, Chien S (eds) Bioengineering in Cell and Tissue Research, vol IV. Springer
Verlag, Berlin, Heidelberg, pp 415-447
Ball P (2008) Water as an Active Constitutent in Cell Biology. Chem. Rev. 108:74-108
Digel I, Maggakis-Kelemen C, Zerlin KF, Linder P, Kasischke N, Kayser P, Porst D, Temiz
Artmann A, Artmann GM (2006) Body temperature-related structural transitions of
monotremal and human hemoglobin. Biophys. J. 91:3014-21
Goodsell DS (2000) http://mgl.scripps.edu/people/goodsell/illustration/public
Hall D, Minton AP (2003) Macromolecular crowding: qualitative and semiquantitive
successes, quantitative challenges. Biochim. Biophys. Acta 1649:127-139
Kelemen C, Chien S, Artmann GM (2001) Temperature transition of human hemoglobin at
body temperature: effects of calcium. Biophys. J. 80:2622-30
Krueger S, Nossal R (1988) SANS studies of interacting hemoglobin in intact erythrocytes.
Biophys. J. 53:97-105
Minton AP (2001) The Influence of Macromolecular Crowding and Macromolecular
Confinement on Biochemical Reactions in Physiological Media. J. Biol. Chem.
276:10577-10580
Perutz MF, G. Fermi, B. Luisi (1987) Stereochemistry of Cooperative Mechanisms in
Hemoglobin. Acc. Chem. Res. 20:309-321

Hemoglobin and Red Blood Cells
13
Yan YB, Wang Q, He HW, Zhou HM (2004) Protein thermal aggregation involves distinct
regions: sequential events in the heat-induced unfolding and aggregation of
hemoglobin. Biophys. J. 86:1682-90
Zerlin KF, Kasischke N, Digel I, Maggakis-Kelemen C, Temiz Artmann A, Porst D, Kayser
P, Linder P, Artmann GM (2007) Structural transition temperature of hemoglobins
correlates with species' body temperature. Eur. Biophys. J. 37:1-10
Zimmerman SB, Minton AP (1993) Macromolecular Crowding: Biochemical, Biophysical
and Physiological Consequences. Ann. Rev. Biophys. Biomol. Struct. 22:27-65

Hemoglobin and Red Blood Cells
14

Neutron Spectroscopy to Study Biomolecular Dynamics
15
3. Neutron Spectroscopy to Study Biomolecular Dynamics
The chapter starts with a presentation of protein and water dynamics in general. Physical
concepts and equations that are necessary for the understanding of the theory of incoherent
neutron scattering are schematized. Inelastic and elastic scattering processes and incoherent
and coherent neutron scattering are presented. The application of elastic and quasielastic
incoherent neutron scattering to measure biomolecular dynamics is explained at the end of the
chapter.
3.1 Protein and Water Dynamics
First studies on protein dynamics used sperm whale myoglobin as a model system. It was the
first protein of which the structure could be solved by X-ray crystallography (Kendrew et al.
1960). The protein serves as a scaffold for the iron containing heme-group that is responsible
for oxygen binding and transport. The crystal structure showed clearly that there are no
permanent channels in the protein structure through which the oxygen molecule could migrate
from the surrounding solvent to its binding place deep in the protein. Only fluctuations of the
protein structure can allow the rapid opening and closing of channels in the protein structure
for the purpose of oxygen binding indicating that knowledge of both protein structure and
dynamics is necessary for a complete understanding of protein function.
Ligand rebinding in myoglobin was measured with optical absorption in the range of 10-6 to
103 seconds after photo flash dissociation (Austin et al. 1975). In total, up to four different
rebinding processes were found that depend differently on temperature. Between around
180 K to 280 K all four processes could be found; below around 180 K only the first
rebinding process occurs. The rebinding processes were identified with four different
activation energy barriers that the ligand has to pass before rebinding. It was concluded that
the first energy barrier corresponds to direct rebinding of the ligand to the iron atom.
Nonexponential rebinding rates were found for the first process below 180 K. The results

Neutron Spectroscopy to Study Biomolecular Dynamics
16
imply that the first energy barrier is in fact a distribution of activation energies. The authors
explained this by the assumption that myoglobin does not exist in only one fixed structure but
it possesses many slightly different conformational states. Below 180 K each protein is frozen
and trapped in one of the conformational states. Above 180 K the protein can interchange
between the different conformations. The differences between many different structural
conformations need to be rather small as they could not be seen with X-ray crystallography
(Frauenfelder et al. 1979). These experiments led to the picture of conformational substates of
proteins (Frauenfelder et al. 1988). In the native state a protein does not exist in a single static
structure. Instead it fluctuates between a large ensemble of slightly different conformational
structures. The free enthalpy of all substates is the same (or very close) and the different
conformations are separated by activation energy barriers. The sampling of the
conformational substates leads to the entropic stabilisation of proteins.
Motions in biological macromolecules and proteins occur over a very broad range of time
scales: from fast vibrations and electron transfer processes in the order of some femtoseconds,
to protein folding events in the order of some seconds. The amplitudes of motion lie between
around 0.1 Å for fast atomic vibrations up to several 10 Å for collective motions. A short
overview of time and length scales of motions in biological macromolecules is given in
Table 1.

Neutron Spectroscopy to Study Biomolecular Dynamics
17
Table 1: Typical time and length scales of internal motion in proteins modified after
(McCammon and Harvey 1987)
Motion Spatial extend [nm] Amplitude [nm] Log10
characteristic
time [s]
Relative vibration of
bonded atoms
0.2 to 0.5 0.001 to 0.01 -14 to -13
Elastic vibration of globular
region
1 to 2 0.005 to 0.05 -12 to -11
Rotation of sidechains at
surface
0.5 to 1 0.5 to 1 -11 to -10
Torsional libration of
buried groups
0.5 to 1 0.05 -11 to -9
Relative motion of different
globular regions (hinge
bending)
1 to 2 0.1 to 0.5 -11 to -7
Rotation of medium-sized
sidechains in interior
0.5 0.5 -4 to 0
Allosteric transitions 0.5 to 4 0.1 to 0.5 -5 to 0
Local denaturation 0.5 to 1 0.5 to 1 -5 to +1
First experiments on protein dynamics came from Mößbauer spectroscopy studies of
myoglobin. The technique specifically probes the dynamics of the iron atom in the heme
group with very high resolution. Motions in the time scale up to 140 ns are detected. The
results showed that the mean square displacements of the iron atom increase linearly with
temperature up to around 180 K. Above 180 K the mean square displacements increase with a
steeper gradient. This was interpreted in terms of supplemental anharmonic motions that
contribute to the dynamics above 180 K (Parak et al. 1982). The results obtained with
Mößbauer spectroscopy were interpreted with a model of an overdamped Brownian oscillator
(Knapp et al. 1982). Below the dynamical transition temperature of 180 K proteins are trapped
in conformational substates and perform harmonic oscillations. Above 180 K the proteins
switch by thermal activation to a more flexible state, in which internal quasi-diffusive motions
are possible.

Neutron Spectroscopy to Study Biomolecular Dynamics
18
The nature of the hydration shell of myoglobin was investigated with infrared spectroscopy
and calorimetry (Demmel et al. 1997; Doster et al. 1986). At low temperature the hydration
water turns into an amorphous, disordered state with strongly reduced dynamics. The
experiments revealed a glass-like transition of the hydration water at around 200 K which is
close to the dynamical transition temperature of myoglobin. The authors emphasized the
importance of the glass-like transition of the solvent near 200 K for the dynamical transition
of myoglobin. They concluded that the cooperativity of the hydrogen bonding network
provides the intimate coupling between solvent and protein dynamics (Doster et al. 1986).
The important role of the solvent on the dynamical transition was further demonstrated in a
Mößbauer experiment that investigated myoglobin dynamics in a sucrose- water solvent
(Lichtenegger et al. 1999). The dynamic transition of myoglobin was shifted to 240 K due to
the higher viscosity of the solvent.
Incoherent neutron scattering is dominated by hydrogen atom motions as their incoherent
scattering cross section is one order of magnitude bigger than that of all other elements which
usually occur in biological matter, and deuterium (Sears 1992). The technique probes average
protein dynamics because hydrogen atoms are uniformly distributed in the natural abundance
protein. The time and length scales of molecular motions that are accessible are determined by
the energy resolution and the scattering vector range of the spectrometer, respectively. On the
ps-Å time-length scale, hydrogen atoms that are covalently bound to amino acid side-chains
reflect the dynamical behaviour of the bigger chemical units (Reat et al. 1998; Smith 1991;
Wood et al. 2008).
The dynamical transition at about 180 K was revealed to exist for the motion of all hydrogen
atoms in myoglobin by energy resolved incoherent neutron scattering (Doster et al. 1989).
The dynamical transition was also found by neutron scattering in a membrane protein
(Ferrand et al. 1993). Below 180 K the dynamics of myoglobin are similar to a harmonic
solid. At 180 K additional non-vibrational motions set on that were attributed to jumps of the
hydrogen atoms between two states (Doster et al. 1989). The jump motion was described with
a double well model for two states separated with a temperature independent distance d and a
free energy difference. The amplitude of the jump distance was found to be d=1.5 Å which
was interpreted being due to dihedral angle fluctuations (Doster et al. 1989). A fast β-process
and a slower α-process were identified in the inelastic spectra of myoglobin (Cusack and
Neutron Spectroscopy to Study Biomolecular Dynamics
19
Doster 1990; Doster et al. 1989, 1990). The fast β-process was attributed to localised jumps
with correlation times of ~0.5ps, the slower α-process was brought into connection with the α-
process that occurs in liquids and polymers (Doster et al. 1989). The onset of the α-process
occurs at 240 K and was attributed to collective excitations that are induced by the melting of
glassy water in the hydration shell (Demmel et al. 1997; Doster et al. 1986; Doster et al.
1989). Model independent mean square displacements were obtained in the Gaussian
approximation that included the contributions of the α-, the β-process and vibrational motions
(Doster et al. 1989). In that way, the amplitudes of the α-process were obtained as a function
of temperature. The slow α-process is absent in dehydrated powders. Recently, the β-process
was attributed to localised jumps of amino acid side-chains (Doster 2008). The shape of the
inelastic spectra of the α- and β-process could be described quantitatively with predictions of
mode coupling theory (Doster et al. 1990). It was concluded that a cage effect of nearest
neighbours is responsible for the spectral features. However, the difference between protein
dynamics and glass physics was pointed out, as the structure of a protein imposes restrictions
to the possible movements in the long time limit, amino acid side chains are attached to the
protein backbone for example (Doster et al. 1990). In analogy to the glass transition, the onset
of the slower α-process at 240 K was defined as the dynamical transition temperature and the
α-process was identified as the elementary step of diffusion. The onset at 180 K due to fast
jumps between states of different energy is a precursor of the slower α-process (Doster 2008).
Depending on the energy resolution and scattering vector range of the neutron spectrometer, a
third inflection in the thermal displacements, which is hydration-independent, was observed at
a temperature between 100 and 150 K. It has been attributed to methyl group rotations
(Cornicchi et al. 2006; Doster and Settles 2005; Roh et al. 2006; Roh et al. 2005). These local
jumps contribute to the sampling of a large number of conformational substates that are
responsible for the entropic stabilization of proteins (Fraunfelder et al. 1991).
A model for protein dynamics related to the Doster et al. (1989) double well used in this work
was proposed by Bicout and Zaccai (Bicout and Zaccai 2001). Protein dynamics is interpreted
with a picture of a quasi-harmonic average potential well for the complex macromolecular
force field (Bicout and Zaccai 2001; Zaccai 2000). The model assumes that protein dynamics
can be described by two states: local fluctuations around the equilibrium positions with small
amplitude and larger amplitude fluctuations in a cage formed by neighboring molecules. The
two states are separated by a free energy difference and the transition from the low amplitude

Neutron Spectroscopy to Study Biomolecular Dynamics
20
state to the large amplitude state is activated by temperature. The dynamical transition is
defined as the deviation of the mean square displacements from low temperature linear
behaviour. In the model this occurs when a small fraction (10%) of the total population of
particles in the small amplitude state changes into the large amplitude state.
Following the Bicout and Zaccai model, protein flexibility was defined as the amplitude of
atomic motions 2u which corresponds to the width of the quasi-harmonic average
potential well. Protein thermal stability would correspond to the depth of the well (Tehei et al.
2001; Tehei and Zaccai 2007). A mean effective force constant <k’> can be obtained from the
dependence of the <u2> as function of temperature. This mean effective force constant, called
resilience, describes the shape of the well (Zaccai 2000). Many conformational substates exist
within the average well and are sampled by localized jump-diffusion (Fraunfelder et al. 1991).
The geometry and activation energy of localized jumps can be determined by QENS. From
elastic incoherent neutron scattering (EINS) mean square displacements <u2> of the thermal
cloud of atomic motions can be determined. Quasielastic neutron scattering (QENS) on the
other hand, enables to distinguish between vibrational and diffusive components (Bee 1988).
This technique allows the quantification of internal diffusion coefficients, residence times and
the determination of the average geometry of motions.
Both protein function and dynamics are closely linked to sufficient hydration. Enzymes are
non-functional in the dry state and catalytic function is only possible above a sufficient
threshold hydration level of around 0.2g H2O/ g protein (Rupley and Careri 1991). In a
membrane protein, anharmonic processes are only activated above a hydration level of around
0.35g H2O/ g protein (Ferrand et al. 1993). Recent work in literature points out that it is the
onset of translational diffusion of the solvent molecules that enables the protein dynamical
transition (Tarek and Tobias 2002; Tournier et al. 2003; Wood et al. 2007). The dynamical
properties of water that is in close contact to protein surfaces are therefore of high importance
for the understanding of protein function.
The cytoplasmic environment in cells is very crowded and protein concentrations range up to
~400 mg/ml (Ellis and Minton 2003). Distances between macromolecules are in the order of
~1nm, which corresponds to only a few layers of water. A large fraction of water molecules is
therefore in close contact to protein surfaces. The translational diffusion coefficient of
hydration water on the surface of C-phycocyanin was found to be 3 times reduced (Bellissent-

Neutron Spectroscopy to Study Biomolecular Dynamics
21
Funel et al. 1996; Dellerue and Bellissent-Funel 2000) compared to that of bulk water
(Teixeira et al. 1985). The dynamics of water in contact with hydrophilic and hydrophobic
peptides at high concentration was found to be reduced compared to bulk water (Russo et al.
2005). Molecular dynamics simulations showed that mostly water molecules in protein
surface cavities exhibit strongly reduced dynamics (Makarov et al. 2000). Water in cells was
therefore assumed to show different dynamics than bulk water. Recent work on water
dynamics in cells proved the contrary: Jasnin et al. measured the dynamics of cellular water in
Escherichia coli with neutron scattering (Jasnin et al. 2008). The authors reported that the
average translational and rotational diffusion coefficients of cell water show similar behaviour
to bulk water. The residence times of cell water were twice as long which was attributed to the
longer times spent in the hydration shell. Persson and Halle measured water dynamics in E.
coli with NMR spectroscopy (Persson and Halle 2008). They concluded that around 85% of
cell water has similar dynamics to bulk water, and around 15% of cell water interacts with the
surface of biomolecules, being slowed down by a factor of around 15 ± 3 compared to bulk
water.
The halophilic cell is a special case. The cell accumulates large amounts of KCl in the molar
level in its cytoplasm and halophilic proteins are only stable at such high salt concentrations.
Solvent interactions of halophilic proteins are particularly strong and halophilic proteins bind
both water and salt ions in their hydration shell (Madern et al. 2000). A previous experiment
on water dynamics in the halophilic organism Haloarcula marismortui revealed a major
cellular water fraction of around 76% with 250 times slower dynamics than bulk water (Tehei
et al. 2007). The slow water fraction at 300 K showed characteristic signs for confined
motions in a restricted volume. That study also revealed that cell water dynamics in E. coli is
not governed by such a slow water fraction (Tehei et al. 2007). Tehei et al. therefore
suggested that an ordering effect of water molecules, KCl and halophilic proteins is
responsible for the large slow water fraction in H. marismortui (Tehei et al. 2007).
Fast bulk-like dynamics of water are in the order of some picoseconds, whereas interfacial
water motions are slowed down and are in the order of some ten picoseconds. Quasielastic
neutron scattering is a well suited technique for the study of the microscopic nature of water
dynamics.

Neutron Spectroscopy to Study Biomolecular Dynamics
22
3.2 Properties, Production and Detection of Neutrons
The neutron is a nuclear particle that decays into a proton, an electron and an electron
antineutrino with a half-life of 887.6±3 s (Mampe et al. 1989) (ß decay mediated via the weak
interaction). The energy of 0.77 MeV that is produced during the decay is shared between the
proton, the electron and the antineutrino.
Mevepn e 77.0+++→ −+ υ
Neutrons can be described as waves with the wave vector kr
defined by
λπ2=k
r,
( 3.1 )
where λ is the wave length of the neutron.
The momentum pr
of the neutron is given by
kvmp n
rh
rr == , ( 3.2 )
with the mass of the neutron mn and its velocity vr
. The kinetic energy of the neutron is
n
22
kin m2
kE
h= . ( 3.3 )
Several properties of the neutron are summarized in Table 2.
Table 2: Properties of the neutron
Mass mn=1.675·10-27 kg
Charge 0
Spin 1/2
Magnetic Moment µn=-0.966·10-26 J T-1

Neutron Spectroscopy to Study Biomolecular Dynamics
23
Although ~50% of all matter consists of neutrons, it is difficult to extract bound neutrons from
the atomic nuclei. Free neutrons need to be produced by nuclear reactions. A high flux is
mandatory for scientific investigations using neutron beams. Research neutron sources either
use nuclear fission or spallation for the production of high flux neutron beams. Both nuclear
fission and spallation are schematically presented in Figure 1. Examples for reactor neutron
sources are the High Flux Reactor at the Institut Laue-Langevin (Grenoble, France) and the
Research Reactor Heinz Maier-Leibnitz at the Technical University Munich (Garching,
Germany). Neutron spallation sources are the ISIS pulsed spallation source at the Rutherford
Appleton Laboratory (Didcot, United Kingdom) and the continuous spallation source SINQ at
Paul Scherrer Institut (Villigen, Switzerland).
The produced neutrons have energies in the range of some MeV. This energy is too high for
neutron scattering experiments. In reactor sources, the neutron energy has also to be reduced
in order to maintain the chain reaction. Therefore, the kinetic energy of the neutrons needs to
be changed by thermal equilibration with moderator elements that are kept at different
temperatures. In the moderators the neutrons exchange their kinetic energy with the moderator
atoms through collisions. At thermal equilibrium the velocities of the neutrons follow a
Maxwell distribution determined by the temperature of the moderator. So called thermal
neutrons are produced with moderators at ambient temperature, while cold neutrons are
obtained from mainly liquid hydrogen or deuterium moderators at ~25 K.
A thermal neutron produced by a moderator at T=293 K has got in average a kinetic energy of
E=25 meV, a wavelength of λ=1.8 Å and a velocity of 2200 m/s.
Neutron Spectroscopy to Study Biomolecular Dynamics
24
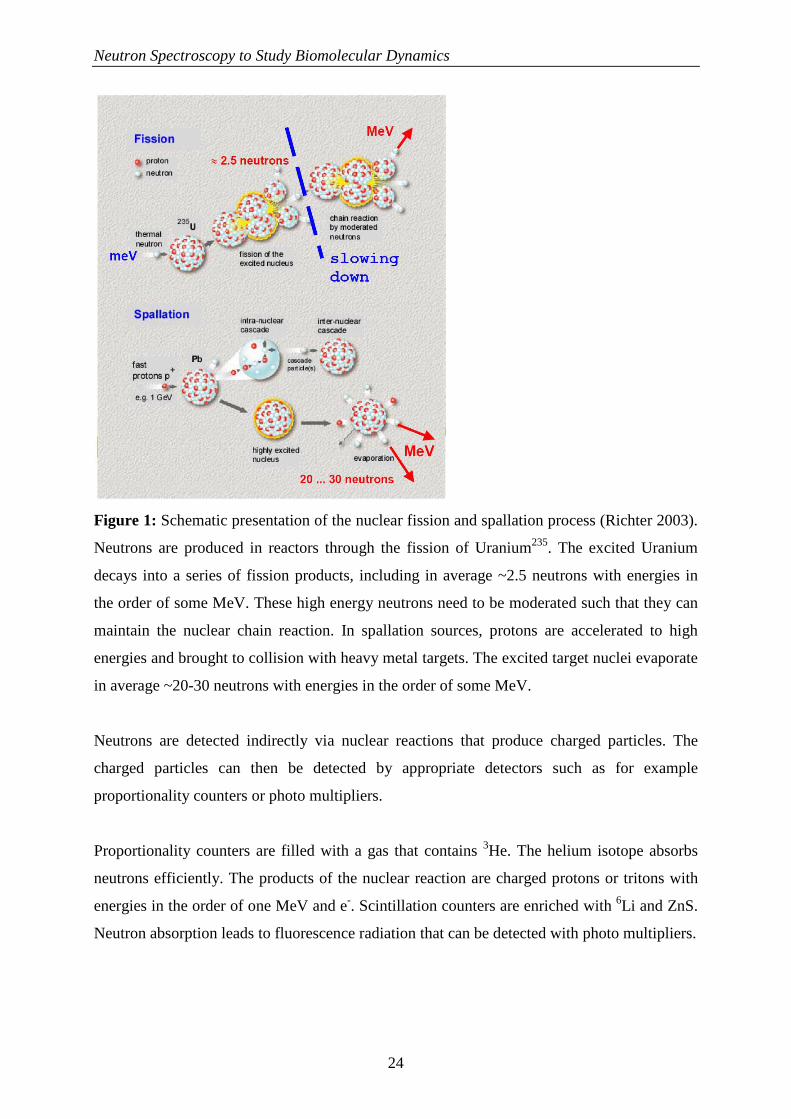
Figure 1: Schematic presentation of the nuclear fission and spallation process (Richter 2003).
Neutrons are produced in reactors through the fission of Uranium235. The excited Uranium
decays into a series of fission products, including in average ~2.5 neutrons with energies in
the order of some MeV. These high energy neutrons need to be moderated such that they can
maintain the nuclear chain reaction. In spallation sources, protons are accelerated to high
energies and brought to collision with heavy metal targets. The excited target nuclei evaporate
in average ~20-30 neutrons with energies in the order of some MeV.
Neutrons are detected indirectly via nuclear reactions that produce charged particles. The
charged particles can then be detected by appropriate detectors such as for example
proportionality counters or photo multipliers.
Proportionality counters are filled with a gas that contains 3He. The helium isotope absorbs
neutrons efficiently. The products of the nuclear reaction are charged protons or tritons with
energies in the order of one MeV and e-. Scintillation counters are enriched with 6Li and ZnS.
Neutron absorption leads to fluorescence radiation that can be detected with photo multipliers.

Neutron Spectroscopy to Study Biomolecular Dynamics
25
3.3 Scattering Processes and Observational Limits
We now consider the scattering of a neutron by a sample. Let kr
and 'kr
be the wave vectors of
the incident and scattered neutron, respectively. A scheme of the scattering process is given in
Figure 2.
Figure 2: Scheme of the scattering process of neutrons with a sample. An incident neutron
enters from the left and is scattered into the solid angle dΩ. The incident neutron has got the
wave vector kr
, the scattered neutron the wave vector'kr
. The direction of 'kr
is determined by
the scattering angle 2θ and the azimuthal angle φ. The sample is indicated as a box at the
centre of the coordinate system and the wave vector of the incident neutron beam is parallel to
the z-axis.
The difference in kinetic energy E between the incident and scattered neutron is
( )222
'2
kkm
En
−= h, ( 3.4 )
E is also called energy transfer. Positive values of E correspond to the situation when the
neutron deposits energy in the sample. In the case of negative values of E, the neutron gains
energy from the sample.

Neutron Spectroscopy to Study Biomolecular Dynamics
26
If E=0 than the process is called elastic scattering. If there occurs exchange of energy
between the neutron and the sample with 0≠E , then the event is called inelastic scattering.
The difference in momentum between the incident and scattered neutron is
'kkqr
hr
hr
h −= , ( 3.5 )
with the so called scattering vector qr
. Sometimes, in analogy with crystallography, the
scattering vector is defined as kkqrrr −= ' .
In the case of elastic scattering k = k’ and the scattering vector q can be written as
( )λ
θπ sin4== qq
r, ( 3.6 )
with the scattering angle 2θ as defined in Figure 2.
For inelastic scattering processes it is 'kk ≠ and equation ( 3.6 ) is not valid anymore. The
connection 'kkqr
hr
hr
h −= can be written as
)2cos(k'k2k'kq 222 θ−+= . ( 3.7 )
With the energy transfer E it is
222 2
'h
Emkk n−= . ( 3.8 )
This can be written finally as
22
222 2
)2cos(22
2hh
Emkk
Emkq nn −−−= θ , ( 3.9 )

Neutron Spectroscopy to Study Biomolecular Dynamics
27
which describes the fundamental kinematic connection for neutrons between scattering vector
q, energy transfer E and scattering angle 2θ. This relation gives the limiting boundaries of the
accessible q-E space for any neutron spectrometer. The connection between q, E and 2θ
according to equation ( 3.9 ) is plotted exemplarily in Figure 3 for neutrons with the incident
energy Ekin=3.14 meV. It is important to notice that the scattering vector q changes as a
function of E at a fixed scattering angle 2θ.
Figure 3: The connection between scattering vector q, energy transfer E and scattering angle
2θ. In this plot the kinetic energy of the incident neutron is Ekin=3.14 meV, which corresponds
to a neutron wave length of λ=5.1Å. The maximum energy transfer E is determined by the
kinetic energy of the neutron that it can deposit in the sample; it is indicated by the vertical
dotted line at E=3.14 meV. The energy transfer in the case of elastic scattering is E=0, which
is shown by the vertical dotted line at E=0. The solid horizontal line indicates the scattering
vector q=1.7Å-1, as shown in Figure 4.
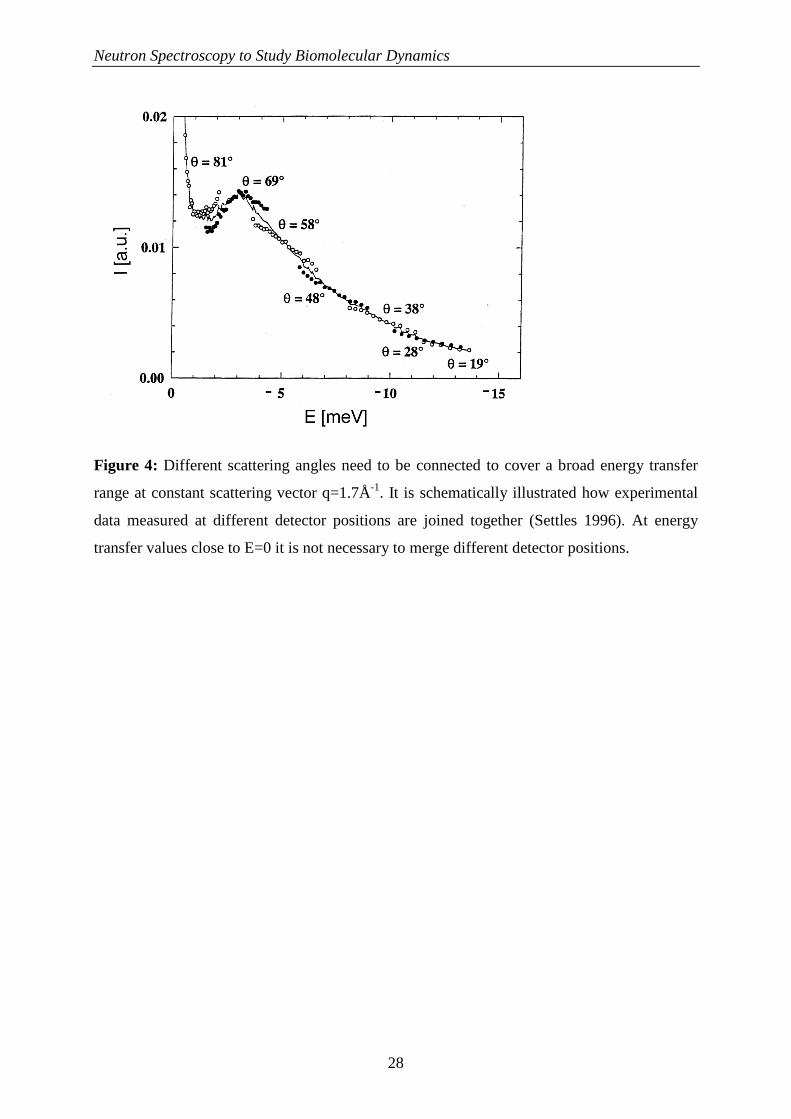
If the incident neutrons have a fixed kinetic energy and neutron scattering shall be measured
at constant scattering vector q as a function of energy transfer E, then the scattering angle
value of the detector position has to be varied according to equation ( 3.9 ) (see Figure 3).
Neutron Spectroscopy to Study Biomolecular Dynamics
28
Figure 4: Different scattering angles need to be connected to cover a broad energy transfer
range at constant scattering vector q=1.7Å-1. It is schematically illustrated how experimental
data measured at different detector positions are joined together (Settles 1996). At energy
transfer values close to E=0 it is not necessary to merge different detector positions.

Neutron Spectroscopy to Study Biomolecular Dynamics
29
3.4 Elements of Neutron Scattering Theory
A neutron scattering experiment with angular and energy resolution measures the double
differential scattering cross section dEd
d2
Ωσ
, which is the number of neutrons that are scattered
per second into the solid angle dΩ in the direction of the scattering vector 'kr
with an energy
in the interval between E and E+dE, normalised by the incident neutron flux Φ.
The incident neutron wave can be written as a plane wave with
rkierrrr =)(ψ ( 3.10 )
The scattered neutron wave )(' rrψ can be written at sufficient large distance as a sum of the
transmitted wave and a spherical wave multiplied with the scattering amplitude ( )Ωf
( )Ω+= fr
eer
rkirki
rr
rrr'
)('ψ . ( 3.11 )
The neutron interacts with the sample via nuclear and magnetic forces. The nuclear interaction
depends on the element, the isotope and the orientation of the spin of the neutron and the spin
of the nucleus of the sample.
The magnetic interaction is neglected in the following and only the nuclear interaction is
further considered. The wave length of thermal neutrons is in the order of some 10-10 m, the
diameter of the nucleus of an atom is around 10-15 m which is much smaller than the neutron
wave length. The phenomenological assumption of a point like interaction potential (Fermi
pseudo potential) has been proven to be very successful in the theory of neutron scattering.
However, this assumption is only valid to describe scattering of cold and thermal neutrons and
fails completely for high energy neutrons.
The Fermi pseudo potential has the form
Neutron Spectroscopy to Study Biomolecular Dynamics
30
( )Rrbm
rVn
rrhr −⋅⋅= δπ 22)( ,
( 3.12 )
with the scattering length b that is a complex number. The real part of b describes the
scattering strength, the imaginary part of b the absorption.
The further evaluations of the double differential scattering cross section take into account the
Fermi pseudo potential and the so called Born approximation that is a first order
approximation of the scattering process. Only single scattering is considered. The double
differential scattering cross section finally can be written as
[ ] [ ] dte)t(rqiexp)0(rqiexpbbk
'k
2
1
dEd
d ti
'j,j'jj'jj
2ω
πσ −
+∞
∞−
>−<=Ω ∑ ∫
rrrr
h.
( 3.13 )
The indices j and j’ account for the atoms in the sample. The scattering length bj depends on
the element, the isotope and the orientation of the spins. The position of the atom j at time t=0
is )0(jrr
; its position is )(tr jr
at time t.
The sum in equation ( 3.13 ) can be split into two parts,
[ ] [ ]
[ ] [ ] dtetrqirqibk
k
dtetrqirqibk
k
dEd
d
ti
jjjinc
ti
jjjjcoh
ω
ω
π
πσ
−∞+
∞−
<
−+∞
∞−
<
>−
+>−=Ω
∑ ∫
∑ ∫
)(exp)0(exp'
2
1
)(exp)0(exp'
2
1
2
','
22
rrrr
h
rrrr
h
,
( 3.14 )
with the so called coherent scattering length bcoh
22coh bb = , ( 3.15 )
and the so called incoherent scattering length binc

Neutron Spectroscopy to Study Biomolecular Dynamics
31
222inc bbb −= . ( 3.16 )
The coherent scattering length is the average scattering length of the element. The incoherent
scattering length is the standard deviation from the average.
The first term in equation ( 3.13 ) is called coherent scattering, while the second term is the
incoherent scattering. The double sum in the first term of equation ( 3.14 ) contains cross
terms of the different atoms j and j’ ; the second term only contains the self term and runs over
the different atom as a single sum of j. The double differential scattering cross section can be
written shortly as
inccoh dEd
d
dEd
d
dEd
d
Ω+
Ω=
Ωσσσ 222
. ( 3.17 )
Coherently scattered neutrons from different nuclei can interfere with each other. These
interferences contain both information of structure and collective excitations of the sample.
An ideal system would give purely coherent scattering if all atoms in the sample of the same
element have the average scattering length of the element <b> and do not deviate from the
average. Deviation from the average occurs, for example, with variation in the spin state of
the nuclei.
Incoherent scattering contains information about the dynamics of the individual atoms. It can
be interpreted as a superposition of neutron waves that were scattered from the same nucleus
at different times. The time range is determined by the energy resolution of the instrument.
The physical reason for the existence of incoherent scattering is the random distribution of
scattering nuclei that have a deviation from the average scattering length <b> .
Scattering cross sections incσ , cohσ and scattering lengths binc, bcoh are connected by the
relations:
24 incinc bπσ = , ( 3.18 )

Neutron Spectroscopy to Study Biomolecular Dynamics
32
24 cohcoh bπσ = . ( 3.19 )
The incoherent scattering cross section of hydrogen is the largest of all elements that usually
occur in biological matter (see Table 3). The reason for this behaviour is that the scattering
length for different spin orientations between the neutron and the proton spin differs rather
strongly. Incoherent scattering of natural abundance proteins is dominated by hydrogen
atoms. The incoherent scattering cross section of hydrogen is around 40 times larger than that
of deuterium. Therefore, hydrogen/ deuterium labelling is made possible. Scattering of natural
abundance proteins in D2O solvent is dominated by the protein signal, whereas scattering of
deuterated proteins hydrated with H2O allows to focus on the signal of the solvent. The unit of
the scattering cross section is the barn with 1 barn = 10-24 cm2.
Table 3: Coherent and incoherent scattering cross sections for elements occurring in
biological systems (Sears 1992).
Element σσσσcoh [barn] σσσσinc [barn]
H 1.7568 80.26
D 5.592 2.05
C 5.551 0.001
N 11.01 0.5
O 4.232 0.0008
P 3.307 0.005
S 1.0186 0.007
Fe 11.22 0.4

Neutron Spectroscopy to Study Biomolecular Dynamics
33
3.5 Connecting Theory with Experiments
The Van Hove pair correlation function describes the microscopic structure and dynamics of
the sample (Van Hove 1954). Van Hove showed mathematically in his article how the
theoretical pair correlation function can be related to measurable neutron scattering quantities.
The work paved the ground for all the models on microscopic motion that came afterwards.
The pair correlation function is defined as
[ ]∑ −+=N
jjjj trrr
NtrG
',' )()0(
1),(
rrrr δ . ( 3.20 )
The pair correlation function contains the probability to find a scattering particle at time t at
the position )(trr
, when it was at time t=0 at the position )0(rr
. N is the number of atoms.
The self term of the pair correlation function is
[ ]∑ −+=N
jjjs )t(r)0(rr
N
1)t,r(G
rrrr δ . ( 3.21 )
The intermediate scattering function
),(),(),( tqItqItqI inccoh
rrr += ( 3.22 )
is obtained by a space Fourier transformation of the Van Hove pair correlation function. The
incoherent part of the intermediary scattering function ),( tqI inc
r is related with the self-term
)t,r(Gsr
. The coherent part ),( tqI coh
r is connected with the pair correlation function )t,r(G
r:
[ ] [ ]∑∫ −== −
'j,j'jj
rqicoh )t(rqiexp)0(rqiexp
N
1rde)t,r(G)t,q(I
rrrrrrr rr
( 3.23 )
Neutron Spectroscopy to Study Biomolecular Dynamics
34
[ ] [ ]∑∫ −== −
jjj
rqisinc )t(rqiexp)0(rqiexp
N
1rde)t,r(G)t,q(I
rrrrrrr rr
. ( 3.24 )
The intermediary scattering functions can be calculated nowadays from molecular dynamics
simulations. Measured neutron data can be compared to these simulations and molecular
events that are responsible for the measured processes can be eventually identified.
The scattering function ),( ωqSr
in energy space is obtained by a time Fourier transformation
of the intermediate scattering function
∫ −= dtetqIqS tiω
πω ),(
2
1),(
rr. ( 3.25 )
The scattering function ),( ωqSr
can also be divided into a coherent part and an incoherent part
),q(S),q(S),q(S inccoh ωωω rrr+= . ( 3.26 )
The experimentally accessible double differential scattering cross section is connected to the
scattering function with
incinc
cohcoh qS
k
kNqS
k
kN
dEd
d),(
'
4),(
'
4
2
ωπ
σωπ
σσ +=Ω
. ( 3.27 )
Measured incoherent neutron scattering data in the form of incdEd
d
Ωσ2
can be corrected with
computer programs for the term k
k' and the scattering function incqS ),( ω is containing
information about the dynamics of the sample.

Neutron Spectroscopy to Study Biomolecular Dynamics
35
3.6. Elastic and Quasielastic Incoherent Neutron Scattering
Energy resolved incoherent neutron scattering allows the study of molecular motions in the
order of picoseconds to nanoseconds. The observable time range is determined by the energy
resolution of the spectrometer. The detectable length scale of the motion is in the range of
some Ångstrom and is given by the scattering vector range of the instrument. Energy and time
ranges of molecular motions that can be detected by neutron spectroscopy are given and
compared to other experimental techniques in Figure 5. Incoherent neutron scattering data of
biomolecules or water informs about the dynamics of hydrogen atoms as their scattering cross
section is much larger than all other elements that usually occur in biological matter.
Hydrogen atoms are uniformly distributed in proteins and around every second atom of a
protein is a hydrogen atom. Therefore, average protein dynamics can be detected with
incoherent neutron scattering experiments.
Figure 5: The covered energy and time range that can be covered with inelastic neutron
scattering is compared with other various experimental methods. Chopper, multi chopper,
backscattering and spin echo neutron spectrometers are different instrumental techniques that
allow increasing energy resolution (http://neutron.neutron-eu.net/n_nmi3 2008).
Neutron Spectroscopy to Study Biomolecular Dynamics
36
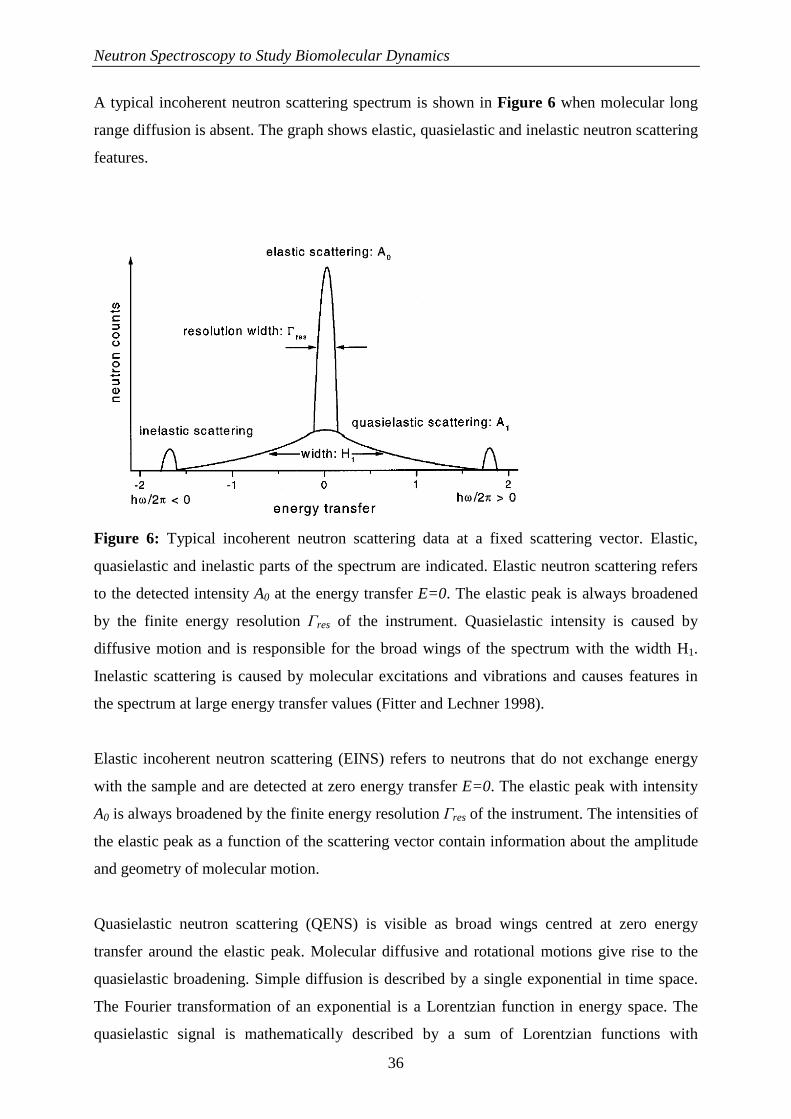
A typical incoherent neutron scattering spectrum is shown in Figure 6 when molecular long
range diffusion is absent. The graph shows elastic, quasielastic and inelastic neutron scattering
features.
Figure 6: Typical incoherent neutron scattering data at a fixed scattering vector. Elastic,
quasielastic and inelastic parts of the spectrum are indicated. Elastic neutron scattering refers
to the detected intensity A0 at the energy transfer E=0. The elastic peak is always broadened
by the finite energy resolution Γres of the instrument. Quasielastic intensity is caused by
diffusive motion and is responsible for the broad wings of the spectrum with the width H1.
Inelastic scattering is caused by molecular excitations and vibrations and causes features in
the spectrum at large energy transfer values (Fitter and Lechner 1998).
Elastic incoherent neutron scattering (EINS) refers to neutrons that do not exchange energy
with the sample and are detected at zero energy transfer E=0. The elastic peak with intensity
A0 is always broadened by the finite energy resolution Γres of the instrument. The intensities of
the elastic peak as a function of the scattering vector contain information about the amplitude
and geometry of molecular motion.
Quasielastic neutron scattering (QENS) is visible as broad wings centred at zero energy
transfer around the elastic peak. Molecular diffusive and rotational motions give rise to the
quasielastic broadening. Simple diffusion is described by a single exponential in time space.
The Fourier transformation of an exponential is a Lorentzian function in energy space. The
quasielastic signal is mathematically described by a sum of Lorentzian functions with

Neutron Spectroscopy to Study Biomolecular Dynamics
37
characteristic intensities and half-widths at half-maximum (HWHM) Γ. Microscopic model
are employed to analyse the HWHM. Within the framework of the models diffusion
coefficients D, residence times τ and correlation times Γ= /1cτ can be determined. The
measured energy transfer range of QENS spectra depends strongly on both the energy
resolution and the instrumental properties of the neutron spectrometer. Approximately, on a
time-of-flight instrument with an energy resolution of ~100µeV the energy transfer range used
for QENS is in between around -1.5meV and +1.5meV.
Molecular excitations cause inelastic neutron scattering at high values of the energy transfer
|E|. The typical measured energy transfer range of inelastic neutron scattering is in between
~1 and 200meV.
In this work we focus only on elastic and quasielastic neutron scattering.
The theoretical scattering function for elastic and quasielastic neutron scattering can be
written as (Bee 1988)
( ) ( )
⋅+⋅⋅= ∑><− ωωδω nn
nqx
theo LqAqAeqS )()()(, 0
22
( 3.28 )
The delta function )(ωδ needs to be taken into account if there are motions in confinement,
or if the dynamics are much slower than the resolution of the instrument. The factor )(0 qA is
called Elastic Incoherent Structure Factor (EISF) and contains information about the
amplitude and geometry of motions. The quasielastic component is described by a sum of
Lorentzians )(ωnL with the Quasielastic Incoherent Structure Factors )(qAn . Faster
vibrational motions are contained in the Debye-Waller factor 22 qxe ><− , with <x2> the mean
square displacement of fast vibrational motions.
In the presence of long range translational diffusion the theoretical scattering function needs
to be extended. It is commonly assumed in literature that long-range translational diffusion
and internal motions are independent of each other, as it facilitates data analysis. This might
not necessarily be the case for all systems and is then only an approximation. The presence of

Neutron Spectroscopy to Study Biomolecular Dynamics
38
long range translational diffusion then leads to a convolution of equation ( 3.28 ) with the
scattering function for long-range translational diffusion ( )ω,qSTD
( ) ( ) ( ) ( )
⊗
⋅+⋅⋅= ∑><− ωωωω ,)(,)(, 0
22
qSLqAqSqAeqS TDnn
nTDqx
theo . ( 3.29 )
When there is a fraction p of hydrogen atoms that appear immobile within the resolution of
the spectrometer, the EISF can be written as
)(')1()( 00 qAppqA ⋅−+= , ( 3.30 )
with )('0 qA the EISF for the dynamics of the hydrogen atoms that appear mobile.
The measured QENS data are then fitted with the theoretical scattering function ( )ω,qStheo
that is convoluted with the instrumental energy resolution ( )ω,qSres as
( ) ( )[ ] ( )ωωω ,,, qSBqSqS restheomeas ⊗+= , ( 3.31 )
where B is a linear function that accounts for background contribution.
3.7 Instruments Used for Incoherent Neutron Spectroscopy
All neutron spectrometers need to measure the intensity of scattered neutrons by the sample as
a function of energy transfer E and scattering vector q. Two experimental techniques, time-of-
flight spectroscopy and backscattering spectroscopy, were used in this work to measure
elastic and quasielastic incoherent neutron scattering. Three axis neutron spectrometers are
widely used in condensed matter physics for the study of collective excitations in single
crystals. The highest energy resolution is reached with neutron spin echo spectrometers and
slow relaxation times up to 200 ns can be detected with current instruments. A neutron spin
echo spectrometer at the American spallation source SNS is in construction which is planned
to detect relaxation times up to 1 µs.

Neutron Spectroscopy to Study Biomolecular Dynamics
39
At reactor sources a monochromatic neutron beam needs to be extracted by the primary
spectrometer from the polychromatic neutron beam coming from the reactor. In the case of
crystal time-of-flight and backscattering spectrometers this is achieved with a single crystal
using Bragg reflections. After the single crystal the monochromatic beam is then cut into
neutron pulses with a rotating chopper. Multi chopper time-of-flight instruments use a set of
counter rotating chopper discs to prepare a monochromatic and pulsed neutron beam. The
prepared monochromatic neutron beam has a certain energy bandwidth given by ∆E. At
spallation sources the time structure of the incident neutron beam allows the use of a
polychromatic beam for measurements. The neutrons then interact with the sample contained
in the sample holder, located inside of a cryostat for temperature control.
Time-of-flight instruments contain a large neutron detector bank of up to 400 detectors that
are placed at a certain distance, radially around the sample. The large number of detectors
allows a simultaneous measurement of scattered neutrons over a large solid angle. Time-of-
flight spectrometers are therefore efficient for a rapid mapping of a large scattering vector
range. A pulsed beam of neutrons arrives at the sample. Neutron scattering in the detector
bank is then measured as a function of time. Neutrons that gain energy from the sample will
be faster and arrive first at the detectors. Elastically scattered neutrons without energy
exchange arrive afterwards and neutrons that deposit part of their kinetic energy in the sample
arrive latest. The time resolution of these instruments is determined by the energy bandwidth
∆E of the prepared neutron beam. Typically, crystal time-of-flight instruments operate at
energy resolutions between around 50 to 200 µeV (FWHM). Multi-Chopper time-of-flight
spectrometers can be set to a nearly continuous energy resolution between around 5 µeV and
5 meV (FWHM).
Backscattering spectrometers reach a high energy resolution by the principle of Bragg
reflection. If a neutron beam is reflected by a crystal in a geometry close to 90° the reflected
beam has a very small energy dispersion. Neutrons are scattered by the sample in the direction
of analyzer plates. The analyzer plates reflect and focus the neutrons under nearly
backscattering conditions into neutron detectors. In this way typical energy resolutions
between 0.9 and 8 µeV are reached at reactor sources. Due to the small energy bandwidth,
neutron backscattering has always lower counting statistics than time-of-flight spectroscopy.
To compensate at least partially this effect neutron analyser plates need to cover large solid
angles at the expense of scattering vector resolution. At spallation sources, the so called

Neutron Spectroscopy to Study Biomolecular Dynamics
40
inverse backscattering spectrometers are used. This class of instruments utilizes a
polychromatic neutron beam and the time structure given by the spallation source. Higher
counting rates are possible at the expense of energy resolution.
Table 4: Time-of-flight and backscattering spectrometers at the institutes ILL, ISIS, PSI and
FRM-II used in this work. Given is the incident wavelength, the instrumental energy
resolution, the corresponding time resolution and the covered scattering vector range.
Instrument λ [Å] ∆E [µeV] ∆t [ps] q [Å -1]
IN13, ILL 2.23 8 ~100 0.2-5.0
IRIS, ISIS ~5 17 ~40 0.3-1.8
FOCUS, PSI 6 50 ~13 0.4-1.6
TOFTOF, FRM-II 5.1 100 ~7 0.4-2.0
The characteristic properties of neutron spectrometers that were used in this work are given in
Table 4.
In an incoherent neutron experiment the sample inside the aluminium sample holder and the
empty sample holder need to be measured. To obtain only the scattered intensities of the
sample, the empty sample holder has to be correctly subtracted. The neutron detectors are
calibrated by a reference scatterer. In the case of hydrated powder samples this can be done
with the sample itself at low temperature where molecular motions are strongly reduced
(usually between 10 to 20 K). If the sample contains larger amounts of water which can form
ice at low temperatures or if the sample is sensitive to freezing then vanadium is used as a
reference. The coherent scattering cross section of vanadium is around 300 times smaller than
the incoherent scattering cross section (Sears 1992). Quasielastic line broadening is absent and
the inelastic signal due to phonon excitations is small compared to the elastic signal. The
Debye-Waller factor of vanadium is large; therefore vanadium gives a purely incoherent and
isotropic signal that can be used for neutron detector calibration.
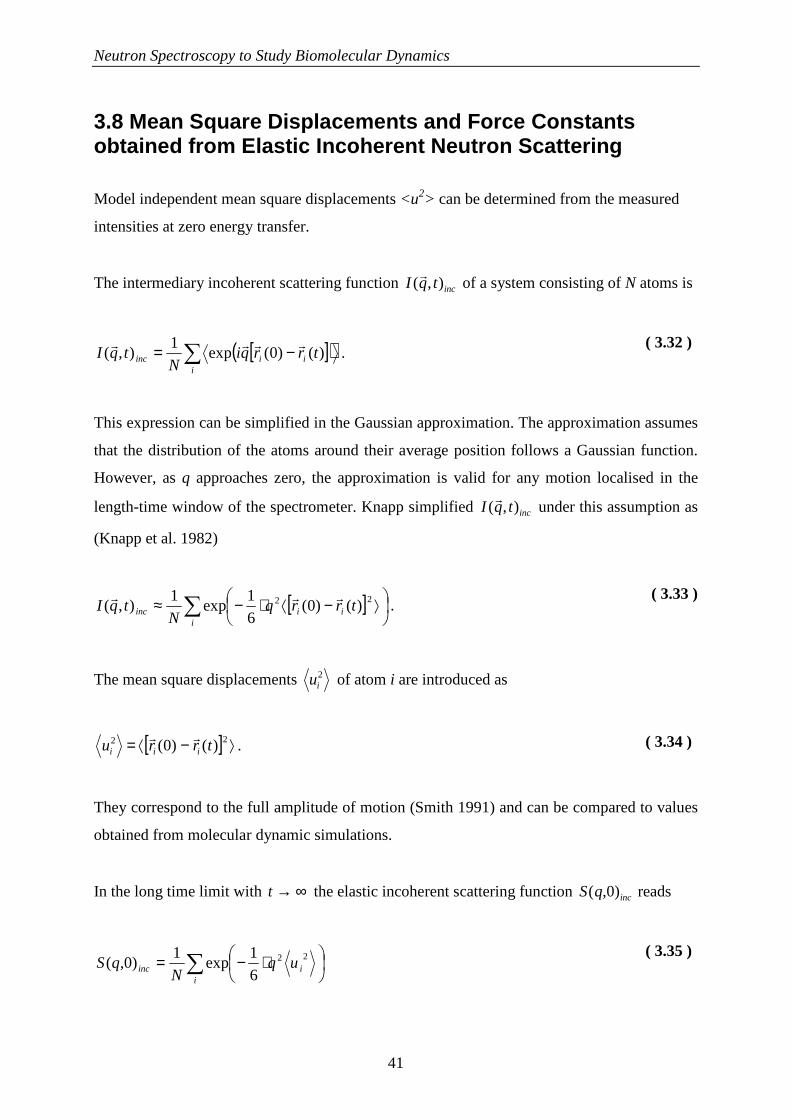
Neutron Spectroscopy to Study Biomolecular Dynamics
41
3.8 Mean Square Displacements and Force Constants obtained from Elastic Incoherent Neutron Scattering
Model independent mean square displacements <u2> can be determined from the measured
intensities at zero energy transfer.
The intermediary incoherent scattering function inctqI ),(r
of a system consisting of N atoms is
[ ]( )∑ −=i
iiinc trrqiN
tqI )()0(exp1
),(rrrr
. ( 3.32 )
This expression can be simplified in the Gaussian approximation. The approximation assumes
that the distribution of the atoms around their average position follows a Gaussian function.
However, as q approaches zero, the approximation is valid for any motion localised in the
length-time window of the spectrometer. Knapp simplified inctqI ),(r
under this assumption as
(Knapp et al. 1982)
[ ]∑
⟩−⟨⋅−≈
iiiinc trrq
NtqI 22 )()0(
6
1exp
1),(
rrr.
( 3.33 )
The mean square displacements 2iu of atom i are introduced as
[ ] ⟩−⟨= 22 )()0( trru iii
rr. ( 3.34 )
They correspond to the full amplitude of motion (Smith 1991) and can be compared to values
obtained from molecular dynamic simulations.
In the long time limit with ∞→t the elastic incoherent scattering function incqS )0,( reads
⋅−= ∑ 22
6
1exp
1)0,( i
iinc uq
NqS
( 3.35 )

Neutron Spectroscopy to Study Biomolecular Dynamics
42
and the average mean square displacement can be obtained from the slope of the logarithm of
the scattered intensities versus q2 according to
22 )0,(ln6
q
qSu
∆∆⋅−= .
( 3.36 )
This approach is formally similar to the Guinier approximation in small angle scattering
experiments (Guinier and Fournet 1955). The approximation is strictly valid for 02 →q but
holds up to 2~22 qu ⋅ (Réat et al. 1997).
A neutron scattering instrument always has a finite energy resolution ∆E and a corresponding
time resolution of E
t∆
=∆ h; a certain scattering vector range is covered by the instrument.
Only motions that are in the accessible length scale given by the scattering vector range and
the time resolution of the instrument can be detected. Therefore, mean square displacements
<u2> depend on the kind of neutron spectrometer used.
Mean square displacements are often measured as a function of temperature in so called
elastic scans on backscattering instruments with high energy resolution. The measured
intensities at zero energy transfer are rather large, thus elastic scans rapidly allow a
determination of the molecular dynamics as a function of temperature. As an example,
Figure 7 shows the measured mean square displacements of purple membrane in the dry and
hydrated state.

Neutron Spectroscopy to Study Biomolecular Dynamics
43
Figure 7: Hydrogen mean square displacements <u2> of purple membrane in dry () and
hydrated state () in the length and time scale given by the instrumental scattering vector
range (see inset) and energy resolution. Water content in hydrated state was 0.55 D2O/ g dry
membrane (Ferrand et al. 1993). Data was measured on the backscattering instrument IN13 at
ILL and was analysed within the Gaussian approximation according to equation ( 3.35 ). The
inset shows measured intensities as a function of q2 at different temperatures.
A mean effective force constant <k’> can be obtained from the dependence of the <u2> as
function of temperature (Zaccai 2000). The force constant is defined as
dTud
k><
>=< 2
00276.0,
( 3.37 )
the values are chosen in such a way that <k> is in N/m when <u2> is in Å2 and T in Kelvin.

Neutron Spectroscopy to Study Biomolecular Dynamics
44
3.9 Models for Quasielastic Neutron Scattering
Quasielastic incoherent neutron scattering allows a precise determination of molecular
dynamics. The geometry of motions can be extracted from the EISF. The half-widths at half-
maximum (HWHM) of the quasielastic components contain information about diffusion
coefficients and residence times. The dependence of the HWHM as a function of the
scattering vector contains information on the nature of diffusive dynamics. Microscopic
models are needed to interpret QENS data. In the following the common models that were
used in this work are presented.
3.9.1 Long Range Translational Diffusion
The scattering function for continuous translational diffusion can be written as a simple
Lorentzian with (Bee 1988)
( ) ( )222
21,
Dq
DqqSTD
+⋅=ωπ
ω ( 3.38 )
( )ω,qSTD was already introduced in equation ( 3.29 ).
The HWHM intercept zero for 02 →q and have the typical form of ( ) 2Dqq =Γ with the
translational diffusion coefficient D.
Singwi and Sjölander (Singwi and Sjölander 1960) developed a model for translational jump-
diffusion of liquid water. In this model a molecule performs oscillatory motion around its
equilibrium position for a time τ0. After that it diffuses for a time τ1 by continuous diffusion.
This process is then repeated. The scattering function can be evaluated in two limiting cases:
when the time of continuous diffusion is much longer than the time of oscillatory motion
τ1>>τ0, the scattering function is identical to that of continuous translational diffusion given in
equation ( 3.38 ). The second case is when the time of oscillatory motion is much longer than
the time of continuous diffusion τ1<<τ0. Then the scattering function can be described by a
single Lorentzian with the HWHM ( )qΓ and the Debye-Waller factor exp(-2W) as

Neutron Spectroscopy to Study Biomolecular Dynamics
45
( ) ( )
+−−=Γ
02
0 1
2exp1
1
ττ Dq
Wq .
( 3.39 )
When the amplitude of molecular vibrations are small compared to the diffusive steps
fulfilling the condition 022 τDqW << , then the HWHM can be simplified to
( )0
2
2
1 τDq
Dqq
+=Γ .
( 3.40 )
Characteristic properties of the HWHM are to intersect zero for 02 →q and to follow
2)( Dqq =Γ for very small q2-values. At large q2-values they tend to the asymptotic value of
0/1 τ=Γ∞ .
Teixeira measured the dynamics of water with QENS (Teixeira et al. 1985). Rotational and
translational diffusive motions of the water molecules could be separated. The translational
component could be described to high accuracy with the jump-diffusion model of Singwi and
Sjölander. The measured HWHM in Figure 8 nicely show the 2)( Dqq =Γ law at small
scattering vectors and the plateau 0/1 τ=Γ∞ at large q2 especially for low temperatures.

Neutron Spectroscopy to Study Biomolecular Dynamics
46
Figure 8: Half-widths at half-maximum (HWHM) of translational diffusion of liquid water as
a function of q2 at different temperatures (Teixeira et al. 1985). Solid lines are fits with the
model of jump diffusion. At low q2-value the 2)( Dqq =Γ law is indicated, at high scattering
values q2 the plateau 0/1 τ=Γ∞ is reached, being especially visible at low temperatures.
3.9.2 Rotational Diffusion
The formalism of Sears (Sears 1966) is often used to describe molecular rotational diffusion.
The scattering function of the model is a sum of one delta function and several Lorentzians
( ) ( ) ( ) ∑∞
= Γ+Γ
⋅+⋅=1
2,
2
,0
1,
l lrot
lrotlAqAqS
ωπωδω .
( 3.41 )
The prefactors are given by ( ) ( )qrjlA ll212 ⋅+= , j l are the first order spherical Bessel
functios of l th kind. The HWHM are ( ) rotlrot Dll ⋅+⋅=Γ 1, with the rotational diffusion
coefficient Drot.

Neutron Spectroscopy to Study Biomolecular Dynamics
47
The characteristic feature of rotational diffusion is that the HWHM of the quasielastic
intensities are independent of the scattering vector and have constant line-width rotΓ . The
correlation time of rotational motion can be obtained as rotcor Γ= /1τ .
For the description of rotational diffusion of liquid water often only the first two Lorentzians
are taken into account with prefactors An(q) taken from the Sears model (Teixeira et al. 1985).
In a simplified approach QENS data of water can also be approximated by only one
Lorentzian for the rotational diffusion (Tehei et al. 2007).
3.9.3 Diffusion within Confined Space
A model for continuous diffusion in a sphere with impermeable boundaries was developed by
Volino and Dianoux (Volino and Dianoux 1980). It is rather useful in the investigation of
protein dynamics with QENS as it gives analytical expressions for the measured EISF.
The scattering function of this model reads as
( ) ( ) ( ) ( ) ( )22)0,0(),(
00
112)(,
D
DqAlqAqS
nl
nl
nl
ln
λωλ
πωδω
+⋅⋅++⋅= ∑
≠
( 3.42 )
The nlλ are eigenvalues of a differential equation defined in the article by Volino and
Dianoux. In their work (Volino and Dianoux 1980) the first 99 values of nlλ were calculated
numerically. The values of ( )qAln can then be calculated from n
lλ .
It is important to note that the EISF has got an analytical solution with
( ) ( ) 2
100
3
=qr
qrjqA ,
( 3.43 )
where j1 is the first order spherical Bessel function of first kind and r is the sphere radius. The
value of r can be deduced easily from measured EISF.
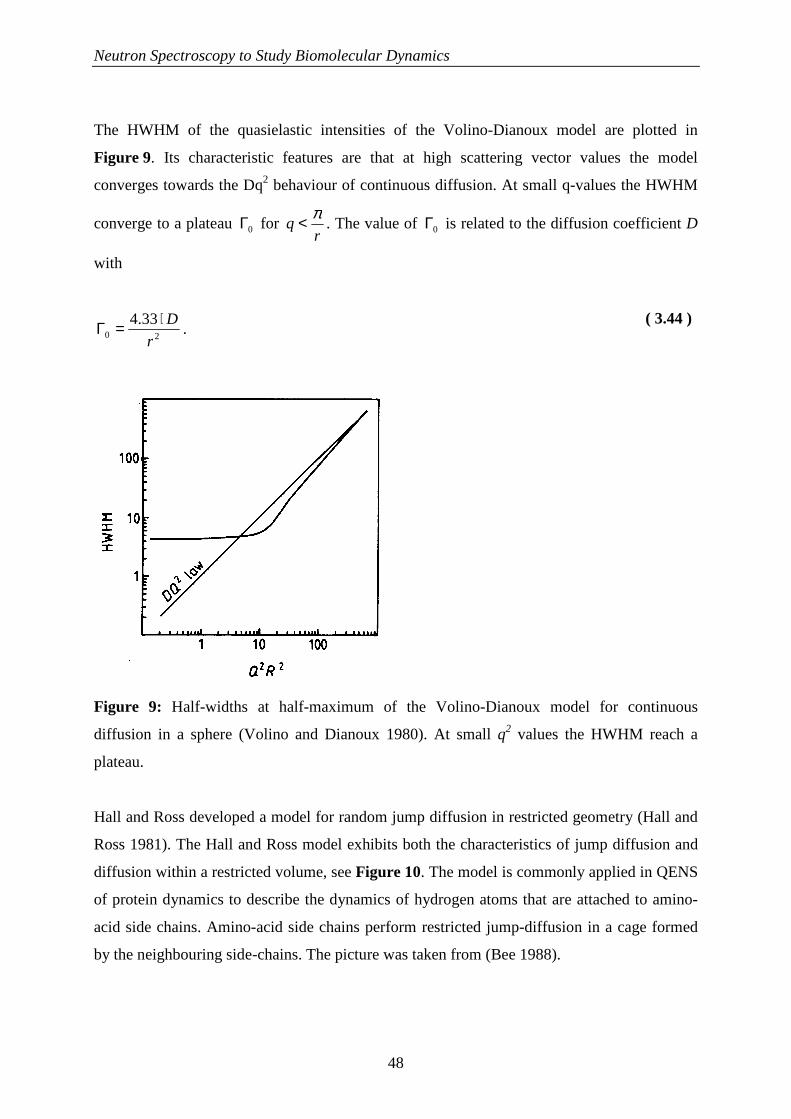
Neutron Spectroscopy to Study Biomolecular Dynamics
48
The HWHM of the quasielastic intensities of the Volino-Dianoux model are plotted in
Figure 9. Its characteristic features are that at high scattering vector values the model
converges towards the Dq2 behaviour of continuous diffusion. At small q-values the HWHM
converge to a plateau 0Γ for r
qπ< . The value of 0Γ is related to the diffusion coefficient D
with
20
33.4
r
D⋅=Γ . ( 3.44 )
Figure 9: Half-widths at half-maximum of the Volino-Dianoux model for continuous
diffusion in a sphere (Volino and Dianoux 1980). At small q2 values the HWHM reach a
plateau.
Hall and Ross developed a model for random jump diffusion in restricted geometry (Hall and
Ross 1981). The Hall and Ross model exhibits both the characteristics of jump diffusion and
diffusion within a restricted volume, see Figure 10. The model is commonly applied in QENS
of protein dynamics to describe the dynamics of hydrogen atoms that are attached to amino-
acid side chains. Amino-acid side chains perform restricted jump-diffusion in a cage formed
by the neighbouring side-chains. The picture was taken from (Bee 1988).
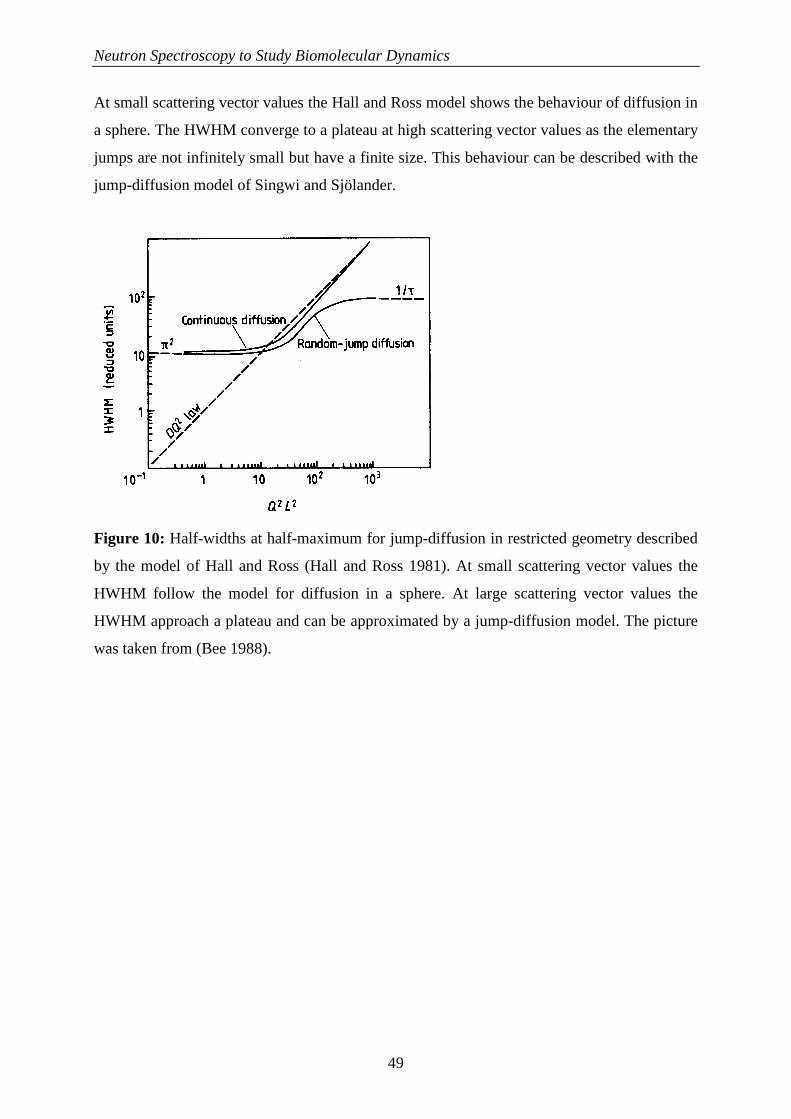
Neutron Spectroscopy to Study Biomolecular Dynamics
49
At small scattering vector values the Hall and Ross model shows the behaviour of diffusion in
a sphere. The HWHM converge to a plateau at high scattering vector values as the elementary
jumps are not infinitely small but have a finite size. This behaviour can be described with the
jump-diffusion model of Singwi and Sjölander.
Figure 10: Half-widths at half-maximum for jump-diffusion in restricted geometry described
by the model of Hall and Ross (Hall and Ross 1981). At small scattering vector values the
HWHM follow the model for diffusion in a sphere. At large scattering vector values the
HWHM approach a plateau and can be approximated by a jump-diffusion model. The picture
was taken from (Bee 1988).
Neutron Spectroscopy to Study Biomolecular Dynamics
50
3.10 References
Austin RH, Beeson KW, Eisenstein L, Frauenfelder H, Gunsalus IC (1975) Dynamics of
ligand binding to myoglobin. Biochemistry 14:5355-73
Bee M (1988) Quasielastic neutron scattering. Principles and Applications in Solid State
Chemistry, Biology and Materials Science. Adam Hilger, Bristol and Philadelphia
Bellissent-Funel MC, Zanotti JM, Chen SH (1996) Slow dynamics of water molecules on the
surface of a globular protein. Faraday Discuss. 103:281-294
Bicout DJ, Zaccai G (2001) Protein Flexibilty from the Dynamical Transition: A Force
Constant Analysis. Biophys. J. 80:1115-1123
Cornicchi E, Marconi M, Onori G, Paciaroni A (2006) Controlling the protein dynamical
transition with sugar-based bioprotectant matrices: a neutron scattering study. Biophys
J 91:289-97
Cusack S, Doster W (1990) Temperature dependence of the low frequency dynamics of
myoglobin. Measurement of the vibrational frequency distribution by inelastic neutron
scattering. Biophys J 58:243-51
Dellerue S, Bellissent-Funel MC (2000) Relaxational dynamics of water molecules at protein
surface. Chem. Phys. 258:315-325
Demmel F, Doster W, Petry W, Schulte A (1997) Vibrational frequency shifts as a probe of
hydrogen bonds: thermal expansion and glass transition of myoglobin in mixed
solvents. Eur Biophys J 26:327-35
Doster W (2008) The dynamical transition of proteins, concepts and misconceptions. Eur
Biophys J 37:591-602
Doster W, Bachleitner A, Dunau R, Hiebl M, Lüscher E (1986) Thermal properties of water in
myoglobin crystals and solutions at subzero temperatures. Biophys J 50:213-219
Doster W, Cusack S, Petry W (1989) Dynamical transition of myoglobin revealed by inelastic
neutron scattering. Nature 337:754-6
Doster W, Cusack S, Petry W (1990) Dynamic instability of liquidlike motions in a globular
protein observed by inelastic neutron scattering. Phys Rev Lett 65:1080-1083
Doster W, Settles M (2005) Protein-water displacement distributions. Biochim. Biophys. Acta
1749:173-186
Ellis RJ, Minton AP (2003) Join the crowd. Nature 425:27-28
Neutron Spectroscopy to Study Biomolecular Dynamics
51
Ferrand M, Dianoux AJ, Petry W, Zaccai G (1993) Thermal Motions and Function of
Bacteriorhodopsin in Purple Membranes - Effects of Temperature and Hydration
Studied by Neutron-Scattering. Proc. Natl. Acad. Sci. U.S.A. 90:9668-9672
Fitter J, Lechner RE (1998) Incoherent neutron scattering (INS), http://www.fz-
juelich.de/inb/inb-2/datapool/page/17/method.pdf
Frauenfelder H, Parak F, Young RD (1988) Conformational substates in proteins. Annu Rev
Biophys Biophys Chem 17:451-79
Frauenfelder H, Petsko GA, Tsernoglou D (1979) Temperature-dependent X-ray diffraction as
a probe of protein structural dynamics. Nature 280:558-63
Fraunfelder H, Sligar SG, Wolynes PG (1991) The energy landscapes and motions of
proteins. Science 254:1598-1603
Guinier A, Fournet G (1955) Small Angle Scattering of X-Rays. Wiley, New York
Hall PL, Ross DK (1981) Incoherent neutron scattering functions for random jump diffusion
in bounded and infinite media. Mol. Phys. 42:673-682
http://neutron.neutron-eu.net/n_nmi3 (2008) NMI3 - Integrated Infrastructure Initiative for
Neutron Scattering and Muon Spectroscopy
Jasnin M, Moulin M, Haertlein M, Zaccai G, Tehei M (2008) Down to atomic-scale
intracellular water dynamics. EMBO reports 9:543-547
Kendrew JC, Dickerson RE, Strandberg BE, Hart RG, Davies DR, Phillips DC, Shore VC
(1960) Structure of myoglobin: A three-dimensional Fourier synthesis at 2 A.
resolution. Nature 185:422-7
Knapp EW, Fischer SF, Parak F (1982) The influence of protein dynamics on Mössbauer
spectra. J. Chem. Phys. 78:4701-4711
Lichtenegger H, Doster W, Kleinert T, Birk A, Sepiol B, Vogl G (1999) Heme-solvent
coupling: a Mossbauer study of myoglobin in sucrose. Biophys J 76:414-22
Madern D, Ebel C, Zaccai G (2000) Halophilic adaptation of enzymes. Extremophiles 4:91-8
Makarov VA, Andrews BK, Smith PE, Pettitt BM (2000) Residence Times of Water
Molecules in the Hydration Sites of Myoglobin. Biophys. J. 79:2966-2974
Mampe W, Ageron P, Bates C, Pendlebury JM, Steyerl A (1989) Neutron lifetime measured
with stored ultracold neutrons. Phys. Rev. Lett. 63:593-596
McCammon JA, Harvey SC (1987) Dynamics of Proteins and Nuclear Acids
Cambridge University Press, Cambridge, UK
Parak F, Knapp EW, Kucheida D (1982) Protein dynamics. Mossbauer spectroscopy on
deoxymyoglobin crystals. J Mol Biol 161:177-94

Neutron Spectroscopy to Study Biomolecular Dynamics
52
Persson E, Halle B (2008) Cell water dynamics on multiple time scales. Proc. Natl. Acad.
Scie. U.S.A. 105:6266-6271
Reat V, Patzelt H, Ferrand M, Pfister C, Oesterhelt D, Zaccai G (1998) Dynamics of different
functional parts of bacteriorhodopsin: H-2H labeling and neutron scattering. Proc.
Natl. Acad. Sci. U.S.A. 95:4970-5
Réat V, Zaccai G, Ferrand M, Pfister C (1997) Functional dynamics in purple membranes
Biological Macromolecular Dynamics. Adenine Press, New York, pp 117-122
Richter D (2003) Properties of the Neutron - Elementary Scattering Processes, vol Matter and
Materials, Volume 15. Forschungszentrum Jülich
Roh JH, Curtis JE, Azzam S, Novikov VN, Peral I, Chowdhuri Z, Gregory RB, Sokolov AP
(2006) Influence of hydration on the dynamics of lysozyme. Biophys J 91:2573-88
Roh JH, Novikov VN, Gregory RB, Curtis JE, Chowdhuri Z, Sokolov AP (2005) Onsets of
anharmonicity in protein dynamics. Phys. Rev. Lett. 95:038101
Rupley JA, Careri G (1991) Protein hydration and function. Adv. Protein Chem. 41:37-172
Russo D, Murarka RK, Copley JRD, Head-Gordon T (2005) Molecular View of Water
Dynamics near Model Peptides. J. Phys. Chem. B 109:12966-12975
Sears VF (1966) THEORY OF COLD NEUTRON SCATTERING BY HOMONUCLEAR
DIATOMIC LIQUIDS: II. HINDERED ROTATION. Can. J. Phys. 44:1299-1311
Sears VF (1992) Neutron scattering lengths and cross sections. Neutron News 3:26-37
Settles M (1996) Die Zeitabhängigkeit und die Geometry der intramolekularen Dynamik
globulärer Proteine bis 100ps aus Neutronenstreudaten Physik Department E13, vol
Dissertation. Technische Universität München, Garching
Singwi KS, Sjölander A (1960) Diffusive Motions in Water and Cold Neutron Scattering.
Phys. Rev. 119:863-871
Smith JC (1991) Protein Dynamics - Comparison of Simulations with Inelastic Neutron-
Scattering Experiments. Q. Rev. Biophys. 24:227-291
Tarek M, Tobias DJ (2002) Role of Protein-Water Hydrogen Bond Dynamics in the Protein
Dynamical Transition. Phys. Rev. Lett. 88:138101
Tehei M, Franzetti B, Wood K, Gabel F, Fabiani E, Jasnin M, Zamponi M, Oesterhelt D,
Zaccai G, Ginzburg M, Ginzburg BZ (2007) Neutron scattering reveals extremely
slow cell water in a Dead Sea organism. Proc. Natl. Acad. Sci. U.S.A. 104:766-71
Tehei M, Madern D, Pfister C, Zaccai G (2001) Fast dynamics of halophilic malate
dehydrogenase and BSA measured by neutron scattering under various solvent
conditions influencing protein stability. Proc Natl Acad Sci U S A 98:14356-61

Neutron Spectroscopy to Study Biomolecular Dynamics
53
Tehei M, Zaccai G (2007) Adaptation to high temperatures through macromolecular dynamics
by neutron scattering. Febs J 274:4034-43
Teixeira J, Bellissentfunel MC, Chen SH, Dianoux AJ (1985) Experimental-Determination of
the Nature of Diffusive Motions of Water-Molecules at Low-Temperatures. Phys.
Rev. A 31:1913-1917
Tournier AL, Xu J, Smith JC (2003) Translational Hydration Water Dynamics Drives the
Protein Glass Transition. Biophys. J. 85:1871-1875
Van Hove L (1954) Correlations in Space and Time and Born Approximation Scattering in
Systems of Interacting Particles. Phys. Rev. 95:249-262
Volino F, Dianoux AJ (1980) Neutron Incoherent-Scattering Law for Diffusion in a Potential
of Spherical-Symmetry - General Formalism and Application to Diffusion inside a
Sphere. Mol. Phys. 41:271-279
Wood K, Grudinin S, Kessler B, Weik M, Johnson M, Kneller GR, Oesterhelt D, Zaccai G
(2008) Dynamical Heterogeneity of Specific Amino Acids in Bacteriorhodopsin. J.
Mol. Biol. 380:581-591
Wood K, Plazanet M, Gabel F, Kessler B, Oesterhelt D, Tobias DJ, Zaccai G, Weik M (2007)
Coupling of protein and hydration-water dynamics in biological membranes. Proc.
Natl. Acad. Sci. U.S.A. 104:18049-54
Zaccai G (2000) How soft is a protein? A protein dynamics force constant measured by
neutron scattering. Science. 288:1604-1607

Neutron Spectroscopy to Study Biomolecular Dynamics
54

Hemoglobin Dynamics in Red Blood Cells
55
4. Hemoglobin Dynamics in Red Blood Cells:
Correlation to Body Temperature
The technique of incoherent quasielastic neutron scattering was used to measure hemoglobin
dynamics in human red blood cells in the picosecond time and Ångstrom length scale. The
experiment allowed the separation between macromolecular centre of mass diffusion and internal
protein dynamics. Internal protein dynamics showed a more pronounced increase in protein
flexibility above body temperature than expected from normal temperature dependence. The
temperature behaviour was interpreted with partial unfolding of hemoglobin at body temperature.
The measured half-widths at small scattering vector values for global hemoglobin diffusion
showed typical signs for dynamics in confinement. This was interpreted that neighbouring
hemoglobin molecules form a cage structure in which the central protein is trapped on the
picosecond time scale. The rather large errors of the measured line-widths at large scattering
values did not allow an unambiguous decision if global hemoglobin diffusion is characterised by
translational or jump diffusion. The obtained diffusion coefficients for global translational centre
of mass diffusion were favourable compared to results of hydrodynamic theory that were
originally developed for colloidal particles.
The following chapter is based on an article published in Biophysical Journal. For the purpose of
continuity, the article is presented in the general layout of the manuscript.

Hemoglobin Dynamics in Red Blood Cells
56
Hemoglobin Dynamics in Red Blood Cells
57
Biophysical Journal, December 2008, 95: 5449–5461
Hemoglobin Dynamics in Red Blood Cells: Correlation
to Body Temperature
A. M. Stadler*†, I. Digel‡, G. M. Artmann‡, J. P. Embs§¶, G. Zaccai*, and G. Büldt†
*Institut Laue-Langevin, Grenoble, France; †Research Centre Juelich, Juelich, Germany;
‡Department of Cellular Engineering, Aachen University of Applied Sciences, Juelich, Germany;
§Laboratory for Neutron Scattering ETH Zurich & Paul Scherrer Institut, Villigen-PSI,
Switzerland;
¶Saarland University, Physical Chemistry, Saarbrücken, Germany
corresponding author: [email protected]
Keywords: neutron scattering - in vivo dynamics – hemoglobin - structural transition
temperature - internal molecular motions - self-diffusion
Hemoglobin Dynamics in Red Blood Cells
58
4.1 Abstract
A transition in hemoglobin behavior close to body temperature has been discovered recently by
micropipette aspiration experiments on single red blood cells (RBC) and circular dichroism
spectroscopy on hemoglobin solutions. The transition temperature was directly correlated to the
body temperature of a variety of species. In an exploration of the molecular basis of the
transition, we present neutron scattering measurements on the temperature dependence of
hemoglobin dynamics in whole human RBC, in vivo. The data revealed a change in the geometry
of internal protein motions at 36.9 °C, at human body temperature. Above that temperature,
amino acid side-chain motions occupy bigger volumes than expected from normal temperature
dependence, indicating partial unfolding of the protein. Global protein diffusion in RBC was also
measured and compared favorably with theoretical predictions for short-time self-diffusion of
non-charged hard-sphere colloids. The results demonstrated that changes in molecular dynamics
in the picosecond time range and Ångstrom length scale might well be connected to a
macroscopic effect on whole red blood cells occurring at body temperature.
4.2 Introduction
The function of biological macromolecules depends not only on their structure but also on their
dynamics. Many functional properties of proteins cannot be completely understood from the
average protein structure as determined from X-ray crystallography or NMR. Reaction rates for
example are closely related to protein dynamics (Austin et al. 1975). Protein dynamics covers a
very large range of timescales, from fast electronic rearrangements in the femtosecond scale to
slow protein folding events in the order of seconds to minutes (Creighton 1992). Motions in the
pico- and nanosecond time scale are believed to act as a lubricant for much slower protein
dynamics in the millisecond time range (Brooks III C.L. 1988)
Below a dynamical transition temperature between 180 and 240K, atomic motions are
predominantly harmonic (Frauenfelder et al. 1988; Fraunfelder et al. 1991). In this state, the
Hemoglobin Dynamics in Red Blood Cells
59
atoms vibrate around their structural equilibrium positions. Above the dynamical transition
temperature at sufficient hydration, the mean-square displacements increase significantly because
of the contribution of internal anharmonic, diffusive motions. These diffusive motions may
contribute to the sampling of different so-called conformational substates on a complex energy
landscape (Frauenfelder et al. 1988; Fraunfelder et al. 1991). The forces that maintain biological
molecular structure and allow atomic motions are ‘weak’ because they are similar to thermal
energy at physiological temperatures (Brooks III C.L. 1988). The amplitudes of atomic motions
are a measure of the internal macromolecular flexibility because they correspond to the width of
the potential well in which atoms move (Zaccai 2000). In this picture, equilibrium protein
stabilization would correspond to the depth of the well (Tehei et al. 2001). The dependence of
mean square displacements on temperature has been interpreted in terms of an effective force
constant that was called resilience (Zaccai 2000), which is related to the shape of the well. Protein
thermal stability was supposed to be inversely correlated to protein flexibility (Tang and Dill
1998; Tsai et al. 2001), although this point is still largely debated (Fitter et al. 2001; Tehei et al.
2001). The dynamics of lysozyme has been studied with quasielastic neutron scattering during the
unfolding process (De Francesco et al. 2004), and it was concluded that compared to the folded
state, the unfolded state is characterized by significantly larger amplitudes of diffusive motion of
amino acid side-chains. Protein unfolding was therefore related to a loss of macromolecular
resilience.
There is considerable evidence that protein dynamics is strongly influenced by the local
environment and the level of hydration (Lehnert et al. 1998; Paciaroni et al. 2002; Perez et al.
1999; Tsai et al. 2001). Solvent molecules can act either as plasticizer or stabilizer by allowing or
preventing the protein groups to jump between conformational substates (Gregory 1995). Water,
which is the natural solvent of biomolecules, is a well known plasticizer. Pacciaroni et al.
(Paciaroni et al. 2002) could show that internal lysozyme dynamics gets activated when the
environment is altered from pure glycerol, which is a stabilizer, towards a plasticizer by
increasing the level of hydration.

Hemoglobin Dynamics in Red Blood Cells
60
The main natural environment of proteins is within the cell, and protein function necessarily is
adapted to these conditions. In bacteria and eukaryotic cells macromolecular interactions are
likely to be influenced by the high cellular protein concentration (Hall and Minton 2003; Minton
2001; Zimmerman and Minton 1993). This effect, called ‘crowding’, results from high volume
occupancy and steric hindrance of the protein molecules between each other. The free distance
between macromolecules in the cell is in the order of some Ångstroms (Krueger and Nossal
1988) and intercellular water is in close vicinity to the protein surfaces. There is much interest
and discussion about similarities and differences in structure and dynamics of cytoplasmic and
bulk water (Ball 2008). Little is still known on how protein dynamics is influenced by the
crowded cytoplasmic environment and the special properties of cellular water. Doster and
Longeville (Doster and Longeville 2007) have measured the global diffusion of hemoglobin in
red blood cells with neutron spin-echo spectroscopy. They found a reduced diffusion coefficient
of hemoglobin compared to dilute solution and attributed the reduction to direct interactions
between protein molecules and to hydrodynamic interactions with the solvent. The authors
deduced that hydrodynamic effects dominate macromolecular transport at high protein
concentration. In recent work, Jasnin et al. have investigated macromolecular and water dynamics
in Escherichia coli bacteria with quasielastic neutron scattering in a wide range of time scales
(Jasnin et al. 2008; Jasnin et al. 2008). An appreciable increase of internal molecular flexibility
as compared to fully hydrated protein powders was revealed. The authors concluded that
intracellular complexity influences protein dynamics which is necessary for biological activity.
The study of global and internal protein diffusive motions is of importance for a fundamental
understanding of macromolecular transport and functional protein internal flexibility in cells.
The fast trajectories in the pico- and nanosecond time scale can be directly accessed by molecular
dynamics simulations (McCammon 1987) and incoherent neutron scattering (Doster et al. 1989).
Incoherent neutron scattering has the advantage that the proteins under study are not limited to a
maximum molecular weight, samples do not have to be crystalline or even monodisperse.
Neutrons penetrate deeply in the sample without causing radiation damage which makes them an
ideal tool to probe radiation sensitive biological matter. The incoherent scattering cross section of
hydrogen atoms is one magnitude larger than all other elements which occur in biological
material. As hydrogen atoms are uniformly distributed in proteins, neutron scattering probes

Hemoglobin Dynamics in Red Blood Cells
61
average protein dynamics. Incoherent neutron scattering experiments have been performed on
hydrated protein powders (Doster et al. 1989; Reat et al. 1998; Zanotti et al. 1999), protein
solutions (Longeville et al. 2003; Perez et al. 1999; Russo et al. 2002) and even in-vivo on whole
cells (Doster and Longeville 2007; Jasnin et al. 2008; Tehei et al. 2004).
Hemoglobin is the main protein constituent of red blood cells (92% of dry weight). Its biological
function is to carry oxygen from the lungs to the tissues. The discovery of the structure of
hemoglobin by Max Perutz is one of the major breakthroughs in the history of molecular biology
(Perutz et al. 1960). The protein is a tetramer with a molecular weight of around 64 kDa. It
consists of two α-chains and two β-chains, each having 141 and 146 amino acid residues,
respectively. The α-chains contain seven and the β-chains eight helices (Perutz 1987). Every
chain carries one heme group in a pocket to which oxygen and several other small molecules can
bind reversible. The concentration of hemoglobin in the red blood cells is around 330 mg/ml
(Krueger and Nossal 1988) which corresponds to a volume fraction of 0.25. Recently it has
become clear that hemoglobin at higher concentration shows a variety of interesting effects.
Micropipette experiments with aspirated single human red blood cells showed a sudden passage
phenomenon of the cells which is very close to human body temperature. A drop in viscosity of
concentrated hemoglobin solutions at temperatures higher than the transition temperature was
found and it was hypothesized that protein aggregation is the cause for the cellular passage effect
and the drop in viscosity (Artmann et al. 1998). Additionally it was found that hemoglobin shows
a pronounced loss of its α-helical content at body temperature. Amazingly, the transition
temperatures were directly correlated to the body temperature of a big variety of species (Digel et
al. 2006; Zerlin et al. 2007). It was speculated that this reflects partial unfolding of the helical
structure and goes in hand with an increase in surface hydrophobicity which promotes protein
aggregation (Digel et al. 2006).
In the following we present an incoherent quasielastic neutron scattering study on the temperature
dependence of hemoglobin dynamics in whole red blood cells. The experiment was performed at
temperatures between 16.9 °C and 45.9 °C. Global and internal protein motions could be
separated. A change in the amplitudes of protein side-chain diffusion was found close to human
body temperature which was attributed to partial unfolding of hemoglobin.

Hemoglobin Dynamics in Red Blood Cells
62
4.3 Materials and Methods
4.3.1 Sample preparation
For neutron scattering experiments, samples of human venous blood from healthy adults were
drawn with tubes containing heparin to prevent blood coagulation. The blood samples were
suspended in HEPES buffer solution at pH=7.4 and 290 mOsm (137 mM NaCl, 4 mM KCl,
1.8 mM CaCl2, 0.8 mM Na2HPO4, 0.2 mM NaH2PO4, 0.7 mM MgSO4, 8.4 mM HEPES, 4 mM
NaOH). The cells were washed twice and collected by centrifugation at 560 rcf for 10 min. The
supernatant was removed together with the ‘buffy coat’ on top of the cells. The washed cells and
the successively used buffer solutions were then gassed with CO to increase the stability of
hemoglobin. The cells were resuspended in TRIS buffer (20 mM TRIS, 145 mM NaCl) at pH=5.5
and treated with neuraminidase (from Clostridium perfringens Type VI, purchased from Sigma-
Aldrich) to remove the glycocalyx matrix as described elsewhere (Elgsaeter and Branton 1974).
Afterwards the cells were washed in H2O HEPES buffer. To reduce the neutron scattering
contribution of the buffer, the cells were washed with D2O HEPES buffer (pD=7.4, 290 mOsm),
incubated for around 30 min and centrifuged at 560 rcf. The washing steps were repeated until the
level of H2O was estimated to be below 0.1 vol% assuming that the H2O-D2O exchange through
the cell membrane reaches a constant value in this time. No cell lysis was detected during the
preparation and the shape of the cells was checked with optical microscopy at the end. After a
final centrifugation step the cell pellet was sealed in a flat aluminum sample holder of 0.2 mm
thickness for the neutron scattering experiment. The scattering from the aluminum screws was
blocked using a cadmium mask. It was checked by weighting that there occurred no loss of
sample material during the experiment.
Hemoglobin samples for dynamic light scattering experiments were prepared from around 75 µl
of human red blood cells which were taken from the finger tip with a heparinized glass capillary.
We tried to perform the light scattering measurements in conditions that resemble the saline
environment in the red blood cell. Although the extracellular concentration of sodium is around
145 mM, the intercellular concentration is between 5 and 15 mM only. Inversely, the intracellular
Hemoglobin Dynamics in Red Blood Cells
63
concentration of potassium is around 140 mM and the extracellular concentration is around 5mM
(Alberts B. 2002). Therefore, we used potassium chloride instead of sodium chloride for the light
scattering experiments. The cell sample was washed as described above with buffer solution
(0.1M KCl, 61.3 mM K2HPO4, 5.33 mM KH2PO4, pH 7.4, 290-300 mOsm). The cells were then
hemolyzed in 200 µl distilled H2O and diluted with 800 µl buffer. The solution was centrifuged
twice at 20000 rcf to remove cytoskeleton and membrane parts. Oxy-hemoglobin solutions of
4.0 mg/ml, 1.2 mg/ml and 0.3 mg/ml were prepared and filtered twice using 0.25 µm
nitrocellulose filters into dust-free glass scintillation vials used for dynamic light scattering
experiments. The hemoglobin concentration was determined spectrophotometrically using
extinction coefficients of 13.8 at 541 nm and 128 at 405 nm for oxy-hemoglobin (Antonini and
Brunori 1970).
4.3.2 Neutron scattering experiments
The experiment was performed on the cold time-of-flight spectrometer FOCUS at the neutron
spallation source SINQ (Paul Scherrer Institut, Villigen, Switzerland). A detailed description of
the instrument can be found in (Janssen et al. 1997). The incident wavelength was set to 6 Å. The
q-dependent elastic energy resolution ranges from 41 µeV (full-width at half-maximum) at
q=0.5 Å-1 to 61 µeV at q=1.6 Å-1, as determined from a vanadium measurement. During the
experiment we could largely profit from the high neutron flux delivered by the liquid metal target
of the MEGAPIE project (Bauer et al. 2001). Samples were measured in the temperature range of
16.9°C to 45.9°C in which no hemolysis occurs. All samples, including the 1 mm thick vanadium
slab and empty sample holder, were oriented at 135° with respect to the incident neutron beam
direction. The measured time-of-flight spectra were corrected for empty cell scattering,
normalized to vanadium, transformed into energy transfer and scattering vector space and binned
into 12 groups with 0.5 Å-1 ≤ q ≤ 1.6 Å-1. The spectra were corrected with a detailed balance
factor. Data treatment was done using the DAVE package (http://www.ncnr.nist.gov/dave).
Multiple scattering was neglected as the transmission of all samples was between 0.9 and 0.95.

Hemoglobin Dynamics in Red Blood Cells
64
4.3.3 Data analysis
An exhaustive description of quasielastic neutron scattering can be found in Bée (Bee 1988). The
application to protein dynamics has been reviewed in Gabel et al. (Gabel et al. 2002) and Smith
(Smith 1991). In concentrated protein solutions both internal and global diffusive motions of the
proteins contribute to the measured signal. In the case that internal and global motions are
uncorrelated, the theoretical incoherent quasielastic scattering function can be written as (Bee
1988)
( ) ( ) ( )ωωω ,,,22
qSqSeqS IG
qx
theo ⊗⋅= −, ( 4.1 )
where the scattering function ( )ω,qSG corresponds to global protein motions, the scattering
function ( )ω,qSI to internal motions and 2x stands for the mean square vibrational
displacements. The scattering function for internal motions can be separated into an elastic and a
Lorentzian part
( ) ( ) ( ) ( )( ) ( )( )2200
11,
q
qqAqAqS
I
II Γ+
Γ⋅⋅−+⋅=ωπ
ωδω , ( 4.2 )
with ( )qA0 the elastic incoherent structure factor (EISF) that contains information about the
geometry of internal motions. Global protein motions are a combination of translational and
rotational diffusion. A recent work by Perez et al. (Perez et al. 1999) showed that the global
scattering function for proteins in solution can be approximated by a single Lorentzian
( ) ( )( )22
1,
q
qqS
G
GG Γ+
Γ⋅=ωπ
ω , ( 4.3 )
with the apparent diffusion coefficient 2qDappG ⋅=Γ . This study found that in the case of the
small protein lysozyme the value of Dapp is 1.27 times higher than free Brownian diffusion due to
the contribution of rotational motion. We followed the calculations given in (Perez et al. 1999)
for the bigger protein hemoglobin and found that the apparent diffusion coefficient is also 1.27
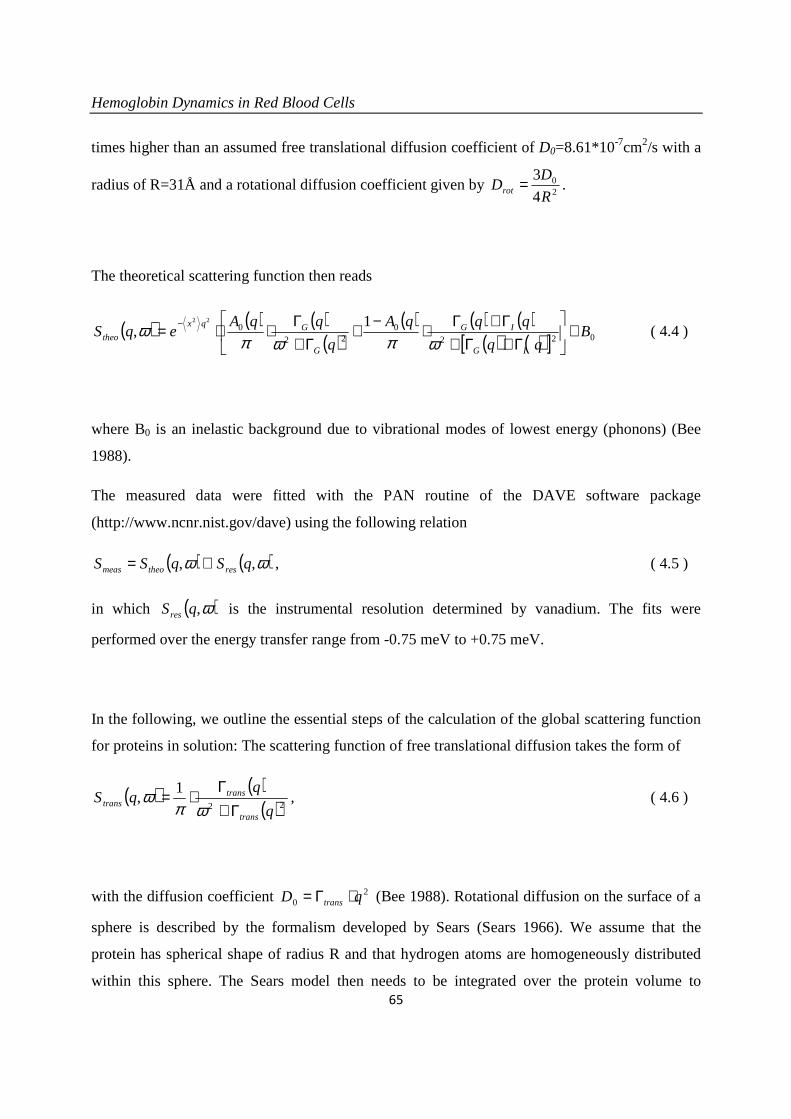
Hemoglobin Dynamics in Red Blood Cells
65
times higher than an assumed free translational diffusion coefficient of D0=8.61*10-7cm2/s with a
radius of R=31Å and a rotational diffusion coefficient given by 20
4
3
R
DDrot = .
The theoretical scattering function then reads
( ) ( ) ( )( )
( ) ( ) ( )( ) ( )[ ] 022
022
0 1,
22
Bqq
qqqA
q
qqAeqS
IG
IG
G
Gqx
theo +
Γ+Γ+Γ+Γ⋅−+
Γ+Γ⋅⋅= −
ωπωπω ( 4.4 )
where B0 is an inelastic background due to vibrational modes of lowest energy (phonons) (Bee
1988).
The measured data were fitted with the PAN routine of the DAVE software package
(http://www.ncnr.nist.gov/dave) using the following relation
( ) ( )ωω ,, qSqSS restheomeas ⊗= , ( 4.5 )
in which ( )ω,qSres is the instrumental resolution determined by vanadium. The fits were
performed over the energy transfer range from -0.75 meV to +0.75 meV.
In the following, we outline the essential steps of the calculation of the global scattering function
for proteins in solution: The scattering function of free translational diffusion takes the form of
( ) ( )( )22
1,
q
qqS
trans
transtrans Γ+
Γ⋅=ωπ
ω , ( 4.6 )
with the diffusion coefficient 20 qD trans ⋅Γ= (Bee 1988). Rotational diffusion on the surface of a
sphere is described by the formalism developed by Sears (Sears 1966). We assume that the
protein has spherical shape of radius R and that hydrogen atoms are homogeneously distributed
within this sphere. The Sears model then needs to be integrated over the protein volume to

Hemoglobin Dynamics in Red Blood Cells
66
correctly account for the distribution of hydrogen atoms (Perez et al. 1999). The scattering
function for rotational protein diffusion then is (Perez et al. 1999)
( ) ( ) ( ) ( )∑∞
= Γ+Γ
⋅⋅+⋅=1
220
1,
l l
llrot qBqBqS
ωπωδω , ( 4.7 )
with ( ) rotl Dll ⋅+=Γ 1 and the rotational diffusion coefficient Drot as defined above. The integrals
in the terms ( )qB0 and ( )qBl are an extension to the Sears model to describe the distribution of
hydrogen atoms within the protein,
( ) ( )∫=
⋅=R
r
drqrjrqB0
20
20 4π , ( ) ( ) ( )drqrjlrqB
R
r
ll ∫=
≥ ⋅+⋅=0
221 124π . ( 4.8 )
The terms j l are the l th-order spherical Bessel function of the first kind. Rotational and
translational diffusion are assumed to be uncorrelated. Therefore, the global scattering function
( )ω,qSG is then the convolution of both terms and reads
( ) ( ) ( ) ( )( ) ( )[ ]∑
∞
= Γ+Γ+Γ+Γ
⋅⋅=0
22
1,
l ltrans
ltranslG
qqqBqS
ωπω . ( 4.9 )
The terms ( )qBl were integrated numerically using the mathematical software Maple (Waterloo
Maple Inc.) for q-values in the range of 0.5 Å-1 to 2.0 Å-1. The Lorentzians in Eq. ( 4.9 ) were
summed over the experimentally covered energy range. Depending on the radius of the protein
and the q-value, different numbers of terms are needed to reach convergence in the infinite sum
of Eq. ( 4.9 ). At the scattering vector q=2.0 Å-1, 39 terms were necessary to be included for the
small protein lysozyme with a radius of R=19 Å (Perez et al. 1999). For the bigger protein
hemoglobin with a radius of R=31 Å, 70 terms at q=2.0 Å-1 had to be included. The obtained
global scattering function ( )ω,qSG could be perfectly approximated by a single Lorentzian as
stated in Eq. ( 4.3 ) (data not shown). The apparent diffusion coefficient Dapp was calculated from
Hemoglobin Dynamics in Red Blood Cells
67
the half-widths by 2qDappG ⋅=Γ and compared to the assumed free translational diffusion
coefficient D0, which gave the relation of 27.10
=DDapp .
Although predominant incoherent scattering is due to nonexchangeable hydrogen atoms of the
protein, scattering from D2O solvent contributes partially to the signal. The incoherent scattering
cross section of human carbonmonoxy hemoglobin was estimated from the amino acid sequence
taken from pdb file 2DN3 (Park et al. 2006) assuming that 13% of the protons exchange with
deuterons (Elantri et al. 1990). The fraction of D2O in the sample was determined by drying and
weighting of an aliquot. These theoretical estimations give a D2O solvent incoherent scattering
cross section of around 9% of the total incoherent scattering cross section. Even so, it still could
be that D2O dynamics contribute strongly to the measured signal as the characteristic relaxation
times of D2O are mostly in the picosecond time range, whereas protein dynamics might be slower
and appear more dominant at slower timescales only, which could be out of the accessible time-
space window of the neutron spectrometer. The coherent structure factor of D2O begins to
increase above 0.8 Å-1 and reaches a maximum at around 2 Å-1 (Bosio et al. 1989), thus a stronger
contribution of D2O to the measured signal is expected at higher q-values.
To estimate the incoherent and coherent contribution of D2O to the measured signal, we
compared the measured elastic intensity of equal amounts of D2O buffer and red blood cell
sample (data not shown). The elastic intensity of D2O is around 6% at low q-values and reaches
around 10% above 1.3 Å-1 of the elastic intensity of the red blood cell sample. When corrected for
the fraction of D2O in the red blood cell sample, we obtain D2O contributions of 4.5% at low
scattering vectors and 7.5% above 1.3 Å-1. This demonstrates that protein dynamics gives a strong
signal compared to D2O buffer at the energy resolution of 50 µeV.

Hemoglobin Dynamics in Red Blood Cells
68
4.3.4 Dynamic light scattering measurement
Dynamic light scattering was measured with a DAWN-EOS instrument equipped with a
quasielastic light scattering module (Wyatt Technology, Santa Barbara, CA) in a temperature
range of 16.9 °C to 45.9 °C. Temperature variations never exceeded ± 0.2°C. The ASTRA 5
software package from the manufacturer was used for data acquisition and calculation of the
diffusion coefficients. The instrument was used in batch mode and around 5 ml of sample was
measured in glass scintillation cells.
4.4 Results
4.4.1 Neutron Scattering
Typical quasielastic neutron spectra at 16.9 °C, 31.9 °C and 45.9 °C at q=1.6 Å-1 together with
the results from the fits using equation ( 4.5 ) are shown in Figure 1. The narrow Lorentzian
corresponds to global protein motions and the broad Lorentzian to internal protein dynamics.
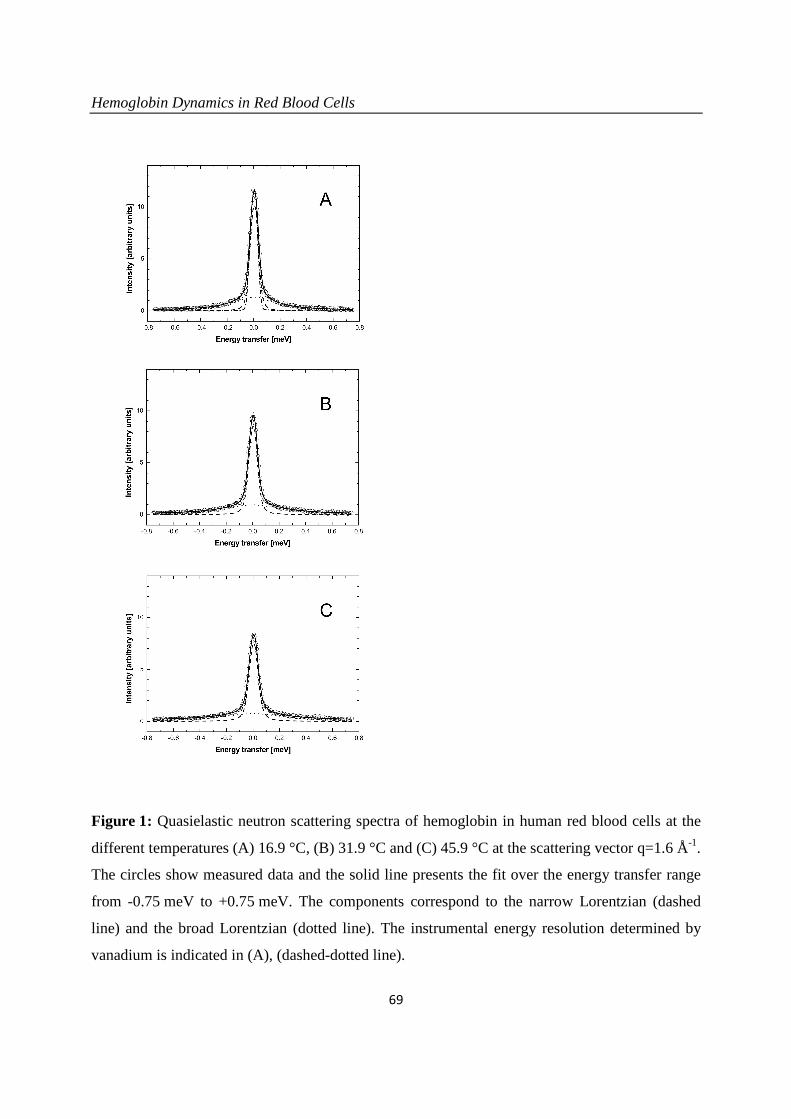
Hemoglobin Dynamics in Red Blood Cells
69
Figure 1: Quasielastic neutron scattering spectra of hemoglobin in human red blood cells at the
different temperatures (A) 16.9 °C, (B) 31.9 °C and (C) 45.9 °C at the scattering vector q=1.6 Å-1.
The circles show measured data and the solid line presents the fit over the energy transfer range
from -0.75 meV to +0.75 meV. The components correspond to the narrow Lorentzian (dashed
line) and the broad Lorentzian (dotted line). The instrumental energy resolution determined by
vanadium is indicated in (A), (dashed-dotted line).

Hemoglobin Dynamics in Red Blood Cells
70
4.4.2 Global Motions
The line-widths ΓG(q) of the narrow Lorentzian at the temperatures 16.9 °C and 45.9 °C as a
function of q2 are shown in Figure 2 A. ΓG(q) does not intercept q2=0 as it would be expected for
free translational diffusion. Above around 1.0 Å-2 the ΓG-values increase with q2, below this q2-
value the half-widths ΓG(q) converge to a plateau Γ0 at q2=0. This is interpreted as resulting from
global hemoglobin diffusion within a restricted volume formed by the neighboring protein
molecules. All protein hydrogen atoms are involved in the global motions, the plateau in the line-
widths at small q2 therefore represents center of mass diffusion. The model of Volino and
Dianoux was developed for free diffusion in a restricted spherical volume of radius r (Volino and
Dianoux 1980). It is characterized by a plateau of the half-widths 0Γ until r
qπ< and for
rq
π>
by a limiting behavior of the half-widths at large q2 with ( ) 2qDq app ⋅=Γ , where Dapp is the
apparent translational diffusion coefficient. In a preliminary, simplified and speculative approach
we use the model of free diffusion to describe the measured data. Especially at the lowest
temperature, deviations from linear behavior are visible. The linear fits appear more justified at
higher temperatures. An alternative interpretation with a jump-diffusion model is presented
further below.

Hemoglobin Dynamics in Red Blood Cells
71
Figure 2: (A) Half-widths at half-maximum ΓG of the narrow Lorentzian as a function of q2 at
T=16.9 °C (squares) and 45.9 °C (circles). The line-widths reach a plateau at small q2 which is
interpreted as global diffusion within confined space. The solid lines are linear fits in the q2-range
of 1.0 Å-2 to 2.56 Å-2 which are extended to intersect the constant plateaus at smaller q2-values.
The linear fits pass through zero which is indicated by the dotted lines. The dashed lines are fits
according to a jump-diffusion model in the q2-range of 0.49 Å-2 to 2.56 Å-2. (B) Temperature
behavior of the apparent translational diffusion coefficients of hemoglobin in red blood cells, the
error bars are within the symbols. The dashed line indicates expected normal thermal behavior
according to the Stokes-Einstein equation with ( ) ( ) hBapp RTTkTD ηπ6/= where ( )Tη is the
viscosity of pure D2O and Rh=31.3 Å the hydrodynamic radius of hemoglobin.
Hemoglobin Dynamics in Red Blood Cells
72
The apparent translational diffusion coefficients Dapp were calculated according to
( ) 2qDq appG ⋅=Γ in the q2-range of 1.0 Å-2 to 2.56 Å-2. The obtained values of Dapp as a function
of temperature are presented in Figure 2 B. Following the model of Volino and Dianoux (Volino
and Dianoux 1980) and the corrected translational diffusion coefficient Dtrans=Dapp/1.27, the
radius r of the spherical volume can be estimated by 0
2 33.4 Γ⋅= transDr . The obtained radii lie
between r=2.1±0.2 Å at 16.9 °C and r=2.3 ± 0.2 Å at 45.9 °C which are constant within the
errors.
Normal temperature behavior of the diffusion coefficient follows the Stokes-Einstein equation
( ) ( ) h
Bapp RT
TkTD
ηπ6= , with the solvent viscosities ( )Tη and the hydrodynamic radius of the
protein Rh. The Stokes-Einstein equation was fitted to the diffusion coefficients Dapp by taking
literature values of the viscosities ( )Tη of pure D2O (Cho C.H. 1999) and the hydrodynamic
radius Rh as a free parameter, see Figure 2 B. We obtain a value of Rh=31.3 Å which is nearly
identical to the published hydrodynamic radius of human hemoglobin of 31.7 Å (Digel et al.
2006).
To check the validity of the Volino and Dianoux model, and the approach of assumed free
diffusion at large q2, we examined the behavior of the plateau 0Γ at small q. The sphere radius r
is then given by the upper limit r
qπ= at which the plateau 0Γ ends. This yields radii between
r=3.4 Å at 16.9 °C and 4.0 Å at 45.9 °C, which are in average 1.7 times bigger than the values
from the approach of free diffusion at large q2. Diffusion coefficients Dlocal were estimated
according to 33.4
02 Γ⋅= r
D ocall (Volino and Dianoux 1980). We get values ranging between
13.7*10-7 cm2/s at 16.9 °C and 22.0*10-7 cm2/s at 45.9 °C. The reasons for the discrepancy are
considered in the ‘Discussion’ section.
Hemoglobin Dynamics in Red Blood Cells
73
At larger q2-values, the half-widths present some deviation from linear behavior. There might be
signs for saturation at 16.9 °C and 45.9 °C, which is less visible at high temperatures. In the
Volino and Dianoux model for restricted free diffusion, the elementary steps of motion are
assumed to be infinitely small and therefore the half-widths show linear behavior at large q2-
values. In the case of elementary steps of motion with a finite size, these steps become observable
at high q2. A plateau at high q2-values is then a sign for a possible jump-diffusion mechanism.
The line-widths were approximated with a jump-diffusion model τ2
2
1 qD
qD
jump
jumpG +
=Γ , with the
diffusion coefficient Djump and the mean residence time τ (Bee 1988). The fits are presented in
Figure 2 A. The residence time on one site between jumps is ∞Γ= 1τ , where ∞Γ is obtained
from the asymptotic behavior at high q while Γ approaches a constant value. The Γ-value at high
q is still increasing over the q-range examined, and has not yet reached a constant value.
Therefore, the constant value was estimated using the presented equation of the jump-diffusion
model and extrapolated to higher q. The behavior of the residence times τ can be approximated
by an Arrhenius relation with
= TkE
B
aexp0ττ in the investigated temperature range. The
residence times τ are presented in an Arrhenius plot in Figure 3. We obtained for the activation
energy a value of Ea=6.6 ± 1.8 kcal/mol. All values Djump are constant within the errors and have
the average value of 12.6 ± 0.2 * 10-7 cm2/s.
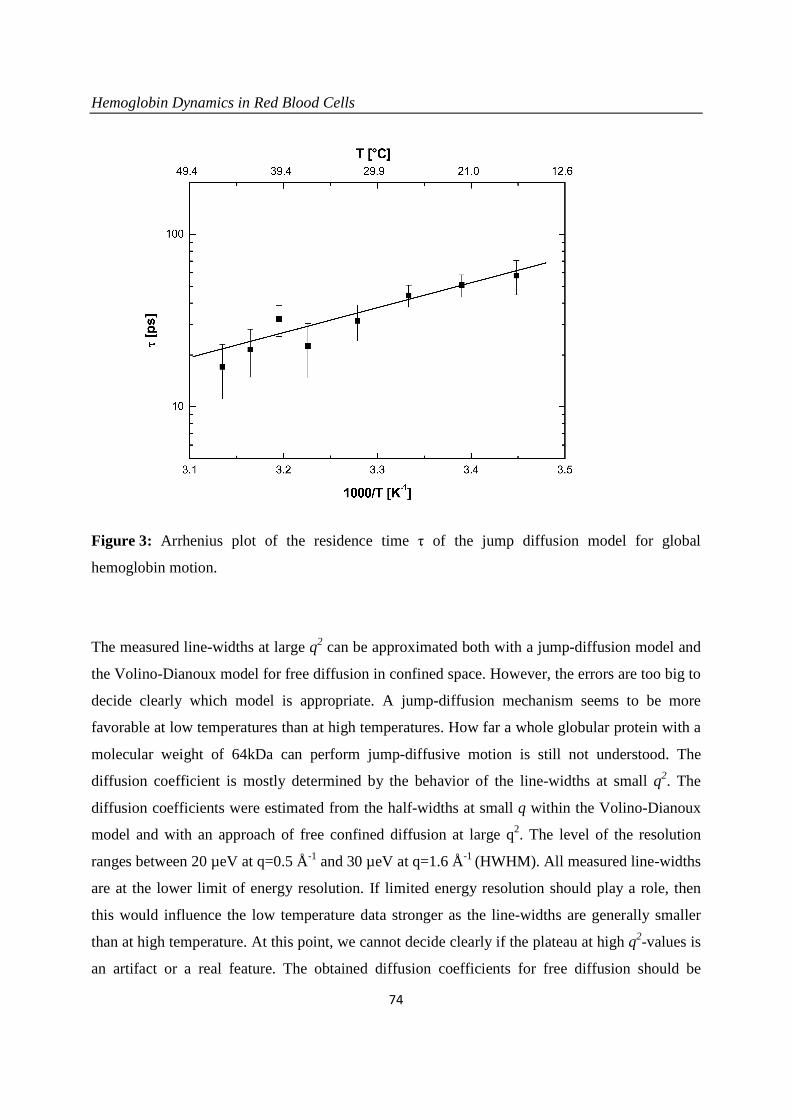
Hemoglobin Dynamics in Red Blood Cells
74
Figure 3: Arrhenius plot of the residence time τ of the jump diffusion model for global
hemoglobin motion.
The measured line-widths at large q2 can be approximated both with a jump-diffusion model and
the Volino-Dianoux model for free diffusion in confined space. However, the errors are too big to
decide clearly which model is appropriate. A jump-diffusion mechanism seems to be more
favorable at low temperatures than at high temperatures. How far a whole globular protein with a
molecular weight of 64kDa can perform jump-diffusive motion is still not understood. The
diffusion coefficient is mostly determined by the behavior of the line-widths at small q2. The
diffusion coefficients were estimated from the half-widths at small q within the Volino-Dianoux
model and with an approach of free confined diffusion at large q2. The level of the resolution
ranges between 20 µeV at q=0.5 Å-1 and 30 µeV at q=1.6 Å-1 (HWHM). All measured line-widths
are at the lower limit of energy resolution. If limited energy resolution should play a role, then
this would influence the low temperature data stronger as the line-widths are generally smaller
than at high temperature. At this point, we cannot decide clearly if the plateau at high q2-values is
an artifact or a real feature. The obtained diffusion coefficients for free diffusion should be
Hemoglobin Dynamics in Red Blood Cells
75
considered rather as average values, as the plateau at high q2 influences the data. The validity of
these average diffusion coefficients is checked by the comparison to expected normal temperature
behavior.
4.4.3 Internal Motions
Conclusions about protein internal motions can be drawn from the amplitudes A0(q) and the half-
widths ΓI(q) of the broad Lorentzian. Information about the average geometry of internal protein
motion and the fraction of hydrogen atoms participating in this motion is contained in the Elastic
Incoherent Structure Factor (EISF) which appears in front of the delta-function in Eq. (4.2). In the
case of a protein solution the delta-function for internal protein motion is convoluted with the
Lorentzian for global protein motion (Perez et al. 1999; Russo et al. 2002). We used a pseudo-
EISF which appears as the prefactor A0 of the narrow Lorentzian in Eq. (4.4). The values of A0
were fitted using a model for ‘diffusion in a sphere’ proposed by Volino and Dianoux (Volino
and Dianoux 1980) with
( ) ( ) ( ) 2
10
31
⋅−+=qa
qajppqA , (4.10)
where j1 is the first-order spherical Bessel function of the first kind and a is the sphere radius. The
populations of hydrogen atoms which appear as immobile and mobile are represented by the
fractions p and (1-p), respectively.
Molecular dynamics simulations showed that the polydispersity of protein internal motions and
geometries are best represented by a free discrete distribution of sphere radii (Dellerue et al.
2001). As the measured experimental results cover only a limited q-region of A0(q), a fit with a
completely free discrete distribution of sphere radii was not feasible. A simplified model
assuming a Gaussian distribution f(a) of the sphere radii with ( ) ( )2
2
2exp
2
2σπσ
aaf −= and
the standard deviation σ as free parameter (Perez et al. 1999) gave good results. The mean value

Hemoglobin Dynamics in Red Blood Cells
76
of the sphere radius is then given by π
σ 2ˆ =a . The fits to the EISF together with the Gaussian
distributions are shown in Figure 4 A and B. Due to the used model of a Gaussian distribution of
spheres the EISF decays slowly with q and reaches the constant value of the immobile hydrogen
fraction only at very high q-values. The inset in Figure 4 A illustrates this behavior of the EISF.
With increasing temperature the Gaussian distributions change from narrow to broad above
36.9 °C. The mean radii â as a function of temperature are given in Figure 5 A. The values
between 16.9 °C and 31.9 °C increase slightly linear with temperature, whereas there appears a
kink at 36.9 °C with a much steeper increase at higher temperatures. The fraction of immobile
hydrogen atoms are shown in Figure 5 B. They are roughly constant within the errors between
16.9 °C and 39.9 °C and have an average value of 0.35±0.01. The value at 42.9 °C and 45.9 °C
are slightly above the average.
In a recent study on the dynamics of apo-calmodulin, Gibrat et al. used a lognormal distribution
to describe the polydispersity of protein motions and to fit the measured EISF (Gibrat et al.
2008). The lognormal distribution is defined by ( ) ( )( )
−−⋅=2
2
2
lnexp
2
1
σµ
πσa
aaf where µ
and σ are the mean and the standard deviation of the variable’s natural logarithm. A lognormal
distribution is appropriate if the variable is the product, whereas a Gaussian distribution is valid if
the variable is the sum of a large number of independent, identically distributed variables.
It was shown that the radius of the sphere of diffusion of a hydrogen atom along an aliphatic
chain fixed at one end increases linearly with distance from the fixed end (Carpentier et al. 1989).
It was argued by Gibrat et al. that the motions of the hydrogen atoms that are bound to a carbon
atom of the aliphatic chain are then the ‘product’ of the motions of the previous hydrogen atoms
in the chain (Gibrat et al. 2008). In this sense, it was concluded that a lognormal distribution
would be more appropriate than a Gaussian distribution (Gibrat et al. 2008) to describe the
polydispersity of hydrogen motion in the amino acid side-chains of a protein.
In fact, we found that both a Gaussian and a lognormal distribution for the Volino and Dianoux
model could fit the measured EISF equally well. The obtained average sphere radii of the
lognormal and the Gaussian distribution were identical within the errors and showed similar
temperature behavior, but the standard deviations of the lognormal distributions were much
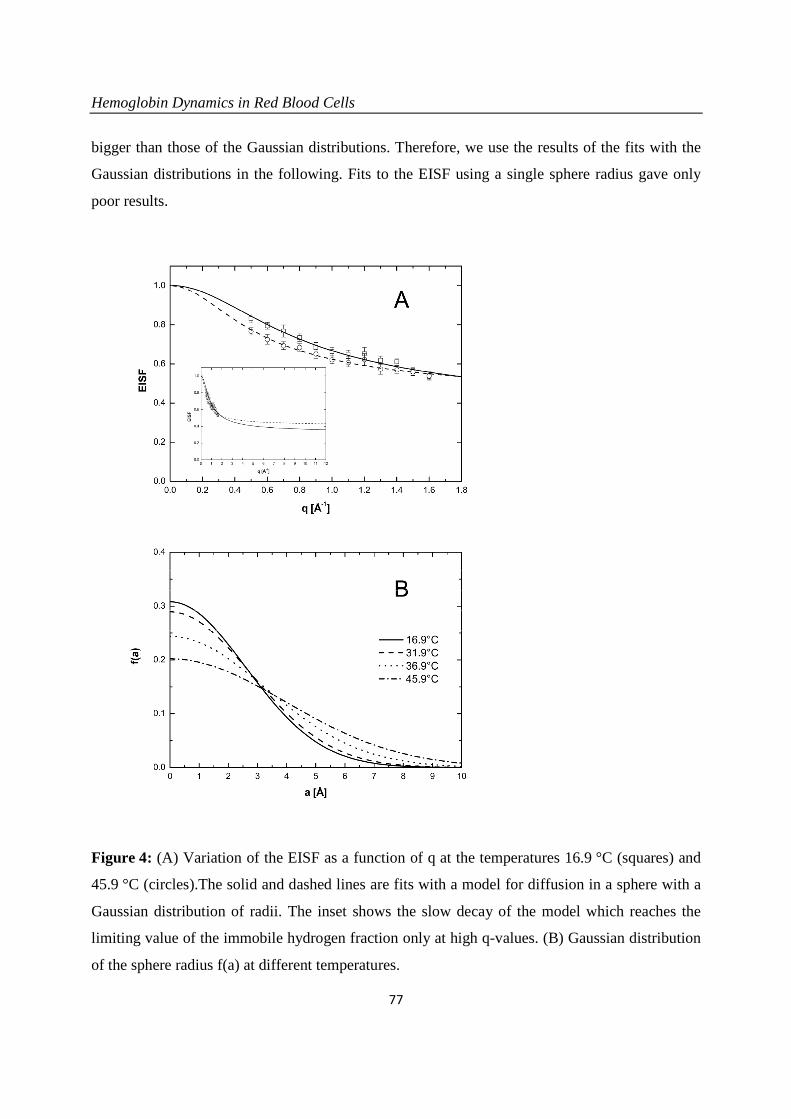
Hemoglobin Dynamics in Red Blood Cells
77
bigger than those of the Gaussian distributions. Therefore, we use the results of the fits with the
Gaussian distributions in the following. Fits to the EISF using a single sphere radius gave only
poor results.
Figure 4: (A) Variation of the EISF as a function of q at the temperatures 16.9 °C (squares) and
45.9 °C (circles).The solid and dashed lines are fits with a model for diffusion in a sphere with a
Gaussian distribution of radii. The inset shows the slow decay of the model which reaches the
limiting value of the immobile hydrogen fraction only at high q-values. (B) Gaussian distribution
of the sphere radius f(a) at different temperatures.

Hemoglobin Dynamics in Red Blood Cells
78
Figure 5: (A) Mean value â of the Gaussian distribution as a function of temperature. The dashed
line is a linear fit to the values between 16.9 °C and 31.9 °C and serves as a guide for the eye. (B)
Fraction of hydrogen atoms which appear immobile within the instrumental energy resolution.
The average value between 16.9 °C and 39.9 °C is indicated by the dashed line.

Hemoglobin Dynamics in Red Blood Cells
79
The half-widths ΓI(q) of the broad Lorentzian are shown in Figure 6. The half-widths tend to a
constant value of around 100 µeV for 02 →q . At higher q2-values, the line-widths follow the
behavior of a jump-diffusion model (Bee 1988). A plateau ∞Γ at highest q2-values is approached
which ranges approximately between 170 µeV at 16.9 °C and 240 µeV at 45.9 °C. ∞Γ
corresponds to a correlation time of ∞Γ= /1τ , which is roughly between 3.9 ps at 16.9 °C and
2.7 ps at 45.9 °C. However, the determination of ΓI is inaccurate and doesn’t allow a more
precise analysis.
Figure 6: Half-widths at half-maximum IΓ of the broad Lorentzian as a function of q2 at
T=16.9 °C (squares) and 45.9 °C (circles).
Hemoglobin Dynamics in Red Blood Cells
80
4.4.4 Dynamic light scattering
The diffusion coefficients of hemoglobin in H2O buffer at the concentrations 0.3 mg/ml,
1.2 mg/ml and 4.0 mg/ml were measured with dynamic light scattering in the temperature range
of 16.9 °C to 45.9 °C. The diffusion coefficients at infinite dilution were obtained by linearly
extrapolating the measured values to zero concentration. The measurements in D2O buffer
showed pronounced hemoglobin aggregation. Therefore the values in H2O buffer were corrected
for pure D2O and H2O viscosities (Cho C.H. 1999) to estimate the diffusion coefficients of
hemoglobin in D2O buffer.
4.5 Discussion
4.5.1 Global Motions
Hemoglobin molecules are densely packed in the cytoplasm with intermolecular distances in the
order of some Ångstrom (Krueger and Nossal 1988). Well studied model systems for such a
highly crowded protein solution are suspensions of colloidal particles (Hunter 2001). Colloidal
particles are small enough that their motions are governed by thermal energy and big enough that
the solvent molecules participate to the interactions only in an averaged way. The diffusion of
these colloidal particles at infinite dilution D0 is described by the Stokes-Einstein relation. At
higher concentration the interactions between individual colloidal particles become important. In
this case, direct Van-der-Waals and electrostatic forces determine particle diffusion, but
hydrodynamic interactions mediated by the solvent play an important role (Dhont 1996). These
hydrodynamic interactions describe how a colloidal particle moves in the flow-field which is
determined by its neighboring particles. If a colloidal particle has collided and interacted directly
with other particles, the diffusion coefficient approaches a constant value which is now termed
long-time self-diffusion coefficient LSD . The time that a particle needs to cross a typical

Hemoglobin Dynamics in Red Blood Cells
81
interparticle distance d is referred to as structural relaxation time τD. At timescales shorter than
this structural relaxation time, the particle moves in an approximately constant configuration of
the surrounding particles. This stage is governed by hydrodynamic interactions and the
displacements of the colloidal particle are characterized by the so-called short-time self-diffusion
coefficient SSD . The relaxation time is then given by
SS
D D
d
6
2
≈τ . Beenakker and Mazur
(Beenakker and Mazur 1984) first evaluated the coefficient SSD over a large range of volume
fractions. Due to configurational relaxation at long time scales, the long-time self-diffusion
coefficient LSD is always slower than the short-time self-diffusion coefficient S
SD .
The values of SSD and L
SD as a function of the volume fraction φ for non-charged hard-sphere
particles were calculated by Tokoyama and Oppenheim (Tokuyama and Oppenheim 1994) taking
into account both short and long range hydrodynamic interactions. Their theory predicts
experimental data of uncharged colloids at intermediate and high volume fraction quite well. The
volume fraction of hemoglobin in red blood cells is φ=0.25 (Krueger and Nossal 1988) and their
calculations yield values of 056.0 DD SS ⋅= and 028.0 DD L
S ⋅= with the diffusion coefficient at
infinite dilution D0.
Doster and Longeville measured the long-time self-diffusion coefficient of hemoglobin in red
blood cells with neutron spin-echo spectroscopy (Doster and Longeville 2007) and applied for the
first time in neutron spectroscopy the above mentioned concepts of hydrodynamic theory to
interpret their data. They found a slightly reduced long-time self-diffusion coefficient of
hemoglobin as compared to the predicted theoretical value. This reduction was explained due to
the influence from the protein hydration shell which was supposed to stick to the surface of the
protein and to move in a joint way.
In our work, we used the behavior of the line-widths ΓG(q) of the narrow Lorentzian to gain
information about the short-time self-diffusion coefficient, the interparticle distance d and the
residence time of hemoglobin diffusion in red blood cells. Neutron scattering results show the
dependency of the length scale. The form of the half-widths is in agreement with a model for
confined diffusion within a restricted spherical volume (Volino and Dianoux 1980). At small q2-
Hemoglobin Dynamics in Red Blood Cells
82
values, longer real space length scales get visible and the effects of the boundaries dominate; the
line-widths tend to a constant value Γ0 instead of a zero intercept and a Dq2 behavior for q20.
At large q2-values, the dynamic behavior at small real space length scales dominates. In the case
of free diffusion, the elementary steps of motions are supposed to be infinitely small and the half-
widths follow a limiting behavior of ( ) 2qDq ⋅=Γ at large q2. If the elementary steps of motions
have a finite size, then the half-widths tend to an asymptotic value ∞Γ= /1τ (Bee 1988).
In our study, we calculated apparent average diffusion coefficients for assumed free diffusion
from the behavior of the half-widths at large q2 according to ( ) 2qDq app ⋅=Γ . The temperature
behavior of these apparent diffusion coefficients is well approximated with the Stokes-Einstein
equation and a hydrodynamic radius of Rh=31.3 Å that is nearly identical to the published
hydrodynamic radius of human hemoglobin of 31.7 Å (Digel et al. 2006). The sphere radius r of
global confined motion was estimated from the value of constant 0Γ at small q2 and the diffusion
coefficients according to the model of Dianoux and Volino with 0
2 33.4 Γ⋅= transDr .If the
assumptions are valid, then the sphere radius r should equally be given by the value of rq π= at
which the plateau 0Γ ends. These sphere radii are in average 1.7 times larger than those radii
which were calculated using the diffusion coefficients of free diffusion and the value of 0Γ .
Dellerue et al. performed molecular dynamics simulations of a globular protein. They were able
to analyze amino acid side-chain and backbone dynamics separately with a model for diffusion
within a sphere with a distribution of radii (Dellerue et al. 2001). The authors calculated
scattering functions from the simulations that were compared to neutron scattering results. They
demonstrated that only in an ideal case for diffusion in a single-sphere with radius r, the plateau
0Γ ends promptly at rq π= . In the case of a distribution of sphere radii, the plateau exhibits a
more gradual change and the plateau ends at an apparent smaller value q’ than in the single sphere
case. Consequently, if a sphere size is determined from the position of q’, the obtained apparent
sphere radius is bigger than the real average value of the sphere radii distribution (Dellerue et al.

Hemoglobin Dynamics in Red Blood Cells
83
2001). For the side-chains and the backbone, the apparent sphere radii were between 1.7 and 1.8
times bigger than the average value of the distribution.
In our study, we found a factor of 1.7 between the sphere radii obtained with the two methods,
which agrees nicely with the work of Dellerue et al. In this sense, the validity of our approach is
confirmed. Obviously, this also demonstrates that confined global diffusion of hemoglobin in the
red blood cells is best described by a distribution of sphere radii. In fact, recent small angle
neutron scattering work points to the existence of a higher concentration of hemoglobin close to
the internal membrane surface than in average in the cell (Garvey et al. 2004). Necessarily, the
factor between apparent and average sphere radius will depend on the precise nature of the sphere
distribution. In the following we limit our discussion to the sphere radii which were obtained
from the value of constant 0Γ at small q2 and the average diffusion coefficients obtained from
linear approximation at higher q2-values.
We estimated a temperature independent radius r=2.2±0.2 Å of confined global hemoglobin
diffusion. This has to be understood as the radius of the sphere in which the center of mass of the
protein moves. This is in agreement with high resolution neutron-backscattering measurements of
protein dynamics in whole Escherichia coli bacteria which found an average jump-length of
2.2±0.3 Å at 10.9 °C and an average jump-length of 1.9±0.2 Å at 29.9 °C of the protein
population (Jasnin et al. 2008). Another neutron-backscattering study with concentrated
myoglobin solution at φ=0.26 found a protein jump-diffusion length of 1.4 Å (Busch 2007). In
this experiment the pH was not controlled which might have influenced the packing density of the
protein, leading to a slightly reduced value.
From our measurements we conclude that the hemoglobin molecules diffuse in a cage of 2.2 Å
radius before they interact directly with the neighbor proteins. The diffusion coefficient D0 at
infinite dilution in D2O buffer was obtained from dynamic light scattering experiments. The
theoretical prediction yields scmDD SS /1085.256.0 27
0−⋅=⋅= at 16.9 °C and
scmDSS /1083.5 27−⋅= at 45.9 °C (Tokuyama and Oppenheim 1994). From these values we
obtain structural relaxation times ranging from 280 ps to 140 ps. Even if the real short-time self-

Hemoglobin Dynamics in Red Blood Cells
84
diffusion coefficient might deviate from the theoretical predictions, the calculations show that the
structural relaxation time is in the order of several hundred picoseconds.
We deduced the global apparent diffusion coefficient from the line-widths of the narrow Lorentz
function. The correlation times of these line-widths range from 47 ps at 1.0 Å-2 to 150 ps at
2.56 Å-2. This is smaller than the structural relaxation time and therefore the experimentally
measured apparent diffusion coefficients reflect short-time self-diffusion behavior of hemoglobin.
The measured apparent global diffusion coefficients are bigger than the true translational
diffusion coefficients as they contain the contribution of rotational motion (Perez et al. 1999).
Calculations for free diffusion of hemoglobin at infinite dilution give a correction factor of 1.27
between the apparent and true translational diffusion coefficients, similar to myoglobin and
lysozyme solutions (Perez et al. 1999). However, the translational diffusion coefficient of
hemoglobin in red blood cells is strongly reduced as compared to free diffusion (Doster and
Longeville 2007). This is due to the high concentration of hemoglobin and resulting crowding
effects, the correction factor can therefore serve only as an estimate.
The apparent global diffusion coefficients of hemoglobin were divided by 1.27 to obtain the
translational diffusion coefficients Dtrans. The diffusion coefficients at infinite dilution were
scaled by a factor 0.56 (Tokuyama and Oppenheim 1994) to yield the theoretical predictions for
short-time self-diffusion. The calculated quantities as a function of temperature are compared in
Figure 7. The lines in the graph represent expected normal thermal behavior. In the investigated
temperature range this is nearly linear in temperature. The translational diffusion coefficients in
the red blood cells are around 1.5 times bigger than the predicted short-time self-diffusion values.
An explanation could be that the concepts for non-charged hard-sphere colloids are not fully
applicable to the much smaller protein molecules. It remains to be studied, if the solvent can be
treated equivalently as a continuum both for large colloid particles and for the smaller protein
molecules.

Hemoglobin Dynamics in Red Blood Cells
85
Figure 7: The apparent global diffusion coefficients of hemoglobin were divided by 1.27 to
obtain the translational diffusion coefficients Dtrans (circles). The diffusion coefficients at infinite
dilution were scaled by a factor 0.56 to yield the theoretical predictions for short-time self-
diffusion SSD (squares). The dashed and dotted lines show expected thermal behavior of the
diffusion coefficients.
Hemoglobin carries only small total charge at the used pH values (Krueger and Nossal 1988) but
it has got a distribution of positive and negatively charged residues on the protein surface. The
interactions between proteins in concentrated solution are not expected to be described only by
hard-sphere interactions. Recent investigations using small angle scattering and molecular
dynamics simulations have shown the importance of both attractive and repulsive interactions
between proteins in concentrated solution (Cardinaux et al. 2007; Stradner et al. 2006; Stradner et
al. 2007; Stradner et al. 2004). How these repulsive and attractive protein-protein interactions
influence hemoglobin self-diffusion in red blood cells requires further studies. Doster and
Longeville argue that the hydration shell moves with the protein and needs to be included into the
Hemoglobin Dynamics in Red Blood Cells
86
volume fraction to correctly describe hemoglobin diffusion in red blood cells measured with
neutron spin-echo spectroscopy (Doster and Longeville 2007). In this way they obtain effective
volume fractions between 0.32 and 0.36. Taking into account these effective volume fractions,
the discrepancy between our measured translational diffusion coefficients and the predicted short-
time self-diffusion coefficients would then be even bigger. This interesting fact could be
investigated further in detail by using neutron spectrometers with higher energy resolution to
observe the change-over between hemoglobin short-time to long-time self-diffusion.
As discussed above, the line-widths might show signs of saturation at high q2-values. We
calculated the residence times between jumps from the analysis with a jump-diffusion model.
Busch et al. (Busch 2007) found a residence time of 80ps at 20 °C in concentrated myoglobin
solution and Jasnin et al. (Jasnin et al. 2008) obtained a residence time of 590ps at 30 °C in whole
bacteria with high resolution neutron backscattering. In our work we obtained residence times of
51ps at 21.9 °C and 31ps at 31.9 °C. This is close to the values of concentrated myoglobin
solution but differs strongly of the results of whole bacteria. We obtained an activation energy of
Ea=6.6 ± 1.8 kcal/mol from the residence times. The residence time of jump-diffusion of pure
water cannot be described in a general way by an Arrhenius law over a broad temperature range
(Teixeira et al. 1985). We applied an Arrhenius law to literature values for the purpose of
comparison for a restricted temperature range (Teixeira et al. 1985). In this way, the activation
energy of pure water residence times in the range between 5 °C to 20 °C was found to be
6.7 ± 0.5 kcal/mol. This is very close to our obtained activation energy of hemoglobin residence
times and could point out that hydrogen bond fluctuations are involved in hemoglobin global
diffusion. The measured line-widths at large q2 can be approximated both with a jump-diffusion
model and assumed free diffusion in confined space. However, the errors are too big to decide
clearly which model is appropriate. A jump-diffusion model might be more favorable to describe
the measured data. How far a whole globular protein with a molecular weight of 64kDa can
perform jump-diffusive motion is still not understood.
Global protein diffusion was estimated from the broadening of the narrow Lorentzian. The
experimentally measured line-widths reach down to 3 µeV which correspond to correlation times
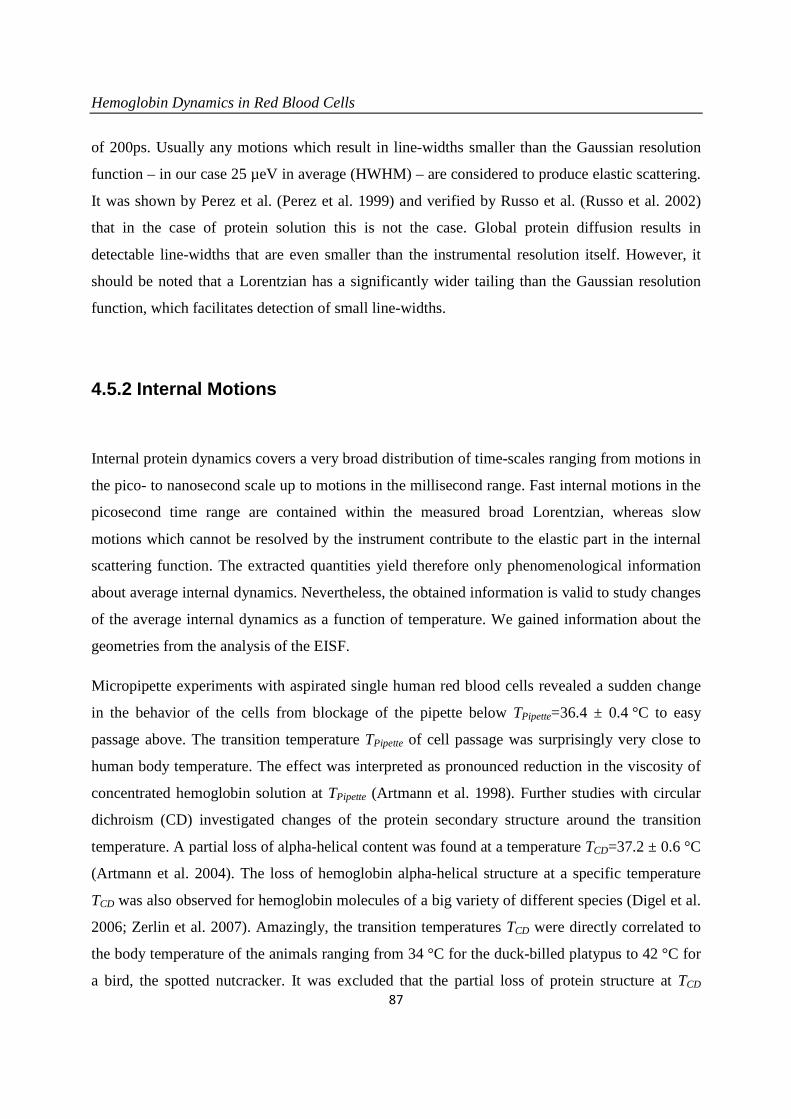
Hemoglobin Dynamics in Red Blood Cells
87
of 200ps. Usually any motions which result in line-widths smaller than the Gaussian resolution
function – in our case 25 µeV in average (HWHM) – are considered to produce elastic scattering.
It was shown by Perez et al. (Perez et al. 1999) and verified by Russo et al. (Russo et al. 2002)
that in the case of protein solution this is not the case. Global protein diffusion results in
detectable line-widths that are even smaller than the instrumental resolution itself. However, it
should be noted that a Lorentzian has a significantly wider tailing than the Gaussian resolution
function, which facilitates detection of small line-widths.
4.5.2 Internal Motions
Internal protein dynamics covers a very broad distribution of time-scales ranging from motions in
the pico- to nanosecond scale up to motions in the millisecond range. Fast internal motions in the
picosecond time range are contained within the measured broad Lorentzian, whereas slow
motions which cannot be resolved by the instrument contribute to the elastic part in the internal
scattering function. The extracted quantities yield therefore only phenomenological information
about average internal dynamics. Nevertheless, the obtained information is valid to study changes
of the average internal dynamics as a function of temperature. We gained information about the
geometries from the analysis of the EISF.
Micropipette experiments with aspirated single human red blood cells revealed a sudden change
in the behavior of the cells from blockage of the pipette below TPipette=36.4 ± 0.4 °C to easy
passage above. The transition temperature TPipette of cell passage was surprisingly very close to
human body temperature. The effect was interpreted as pronounced reduction in the viscosity of
concentrated hemoglobin solution at TPipette (Artmann et al. 1998). Further studies with circular
dichroism (CD) investigated changes of the protein secondary structure around the transition
temperature. A partial loss of alpha-helical content was found at a temperature TCD=37.2 ± 0.6 °C
(Artmann et al. 2004). The loss of hemoglobin alpha-helical structure at a specific temperature
TCD was also observed for hemoglobin molecules of a big variety of different species (Digel et al.
2006; Zerlin et al. 2007). Amazingly, the transition temperatures TCD were directly correlated to
the body temperature of the animals ranging from 34 °C for the duck-billed platypus to 42 °C for
a bird, the spotted nutcracker. It was excluded that the partial loss of protein structure at TCD

Hemoglobin Dynamics in Red Blood Cells
88
results from irreversible protein denaturation which occurs at distinctly higher temperatures.
Independent of these experiments two-dimensional infrared correlation spectroscopy suggested a
structural perturbation stage of bovine hemoglobin between 30 °C and 44 °C (Yan et al. 2004).
The observed perturbations were assigned to hydrogen-bonded extended chains that connect the
helices. It was concluded that the passage transition of red blood cells is caused by hemoglobin
molecules and that the observed small structural changes of hemoglobin at TCD might be the
cause for the drop of viscosity at TPipette (Kelemen et al. 2001).
In our work we could determine the mean radius â of the distribution of spheres in which the
mobile protein protons – in the used model mostly hydrogen atoms in side-chains – diffuse. The
mean radii increase linearly between 16.9 °C and 31.9 °C due to higher thermal amplitudes. At
36.9 °C and higher temperatures the mean radii deviate from the low temperature linear behavior
and increase with a significantly steeper slope. This pronounced increase in average sphere size is
interpreted as partial unfolding of hemoglobin which begins at human body temperature.
In the partially unfolded state the side-chains can move in a larger space than in the more
compact low temperature state. At 45.9 °C the accessible volume is around three times bigger
than at 31.9 °C. The fraction of immobile protons p remains roughly constant within the errors;
only the temperatures at 42.9 °C and 45.9 °C are slightly above the average. Hydrogen atoms
which move so slowly that they contribute to the immobile fraction p are mainly located in the
protein interior and in the protein backbone, amino acids towards the exterior and on the surface
of the protein contribute mostly to the mobile fraction (Dellerue et al. 2001).
It was proposed that aggregation of hemoglobin in red blood cells occurs above body temperature
and that an increase in surface hydrophobicity could be the reason for it (Digel et al. 2006). At
first sight the aggregation effect at 36.9°C seems to be in contradiction with the observed larger
volume of side-chain diffusion above this temperature. The observed change in side-chain
mobility might reflect structural rearrangements that cause the increase in surface hydrophobicity.
In this way the observed dynamical and structural changes in the picosecond time range and
Ångstrom length scale could influence protein-protein interactions in the crowded cell
environment. The cooperated effects of the protein interactions would then cause the measured

Hemoglobin Dynamics in Red Blood Cells
89
passage effect of whole red blood cells seen with micropipette experiments. This might be an
intriguing example how atomic effects influence macroscopic properties of whole red blood cells.
The onset of protein aggregation might be as well the cause for the small increase in the fraction
of immobile hydrogen atoms at 42.9 °C and 45.9 °C. Although the majority of external protein
side-chains can access a larger space at these temperatures, a small side-chain fraction might get
slowed down due to strong protein-protein interactions. The hydrogen atoms of these slowed
down side-chains could then contribute to the fraction of immobile protons. Removing the
protons from the average would also lead to a larger sphere radius in the Volino-Dianoux model.
As the immobile fraction p changes only slightly while the mean radii increase strongly above
36.9 °C, we conclude that the observed changes in the mobility occur mostly in amino acid side-
chains on the surface of hemoglobin. If hydrogen atoms in the protein interior were involved
during partial unfolding, then we would expect more pronounced changes in the fraction p of
immobile protons. Large changes in the immobile fraction p go in hand with protein unfolding
and denaturation (Fitter 2001; Gibrat et al. 2008; Russo et al. 2002) when internal side-chains and
backbone hydrogen atoms become more mobile. In this case the immobile fraction approaches
zero in the unfolded state. Our results confirm that the internal structure of hemoglobin unfolds
only partially and does not denature completely in the investigated temperature range.
It is not yet understood if the observed effects of hemoglobin around body temperature are related
to hemoglobin function in the human body. The temperature close to the core of the human body
is some degrees Celsius higher then in the extremities. If and how hemoglobin function and the
properties of red blood cells are influenced by this temperature difference is still an open
question.

Hemoglobin Dynamics in Red Blood Cells
90
4.6 Conclusion
We have used incoherent quasielastic neutron scattering to measure the dynamics of hemoglobin
in whole human red blood cells around body temperature. In our approach we could separate
global protein diffusion from internal hemoglobin motions. We complemented our neutron
experiments with dynamic light scattering measurements to obtain the diffusion coefficient of
hemoglobin at infinite dilution. Theoretical predictions for concentrated suspensions of non-
charged hard-sphere colloids were used to compare the global diffusion coefficients of
hemoglobin in red blood cells with hemoglobin diffusion coefficients at infinite dilution. The
values of the hemoglobin diffusion coefficients in the cells are in the same order as it is expected
for short-time self-diffusion. The hemoglobin molecules are trapped in cages formed by
neighboring proteins. The cage radius is in agreement with results of neutron backscattering
studies on the average protein population in Escherichia coli cells and on concentrated myoglobin
solutions (Busch et al. 2007; Jasnin et al. 2008). Internal protein motion was analyzed with a
model for diffusion in a sphere with a distribution of radii. At temperatures higher than 36.9 °C
amino acid side-chain motions occupy larger volumes than expected from normal temperature
dependence. These results indicate partial unfolding of hemoglobin around human body
temperature which is in agreement with circular dichroism experiments (Artmann et al. 2004;
Digel et al. 2006; Zerlin et al. 2007). It was deduced that these changes are caused mostly by
amino acid side-chains towards the exterior and on the surface of the proteins. Micropipette
experiments with single red blood cells found a passage phenomenon from complete blockage of
the pipette below body temperature to sudden passage at higher temperatures. It was suggested
that intracellular hemoglobin aggregation at temperatures above human body temperature is
responsible for the passage effect (Artmann et al. 1998). The observed changes in the geometry of
amino acid side-chain motion at body temperature could reflect an increase in surface
hydrophobicity which might cause an increase in protein-protein attraction and cause protein
aggregation. Further studies on hemoglobin interactions in red blood cells would help to shed
light on this issue. It is still unknown if the changes in the behavior of hemoglobin at body
temperature are necessary for hemoglobin function in the human body. Protein dynamics and
Hemoglobin Dynamics in Red Blood Cells
91
structural changes in the picosecond time range and Ångstrom length scale might be connected to
a macroscopic effect of whole red blood cells.
4.7 Acknowledgements
We thank Prof. Aysegül Temiz Artmann and Dipl. Ing. Dariusz Porst for taking blood and help
during the sample preparation. This work is based on experiments performed at the Swiss
spallation neutron source SINQ, Paul Scherrer Institute, Villigen, Switzerland. This research
project has been supported by the European Commission under the 6th Framework Programme
through the Key Action: Strengthening the European Research Area, Research Infrastructures.
Contract n°: RII3-CT-2003-505925.
4.8 References
Alberts B. AJ, J. Lewis, M. Raff, K. Roberts, P. Walter (2002) Molecular biology of the cell, 4th
edn. Garland Science, New York
Antonini E, Brunori M (1970) Hemoglobin. Ann. Rev. Biochem. 39:977-1042
Artmann GM, Burns L, Canaves JM, Temiz-Artmann A, Schmid-Schonbein GW, Chien S,
Maggakis-Kelemen C (2004) Circular dichroism spectra of human hemoglobin reveal a
reversible structural transition at body temperature. Eur. Biophys. J. 33:490-6
Artmann GM, Kelemen C, Porst D, Büldt G, Chien S (1998) Temperature transitions of protein
properties in human red blood cells. Biophys. J. 75:3179-83
Austin RH, Beeson KW, Eisenstein L, Frauenfelder H, Gunsalus IC (1975) Dynamics of ligand
binding to myoglobin. Biochem. 14:5355-73
Ball P (2008) Water as an Active Constitutent in Cell Biology. Chem. Rev. 108:74-108
Bauer GS, Salvatores M, Heusener G (2001) MEGAPIE, a 1 MW pilot experiment for a liquid
metal spallation target. J. Nuc. Mat. 296:17-33
Bee M (1988) Quasielastic neutron scattering. Principles and Applications in Solid State
Chemistry, Biology and Materials Science. Adam Hilger, Bristol and Philadelphia

Hemoglobin Dynamics in Red Blood Cells
92
Beenakker CWJ, Mazur P (1984) Diffusion of Spheres in a Concentrated Suspension .2. Physica
A 126:349-370
Bosio L, Teixeira J, Bellissent-Funel MC (1989) Enhanced density fluctuations in water analyzed
by neutron scattering. Phys Rev A 39:6612-6613
Brooks III C.L. MK, and B.M. Pettitt (1988) Proteins: A Theoretical Perspective of Dynamics,
Structure, and Thermodynamics, vol 71. John Wiley & Sons, New York, USA
Busch S (2007) Microscopic Protein Diffusion at High Concentration. In: P.E. Sokol HK, D.
Baxter, R. Pynn, D. Bossev, M. Leuschner (ed) QENS2006. Materials Research Society,
Bloomington, Indiana, USA, pp 107-114
Busch S, Doster W, Longeville S, Garcia Sakai V, Unruh T (2007) Microscopic protein diffusion
at high concentration. In: Sokol PE, Kaiser H, Baxter D, Pynn R, Bossev D, Leuschner M
(eds) QENS2006. Materials Research Society, Bloomington, IN, pp 107-114
Cardinaux F, Stradner A, Schurtenberger P, Sciortino F, Zaccarelli E (2007) Modeling
equilibrium clusters in lysozyme solutions. Europhys. Lett. 77:1-5
Carpentier L, Bee M, Giroud-Godquin AM, Maldivi P, Marchon JC (1989) Alkyl chain motions
in columnar mesophases - A quasielastic neutron scattering study of dicopper
tetrapalminat. Mol Phys 68:1367-1378
Cho C.H. JU, S. Singh, and G. Wilse Robinson (1999) Thermal Offset Viscosities of Liquid
H2O, D2O, and T2O. J. Phys. Chem. B 103:1991-1994
Creighton TE (1992) Proteins: Structures and Molecular Properties, 2nd edn. W.H. Freeman &
Co Ltd, New York
De Francesco A, Marconi M, Cinelli S, Onori G, Paciaroni A (2004) Picosecond Internal
Dynamics of Lysozyme as Affected by Thermal Unfolding in Nonaqueous Environment.
Biophys. J. 86:480-487
Dellerue S, Petrescu AJ, Smith JC, Bellissent-Funel MC (2001) Radially softening diffusive
motions in a globular protein. Biophys. J. 81:1666-76
Dhont JKG (1996) An Introduction to Dynamics of Colloids. Elsevier, Amsterdam
Digel I, Maggakis-Kelemen C, Zerlin KF, Linder P, Kasischke N, Kayser P, Porst D, Temiz
Artmann A, Artmann GM (2006) Body temperature-related structural transitions of
monotremal and human hemoglobin. Biophys. J. 91:3014-21
Doster W, Cusack S, Petry W (1989) Dynamical transition of myoglobin revealed by inelastic
neutron scattering. Nature 337:754-6

Hemoglobin Dynamics in Red Blood Cells
93
Doster W, Longeville S (2007) Microscopic diffusion and hydrodynamic interactions of
hemoglobin in red blood cells. Biophys. J. 93:1360-8
Elantri S, Sire O, Alpert B (1990) Relationship between Protein Solvent Proton-Exchange and
Progressive Conformation and Fluctuation Changes in Hemoglobin. Eur. J. Biochem
191:163-168
Elgsaeter A, Branton D (1974) Intramembrane particle aggregation in erythrocyte ghosts. I. The
effects of protein removal. J. Cell. Biol. 63:1018-36
Fitter J (2001) Dynamical properties of a-amylase in the folded and unfolded state: the role of
thermal equilibirum fluctuations for conformational entropy and protein stabilisation.
Physica B 301:1-7
Fitter J, Herrmann R, Dencher NA, Blume A, Hauss T (2001) Activity and stability of a
thermostable alpha-amylase compared to its mesophilic homologue: mechanisms of
thermal adaptation. Biochemistry 40:10723-31
Frauenfelder H, Parak F, Young RD (1988) Conformational Substates in Proteins. Ann. Rev. of
Biophys. Biophys. Chem. 17:451-479
Fraunfelder H, Sligar SG, Wolynes PG (1991) The energy landscapes and motions of proteins.
Science 254:1598-1603
Gabel F, Bicout D, Lehnert U, Tehei M, Weik M, Zaccai G (2002) Protein dynamics studied by
neutron scattering. Q. Rev. Biophys. 35:327-67
Garvey CJ, Knott RB, Drabarek E, Kuchel PW (2004) Shear-induced alignment of self-associated
hemoglobin in human erythrocytes: small angle neutron scattering studies. Eur Biophys J
2004:589-595
Gibrat G, Assairi L, Blouquit Y, Craescu CT, Bellissent-Funel MC (2008) Biophysical study of
thermal denaturation of apo-calmodulin: II-Dynamics of native and unfolded states.
Biophys. J. doi:10.1529/biophysj:107.120147
Gregory RB (1995) Protein-Solvent Interactions. Marcel Dekker, New York
Hall D, Minton AP (2003) Macromolecular crowding: qualitative and semiquantitive successes,
quantitative challenges. Biochim. Biophys. Acta 1649:127-139
http://www.ncnr.nist.gov/dave
Hunter RJ (2001) Foundations of Colloid Science, 2nd edn. Oxford University Press, Oxford
Janssen S, Mesot J, Holitzner L, Furrer A, Hempelmann R (1997) FOCUS: A hybrid TOF-
spectrometer at SINQ. Physica B 234:1174-1176
Hemoglobin Dynamics in Red Blood Cells
94
Jasnin M, Moulin M, Haertlein M, Zaccai G, Tehei M (2008) Down to atomic-scale intracellular
water dynamics. EMBO reports 9:543-547
Jasnin M, Moulin M, Haertlein M, Zaccai G, Tehei M (2008) In vivo measurement of internal
and global macromolecular motions in E. coli. Biophys. J. 95:857-864
Kelemen C, Chien S, Artmann GM (2001) Temperature transition of human hemoglobin at body
temperature: effects of calcium. Biophys. J. 80:2622-30
Krueger S, Nossal R (1988) SANS studies of interacting hemoglobin in intact erythrocytes.
Biophys. J. 53:97-105
Lehnert U, Reat V, Weik M, Zaccai G, Pfister C (1998) Thermal motions in bacteriorhodopsin at
different hydration levels studied by neutron scattering: correlation with kinetics and
light-induced conformational changes. Biophys. J. 75:1945-52
Longeville S, Doster W, Kali G (2003) Myoglobin in crowded solutions: structure and diffusion.
Chem. Phys. 292:413-424
McCammon JA, and S.C. Harvey (1987) Dynamics of Proteins and Nucleic Acids. Cambridge
University Press, Cambridge UK
Minton AP (2001) The Influence of Macromolecular Crowding and Macromolecular
Confinement on Biochemical Reactions in Physiological Media. J. Biol. Chem.
276:10577-10580
Paciaroni A, Cinelli S, Onori G (2002) Effect of the Environment on the Protein Dynamical
Transition: A Neutron Scattering Study. Biophys. J. 83:1157-1164
Park SY, Yokoyama T, Shibayama N, Shiro Y, Tame JRH (2006) 1.25 angstrom resolution
crystal structures of human haemoglobin in the oxy, deoxy and carbonmonoxy forms. J.
Mol. Biol. 360:690-701
Perez J, Zanotti JM, Durand D (1999) Evolution of the internal dynamics of two globular proteins
from dry powder to solution. Biophys. J. 77:454-69
Perutz MF, G. Fermi, B. Luisi (1987) Stereochemistry of Cooperative Mechanisms in
Hemoglobin. Accounts of Chemical Research 20:309-321
Perutz MF, Rossmann MG, Cullis AF, Muirhead H, Will G, North ACT (1960) Structure of
Haemoglobin: A Three-Dimensional Fourier Synthesis at 5.5-Å Resolution, Obtained by
X-Ray Analysis. Nature 185:416-422

Hemoglobin Dynamics in Red Blood Cells
95
Reat V, Patzelt H, Ferrand M, Pfister C, Oesterhelt D, Zaccai G (1998) Dynamics of different
functional parts of bacteriorhodopsin: H-2H labeling and neutron scattering. Proc. Natl.
Acad. Sci. U.S.A. 95:4970-5
Russo D, Perez J, Zanotti JM, Desmadril M, Durand D (2002) Dynamic transition associated with
the thermal denaturation of a small beta protein. Biophys. J. 83:2792-2800
Sears VF (1966) Theory of Cold Neutron Scattering by Homonuclear Diatomic Liquids .2.
Hindered Rotation. Canadian Journal of Physics 44:1299-&
Smith JC (1991) Protein Dynamics - Comparison of Simulations with Inelastic Neutron-
Scattering Experiments. Q. Rev. Biophys. 24:227-291
Stradner A, Cardinaux F, Schurtenberger P (2006) A small-angle scattering study on equilibrium
clusters in lysozyme solutions. J. Phys. Chem. B 110:21222-21231
Stradner A, Foffi G, Dorsaz N, Thurston G, Schurtenberger P (2007) New insight into cataract
formation: Enhanced stability through mutual attraction. Phys. Rev. Let. 99:1-4
Stradner A, Sedgwick H, Cardinaux F, Poon WC, Egelhaaf SU, Schurtenberger P (2004)
Equilibrium cluster formation in concentrated protein solutions and colloids. Nature
432:492-5
Tang KES, Dill K (1998) Native protein fluctuations: the conformational-motion temperature and
the inverse correlation of protein flexibility with protein stability. J. Biomol. Struct. Dyn.
16:397-411
Tehei M, Franzetti B, Madern D, Ginzburg M, Ginzburg BZ, Giudici-Orticoni MT, Bruschi M,
Zaccai G (2004) Adaptation to extreme environments: macromolecular dynamics in
bacteria compared in vivo by neutron scattering. Embo Reports 5:66-70
Tehei M, Madern D, Pfister C, Zaccai G (2001) Fast dynamics of halophilic malate
dehydrogenase and BSA measured by neutron scattering under various solvent conditions
influencing protein stability. Proc. Nat. Acad. Sci. U.S.A. 98:14356-61
Teixeira J, Bellissentfunel MC, Chen SH, Dianoux AJ (1985) Experimental-Determination of the
Nature of Diffusive Motions of Water-Molecules at Low-Temperatures. Phys. Rev. A
31:1913-1917
Tokuyama M, Oppenheim I (1994) Dynamics of Hard-Sphere Suspensions. Phys. Rev. E 50:R16-
R19
Tsai AM, Udovic TJ, Neumann DA (2001) The inverse relationship between protein dynamics
and thermal stability. Biophys. J. 81:2339-2343

Hemoglobin Dynamics in Red Blood Cells
96
Volino F, Dianoux AJ (1980) Neutron Incoherent-Scattering Law for Diffusion in a Potential of
Spherical-Symmetry - General Formalism and Application to Diffusion inside a Sphere.
Mol. Phys. 41:271-279
Yan YB, Wang Q, He HW, Zhou HM (2004) Protein thermal aggregation involves distinct
regions: sequential events in the heat-induced unfolding and aggregation of hemoglobin.
Biophys. J. 86:1682-90
Zaccai G (2000) How soft is a protein? A protein dynamics force constant measured by neutron
scattering. Science. 288:1604-1607
Zanotti JM, Bellissent-Funel MC, Parello J (1999) Hydration-coupled dynamics in proteins
studied by neutron scattering and NMR: The case of the typical EF-hand calcium-binding
parvalbumin. Biophys. J. 76:2390-2411
Zerlin KF, Kasischke N, Digel I, Maggakis-Kelemen C, Temiz Artmann A, Porst D, Kayser P,
Linder P, Artmann GM (2007) Structural transition temperature of hemoglobins correlates
with species' body temperature. Eur. Biophys. J. 37:1-10
Zimmerman SB, Minton AP (1993) Macromolecular Crowding: Biochemical, Biophysical and
Physiological Consequences. Ann. Rev. Biophys. Biomol. Struct. 22:27-65

From Powder to Solution
97
5. From Powder to Solution: Hydration Dependence
of Human Hemoglobin Dynamics Correlated to Body
Temperature
Hemoglobin dynamics in concentrated solution and hydrated powder was measured with
elastic and quasielastic incoherent neutron scattering. Global protein diffusion is absent in
hydrated powder and strongly reduced in the solution sample at high concentration.
Hemoglobin centre of mass diffusion did not contribute to the measured signal on the time
scale of the used instruments. The experiments allowed the determination of internal protein
dynamics with high accuracy. Hemoglobin dynamics in concentrated solution showed a larger
flexibility above body temperature than expected from normal temperature dependence in
agreement with the body temperature transition of hemoglobin that has been interpreted as
partial unfolding. The results on hemoglobin dynamics in concentrated solution confirm the
body temperature transition of hemoglobin dynamics in whole red blood cells described in
chapter four of the thesis. Interestingly, the body temperature transition of hemoglobin
dynamics was absent in the hydrated powder sample. The hydration level was sufficient to
allow the well known dynamical transition at around 240 K. Therefore, protein specific
motions are present at physiological temperatures in the hydrated powder sample. However,
the rates of internal protein motion were suppressed in the hydrated powder sample compared
to concentrated hemoglobin solution.
Hydrated protein powder samples have been considered as good model systems for studies on
protein dynamics, and it was with such a sample, for example, that the dynamical transition at
about 200K was discovered. In the comparison of powder, solution and cell samples, we
concluded that fully hydrated protein powder samples might not accurately describe all
protein picosecond dynamics aspects that are necessary for biological function.
The following chapter is based on an article submitted to Biophysical Journal.

From Powder to Solution
98

From Powder to Solution
99
Submitted to Biophysical Journal
From Powder to Solution: Hydration Dependence of
Human Hemoglobin Dynamics Correlated to Body
Temperature
A. M. Stadler*,#,1, I. Digel§, J. P. Embs||,**, T. Unruh##, M. Tehei§§, ||||, G.
Zaccai*2, G. Büldt#, and G. M. Artmann§
* Institut Laue-Langevin, 38042 Grenoble, France;
# Research Centre Juelich, 52425 Jülich, Germany;
§ Institute of Bioengineering, Aachen University of Applied Science, 52428 Jülich, Germany;
|| Laboratory for Neutron Scattering ETH Zurich & Paul Scherrer Institut, 5232 Villigen-PSI,
Switzerland;
** Saarland University, Physical Chemistry, 66123 Saarbrücken, Germany;
## Technische Universität München, Forschungsneutronenquelle Heinz
Maier-Leibnitz (FRM II), 85747 Garching, Germany;
§§ School of Chemistry, University of Wollongong, 2522 Wollongong, Australia
|||| Australian Institute of Nuclear Science and Engineering (AINSE), Menai, Australia
corresponding author: [email protected]
Keywords: neutron scattering – quasielastic - protein dynamics – hemoglobin – body
temperature – hydration dependence
From Powder to Solution
100
5.1 Abstract
A transition in hemoglobin (Hb), involving partial unfolding and aggregation, has been shown
previously by various biophysical methods. The correlation between the transition
temperature and body temperature for Hb from different species, suggested that it might be
significant for biological function. In order to focus on such biologically relevant human Hb
dynamics, we studied the protein internal picosecond motions as a response to hydration, by
elastic and quasielastic neutron scattering. Rates of fast diffusive motions were found to be
significantly enhanced with increasing hydration from fully hydrated powder to concentrated
Hb solution. In concentrated protein solution, the data revealed that amino acid side-chains
can explore larger volumes above body temperature than expected from normal temperature
dependence. The body temperature transition in protein dynamics was absent in fully hydrated
powder, indicating that picosecond protein dynamics responsible for the transition is activated
only at a sufficient level of hydration. A collateral result from the study is that fully hydrated
protein powder samples do not accurately describe all aspects of protein picosecond dynamics
that might be necessary for biological function.

From Powder to Solution
101
5.2 Introduction
Hemoglobin (Hb) in red blood cells and at high concentration in solution shows a variety of
interesting effects (Artmann et al. 2008). Micropipette experiments with aspirated single
human red blood cells found a sudden passage phenomenon of the cells at a transition
temperature TPipette=36.4 ± 0.4°C close to human body temperature (36.6°C or 309.8 K)
(Artmann et al. 1998). The diameter of the micropipette (~1.5 µm ) was small compared to the
entire cells (~7 µm). Part of the cellular membrane is aspirated into the tight pipette tip and
forms a tongue. The major fraction of the cell forms a sphere filled with Hb outside of the
pipette. At temperatures lower than body temperature the cell cannot pass into the pipette
completely and blocks the tip. Above body temperature, the trailing sphere can be compressed
easily and all cells pass into the pipette with no apparent resistance (Artmann et al. 1998).
Under normal conditions the concentration of Hb in red blood cells is ~330 mg/ml (Krueger
and Nossal 1988). During the aspiration process below body temperature intracellular water is
pressed out of the red blood cell, and it was estimated that Hb concentration reaches values of
more than ~500 mg/ml (Artmann et al. 1998). Viscosity measurements were performed on Hb
solutions between 330 mg/ml and 500 mg/ml to study the flow properties at such
concentrations (Artmann et al. 1998). The experiments found a sharp drop in viscosity in
Arrhenius plots at concentrations higher than 450 mg/ml at body temperature. The drop was
absent at the physiological concentration of 330 mg/ml. The results were interpreted as a
colloidal phase transition in highly concentrated Hb solution from a gel-like to a fluid state at
body temperature (Artmann et al. 1998; Kelemen et al. 2001).
It has been further investigated, if the transition temperature of Hb is correlated to changes of
the protein structure; the thermal stability of Hb secondary structure was investigated with
circular dichroism spectroscopy (CD) (Artmann et al. 2004). The study showed a pronounced
loss of α-helical content at TCD=37.2 ± 0.6 °C, which is again close to human body
temperature. Interestingly, further CD experiments established that thermal stability of Hb
secondary structure of different animals is directly correlated to the corresponding body
temperature of the species. The results ranged from TCD=34.0±0.5°C for the duck-billed
platypus (body temperature 33.0±1.0°C) to TCD=42.0±1.0°C for a bird, the spotted nutcracker
(body temperature 42.2±0.5°C°C) (Digel et al. 2006; Zerlin et al. 2007). It has been
speculated that the mechanism behind Hb temperature behavior might be partial unfolding of

From Powder to Solution
102
the α-helical structure at body temperature, which goes in hand with an increase in surface
hydrophobicity that promotes protein aggregation (Digel et al. 2006).
Energy resolved incoherent neutron scattering is a powerful technique for the study of
dynamics of biological macromolecules and its dependence on environmental conditions.
Protein dynamics has been studied with neutron scattering in hydrated powders (Doster et al.
1989; Ferrand et al. 1993) and as a response to environmental conditions, in particular to the
level of hydration (Cornicchi et al. 2006; Paciaroni et al. 2002; Paciaroni et al. 2006). In the
past years, neutron scattering has been applied to study protein dynamics in whole cells in-
vivo (Doster and Longeville 2007; Jasnin et al. 2008; Stadler et al. 2008; Tehei et al. 2004), in
solution (Perez et al. 1999; Russo et al. 2002; Tehei et al. 2006), as well as recently in time-
resolved experiments after photo-excitation (Combet et al. 2008; Pieper et al. 2008).
Incoherent neutron scattering is dominated by hydrogen atom motions as their incoherent
scattering cross section is one order of magnitude bigger than that of all other elements which
usually occur in biological matter, and deuterium (Sears 1992). The technique probes average
protein dynamics because hydrogen atoms are uniformly distributed in the natural abundance
protein. The time and length scales of molecular motions that are accessible are determined by
the energy resolution and the scattering vector range of the instrument, respectively. In
general, the method covers the picosecond to nanosecond time range and angstrom length
scale. At this time-length scale, hydrogen atoms that are covalently bound to amino acid side-
chains reflect the dynamical behavior of these bigger chemical units (Reat et al. 1998; Smith
1991; Wood et al. 2008a). Below a so-called dynamical transition temperature of around 180-
240K protein dynamics is predominantly harmonic. Harmonic motions correspond to
vibrations of atoms around their structural equilibrium positions. Above the dynamical
transition, and at sufficient hydration, additional anharmonic motions are activated (Doster et
al. 1989; Ferrand et al. 1993; Lehnert et al. 1998). Depending on the energy resolution and
scattering vector range of the neutron spectrometer, a second inflection in the thermal
displacements, which is hydration-independent, was observed at a temperature between 100
and 150 K, and has been attributed to methyl group rotations (Cornicchi et al. 2006; Roh et al.
2006; Roh et al. 2005; Wood et al. 2007). These local jumps contribute to the sampling of a
large number of conformational substates that are responsible for the entropic stabilization of
proteins (Fraunfelder et al. 1991). From elastic incoherent neutron scattering (EINS) mean
square displacements <u2> of the thermal cloud of atomic motions can be determined. The
measured <u2> include both vibrational and diffusive motions (Reat et al. 1998). Quasielastic
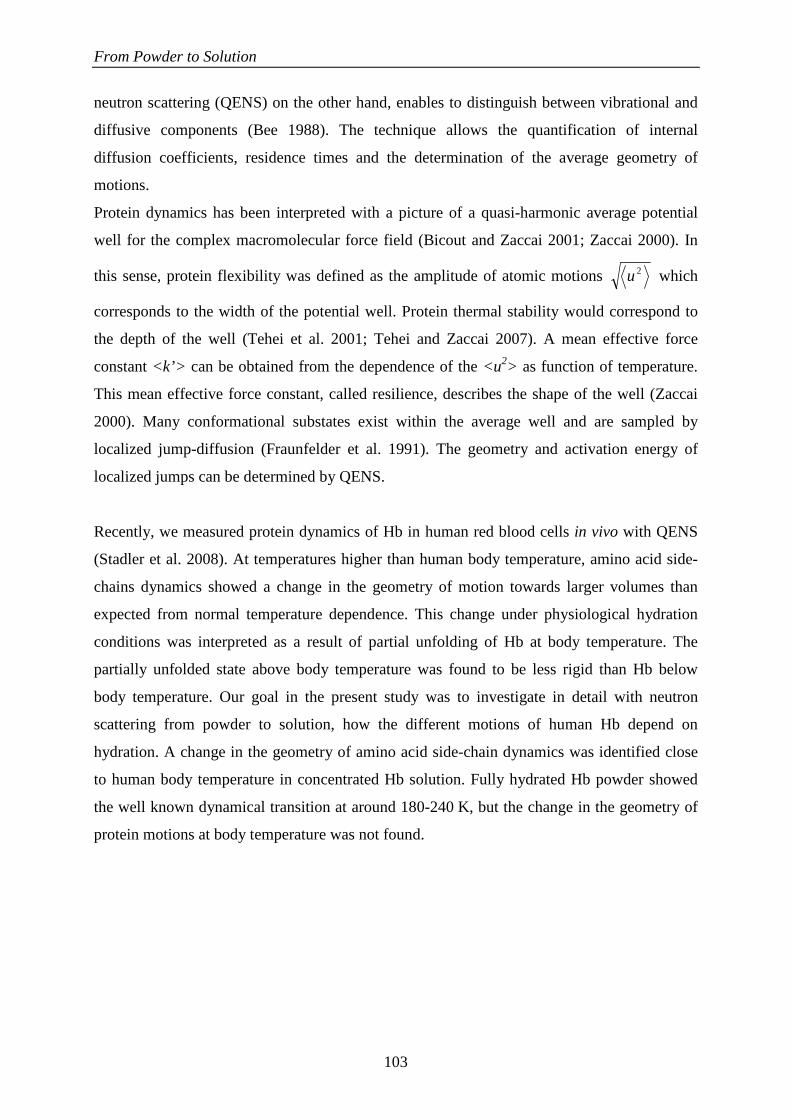
From Powder to Solution
103
neutron scattering (QENS) on the other hand, enables to distinguish between vibrational and
diffusive components (Bee 1988). The technique allows the quantification of internal
diffusion coefficients, residence times and the determination of the average geometry of
motions.
Protein dynamics has been interpreted with a picture of a quasi-harmonic average potential
well for the complex macromolecular force field (Bicout and Zaccai 2001; Zaccai 2000). In
this sense, protein flexibility was defined as the amplitude of atomic motions 2u which
corresponds to the width of the potential well. Protein thermal stability would correspond to
the depth of the well (Tehei et al. 2001; Tehei and Zaccai 2007). A mean effective force
constant <k’> can be obtained from the dependence of the <u2> as function of temperature.
This mean effective force constant, called resilience, describes the shape of the well (Zaccai
2000). Many conformational substates exist within the average well and are sampled by
localized jump-diffusion (Fraunfelder et al. 1991). The geometry and activation energy of
localized jumps can be determined by QENS.
Recently, we measured protein dynamics of Hb in human red blood cells in vivo with QENS
(Stadler et al. 2008). At temperatures higher than human body temperature, amino acid side-
chains dynamics showed a change in the geometry of motion towards larger volumes than
expected from normal temperature dependence. This change under physiological hydration
conditions was interpreted as a result of partial unfolding of Hb at body temperature. The
partially unfolded state above body temperature was found to be less rigid than Hb below
body temperature. Our goal in the present study was to investigate in detail with neutron
scattering from powder to solution, how the different motions of human Hb depend on
hydration. A change in the geometry of amino acid side-chain dynamics was identified close
to human body temperature in concentrated Hb solution. Fully hydrated Hb powder showed
the well known dynamical transition at around 180-240 K, but the change in the geometry of
protein motions at body temperature was not found.

From Powder to Solution
104
5.3 Material and Methods
5.3.1 Sample preparation
Human Hb was purchased from Sigma (Sigma-Aldrich, St. Louis, MO, USA). To remove the
exchangeable hydrogen atoms, around 1g protein was dissolved in 10 ml D2O and lyophilized
afterwards. For the preparation of the hydrated powder sample, D2O exchanged Hb powder
was dried over silica gel until no further loss of weight was observed. The dried powder was
then rehydrated in D2O atmosphere to a level of 0.4 g D2O/ 1 g protein. That level is not
sufficient to cover the protein surface with a complete monolayer (Ball 2008), but this amount
of non-freezing water permits the onset of anharmonic motions above the dynamical transition
temperature of around 180-240 K (Rupley and Careri 1991). In this article we consider this as
one full hydration layer. For the preparation of the Hb solution sample, D2O buffer
(0.1M KCl, 61.3 mM K2HPO4, 5.33 mM KH2PO4, pD 7.4) was added to the D2O exchanged
protein powder to a level of 1.1 g D2O/ 1 g. The obtained concentration (570 mg/ml)
corresponds to roughly three hydration layers. The concentration of potassium buffer was
chosen to resemble saline conditions in whole cells (Alberts B. 2002), but it shall be noted
that the choice of saline buffer can have an influence on protein dynamics (Gabel et al. 2004).
The samples were rapidly sealed in flat aluminum sample holders for the experiments. It was
checked by weighting that there occurred no loss of sample material during the experiment.
The scattering cross section of Hb in the concentrated solution was estimated to be >96% and
in hydrated powder to be >98.5%. Therefore, we neglected the contribution of the D2O
solvent to the measured data.
5.3.2 Neutron scattering experiments
The experiments were performed on the cold neutron multi-disk-chopper time-of-flight
spectrometer TOFTOF (Unruh et al. 2007) at the research reactor FRM-II (TU München,
Garching, Germany), on the cold neutron time-of-flight spectrometer FOCUS (Janssen et al.
1997), at the neutron spallation source SINQ (PSI, Villigen, Switzerland) and on the thermal
neutron backscattering spectrometer IN13 (Natali et al. 2008) at the ILL high flux research
reactor (ILL, Grenoble, France).

From Powder to Solution
105
On TOFTOF, the incident wavelength was set to 5.1 Å and a chopper frequency of
12,000 rpm was chosen which corresponds to a scattering vector independent instrument
resolution of approximately 100 µeV (full-width at half-maximum, FWHM). Hb in solution
was measured on TOFTOF between 280 K and 325 K. On FOCUS, the incident wavelength
was set to 6 Å, which corresponds to only a moderately scattering vector dependent elastic
energy resolution between 41 µeV (FWHM) at q=0.4 Å-1 and 61 µeV (FWHM) at q=1.6 Å-1.
Hydrated Hb powder was measured on FOCUS between 285 K and 322 K. The
backscattering spectrometer IN13 is characterized by an energy resolution of 8 µeV (FWHM)
and an incident wavelength of 2.23 Å. Hydrated Hb powder was measured between 20 K and
320 K on IN13. All samples, including the vanadium slab and empty sample holder, were
oriented at 135° with respect to the incident neutron beam direction.
The measured spectra were corrected for energy dependent detector efficiency, empty cell
scattering, normalized to vanadium, transformed into energy transfer and scattering vector
space, and corrected with a detailed balance factor. Data on IN13 were normalized to the
recorded intensities at 20 K instead of vanadium. On IN13 elastic neutron scattering was
measured between 0.2 Å-1 ≤ q ≤ 5.0 Å-1. TOFTOF data were binned into 16 groups with
0.5 Å-1 ≤ q ≤ 2.0 Å-1, FOCUS data were binned in 13 groups with 0.4 Å-1 ≤ q ≤ 1.6 Å-1. QENS
data reduction and analysis was done using the programs FRIDA for TOFTOF (Wuttke 2006)
and DAVE (2008) for FOCUS data. IN13 data were reduced with ILL standard programs.
Multiple scattering was neglected as the transmission of all samples was higher than 0.9.
The resolution function of the instruments was determined with vanadium measurements for
TOFTOF and FOCUS. The instrumental energy resolutions of ∆E= 8, 50 and 100 µeV
correspond to observable time scales in the order of ∆t~ 80, 13 and 7 ps, respectively, using
the relation Et ∆=∆ h .
5.3.3 Quasielastic Neutron Scattering Analysis
An exhaustive description of quasielastic neutron scattering can be found in Bée (Bee 1988).
The application to protein dynamics has been reviewed by Gabel et al. (Gabel et al. 2002) and
Smith (Smith 1991). QENS spectra in this study were well described with a theoretical
scattering function ),( ωqStheo that contains a delta-function for the fraction of hydrogen
atoms that appear localized within the time-space window of the instrument and one
Lorentzian ),( qL ω for the quasielastic signal,

From Powder to Solution
106
( ) ( ) ( ) ( )( ) ),(1, 00 ωωδω qLqAqAqStheo ×−+×= . ( 5.1 )
The elastic incoherent structure factor ( )qA0 (EISF) contains information about the geometry
of motions. Mean square displacements of fast vibrational motions vib
u2 (defined as the full
amplitude of the motion (Smith 1991)) were taken into account by a Debye-Waller factor
( )6/exp 22 quvib
− and were deduced from the scattering vector dependence of the summed
intensities (Tehei et al. 2006). The quasielastic component is a Lorentzian
( ) ( )( )22 qΓω
qΓqL
+⋅=
πω 1
, , with half-widths at half-maximum ( )qΓ .
The scattering function ),( ωqS plus background was convoluted with the instrumental
resolution function ( )ω,qSres and fitted to the measured data according to
( ) ( )[ ] ( )ωω ,,6/exp 022 qSBqSquS restheovibmeas ⊗+×−= . ( 5.2 )
The fits were performed over the energy transfer range from -1.5 meV to +1.5 meV for
TOFTOF data and over the energy transfer range from -0.75 meV to +0.75 meV for FOCUS
data.
Depending on the instrumental energy resolution and the used scattering vector range both
internal protein dynamics and global translational diffusion of the macromolecules contribute
to the measured signal in protein solution (Doster and Longeville 2007; Gaspar et al. 2008;
Perez et al. 1999; Russo et al. 2002; Stadler et al. 2008). Due to the high protein concentration
of our solution sample, global protein diffusion is strongly suppressed and cannot be resolved
with the energy resolution of 100 µeV of the spectrometer TOFTOF (Tehei et al. 2006). In
hydrated protein powders global macromolecular diffusion is absent. Therefore, it was
possible to perform the experiment on FOCUS with a higher energy resolution of 50 µeV.

From Powder to Solution
107
5.3.4 Elastic Neutron Scattering Analysis
Elastic incoherent neutron scattering on IN13 was interpreted in terms of the Gaussian
approximation. Mean square displacements <u2> were obtained from the scattering vector
dependence of the elastic intensity I(q) according to ( )( )
22 ln6
q
qIu
∆∆⋅−= , where we use the
definition of <u2> given by Smith that accounts for the full amplitude of motion (Smith
1991). This approach is formally similar to the Guinier approximation in small angle
scattering experiments (Guinier and Fournet 1955). The analogy to small angle scattering has
been discussed in (Gabel 2005; Réat et al. 1997). The obtained <u2> describe the spatial
extend of the atomic thermal motions and include both vibrational and diffusive dynamics.
The approximation is strictly valid for 02 →q but holds up to 2~22 qu ⋅ (Réat et al.
1997). The calculations were performed in the smallest accessible q2-range of IN13 data
between 0.04 Å-2 ≤ q2 ≤ 2.02 Å-2 in which the Gaussian approximation is valid. Mean force
constants <k> that describe the protein resilience were obtained from the slope of <u2>
versus temperature T according to ( )dTudk 200276.0= . Effective force constants <k’>
that include anharmonic dynamics of proteins were calculated according to
( )dTudk 200276.0' = in a quasi-harmonic approximation (Zaccai 2000). The units are
chosen so that <k> is in N/m when <u2> is in Å2 and T is in K.

From Powder to Solution
108
5.4 Results
5.4.1 Quasielastic Neutron Scattering
Typical quasielastic neutron scattering spectra of hydrated Hb powder at 285 K measured on
the spectrometer FOCUS and of Hb solution at 290 K measured on the instrument TOFTOF
are shown in Figure 1. The measured data could be described with an elastic peak for the
hydrogen fraction which appears localized in the time-length scale given by the energy
resolution and scattering vector range of the instrument, and one Lorentzian for diffusive
internal protein dynamics.
Conclusions about protein internal motions can be drawn from the q dependences of the
intensities and half-widths Γ(q) of the elastic peaks and the Lorentzians, respectively.
Information about the geometry of the motions is contained in the EISF A0(q), and about their
correlation times in Γ(q).
Hydrogen atoms that are covalently bound to amino acid side-chains reflect the dynamical
behaviour of the bigger chemical units (Reat et al. 1998; Wood et al. 2008a). The ‘diffusion in
a sphere’ model proposed by Volino and Dianoux (Volino and Dianoux 1980) accounts well
for the motions of amino acid side-chains which perform diffusive jumps in a spherical
volume restricted by neighboring amino acid side-chains. The radius can then be deduced
from
( ) ( ) ( ) 2
10
31
⋅−+=qa
qajppqA
, ( 5.3 )
where j1(qa) is the first-order spherical Bessel function of the first kind, a is the sphere radius,
and A0(q) is the EISF (Volino and Dianoux 1980). The populations of hydrogen atoms which
appear as immobile and mobile within the instrumental energy resolution are represented by
the fractions p and (1-p), respectively (Bellissent-Funel et al. 1992).
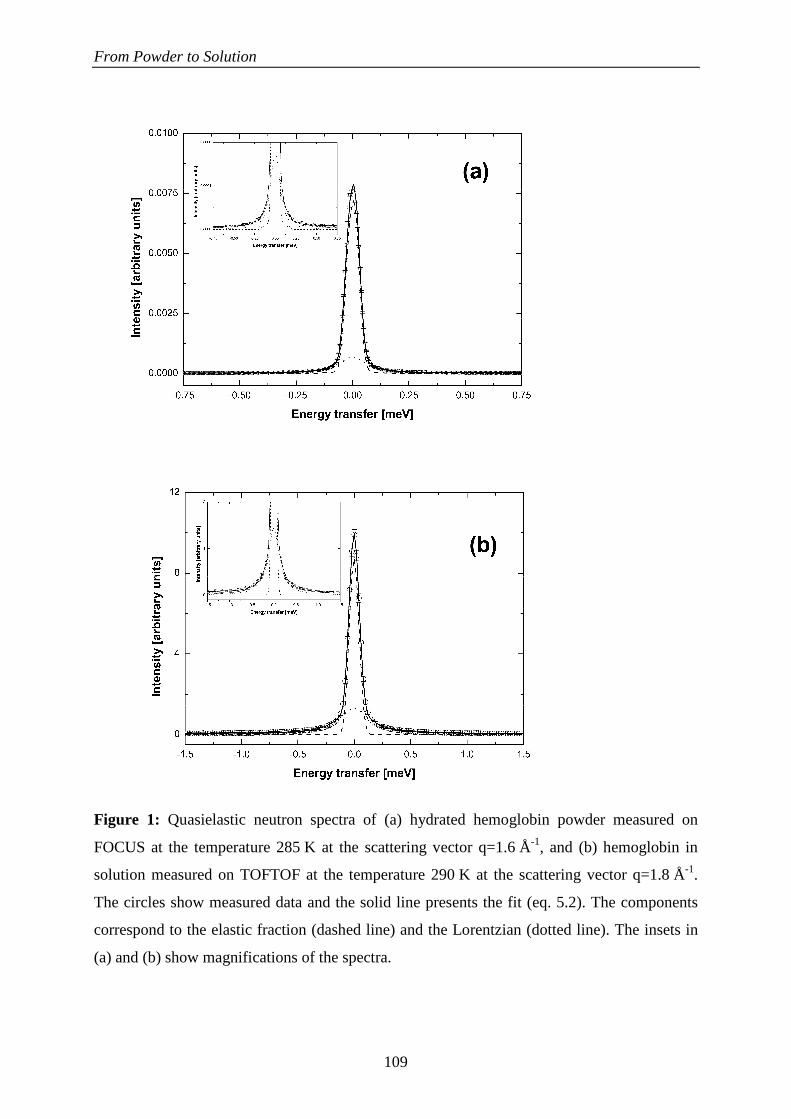
From Powder to Solution
109
Figure 1: Quasielastic neutron spectra of (a) hydrated hemoglobin powder measured on
FOCUS at the temperature 285 K at the scattering vector q=1.6 Å-1, and (b) hemoglobin in
solution measured on TOFTOF at the temperature 290 K at the scattering vector q=1.8 Å-1.
The circles show measured data and the solid line presents the fit (eq. 5.2). The components
correspond to the elastic fraction (dashed line) and the Lorentzian (dotted line). The insets in
(a) and (b) show magnifications of the spectra.
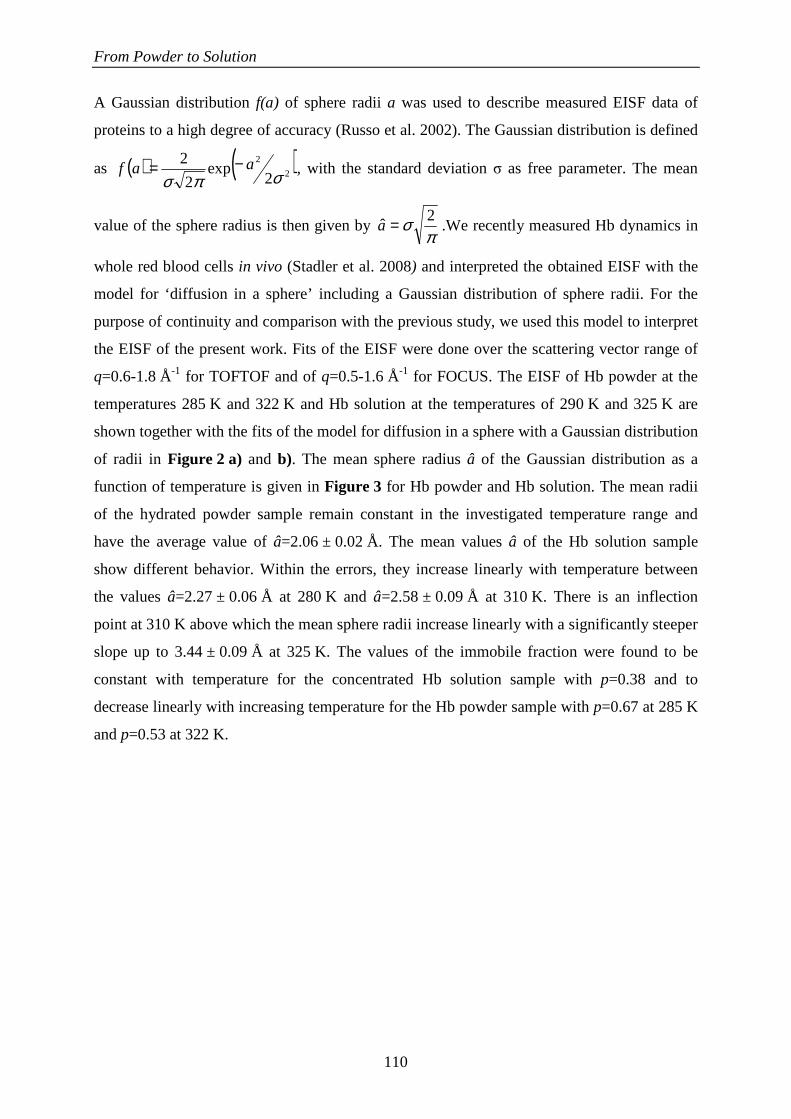
From Powder to Solution
110
A Gaussian distribution f(a) of sphere radii a was used to describe measured EISF data of
proteins to a high degree of accuracy (Russo et al. 2002). The Gaussian distribution is defined
as ( ) ( )2
2
2exp
2
2σπσ
aaf −= , with the standard deviation σ as free parameter. The mean
value of the sphere radius is then given by π
σ 2ˆ =a .We recently measured Hb dynamics in
whole red blood cells in vivo (Stadler et al. 2008) and interpreted the obtained EISF with the
model for ‘diffusion in a sphere’ including a Gaussian distribution of sphere radii. For the
purpose of continuity and comparison with the previous study, we used this model to interpret
the EISF of the present work. Fits of the EISF were done over the scattering vector range of
q=0.6-1.8 Å-1 for TOFTOF and of q=0.5-1.6 Å-1 for FOCUS. The EISF of Hb powder at the
temperatures 285 K and 322 K and Hb solution at the temperatures of 290 K and 325 K are
shown together with the fits of the model for diffusion in a sphere with a Gaussian distribution
of radii in Figure 2 a) and b). The mean sphere radius â of the Gaussian distribution as a
function of temperature is given in Figure 3 for Hb powder and Hb solution. The mean radii
of the hydrated powder sample remain constant in the investigated temperature range and
have the average value of â=2.06 ± 0.02 Å. The mean values â of the Hb solution sample
show different behavior. Within the errors, they increase linearly with temperature between
the values â=2.27 ± 0.06 Å at 280 K and â=2.58 ± 0.09 Å at 310 K. There is an inflection
point at 310 K above which the mean sphere radii increase linearly with a significantly steeper
slope up to 3.44 ± 0.09 Å at 325 K. The values of the immobile fraction were found to be
constant with temperature for the concentrated Hb solution sample with p=0.38 and to
decrease linearly with increasing temperature for the Hb powder sample with p=0.67 at 285 K
and p=0.53 at 322 K.

From Powder to Solution
111
Figure 2 (a) EISF of hydrated hemoglobin powder at the temperatures 285 K (squares) and
322 K (circles) measured on FOCUS, (b) EISF of hemoglobin solution at the temperatures
290 K (squares) and 325 K (circles) measured on TOFTOF. The error bars are within the
symbols. The solid lines present the fit (eq. 5.3) with a Gaussian distribution f(a) of radii. The
insets in (a) and (b) show the distributions f(a) at the indicated temperatures for hemoglobin
powder and solution, respectively.
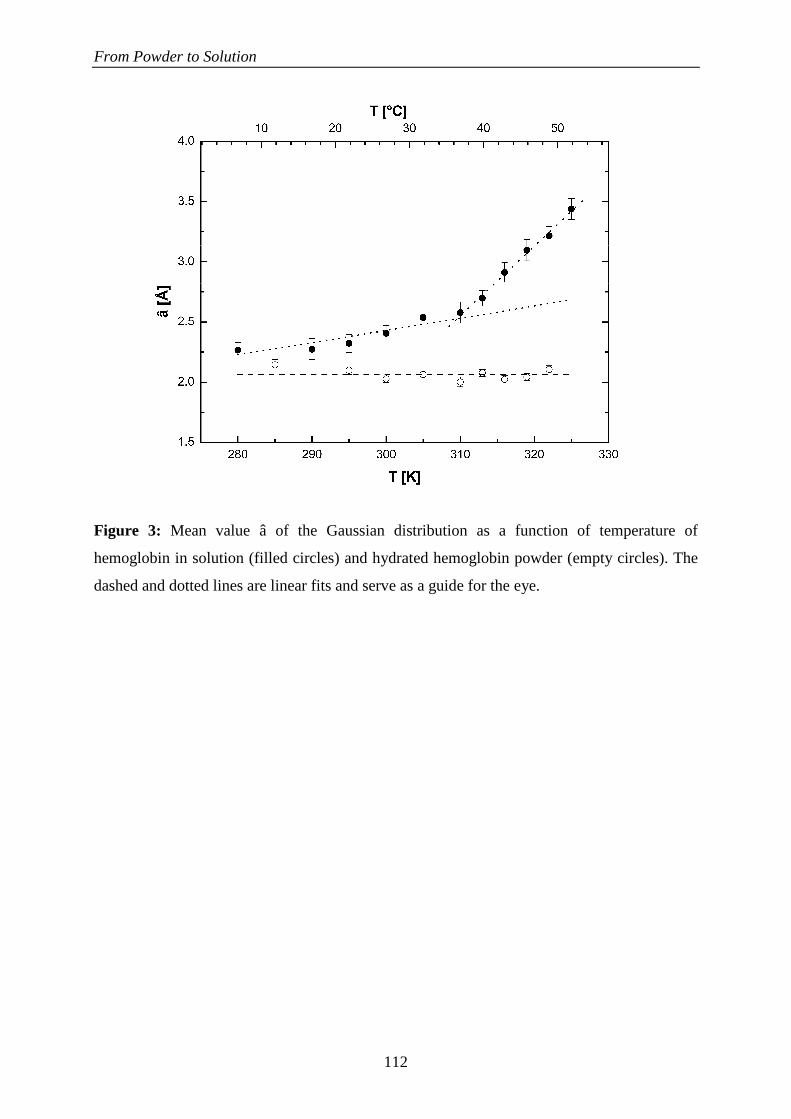
From Powder to Solution
112
Figure 3: Mean value â of the Gaussian distribution as a function of temperature of
hemoglobin in solution (filled circles) and hydrated hemoglobin powder (empty circles). The
dashed and dotted lines are linear fits and serve as a guide for the eye.

From Powder to Solution
113
The half-widths at half-maximum Γ of the Lorentzian are shown in Figure 4 as a function of
the squared scattering vector q2 at 285 K and 322 K for hydrated powder and at 290 K and
322 K for Hb solution. The measured half widths Γ of the Hb solution sample show clear
signs for restricted jump-diffusion (Hall and Ross 1981). The half widths Γ approach a
constant value Γ0 at small q2 at 290 K. Small q2-values correspond to larger real space
distances and the effects of boundaries on the dynamics of amino acid side-chains become
visible. At the highest measured temperature of 322 K the plateau due to confinement would
be visible only at very small q2 values and is outside of the instrumental accessible scattering
vector range as it was also found in protein solution (Bu et al. 2000). The limiting behavior of
Γ at small q2-values is approximately described by the Volino-Dianoux model for diffusion in
confined geometry (Volino and Dianoux 1980). The model assumes diffusion that is restricted
to a sphere of radius a. It predicts constant half widths Γ0 at q values smaller then aq π<
(Volino and Dianoux 1980). In the case of a distribution of sphere radii, the plateau ends at a
smaller value q’ than in the single sphere case as shown with molecular dynamics simulations
(Dellerue et al. 2001). We extracted the scattering vector positions from the article of Dellerue
et al. (Dellerue et al. 2001) and concluded that the value q’ is approximately 1.7 times smaller
for amino acid side-chain dynamics than predicted by the Volino-Dianoux model for a single
sphere of radius â that is the average value of the sphere distribution (Dellerue et al. 2001). In
our work, at the temperature of 290 K the obtained mean sphere radius is â=2.27 Å and at
322 K the mean radius is â=3.22 Å. The constant value Γ0 should therefore end at
( ) 22
2 7.07.1−=⋅= Åâq π at the temperature 290 K and at q2=0.3 Å-2 at the temperature 322 K.
The q resolution of the experiment is not very precise but the constant value of Γ0 at 290 K
ends between q2=0.64 Å-2 and 0.81 Å-2 which agrees well with the derived value from the
model. The constant value at 322 K would therefore be visible only below q2=0.3 Å-2 which
cannot be measured with the instrument. Additionally, this supports our assumption of a
distribution of sphere radii to describe the measured EISF.

From Powder to Solution
114
Figure 4: Half-widths at half-maximum Γ of the Lorentzian as a function of scattering vector
at different temperatures of hemoglobin in solution and as hydrated powder. The solid lines
are fits according to a jump-diffusion model in the q2-range from 0.64 Å-2 to 4.0 Å-2 and from
0.64 Å-2 to 2.56 Å-2.
At large scattering vector values of the Hb solution sample, the elementary nature of the
diffusive jumps of the amino acid side-chains becomes evident. As these jumps are not
infinitely small but occur over a finite length, the half-widths Γ approach asymptotically a
plateau ∞Γ at large q2. The behavior of the half-widths can be described by a model of jump-
diffusion according to τ2
2
1 Dq
Dq
+=Γ , with the residence time before a jump τ and the jump-
diffusion coefficient D (Bee 1988). Fits were done with the jump-diffusion model in the q2-
range between 0.64 Å-2 and 4.0 Å-2. The values of the residence time τ as a function of
temperature are presented in Figure 5. The obtained residence times follow the Arrhenius law
( ) Tk
E
B
a
eT ×= 0ττ , and we extracted an activation energy of Ea=1.45 ± 0.18 kcal/mol.
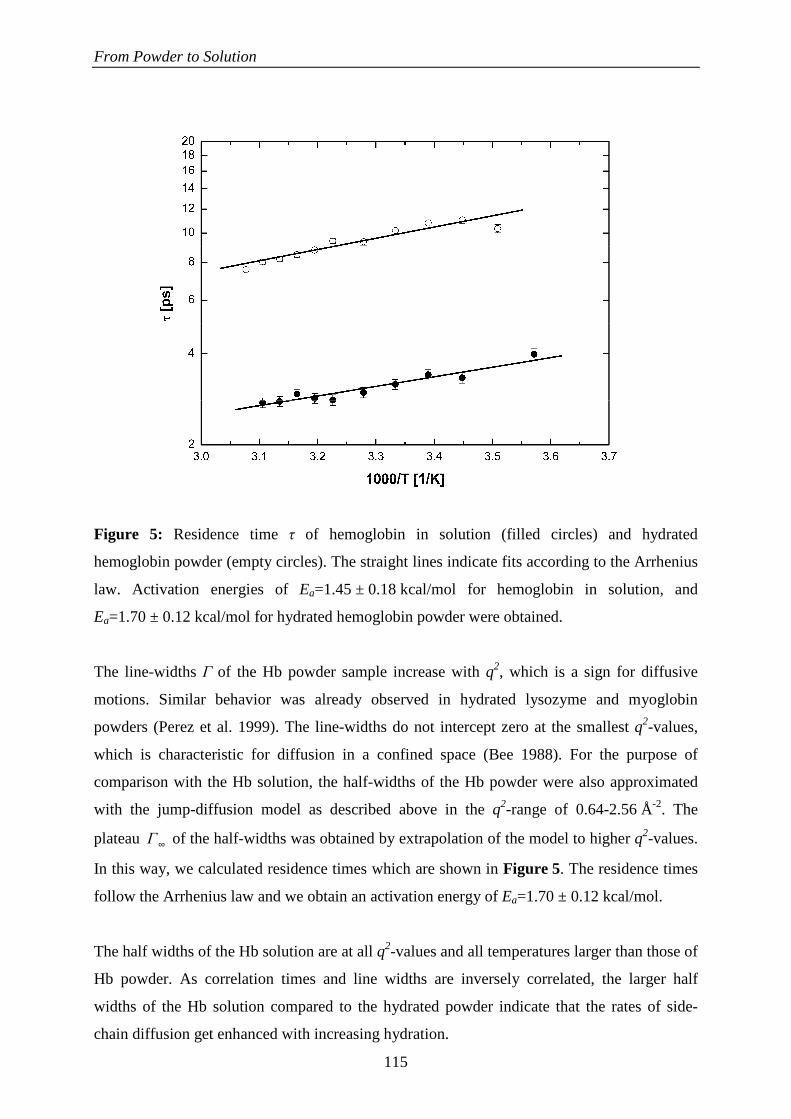
From Powder to Solution
115
Figure 5: Residence time τ of hemoglobin in solution (filled circles) and hydrated
hemoglobin powder (empty circles). The straight lines indicate fits according to the Arrhenius
law. Activation energies of Ea=1.45 ± 0.18 kcal/mol for hemoglobin in solution, and
Ea=1.70 ± 0.12 kcal/mol for hydrated hemoglobin powder were obtained.
The line-widths Γ of the Hb powder sample increase with q2, which is a sign for diffusive
motions. Similar behavior was already observed in hydrated lysozyme and myoglobin
powders (Perez et al. 1999). The line-widths do not intercept zero at the smallest q2-values,
which is characteristic for diffusion in a confined space (Bee 1988). For the purpose of
comparison with the Hb solution, the half-widths of the Hb powder were also approximated
with the jump-diffusion model as described above in the q2-range of 0.64-2.56 Å-2. The
plateau ∞Γ of the half-widths was obtained by extrapolation of the model to higher q2-values.
In this way, we calculated residence times which are shown in Figure 5. The residence times
follow the Arrhenius law and we obtain an activation energy of Ea=1.70 ± 0.12 kcal/mol.
The half widths of the Hb solution are at all q2-values and all temperatures larger than those of
Hb powder. As correlation times and line widths are inversely correlated, the larger half
widths of the Hb solution compared to the hydrated powder indicate that the rates of side-
chain diffusion get enhanced with increasing hydration.

From Powder to Solution
116
5.4.2 Elastic Neutron Scattering
Mean square displacements 2u of hydrated Hb powder measured on IN13 were calculated
from the data in the q2-range up to q2=2.02 Å-2 and are given in Figure 6. The 2u include
both vibrational and diffusive motions of protein dynamics and show the well known
dynamical transition at around 240 K (Doster et al. 1989; Ferrand et al. 1993; Parak et al.
1982). Values of the force constants of <k>=1.18 ± 0.29 N/m for the low temperature range
below 240 K and <k’> =0.17 ± 0.01 N/m for the high temperature range above 240 K were
obtained. QENS experiments allow the separation of vibrational and diffusive dynamics.
Mean square displacements of fast vibrational motions <u2>vib of the Hb powder sample
measured with QENS on FOCUS are presented in Figure 6. The <u2>vib agree with good
accuracy with expected values obtained from linear extrapolation of the low temperature
vibrational values <u2> measured on IN13.
Figure 6. Mean square displacements <u2> of hydrated hemoglobin powder measured on
IN13 (filled circles) and mean square displacements of fast vibrational motions <u2>vib (using
eq. 5.1 and 5.2) measured on FOCUS (empty circles). The error bars of <u2>vib are within the
symbols. The straight lines are linear fits to <u2> measured on IN13 below and above the
dynamical transition temperature. The energy resolution of IN13 is 8µeV.

From Powder to Solution
117
5.5 Discussion
It has previously been reported in the literature that protein flexibility is linked to protein
structure: A neutron scattering study found that β-sheet proteins are less flexible than α-helical
proteins. Proteins which consist of both α- and β-structure elements are more flexible than
pure α-helical proteins and unstructured proteins were found to be the most flexible ones
(Gaspar et al. 2008). Additionally, it has been shown that the unfolded state of lysozyme is
more flexible and less resilient than the folded state (De Francesco et al. 2004). Consistently
with these results, neutron scattering measurements of whole bacteria in vivo revealed that
average protein flexibility is increased and macromolecular resilience is reduced in heat
denatured bacteria cells as compared to native cells (Tehei et al. 2004). Furthermore, protein
flexibility, resilience and internal diffusion rates have been found to be closely linked to the
degree of hydration. Neutron scattering combined with hydrogen/ deuterium labeling of
specific amino acids allowed the determination of average protein dynamics and active core
fluctuations of bacteriorhodopsin as a function of hydration. Increasing the level of hydration
from dry powder to a complete hydration layer coverage of bacteriorhodopsin permitted the
onset of anharmonic motions above the dynamical transition temperature of around 180-
240 K at a certain threshold hydration; a further increase of hydration led to a decrease of
protein resilience (Lehnert et al. 1998; Paciaroni et al. 2002; Paciaroni et al. 2006; Wood et al.
2008b). Neutron scattering measurements of dry and hydrated protein powders, as well as of
protein solution showed that the rates and amplitudes of amino acid side-chains diffusion on
the protein surface are enhanced with higher hydration (Marconi et al. 2008; Perez et al.
1999). A study on lysozyme pointed out that internal protein dynamics get more activated
when the environment changes from being a stabilizer to a plasticizer with increasing
hydration (Paciaroni et al. 2002; Paciaroni et al. 2006). Paciaroni et al. (Paciaroni et al. 2002)
concluded that protein internal dynamics seems to be ruled on the whole by the dynamical
features of the environment. Further work on protein dynamics under physiological conditions
in E. coli showed that hydrated powders do not accurately represent the dynamical behavior of
macromolecules in whole cells. The higher amount of water in cells, as compared to fully
hydrated protein powders, increases internal molecular flexibility and diffusive motion rates
in the picosecond time-range (Jasnin et al. 2008).
We verified with EINS that the well know dynamical transition at around 240 K occurs at the
chosen hydration of the Hb powder sample. At low temperatures only solid-like vibrational
From Powder to Solution
118
motions are detected; at temperatures above the dynamical transition temperature Tc protein
specific quasi-diffusive motions are activated and contribute to the measured <u2> (Parak et
al. 1982). From QENS experiments vibrational and diffusive motions can be separated. As
expected, the obtained vibrational motions <u2>vib are in good agreement with linear
extrapolation of low temperature <u2> obtained from the EINS measurement. This supports
the concept of quasi-diffusive motions in proteins being activated at Tc that cause the
pronounced increase of <u2> at temperatures above Tc (Fraunfelder et al. 1991; Parak et al.
1982).
Our experiments revealed that increasing hydration of Hb has a strong influence on the rates
of diffusive motions. The residence times of amino acid side-chain jump-diffusion in Hb
solution lie between τ=4.0 ± 0.2 ps at 280 K and 2.8 ± 0.1 ps at 322 K, whereas we obtain
significantly higher residence times between τ=10.3 ± 0.3 ps at 285 K and τ=7.6 ± 0.4 ps at
325 K for hydrated Hb powder. The obtained activation energy Ea of the residence times
raises from 1.45 ± 0.18 kcal/mol for Hb solution to 1.70 ± 0.12 kcal/mol for hydrated Hb
powder. We conclude that an increase of hydration from a single layer to nearly three layers
enhances the rates of diffusive motions. The supplementary amount of water decreases the
activation energy barriers between diffusive jumps and thus facilitates protein dynamics, as
shown with QENS.
Protein folding and stability around body temperature is important for medical engineering
and of high relevance for medicine and biology in general. Artmann et al. (Artmann et al.
1998) reported a transition temperature of human Hb at body temperature that was interpreted
as Hb partial unfolding and acts as a precursor for protein aggregation. Further evidence for
perturbations of Hb secondary structure at a specific transition temperature came from CD
experiments (Digel et al. 2006; Zerlin et al. 2007). These studies of Digel et al. and Zerlin et
al. established the fact that the transition temperature of Hb from a big variety of different
animals is directly linked to the species’ body temperature. Sequence alignments of Hb of
different species were performed to identify an eventual region for the structural perturbation
(Zerlin et al. 2007). Hb tertiary structure is highly conserved in general. However, but it was
found that the amino acid sequences of the first two helices of the α- and β-subunits of Hb
were of low similarity (~40-50% similarity), whereas the other parts have significantly higher
similarity (~70-80% similarity), and especially the inner parts of the protein that are in close
contact to the heme groups are highly conserved (up to 100% similarity). The parts of low
From Powder to Solution
119
sequence similarity are located at external parts of the subunit and are solvent exposed. It was
suggested that these solvent-exposed amino acid residues might be responsible for the onset
of Hb partial unfolding and protein aggregation (Zerlin et al. 2007). In this work, we were
able to investigate the geometry of amino acid-side chain diffusion of Hb as a function of
temperature and hydration. QENS measurements allow an accurate analysis of protein
diffusive motions (Bee 1988). A study of Engler et al. (Engler et al. 2003) classified hydrogen
atoms in myoglobin in three dynamic groups: methyl group, long side-chain, and backbone
hydrogen atoms. The authors concluded that above the dynamical transition at around 180-
240 K mean square displacements measured by incoherent neutron scattering are dominated
by the side chains, whereas the main chain stays rather rigid on a time scale faster than 100 ps
(Engler et al. 2003). Therefore, in this study, we used the model of ‘diffusion in a sphere’
(Volino and Dianoux 1980) that is best suited to describe amino acid side-chain diffusion.
Amino acid side-chain dynamics within proteins were found to be characterized by a
distribution of flexibility. Side-chains in the protein interior are more rigid, whereas they
possess a higher degree of flexibility towards the outside of the protein (Dellerue et al. 2001).
The term flexibility corresponds in this sense to the restricted volume in which the amino acid
side-chains can move. A recent neutron scattering study on bacteriorhodopsin using hydrogen/
deuterium labeling concluded that a mixture of local environment and residue type defines
amino acid side-chain dynamics; further it was pointed out that different amino acids of the
same type have different dependencies on their environment (Wood et al. 2008a). Therefore,
we used an extended version of the ‘diffusion in a sphere’ model, which takes into account of
a distribution of sphere radii (Perez et al. 1999; Russo et al. 2002; Stadler et al. 2008). We do
not claim that the model by Volino and Dianoux (Volino and Dianoux 1980) which implies
motions in a sphere with impermeable surface is the most appropriate one to describe the
atomic nature of protein dynamics. However, it is able to describe the measured EISF with
high accuracy. As we are mostly interested in the temperature dependence of protein
flexibility, it is a valid approach to use this model for the purpose of comparison. We
observed a sudden change in the geometry of amino acid side-chains at human body
temperature towards larger volumes in concentrated Hb solution. This change at body
temperature was absent in hydrated protein powder.
In recent studies of Hb dynamics in red blood cells, the break at 310 K in the sphere radii was
interpreted as partial unfolding of Hb at human body temperature (Stadler et al. 2008). The
same interpretation is valid for the results of Hb in concentrated solution. In this sense, the
partially unfolded state of Hb solution at temperatures above 310 K has got higher flexibility

From Powder to Solution
120
than the low temperature state, as its distribution is shifted to larger volumes. The fact that
partial unfolding and the consequent changes of dynamics do not occur in hydrated powder
implies a crucial role of hydration in this process. It was previously suggested that solvent
accessible amino acid side-chains might be responsible for Hb partial unfolding (Digel et al.
2006; Zerlin et al. 2007). The experimental facts presented in this work justify this view.
Diffusive motion rates of side-chains are strongly suppressed in hydrated Hb powder as
compared to Hb in concentrated solution. We concluded previously that protein dynamics and
changes in the complex macromolecular force field might be responsible for structural
rearrangements and pronounced protein aggregation above body temperature (Stadler et al.
2008). The molecular properties of Hb therefore could determine in this sense the
macroscopic properties of whole red blood cells (Artmann et al. 1998). We identified a fast
process in the order of some picoseconds that is responsible for the change in geometry of
protein dynamics at body temperature. A sufficient level of hydration beyond one surface
layer is crucial for the activation of this fast process.
5.6 Conclusion
We studied protein dynamics of human Hb with elastic and quasielastic incoherent neutron
scattering from fully hydrated powder to highly concentrated solution. The change in the level
of hydration strongly influences the rates and activation energies of diffusive motions in the
order of some picoseconds. The geometry of amino acid side-chain diffusion was described
by a distribution of sphere radii that takes into account the polydispersity of internal protein
flexibility. Above 310 K and only in highly concentrated solution, amino acid side-chain
motions occupy larger volumes than expected from normal temperature dependence. These
results are in agreement with CD measurements and micropipette experiments that reported
partial unfolding of Hb and a passage transition of single red blood cells at body temperature
(Artmann et al. 1998; Artmann et al. 2008; Digel et al. 2006; Zerlin et al. 2007). The change
in Hb properties at body temperature was suggested to be related to biological function
(Artmann et al. 1998; Artmann et al. 2008; Stadler et al. 2008). Therefore, it was concluded
that dynamical processes of Hb in the order of a few picoseconds could be relevant for the
properties of whole cells. Fully hydrated powder samples might not accurately describe fast
protein dynamics that are relevant for biological function.

From Powder to Solution
121
5.7 Acknowledgments
This study is based on experiments performed at FRM-II, TU München, Garching, Germany,
at SINQ, PSI, Villigen, Switzerland, and at ILL, Grenoble, France. The research project was
supported by the European Commission under the 6th Framework Programme through the
Key Action: Strengthening the European Research Area, Research Infrastructures. Contract
n°: RII3-CT-2003-505925. We thank Prof. Dr. Judith Peters and Dr. Francesca Natali for
assistance on the instrument IN13, Dr. Marion Jasnin for fruitful discussion and critical
reading of the manuscript. M. Tehei acknowledges the ILL and the AINSE for financial
support.
5.8 References
(2008) DAVE Data Analysis and Visualisation Environment, http://www.ncnr.nist.gov/dave,
vol 2008
Alberts B. AJ, J. Lewis, M. Raff, K. Roberts, P. Walter (2002) Molecular biology of the cell,
4th edn. Garland Science, New York
Artmann GM, Burns L, Canaves JM, Temiz-Artmann A, Schmid-Schonbein GW, Chien S,
Maggakis-Kelemen C (2004) Circular dichroism spectra of human hemoglobin reveal
a reversible structural transition at body temperature. Eur. Biophys. J. 33:490-6
Artmann GM, Kelemen C, Porst D, Büldt G, Chien S (1998) Temperature transitions of
protein properties in human red blood cells. Biophys. J. 75:3179-83
Artmann GM, Zerlin KF, Digel I (2008) Hemoglobin Senses Body Temperature. In: Artmann
GM, Chien S (eds) Bioengineering in Cell and Tissue Research, vol IV. Springer
Verlag, Berlin, Heidelberg, pp 415-447
Ball P (2008) Water as an Active Constituent in Cell Biology. Chem. Phys. 108:74-108
Bee M (1988) Quasielastic neutron scattering. Principles and Applications in Solid State
Chemistry, Biology and Materials Science. Adam Hilger, Bristol and Philadelphia
Bellissent-Funel MC, Teixeira J, Bradley KF, Chen SH (1992) Dynamics of hydration water
in protein. J. Phys. I France 2:995-1001
Bicout DJ, Zaccai G (2001) Protein Flexibilty from the Dynamical Transition: A Force
Constant Analysis. Biophys. J. 80:1115-1123

From Powder to Solution
122
Bu Z, Neumann DA, Lee SH, Brown CM, Engelmann DM, Han CC (2000) A view of
dynamics changes in the molten globule-native folding step by quasielastic neutron
scattering. J. Mol. Biol. 301:525-536
Combet S, Pieper J, Coneggo F, Ambroise JP, Bellissent-Funel MC, Zanotti JM (2008)
Coupling of laser excitation and inelastic neutron scattering: attempt to probe the
dynamics of light-induced C-phycocyanin dynamics Eur. Biophys. J. 37:693-700
Cornicchi E, Marconi M, Onori G, Paciaroni A (2006) Controlling the Protein Dynamical
Transition with Sugar-Based Bioprotectant Matrices: A Neutron Scattering Study.
Biophys. J. 91
De Francesco A, Marconi M, Cinelli S, Onori G, Paciaroni A (2004) Picosecond Internal
Dynamics of Lysozyme as Affected by Thermal Unfolding in Nonaqueous
Environment. Biophys. J. 86:480-487
Dellerue S, Petrescu AJ, Smith JC, Bellissent-Funel MC (2001) Radially softening diffusive
motions in a globular protein. Biophys. J. 81:1666-76
Digel I, Maggakis-Kelemen C, Zerlin KF, Linder P, Kasischke N, Kayser P, Porst D, Temiz
Artmann A, Artmann GM (2006) Body temperature-related structural transitions of
monotremal and human hemoglobin. Biophys. J. 91:3014-21
Doster W, Cusack S, Petry W (1989) Dynamical transition of myoglobin revealed by inelastic
neutron scattering. Nature 337:754-6
Doster W, Longeville S (2007) Microscopic diffusion and hydrodynamic interactions of
hemoglobin in red blood cells. Biophys. J. 93:1360-8
Engler N, Ostermann A, Niimura N, Parak F (2003) Hydrogen atoms in proteins: Positions
and dynamics. Proc. Nat. Acad. Sci. U.S.A. 100:10243-10248
Ferrand M, Dianoux AJ, Petry W, Zaccai G (1993) Thermal Motions and Function of
Bacteriorhodopsin in Purple Membranes - Effects of Temperature and Hydration
Studied by Neutron-Scattering. Proc. Natl. Acad. Sci. U.S.A. 90:9668-9672
Fraunfelder H, Sligar SG, Wolynes PG (1991) The energy landscapes and motions of
proteins. Science 254:1598-1603
Gabel F (2005) Protein dynamics in solution and powder measured by incoherent elastic
neutron scattering: the influence of Q-range and energy resolution. Eur. Biophys. J.
34:1-12
Gabel F, Bicout D, Lehnert U, Tehei M, Weik M, Zaccai G (2002) Protein dynamics studied
by neutron scattering. Q. Rev. Biophys. 35:327-67

From Powder to Solution
123
Gabel F, Weik M, Doctor BP, Saxena A, Fournier D, Brochier L, Renault F, Masson P,
Silman I, Zaccai G (2004) The influence of solvent composition on global dynamics of
human butyrylcholinesterase powders: a neutron-scattering study. Biophys J 86:3152-
65
Gaspar AM, Appavou MS, Busch S, Unruh T, Doster W (2008) Dynamics of well-folded and
natively disordered proteins in solution: a time-of-flight neutron scattering study. Eur.
Biophys. J. 37:573-582
Guinier A, Fournet G (1955) Small Angle Scattering of X-Rays. Wiley, New York
Hall PL, Ross DK (1981) Incoherent neutron scattering functions for random jump diffusion
in bounded and infinite media. Mol. Phys. 42:673-682
Janssen S, Mesot J, Holitzner L, Furrer A, Hempelmann R (1997) FOCUS: A hybrid TOF-
spectrometer at SINQ. Physica B 234:1174-1176
Jasnin M, Moulin M, Haertlein M, Zaccai G, Tehei M (2008) In vivo measurement of internal
and global macromolecular motions in E. coli. Biophys. J. 95:857-864
Kelemen C, Chien S, Artmann GM (2001) Temperature transition of human hemoglobin at
body temperature: effects of calcium. Biophys. J. 80:2622-30
Krueger S, Nossal R (1988) SANS studies of interacting hemoglobin in intact erythrocytes.
Biophys. J. 53:97-105
Lehnert U, Reat V, Weik M, Zaccai G, Pfister C (1998) Thermal motions in
bacteriorhodopsin at different hydration levels studied by neutron scattering:
correlation with kinetics and light-induced conformational changes. Biophys. J.
75:1945-52
Marconi M, Cornicchi E, Onori G, Paciaroni A (2008) Comparative study of protein
dynamics in hydrated powders and in solution: A neutron scattering investigation.
Chem. Phys. 345:224-229
Natali F, Peters J, Russo D, Barbieri S, Chiapponi C, Cupane A, Deriu A, Di Bari MT, Farhi
E, Gerelli Y, Mariani P, Paciaroni A, Rivasseau C, Schirograve G, Sonvico F (2008)
IN13 Backscattering Spectrometer at ILL: Looking for Motions in Biological
Macromolecules and Organisms Neutron News 19:14-18
Paciaroni A, Cinelli S, Onori G (2002) Effect of the environment on the protein dynamical
transition: a neutron scattering study. Biophys. J. 83:1157-1164
Paciaroni A, Cornicchi E, De Francesco A, Marconi M, Onori G (2006) Conditioning action
of the environment on the protein dynamics studied through elastic neutron scattering.
Eur. Biophys. J. 35:591-599
From Powder to Solution
124
Parak F, Knapp EW, Kucheida D (1982) Protein dynamics. Mossbauer spectroscopy on
deoxymyoglobin crystals. J Mol Biol 161:177-94
Perez J, Zanotti JM, Durand D (1999) Evolution of the internal dynamics of two globular
proteins from dry powder to solution. Biophys. J. 77:454-69
Pieper J, Buchsteiner A, Dencher NA, Lechner RE, Hauss T (2008) Transient Protein
Softening during the Working Cycle of a Molecular Machine. Phys. Rev. Let.
100:228103
Reat V, Patzelt H, Ferrand M, Pfister C, Oesterhelt D, Zaccai G (1998) Dynamics of different
functional parts of bacteriorhodopsin: H-2H labeling and neutron scattering. Proc.
Natl. Acad. Sci. U.S.A. 95:4970-5
Réat V, Zaccai G, Ferrand M, Pfister C (1997) Functional dynamics in purple membranes
Biological Macromolecular Dynamics. Adenine Press, New York, pp 117-122
Roh JH, Curtis JE, Azzam S, Novikov VN, Peral I, Chowdhuri Z, Gregory RB, Sokolov AP
(2006) Influence of hydration on the dynamics of lysozyme. Biophys J 91:2573-88
Roh JH, Novikov VN, Gregory RB, Curtis JE, Chowdhuri Z, Sokolov AP (2005) Onsets of
anharmonicity in protein dynamics. Phys. Rev. Lett. 95:038101
Rupley JA, Careri G (1991) Protein Hydration and Function Adv. Prot. Chem. 41:37-172
Russo D, Perez J, Zanotti JM, Desmadril M, Durand D (2002) Dynamic transition associated
with the thermal denaturation of a small beta protein. Biophys. J. 83:2792-2800
Sears VF (1992) Neutron scattering lengths and cross sections. Neutron News 3:26-37
Smith JC (1991) Protein Dynamics - Comparison of Simulations with Inelastic Neutron-
Scattering Experiments. Q. Rev. Biophys. 24:227-291
Stadler AM, Digel I, Artmann GM, Embs JP, Zaccai G, Büldt G (2008) Hemoglobin
Dynamics in Red Blood Cells: Correlation to Body Temperature. Biophys. J. 95:5449-
5461
Tehei M, Franzetti B, Madern D, Ginzburg M, Ginzburg BZ, Giudici-Orticoni MT, Bruschi
M, Zaccai G (2004) Adaptation to extreme environments: macromolecular dynamics
in bacteria compared in vivo by neutron scattering. EMBO Reports 5:66-70
Tehei M, Madern D, Pfister C, Zaccai G (2001) Fast dynamics of halophilic malate
dehydrogenase and BSA measured by neutron scattering under various solvent
conditions influencing protein stability. Proc Natl Acad Sci U S A 98:14356-61
Tehei M, Smith JC, Monk C, Ollivier J, Oettl M, Kurkal V, Finney JL, Daniel RM (2006)
Dynamics of immobilized and native Escherichia coli dihydrofolate reductase by
quasielastic neutron scattering. Biophys. J. 90:1090-7

From Powder to Solution
125
Tehei M, Zaccai G (2007) Adaptation to high temperatures through macromolecular dynamics
by neutron scattering. Febs J 274:4034-43
Unruh T, Neuhaus J, Petry W (2007) The high-resolution time-of-flight spectrometer
TOFTOF. Nuclear Instruments and Methods in Physics Research Section A:
Accelerators, Spectrometers, Detectors and Associated Equipement 580:1414-1422
Volino F, Dianoux AJ (1980) Neutron Incoherent-Scattering Law for Diffusion in a Potential
of Spherical-Symmetry - General Formalism and Application to Diffusion inside a
Sphere. Mol. Phys. 41:271-279
Wood K, Grudinin S, Kessler B, Weik M, Johnson M, Kneller GR, Oesterhelt D, Zaccai G
(2008a) Dynamical Heterogeneity of Specific Amino Acids in Bacteriorhodopsin. J.
Mol. Biol. 380:581-591
Wood K, Lehnert U, Kessler B, Zaccai G, Oesterhelt D (2008b) Hydration dependence of
active core fluctuations in bacteriorhodopsin. Biophys. J. 95:194-202
Wood K, Plazanet M, Gabel F, Kessler B, Oesterhelt D, Tobias DJ, Zaccai G, Weik M (2007)
Coupling of protein and hydration-water dynamics in biological membranes. Proc.
Natl. Acad. Sci. U.S.A. 104:18049-54
Wuttke J (2006) FRIDA (fast reliable inelastic data analysis)
http://sourceforge.net/projects/frida
Zaccai G (2000) How soft is a protein? A protein dynamics force constant measured by
neutron scattering. Science. 288:1604-1607
Zerlin KF, Kasischke N, Digel I, Maggakis-Kelemen C, Temiz Artmann A, Porst D, Kayser
P, Linder P, Artmann GM (2007) Structural transition temperature of hemoglobins
correlates with species' body temperature. Eur. Biophys. J. 37:1-10

From Powder to Solution
126
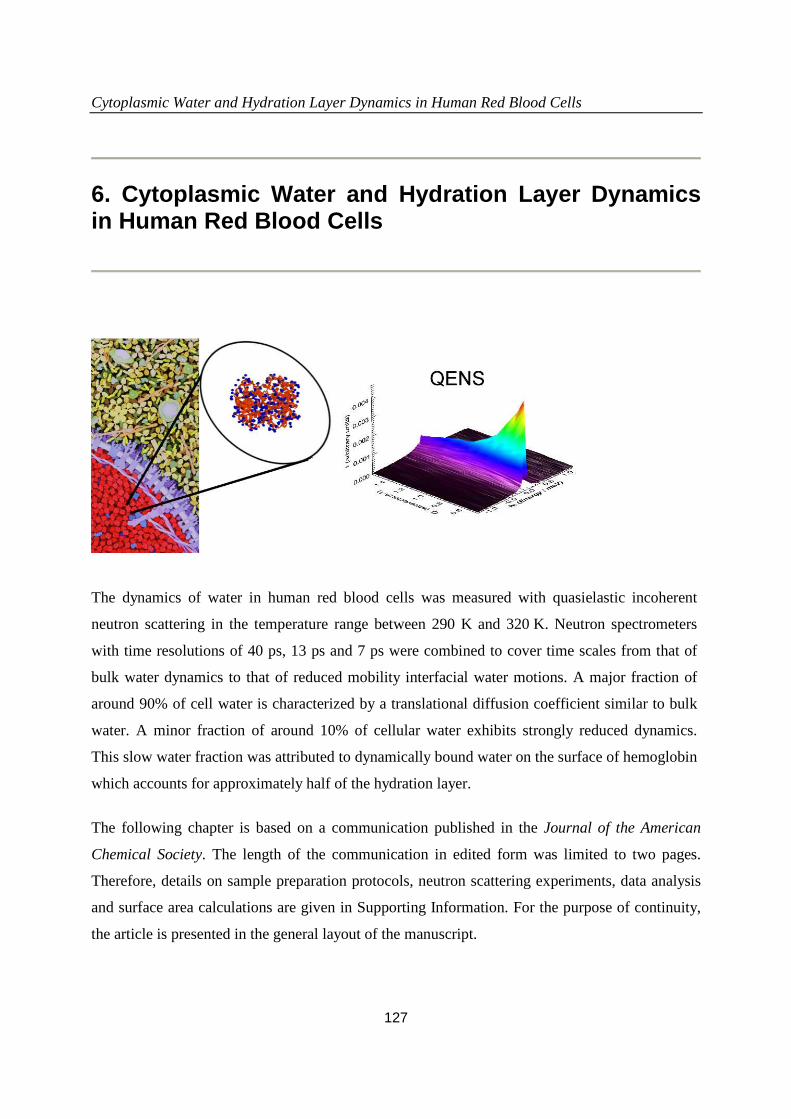
Cytoplasmic Water and Hydration Layer Dynamics in Human Red Blood Cells
127
6. Cytoplasmic Water and Hydration Layer Dynamics in Human Red Blood Cells
The dynamics of water in human red blood cells was measured with quasielastic incoherent
neutron scattering in the temperature range between 290 K and 320 K. Neutron spectrometers
with time resolutions of 40 ps, 13 ps and 7 ps were combined to cover time scales from that of
bulk water dynamics to that of reduced mobility interfacial water motions. A major fraction of
around 90% of cell water is characterized by a translational diffusion coefficient similar to bulk
water. A minor fraction of around 10% of cellular water exhibits strongly reduced dynamics.
This slow water fraction was attributed to dynamically bound water on the surface of hemoglobin
which accounts for approximately half of the hydration layer.
The following chapter is based on a communication published in the Journal of the American
Chemical Society. The length of the communication in edited form was limited to two pages.
Therefore, details on sample preparation protocols, neutron scattering experiments, data analysis
and surface area calculations are given in Supporting Information. For the purpose of continuity,
the article is presented in the general layout of the manuscript.

Cytoplasmic Water and Hydration Layer Dynamics in Human Red Blood Cells
128

Cytoplasmic Water and Hydration Layer Dynamics in Human Red Blood Cells
129
Journal of the American Chemical Society, December 2008, 130 (50): 16852–16853
Cytoplasmic Water and Hydration Layer Dynamics in
Human Red Blood Cells
Andreas M. Stadler†,‡, Jan P. Embs§,¶, Ilya Digel||, Gerhard M. Artmann||, Tobias
Unruh††, Georg Büldt‡, Giuseppe Zaccai*,†
ILL, 38042 Grenoble, France
Research Centre Jülich, 52425 Jülich, Germany;
LNS ETH Zurich & PSI, 5232 Villigen-PSI, Switzerland; Saarland University, 66123
Saarbrücken, Germany;
Aachen University of Applied Science, 52428 Jülich, Germany;
Technische Universität München, Forschungsneutronenquelle Heinz
Maier-Leibnitz (FRM II), 85747 Garching, Germany
corresponding authour: [email protected]
Cytoplasmic Water and Hydration Layer Dynamics in Human Red Blood Cells
130
6.1 Introduction
Water is essential to life and a major scientific interest lies in a detailed understanding of how it
interacts with biological macromolecules in cells. The cellular environment is extremely crowded
with macromolecular concentrations up to 400 mg/ml (Ellis and Minton 2003). Distances
between macromolecules are in the order of 1 nm, which corresponds to only few layers of water.
Water that is in close contact with hydrophilic or hydrophobic protein surfaces (Russo et al.
2005) or which is trapped in surface cavities (Makarov et al. 2000) is shown to have significantly
different behavior than bulk water. Recent studies point out that a major fraction of water in cells
and bacteria shows bulk like dynamics (Jasnin et al. 2008; Persson and Halle 2008). We
measured quasielastic incoherent neutron scattering (QENS) of H2O in red blood cells (RBC), in
vivo. The data revealed two populations of water in RBC: a major fraction of ~90% which has
translational properties similar to those of bulk water (time scale ~ps) and a minor fraction of
~10% which is interpreted as bound hydration water with significantly slower dynamics (time
scale ~40 ps).
6.2 Material and Methods
QENS is a well-suited technique to study water dynamics in the ps-ns and Å time and length
scale, respectively. Incoherent neutron scattering predominantly detects the motion of hydrogen
nuclei, which have an incoherent scattering cross section which is more than 40 times larger than
all other elements that occur in biological matter, and deuterium (Gabel et al. 2002). By
subtracting experimental data of natural abundance RBC in D2O buffer from natural abundance
RBC in H2O buffer, the cytoplasmic dynamics of H2O was separated from membrane and
macromolecular dynamics. RBC consist mostly of H2O and hemoglobin at a concentration of
~330 mg/ml (Krueger and Nossal 1988). Samples of human venous blood were prepared in H2O
and D2O HEPES buffer (see Supporting Information). Extracellular water content was found to
be less than 10% of the total water content. We estimate that the incoherent cross section of the
intracellular H2O is more than three times that of the macromolecules. In D2O, the incoherent
cross section of water is 8% that of the macromolecules. The difference is therefore dominated
by the water signal, and we neglected changes in membrane and macromolecular dynamics due
to isotope effects. Energy resolved neutron scattering was measured on the spectrometers IRIS at

Cytoplasmic Water and Hydration Layer Dynamics in Human Red Blood Cells
131
ISIS, FOCUS at PSI and TOFTOF at FRM-II. A neutron spectrometer is characterized by its
energy resolution and scattering vector (q) range, which determine the observable time and
lengths scales of hydrogen motions. The energy resolution of the instruments IRIS, FOCUS and
TOFTOF was 17 µeV, 50 µeV and 100 µeV, respectively, corresponding to longest observable
times scales in the order of 40 ps, 13 ps and 7 ps. The theoretical scattering function of water
dynamics is well described by a narrow and a broad Lorentzian for translational and rotational
diffusion, and a delta function for the fraction of slow hydrogen motions that appear localized on
the time scale corresponding to the energy resolution of the instrument (Bee 1988). The
dependence of the half-widths at half-maximum (HWHM) of the narrow Lorentzian as a function
of q yields information about the atomic scale translational diffusion process (Bee 1988) (see 6.8
Supporting Information).

Cytoplasmic Water and Hydration Layer Dynamics in Human Red Blood Cells
132
6.3 Results
The HWHM of cytoplasmic H2O measured on IRIS are shown with fits according to a jump-
diffusion model in Figure 1 a); in Figure 1 b) a measured spectrum on FOCUS together with the
fitted components is given.
Figure 1: a) Half-widths at half-maximum of the translational diffusion process of cytoplasmic
H2O in RBC measured on IRIS at different temperatures. Solid lines represent fits according to a
jump-diffusion model. b) QENS spectrum on FOCUS of cytoplasmic H2O in RBC at 290 K and
q=0.55 Å-1. Symbols show measured data, the black line presents the result of the fit. The
components correspond to the immobile fraction (red line), the narrow Lorentzian (green line)
and the broad Lorentzian (blue line).
Figure 2 a) reports the obtained translational diffusion coefficients D of H2O buffer and
cytoplasmic H2O as a function of temperature measured with IRIS, FOCUS and TOFTOF. The
data demonstrate that the translational diffusion coefficient of cellular water is nearly identical to
H2O buffer on all spectrometers. The dashed line indicates normal temperature behavior of H2O
buffer following an Arrhenius law and serves as reference. The measured diffusion coefficients
of intracellular water with the instrument IRIS show perfect agreement with the reference; the
results of TOFTOF and FOCUS deviate only slightly above and below, respectively. Residence
times were found to be larger in intracellular than in bulk water (see 6.8 Supporting Information).
The results indicate that translational diffusion of water in RBC behaves similarly to bulk water.
Cytoplasmic Water and Hydration Layer Dynamics in Human Red Blood Cells
133
A QENS study on translational and rotational diffusion of water in Escherichia coli concluded
that the main fraction of intracellular water shows similar dynamic behavior as bulk water with
residence times twice as long (Jasnin et al. 2008). NMR work on rotational diffusion of
cytoplasmic water found that approximately 85% of cell water in Escherichia coli has bulk-like
dynamics (Persson and Halle 2008).
We could identify a significant fraction of immobile water in RBC that is absent in H2O buffer.
The immobile water fraction was determined by the amplitude of the elastic peak divided by the
integrated total intensity. Experimental data is presented in Figure 2 b) for the smallest
accessible scattering vector of q~0.6 Å-1 which reports on all movements up to around 10 Å real
space distance. On this length scale confining effects of protein surface cavities or boundaries on
water become observable. From the q dependence of the elastic intensity we estimated root mean
square displacements <u2>1/2 of ~2.3 Å and ~2.1 Å for IRIS and FOCUS, respectively, which are
smaller than the mean distance between water molecules (around 3 Å) and emphasize the
localized nature of immobile water. Immobile water correlation times need to be longer than
around 40 ps which is the time resolution of the high resolution spectrometer IRIS.
The obtained immobile water fraction of the RBC sample varies between 11% and 8% in the
investigated temperature range. The uncertainty due to background subtraction was estimated to
be below 2%. In contrast, the immobile fraction of H2O buffer is below 1% at all temperatures.
The temperature dependence of the immobile fraction of H2O in RBC follows Arrhenius
behavior with an activation energy of Ea=2.15 ± 0.10 kcal/mol.
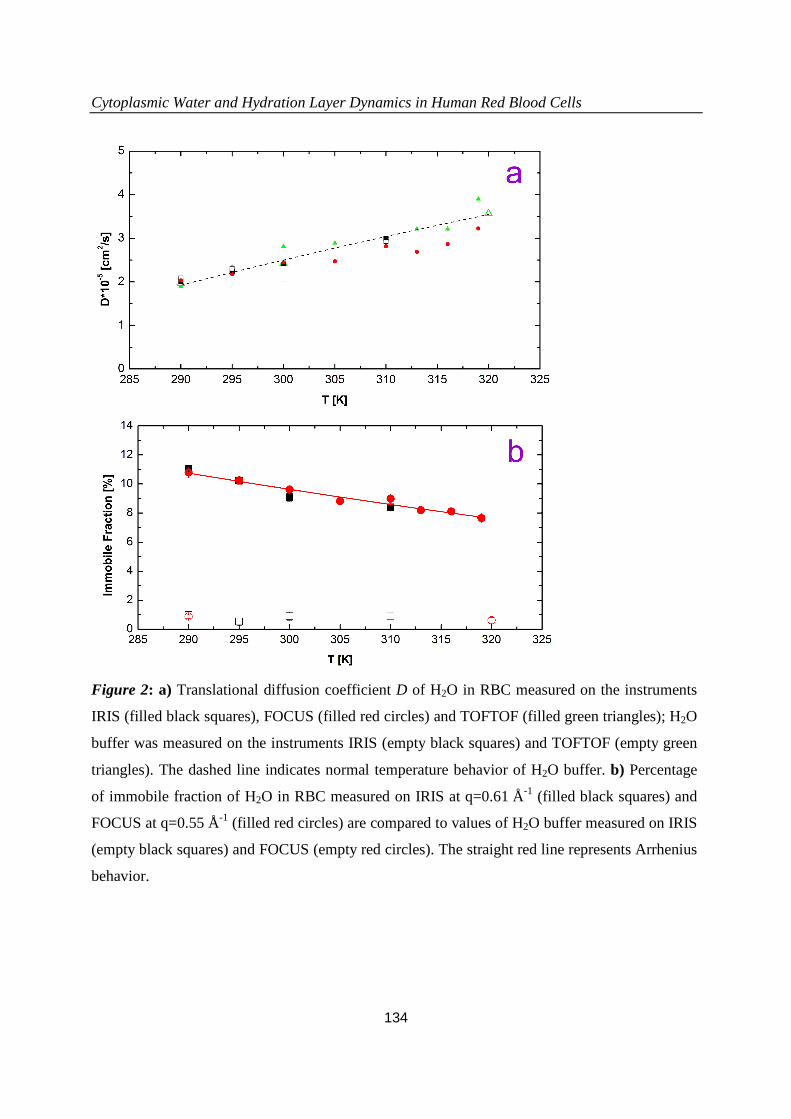
Cytoplasmic Water and Hydration Layer Dynamics in Human Red Blood Cells
134
Figure 2: a) Translational diffusion coefficient D of H2O in RBC measured on the instruments
IRIS (filled black squares), FOCUS (filled red circles) and TOFTOF (filled green triangles); H2O
buffer was measured on the instruments IRIS (empty black squares) and TOFTOF (empty green
triangles). The dashed line indicates normal temperature behavior of H2O buffer. b) Percentage
of immobile fraction of H2O in RBC measured on IRIS at q=0.61 Å-1 (filled black squares) and
FOCUS at q=0.55 Å-1 (filled red circles) are compared to values of H2O buffer measured on IRIS
(empty black squares) and FOCUS (empty red circles). The straight red line represents Arrhenius
behavior.

Cytoplasmic Water and Hydration Layer Dynamics in Human Red Blood Cells
135
6.4 Discussion
Hydrodynamic calculations of hemoglobin needed to include a bound water coverage of around
50% of the first hydration layer to predict quantitatively experimentally measured hydrodynamic
parameters (Garcia de la Torre 2001). We estimated that approximately 2300 water molecules are
in the first hydration layer of hemoglobin (see 6.8 Supporting Information). A study with High-
Frequency Dielectric Spectroscopy (between 45 MHz-20 GHz) reported a value of 1030±70
dynamically bound H2O molecules on the surface of hemoglobin with highly restricted rotational
dynamics (Wei et al. 1994) corresponding to a ~50% occupation of the first hydration layer. Site-
directed tryptophan mutations combined with femtosecond spectroscopy identified two water
populations in the protein hydration layer with fast (~1-8 ps) and slow (~20-200 ps) dynamics
(Zhang et al. 2007). Assuming a cellular hemoglobin concentration of ~330 mg/ml,
approximately 28% of all cellular water molecules are in direct contact with the surface of
hemoglobin. Considering half of the first hydration layer to be bound, roughly 14% of
cytoplasmic water would be bound in the protein hydration layer. This value is remarkably close
to our results of the immobile water fraction. We therefore conclude that there exist two
populations of water in RBC: a major fraction of ~90% which has translational properties similar
to bulk water and a fraction of ~10% of immobile water which could be identified as dynamically
bound water in the hydration layer of hemoglobin, in vivo. This bound hydration water should
have important properties concerning protein stability and interactions in living cells.
6.5 Acknowledgment
We thank Franz Demmel for help with the experiment on IRIS, Aysegül Temiz Artmann and
Dariusz Porst for help during sample preparation, Moeava Tehei and Marion Jasnin for fruitful
discussions. This work is based on experiments performed at the neutron sources SINQ FRM II
and ISIS. This research project has been supported by the European Commission under the 6th
Framework Programme through the Key Action: Strengthening the European Research Area,
Research Infrastructures. Contract n°: RII3-CT-2003-505925
Cytoplasmic Water and Hydration Layer Dynamics in Human Red Blood Cells
136
6.6 Supporting Information
6.6.1 Sample preparation
For neutron scattering experiments, samples of human venous blood from healthy adults were
drawn with tubes containing heparin to prevent blood coagulation. The blood samples were
suspended in HEPES buffer solution at pH=7.4 and 290 mOsm (137 mM NaCl, 4 mM KCl,
1.8 mM CaCl2, 0.8 mM Na2HPO4, 0.2 mM NaH2PO4, 0.7 mM MgSO4, 8.4 mM HEPES, 4 mM
NaOH). The cells were washed twice and collected by centrifugation at 560 rcf for 10 min. The
supernatant was removed together with the ‘buffy coat’ on top of the cells. The washed cells and
the successively used buffer solutions were then gassed with CO to increase the stability of
hemoglobin. The cells were resuspended in TRIS buffer (20 mM TRIS, 145 mM NaCl) at
pH=5.5 and treated with neuraminidase (from Clostridium perfringens Type VI, purchased from
Sigma-Aldrich) to remove the glycocalyx matrix as described elsewhere (Elgsaeter and Branton
1974). Afterwards the cells were washed in H2O HEPES buffer. To reduce the neutron scattering
contribution of the buffer, a portion of the cells were washed with D2O HEPES buffer (pD=7.4,
290 mOsm), incubated for around 30 min and centrifuged at 560 relative centrifugal force. The
washing steps were repeated until the level of H2O was estimated to be below 0.1 vol% assuming
that the H2O-D2O exchange through the cell membrane reaches a constant value in this time. No
cell lysis was detected during the preparation and the shape of the cells was checked with optical
microscopy at the end. After a final centrifugation step the cell pellet was sealed in a flat
aluminum sample holder of 0.2 mm thickness for the neutron scattering experiment. The
scattering from the aluminum screws was blocked using a cadmium mask. It was checked by
weighing that there occurred no loss of sample material during the experiment.
The amount of water in the cell sample was determined by drying of an aliquot. Taking into
account a cellular hemoglobin concentration of 330 mg/ml, we obtained an extracellular water
content of less then 10%.

Cytoplasmic Water and Hydration Layer Dynamics in Human Red Blood Cells
137
6.6.2 Neutron experiments
High resolution neutron scattering was measured on the inverted time-of-flight backscattering
spectrometer IRIS (Carlile and Adams 1992) at the ISIS neutron spallation source (Rutherford
Appleton Laboratory, Didcot, United Kingdom). The energy resolution of the instrument was
approximately 17 µeV. Neutron scattering with middle energy resolution was measured on the
cold time-of-flight spectrometer FOCUS (Janssen et al. 1997) at the neutron spallation source
SINQ (Paul Scherrer Institut, Villigen, Switzerland). The incident wavelength was set to 6 Å,
yielding an average energy resolution of around 50 µeV. Low resolution neutron scattering was
measured on the cold neutron time-of-flight spectrometer TOFTOF (Unruh et al. 2007) at the
research reactor FRM-II (Research Reactor Heinz Maier-Leibnitz, Garching, Germany). The
incident wavelength was set to 5.1 Å and the chopper speed to 12000 rpm which corresponds to
an instrument resolution at the elastic line of approximately 100 µeV.
Samples were measured in the temperature range of 290 K to 320 K in which no hemolysis
occurs. All samples, including the 1 mm thick vanadium slab and empty sample holder, were
oriented at 135° with respect to the incident neutron beam direction. Measured data of the cell
sample in D2O buffer was subtracted from data of the cell sample in H2O buffer to obtain the
contribution of H2O. Experimental data of RBC samples in H2O buffer and D2O buffer measured
on the instrument FOCUS at 290 K are shown in Figure 3. The relatively big difference of both
samples allowed a clear separation of the H2O contribution.
In the case of vanadium which gives purely incoherent and isotropic scattering and H2O HEPES
buffer, the empty cell was subtracted instead. The measured time-of-flight spectra were
normalized to vanadium, transformed into energy transfer and scattering vector space and
corrected with a detailed balance factor. IRIS data was binned into 17 groups with
0.48 Å-1 ≤ q ≤ 1.85 Å-1, FOCUS data was binned in 12 groups with 0.5 Å-1 ≤ q ≤ 1.6 Å-1,
TOFTOF data in 13 groups with 0.6 Å-1 ≤ q ≤ 1.8 Å-1. The instrumental energy resolution was
measured with vanadium. Data treatment and analysis was done with the instrument specific
program packages DAVE (2008a), IDA (Wuttke) and MODES (2008b). Multiple scattering was
neglected as the transmission of all samples was higher than 0.9.

Cytoplasmic Water and Hydration Layer Dynamics in Human Red Blood Cells
138
Figure 3: Experimental QENS data of RBC in H2O and D2O buffer measured on FOCUS at the
temperature 290 K and at the scattering vector q=0.55 Å-1. The larger intensities of the elastic
and quasielastic part of RBC in H2O buffer as compared to RBC in D2O buffer result from H2O
dynamics.
6.6.3 Data analysis
The theoretical scattering function for translational and rotational diffusion of water can be
approximated as (Bee 1988)
( ) ( )( )
( ) ( )( ) ( )[ ]
Γ+Γ+Γ+Γ
⋅+Γ+
Γ⋅= ⋅−
222221 )()(,22
qqqA
q
qqAeqS
RT
RT
T
Tqx
theo ωωω , ( 6.1 )
where 2x stands for the mean square displacement of fast vibrational motion; the first
Lorentzian in the curly brackets represents translational diffusion, the second Lorentzian
Cytoplasmic Water and Hydration Layer Dynamics in Human Red Blood Cells
139
combines translational and rotational diffusion with the half-widths at half-maximum (HWHM)
( )qTΓ and ( )qRΓ , respectively. The experimental measured scattering function ( )ω,exp qS is
obtained by convolution of ( )ω,qStheo with the instrumental energy resolution ( )ω,qSres
according to
( ) ( ) ( ) ( ) ( )ωωωδω ,,, 00exp
22
qSBqSqAeqS restheo
qx ⊗
++⋅⋅= −
, ( 6.2 )
where ( )qA0 is the elastic incoherent structure factor of slow hydrogen dynamics that appear
immobile within the instrumental energy resolution and 0B is linear background.
All QENS data were fitted according to equations (6.1) and (6.2): IRIS data was described well
with only one Lorentzian for translational diffusion. Fits were performed in the energy range of
-0.5 meV to +0.5 meV. Rotational diffusion of water can be treated as flat background on IRIS in
the investigated energy range. Focus data was described by two Lorentzians and the data was
fitted in the energy range of -1.25 meV to +1.25 meV. TOFTOF data was fitted by two
Lorentzians in the energy range of -1.5 meV to +1.5 meV.
The HWHM of translational diffusion ( )qTΓ were best fitted with a jump-diffusion model given
by (Bee 1988) ( )0
2
2
1 τDq
DqqT +
=Γ , with the translational diffusion coefficient D and the
residence time between jumps 0τ . HWHM ( )qTΓ of H2O in RBC and H2O buffer measured on
TOFTOF, FOCUS and IRIS are shown with fits according to a jump-diffusion model in
Figure 4.

Cytoplasmic Water and Hydration Layer Dynamics in Human Red Blood Cells
140
The residence times 0τ of water in RBC were up to 4 times larger than those of the reference
buffer (Table 1), strongly depending on the instrument.
Table 1: Residence times 0τ of intracellular H2O in RBC, 0τ of buffer H2O, and the ratio
between both. All values are at the temperature 290 K.
0τ H2O in
RBC
0τ H2O
buffer
( 0τ H2O in RBC)/ ( 0τ H2O buffer)
IRIS (17µeV) 2.53 ± 0.06 ps 0.57 ± 0.03 ps 4.4
FOCUS (50µeV) 1.12 ± 0.05 ps 1.02 ± 0.09 ps 1.1
TOFTOF (100µeV) 1.68 ± 0.03 ps 0.68 ± 0.03 ps 2.5
The obtained residence times of H2O buffer are smaller than the literature value of 0τ =1.1 ps for
pure water at 298 K (Bellissent-Funel et al. 1995).

Cytoplasmic Water and Hydration Layer Dynamics in Human Red Blood Cells
141
Figure 4: Half-widths at half-maximum ΓT of the translational diffusion process of H2O in RBC
and of H2O buffer measured on TOFTOF, FOCUS and IRIS. Solid lines represent fits according
to a jump-diffusion model.

Cytoplasmic Water and Hydration Layer Dynamics in Human Red Blood Cells
142
The HWHM of rotational diffusion ( )qRΓ measured on TOFTOF are shown in Figure 5 a). The
values of the half-widths are independent of the scattering vector, as expected for rotational
diffusion. The rotational correlation times R
RCor Γ= 1
,τ are given in Figure 5 b), they are however
smaller than the literature value of RCor,τ =3.3 ps at 298 K for pure water(Bellissent-Funel et al.
1995).
Figure 5: a) Half-widths at half-maximum ΓR of the rotational diffusion process of H2O in RBC
measured on TOFTOF. b) Rotational correlation times RCor,τ of H2O in RBC and H2O buffer as
determined with TOFTOF.
The immobile fraction of H2O in RBC at the scattering vector q was determined according to
( )( ) ωω dqS
qAp∫
=,exp
0 and the temperature dependence was described by an Arrhenius equation
with the activation energy aE with ( )
⋅=
Tk
EpTp
B
aexp0 .
Mean square displacements 2u can be obtained from the scattering vector dependence of the
elastic intensity A0(q) according to
( )( )2
02 ln6
q
qAu
∆∆⋅−
= . (6.3)
Cytoplasmic Water and Hydration Layer Dynamics in Human Red Blood Cells
143
This approach is formally similar to the Guinier approximation of small angle scattering(Guinier
and Fournet 1955). The mean square displacements report on the average radius of atomic
thermal motion, where we follow the definition of 2u given by Smith (Smith 1991). Equation
(6.3) is strictly valid for 02 →q but holds for 222 ≈⋅ qu . Mean square displacements were
calculated from IRIS data in the range of q2=0.37-1.14 Å-2 and yielded a temperature independent
value of 2u =5.4±0.7 Å2. From FOCUS data, 2u were calculated in a similar range of
q2=0.30-1.10 Å-2 and we obtained a temperature independent value of 2u =4.5±0.5 Å2.
6.6.4 Surface Area Calculations
We calculated the Surface Accessible Surface Area (SASA) per human deoxy-hemoglobin from
a neutron crystallographic structure (pdb file 2DXM) with the web based server GETAREA
(Fraczkiewicz and Braun 1998) and obtained a value of 24,550 Å2. Persson et Halle (Persson and
Halle 2008) report a value of ~10.75 Å2 that a water molecule occupies on the surface of a
protein. Taking this value, we obtain that around 2,300 H2O molecules are in direct contact with
the surface of one hemoglobin protein. We further assume that the volume of one RBC is around
100 µm3 as given in Artmann et al. (Artmann et al. 1998) For the purpose of simplicity, we
approximate the RBC by a sphere with equal volume. This yields a total surface area of the
cytoplasmic and periplasmic cell side of 2208 mARBC µ= . Considering a cellular hemoglobin
concentration of 330 mg/ml, we obtain a total SASA of intracellular hemoglobin of
24106.7 mAHb µ⋅= . The ratio 400≈RBC
HbA
A indicates that the amount of water in the
hemoglobin hydration layer is two orders of magnitude larger than water in the membrane
hydration layer. Extracellular matrix and glycocalix was removed during sample preparation, as
it might be strongly interacting with water.
Cytoplasmic Water and Hydration Layer Dynamics in Human Red Blood Cells
144
6.7 References
(2008a) DAVE Data Analysis and Visualisation Environment, vol 2008
(2008b) MODES a Graphic User Interface for Iris Data Analysis, vol 2008
Artmann GM, Kelemen C, Porst D, Büldt G, Chien S (1998) Temperature Transitions of Protein
Properties in Human Red Blood Cells. Biophys. J. 75:3179-3183
Bee M (1988) Quasielastic neutron scattering. Principles and Applications in Solid State
Chemistry, Biology and Materials Science. Adam Hilger, Bristol and Philadelphia
Bellissent-Funel MC, Chen SH, Zanotti JM (1995) Single-particle dynamics of water molecules
in confined space. Phys. Rev. E 51:4558-4569
Carlile CJ, Adams MA (1992) The Design of the IRIS Inelastic Neutron Spectrometer and
Improvements to its Analysers. Physica B 182:431-440
Elgsaeter A, Branton D (1974) Intramembrane particle aggregation in erythrocyte ghosts. I. The
effects of protein removal. J. Cell. Biol. 63:1018-36
Ellis RJ, Minton AP (2003) Join the crowd. Nature 425:27-28
Fraczkiewicz R, Braun W (1998) Exact and Efficient Analytical Calculation of the Accessible
Surface Areas and Their Gradients for Macromolecules. J. Comp. Chem. 19:319-333
Gabel F, Bicout D, Lehnert U, Tehei M, Weik M, Zaccai G (2002) Protein dynamics studied by
neutron scattering. Q. Rev. Biophys. 35:327-67
Garcia de la Torre J (2001) Hydration from hydrodynamics. General considerations and
applications of bead modelling to globular proteins. Biophys. Chem. 93:159-170
Guinier A, Fournet G (1955) Small Angle Scattering of X-Rays. Wiley, New York
Janssen S, Mesot J, Holitzner L, Furrer A, Hempelmann R (1997) FOCUS: A hybrid TOF-
spectrometer at SINQ. Physica B 234:1174-1176
Jasnin M, Moulin M, Haertlein M, Zaccai G, Tehei M (2008) Down to atomic-scale intracellular
water dynamics. EMBO reports 9:543-547
Krueger S, Nossal R (1988) SANS studies of interacting hemoglobin in intact erythrocytes.
Biophys. J. 53:97-105
Makarov VA, Andrews BK, Smith PE, Pettitt BM (2000) Residence Times of Water Molecules
in the Hydration Sites of Myoglobin. Biophys. J. 79:2966-2974
Persson E, Halle B (2008) Cell water dynamics on multiple time scales. Proc. Natl. Acad. Scie.
U.S.A. 105:6266-6271

Cytoplasmic Water and Hydration Layer Dynamics in Human Red Blood Cells
145
Russo D, Murarka RK, Copley JRD, Head-Gordon T (2005) Molecular View of Water Dynamics
near Model Peptides. J. Phys. Chem. B 109:12966-12975
Smith JC (1991) Protein Dynamics - Comparison of Simulations with Inelastic Neutron-
Scattering Experiments. Q. Rev. Biophys. 24:227-291
Unruh T, Neuhaus J, Petry W (2007) The high-resolution time-of-flight spectrometer TOFTOF.
Nuclear Instruments and Methods in Physics Research Section A: Accelerators,
Spectrometers, Detectors and Associated Equipement 580:1414-1422
Wei YZ, A.C K, Sadeghi M, Sage JT, Tian WD, Champion PM, Sridhar S (1994) Protein
Hydration Investigations with High-Frequency Dielectric Spectroscopy. J. Phys. Chem.
98:6644-6651
Wuttke J FRIDA: Fast Reliable Interactive Data Analysis
Zhang L, Wang L, Kao Y-T, Qiu W, Yang Y, Okobiah O, Zhong D (2007) Mapping hydration
dynamics around a protein surface. Proc. Natl. Acad. Scie. U.S.A. 104:18461-18466

Cytoplasmic Water and Hydration Layer Dynamics in Human Red Blood Cells
146

Conclusions Générales et Perspectives
147
7. Conclusions Générales et Perspectives
La dynamique de l’hémoglobine dans les globules rouges en fonction de la température a été
mesurée par diffusion quasiélastique de neutrons. La diffusion globale des macromolécules et
la dynamique interne des protéines ont pu être séparées par les données et l’analyse. Les
prédictions théoriques pour la diffusion des particules colloïdales à temps de courte durée ont
été utilisées pour comparer les coefficients de diffusion de l’hémoglobine mesurés dans les
globules rouges avec les coefficients de diffusion de l’hémoglobine à grande dilution mesurés
par diffusion de lumière. Il a ainsi été montré que les molécules de l’hémoglobine se
comportent comme si elles étaient confinées dans des cages formées par les protéines voisines
sur les échelles de quelques picosecondes et de quelques Ångstroms. La dynamique interne de
l’hémoglobine montre un changement de régime à 36.9°C. À des températures plus élevées
que la température du corps humain, les chaînes latérales des amino acides occupent des
volumes plus grands que prévu par la dépendance normale de la température. Ce phénomène a
été interprété comme étant dû au dépliement partiel de la protéine à température
physiologique, en accord avec des résultats d’expériences de dichroïsme circulaire (Digel et
al. 2006 ; Zerlin et al. 2007). Il a été conclu que le changement de la dynamique à la
température du corps pourrait refléter une augmentation de l’hydrophobicité de la surface, qui
serait responsable pour l’agrégation des protéines, pour la baisse de la pression osmotique
colloïdale et pour l’effet sur le passage vu dans les expériences de micropipette (Artmann et
al. 1998 ; Artmann et al. 2008 ; Digel et al. 2006 ; Kelement et al. 2001). Cela indique que la
transition macroscopique de « l’élasticité » des globules rouges à température physiologique a
bien une base moléculaire au niveau de l’hémoglobine sur l’échelle ps-Å.
Pour but examiner si les observations du paragraphe précédent sont dues à des propriétés
particulières du cytoplasme des globules rouges, la dynamique de l’hémoglobine pure en
fonction de l’hydratation a été mesurée dans une série d’expériences neutroniques. Les
techniques de diffusion élastique et quasiélastique de neutrons ont été utilisées pour mesurer
la dynamique de la protéine en fonction de la température dans des échantillons de poudre

Conclusions Générales et Perspectives
148
hydratée et en solution concentrée. Les temps de résidence entre les sauts locaux de l’ordre de
quelques picosecondes, sont réduits en solution concentrée et augmentés en poudre hydratée
d’hémoglobine. L’énergie d’activation entre les sauts locaux est également réduite en solution
concentrée comparée à la poudre hydratée. La transition de géométrie des mouvements
internes à température du corps a été vue dans la solution concentrée mais non dans la poudre
hydratée. Ce résultat est en accord avec l’hypothèse que la dynamique de l’hémoglobine pure
sur l’échelle ps-Å est responsable du changement de propriétés macroscopiques des globules
rouges à température physiologique. Il a été conclu que les poudres hydratées ne représentent
pas un bon modèle pour la dynamique de la protéine de l’ordre de quelques ps-Å, qui pourrait
être corrélée à la fonction biologique.
Les résultats de ces deux études sur les globules rouges et l’hémoglobine inspirent les
perspectives suivantes.
Il a été montré que la transition de l’hémoglobine est corrélée avec la température du corps
d’une grande variété d’espèces (Zerlin et al. 2007). Les travaux de cette thèse ainsi que des
travaux précédents sur des bactéries ont démontré l’efficacité de la diffusion de neutrons pour
mesurer la dynamique moléculaire in-vivo dans les cellules (Jasnin et al. 2008 ; Tehei et al.
2004). En plus, une étude de diffusion de neutrons a montré que la dynamique des protéines
dans des bactéries psychrophiles, mésophiles, thermophiles et hyperthermophiles s’adapte aux
températures de vie respectives de ces bactéries (Tehei et al. 2004). Il serait intéressant
d’étudier, par des expériences similaires, si la dynamique de l’hémoglobine dans des globules
rouges des différentes espèces est également correlée avec la température physiologique de
chacune de ces espèces.
Il a été postulé que l’hémoglobine en solution concentrée s’agrège à la température
physiologique (Artmann et al. 1998 ; Digel et al. 2006 ; Kelemen et al. 2001). La diffusion de
neutrons aux petits angles serait une méthode bien adaptée pour étudier l’agrégation de
l’hémoglobine en solution, en fonction de la température. La diffusion de neutrons aux petits
angles, en plus, ne cause pas de dommage de radiation, ce qui est le cas pour le rayonnement
synchrotron.
La diffusion globale de l’hémoglobine a été mesurée à l’échelle de quelques picosecondes, ce
qui a permis d’évaluer le coefficient de diffusion dans la limite des temps courts. Doster et

Conclusions Générales et Perspectives
149
Longeville ont mesuré le coefficient de diffusion de l’hémoglobine dans les globules rouges
dans la limite de temps courts et dans la limite de temps longs sur un spectromètre de spin
écho à l’échelle des nanosecondes et nanomètres (Doster et Longeville 2007). Les auteurs ont
trouvé que le coefficient de diffusion dans la limite de temps courts et longs est réduit
comparé aux prédictions de la théorie hydrodynamique. Le coefficient de diffusion dans la
limite de temps longs était faiblement réduit comparé à la valeur théorique, en revanche, le
coefficient de diffusion dans la limite de temps courts a montré une déviation plus grande. La
réduction de la dynamique dans la limite de temps longs a été interprétée par l’influence de la
couche d’hydratation qui est lié à la surface de la protéine. Busch et co-auteurs ont mesuré la
diffusion de la myoglobine en solutions concentrées sur un spectromètre à rétrodiffusion
(Busch et al. 2007). Un coefficient de diffusion réduit a été trouvé, qui était en accord avec
une étude de spin écho sur la diffusion de la myoglobine en solution concentrée (Longeville et
al. 2003).
Le coefficient de diffusion de l’hémoglobine dans les globules rouges en fonction de la
température et en fonction du temps d’observation pourrait être mesuré avec des
spectromètres neutroniques à différentes résolutions en énergie. Il serait intéressant de
mesurer le coefficient de diffusion dans la limite de temps longs en fonction de la température
sur un spectromètre à rétrodiffusion (échelle ~ns) ou spin-écho (échelle ~100ns). Dans le cas
de l’agrégation des protéines, le coefficient de diffusion dans la limite de temps longs sera
réduit. Les propriétés de la réduction du coefficient de diffusion dans la limite de temps longs
pendant l’agrégation des particules constituent un thème de recherche actuel dans la science
de particules colloïdales. Il serait intéressant de comparer un système biologique aux résultats
sur des systèmes colloïdaux physicochimiques.
La dynamique de l’eau cellulaire dans les globules rouges a été mesurée à l’échelle des
quelques picosecondes et quelques Ångstroms avec la technique de la diffusion quasiélastique
de neutrons, dans une grande gamme de température. Trois spectromètres de neutrons avec
résolutions en temps de 40, 13 et 7 ps ont été combinés pour couvrir l’échelle de temps des
mouvements de l’eau volumique à l’eau interfaciale. Une fraction de l’eau cellulaire d’environ
90% est caractérisée par un coefficient de diffusion translationnel similaire à celui de l’eau
volumique. Les 10% restant présentent une dynamique ralentie de façon significative. La
fraction ralentie a été attribuée à l’eau en interaction avec l’hémoglobine. Elle correspond à
environ la moitié de l’eau dans la première couche d’hydratation de la protéine. Il a été

Conclusions Générales et Perspectives
150
proposé précédemment que l’eau liée à la surface de l’hémoglobine pourrait être responsable
pour l’effet de passage des globules rouges observé dans les expériences de micropipette
(Kelemen et al. 2001). Les auteurs ont proposé qu’il y a de l’eau interfaciale ralentie qui
‘dégèle’ à la température du corps et qui est caractérisée par une dynamique similaire à l’eau
volumique dans l’état ‘dégelé’. La réduction de la viscosité des solutions de l’hémoglobine
concentrée à la température du corps serait expliquée par la fraction de l’eau ‘dégelée’ qui
diluerait la solution de la protéine. Les expériences de diffusion des neutrons ont montré qu’il
existe en effet une fraction d’eau interfaciale avec une dynamique plus lente dans les cellules.
Cette fraction baisse en augmentant la température. Par contre, on n’observe pas de
changement brutal de la fraction de l’eau lente autour de la température physiologique.
L’hypothèse que l’eau interfaciale est responsable pour la réduction de la viscosité des
solutions de l’hémoglobine concentrée à la température du corps n’est pas confirmée par les
expériences de neutrons. Une étude récente sur la dynamique de l’eau cellulaire dans E. coli a
montré que l’eau majoritaire cellulaire présente une dynamique translationnelle et
rotationnelle similaire à l’eau volumique (Jasnin et al. 2008). L’étude sur la dynamique de
l’eau cellulaire dans les globules rouges a montré que ces résultats ne sont pas limités aux
procaryotes mais sont aussi valables pour les eucaryotes.
Les propriétés spécifiques de l’eau d’hydratation et le couplage entre la dynamique de l’eau
d’hydratation et de la protéine ont été montrées récemment. Paciaroni et al. ont utilisé la
diffusion inélastique incohérente de neutrons pour mesurer la densité d'état des molécules
d’eau dans la couche d’hydratation d’une protéine (Paciaroni et al. 2008). Les résultats ont
montré que la densité d’état de l’eau dans la couche d’hydratation est significativement
différente de la densité d’état des formes simples cristallines de la glace et ressemble à un
mélange entre les formes amorphes de la glace de grande et faible densité. Le couplage entre
la dynamique de la protéine et de l’eau a été étudié dans une expérience complémentaire par
Wood et al. (Wood et al. 2008). L’étude a montré que les propriétés dynamiques de la
protéine et de l’eau d’hydratation sont caractérisées par une transition dynamique à la même
température d’environ 220 K. Des simulations de dynamique moléculaire de ce système ont
montré que le début de la diffusion translationnelle des molécules d’eau dans la couche
d’hydratation à 220 K est responsable pour la relaxation du réseau des liaisons d’hydrogène
entre la protéine et les molécules d’eau, qui est à l’origine de la transition dynamique (Wood
et al. 2007).

Conclusions Générales et Perspectives
151
La dynamique de l’eau cellulaire a été mesurée dans une étude récente dans l’organisme
halophile Haloarcula marismortui (Tehei et al. 2007). Cette étude a montré qu’environ 76%
de l’eau cellulaire dans H. marismortui est caractérisée par une dynamique 250 fois plus lente
que l’eau volumique. À 300 K l’eau cellulaire lente montrait des signes caractéristiques pour
la dynamique en confinement. Cette étude a également montré qu’il n’y a pas de fraction
majoritaire de l’eau cellulaire lente dans E. coli (Tehei et al. 2007). Une étude supplémentaire
a montré que la fraction majoritaire de l’eau dans E. coli a des propriétés dynamiques
similaires à l’eau volumique (Jasnin et al. 2008). La cellule halophile est un cas spécial. La
cellule contient du KCl à concentration molaire dans le cytoplasme et les protéines halophiles
sont seulement stables à cette haute concentration de sel. Les interactions des protéines
halophiles avec le solvant sont particulièrement fortes et la couche d’hydratation des protéines
halophiles contient des molécules d’eau et des ions (Madern et al. 2000). Tehei et al. ont
suggéré qu’un effet de structuration entre les molécules d’eau, les ions du KCl en solution très
concentré et les protéines halophiles est responsable pour la grande fraction d’eau lente dans
le cytoplasme de H. marismortui (Tehei et al. 2007).
Les propriétés d’eau ralentie dans les globules rouges pourraient être examinées sur un
spectromètre à rétrodiffusion à haute résolution en énergie (par exemple IN16 à l’ILL). IN16 a
une résolution en énergie de 0.9 µeV qui correspond à une échelle de temps de l’ordre d’une
nanoseconde. Il serait intéressant de mesurer le coefficient de diffusion et le temps de
résidence de l’eau ralenti dans les globules rouges sur ce spectromètre sensible à l’échelle de
la nanoseconde et d’étudier si cette fraction de l’eau lente montre des signes de la dynamique
en confinement. De plus, des simulations de dynamique moléculaire de l’hémoglobine
hydratée pourraient aider à identifier des molécules d’eau ralenties et à corréler leurs temps de
résidence avec les données expérimentales.

Conclusions Générales et Perspectives
152

General Conclusion and Perspectives
153
7. General Conclusion and Perspectives
The technique of quasielastic neutron scattering was used to measure the dynamics of
hemoglobin in whole human red blood cells as a function of temperature. Global
macromolecular diffusion and internal protein dynamics could be separated from the
measured data in the analysis. Theoretical predictions for the short-time self-diffusion of
colloidal non-charged hard-sphere particles were used to compare the measured global
diffusion coefficients of hemoglobin in red blood cells with diffusion coefficients of
hemoglobin at infinite dilution, measured with dynamic light scattering. It was revealed that
hemoglobin molecules in the picosecond and Ångstrom time and length scale behave as if
they were trapped in cages formed by neighbouring proteins. The experiment showed that
internal hemoglobin dynamics displays a sudden change at 36.9°C. Above body temperature
amino acid side-chains occupy larger volumes than expected from normal temperature
behaviour. The phenomenon was interpreted as partial unfolding of hemoglobin at body
temperature, which is in agreement with results of circular dichroism experiments (Digel et al.
2006, Zerlin et al. 2007). It has been concluded that the change in protein dynamics at body
temperature could reflect an increase in surface hydrophobicity of the surface of hemoglobin,
responsible for pronounced protein aggregation, the drop in colloidal osmotic pressure and the
passage effect seen in micropipette studies (Artmann et al. 1998; Kelemen et al. 2001; Digel
et al. 2006; Artmann et al. 2008). It has been suggested further that protein dynamics and
structural changes in the picosecond time range and Ångstrom length scale might be
connected to a macroscopic effect on whole red blood cells.
With the aim to study if the observations of the previous paragraph are a particular property of
the cytoplasmic environment of red blood cells, the dynamics of pure human hemoglobin as a
function of hydration was studied in a series of neutron scattering experiments. Elastic and
quasielastic incoherent neutron scattering were used to measure protein dynamics as a
function of temperature. The residence times of localized jumps in the order of a few
picoseconds were found to be significantly reduced in concentrated solution compared to fully
General Conclusion and Perspectives
154
hydrated powder. Furthermore, the activation energy of the localised jump-diffusion process
was found to be reduced for the solution sample as compared to the hemoglobin powder.
Above human body temperature, and only in the solution sample, amino acid side-chain
motions occupy larger volumes than expected from normal temperature dependence. The
result is in agreement with the observed change in hemoglobin dynamics at body temperature
in red blood cells. In that study it was suggested that hemoglobin dynamics in the order of a
few picoseconds might be relevant for the properties of whole red blood cells. As the body
temperature behaviour was found to be absent in the hydrated powder sample, it was
concluded that hydrated powder samples do not describe all fast protein dynamics that are
relevant for biological function.
The results on human hemoglobin dynamics stimulate the following perspectives.
Previous work of Zerlin et al. showed that the transition temperature of hemoglobin is directly
correlated to the species’ body temperature (Zerlin et al. 2007). The work of this thesis as well
as previous work on bacteria showed the efficiency of neutron scattering to measure
molecular dynamics in-vivo in cells (Tehei et al. 2004; Jasnin et al. 2008). It has already been
shown with neutron scattering that average protein dynamics of psychrophile, mesophile,
thermophile and hyperthermophile bacteria are adapted to the respective temperatures at
which these bacteria live (Tehei et al. 2004). It would be now of scientific interest to study
with neutron scattering if hemoglobin dynamics in red blood cells of different species is
equally correlated to the body temperature of each of these species.
It has been postulated in recent work that hemoglobin shows pronounced aggregation at body
temperature (Artmann et al. 1998; Digel et al. 2006; Kelemen et al. 2001). Small angle
neutron scattering would be an excellent experimental method to investigate protein
aggregation in concentrated solution as a function of temperature. Additionally, small angle
scattering does not induce radiation damage, which is the case of synchrotron radiation.
In the thesis, global macromolecular diffusion of hemoglobin in red blood cells was measured
in the picosecond and Ångstrom time and length scale, which allowed the determination of
the short-time self-diffusion coefficient. Doster and Longeville measured the short-time and
long-time self-diffusion coefficient of hemoglobin in red blood cells with neutron spin-echo
spectroscopy in the nanosecond and nanometer time and length scale (Doster and Longeville

General Conclusion and Perspectives
155
2007). The authors found that both the short-time and the long-time self-diffusion coefficients
of hemoglobin were reduced as compared to predicted values of hydrodynamic theory. The
long-time diffusion coefficient showed only a small deviation from the theoretical value,
whereas the short-time diffusion coefficient exhibited a larger deviation. The reduction of the
long-time diffusive dynamics was attributed to the influence from the protein hydration shell,
which was supposed to stick to the surface of the protein and move in a joint way. Busch and
co-authors studied the self-diffusion of myoglobin in concentrated solutions using neutron
backscattering spectroscopy (Busch et al. 2007). A reduction of the diffusion coefficient was
reported that was in good agreement with previous results of a neutron spin echo study on the
diffusion of myoglobin in concentrated solutions (Longeville et al. 2003).
The diffusion coefficient of hemoglobin in red blood cells as a function of temperature and as
a function of the observation time could be studied with neutron spectrometers of different
energy resolution. It would be interesting to measure the behaviour of the long-time self-
diffusion coefficient as a function of temperature on a backscattering spectrometer (time scale
~1ns) or on a spin echo instrument (time scale ~100ns). In the case of protein aggregation the
long-time self-diffusion coefficient will be reduced. The reduction of the long-time diffusive
dynamics during particle aggregation is a topic of scientific interest in the field of colloidal
science. Colloidal particles are ideal model systems and it would be of interest to compare a
biological system to the physicochemical results of colloidal research.
The dynamics of cytoplasmic water in the picosecond time and Ångstrom length scale was
measured with quasielastic neutron scattering in a broad range of temperature. Three different
neutron spectrometers with time resolutions of 40, 13, and 7 ps respectively were combined to
cover time scales from that of bulk to that of interfacial water dynamics. The experiments
revealed that around 90% of cellular water has got a translational diffusion coefficient similar
to bulk water. A minor fraction of 10% cellular water was found with significantly slower
dynamics that appeared immobile on the instrumental time scales. The correlation times of the
slow water fraction need to be longer than 40 ps which was the highest time resolution in the
study. The fraction of slowed down water was attributed to H2O molecules which are
dynamically bound on the surface of hemoglobin. It was concluded that roughly 50% of the
surface of hemoglobin is covered with dynamically bound water molecules. It has been
suggested previously that bound water on the surface of hemoglobin could be responsible for
the passage effect of red blood cells in micropipette experiments (Kelemen et al. 2001). The

General Conclusion and Perspectives
156
authors proposed that there exists bound water on the surface of hemoglobin that would ‘melt’
at body temperature and would then exhibit faster dynamics similar to bulk water in the
‘melted’ state. The reduced viscosity of the hemoglobin solution above body temperature was
then explained as a dilution effect of the protein solution by this additional bulk water. The
neutron experiments on cellular water showed that a bound water fraction on the surface of
hemoglobin exists in red blood cells. The immobile water fraction is reduced with increasing
temperature but it does not exhibit any sudden changes at body temperature due to ‘melting’.
Therefore, the hypothesis that bound water causes the loss of viscosity in concentrated
hemoglobin solutions above body temperature was not confirmed by the neutron scattering
experiments. A previous study on cell water dynamics in E. coli has shown that the major
fraction of cytoplasmic water has translational and rotational dynamics similar to bulk water
(Janin et al. 2008). The study on cell water in red blood cells showed that not only cell water
in prokaryote but also in eukaryotes has similar translational dynamics compared to bulk
water in the picosecond and Ångstrom time-space window.
The specific dynamical properties of protein hydration water and the intimate coupling
between hydration water and protein dynamics have been demonstrated recently. Paciaroni et
al. used inelastic incoherent neutron scattering to measure the vibrational density of states of
water molecules in the first hydration layer of maltose binding protein (Paciaroni et al. 2008).
The results showed that the measured density of states of hydration water is significantly
different from the density of states of simple crystalline ice and is similar to a mixture of both
low- and high-density amorphous ice. The coupling between protein and hydration water
dynamics was studied in a complementary experiment by Wood et al. (Wood et al. 2008). The
study showed that both the protein and the hydration water exhibit a dynamical transition at
the same temperature at around 220 K. Computer simulations on the same system were
performed and revealed that the onset of translational diffusion of water molecules in the
hydration layer at 220 K is responsible for the relaxation of the protein-water hydrogen-
bonding network that leads to the measured dynamical transition (Wood et al. 2008).
The nature of the dynamical bound water fraction in red blood cells at physiological
temperature could be further investigated with neutron experiments on a high resolution
backscattering spectrometer (for example the instrument IN16 at ILL). IN16 has an energy
resolution of 0.9 µeV which corresponds to a time scale in the order of one nanosecond.
General Conclusion and Perspectives
157
A previous experiment on water dynamics in the halophilic organism Haloarcula marismortui
revealed a major cellular water fraction of around 76% with 250 times slower dynamics than
bulk water (Tehei et al. 2007). The slow water fraction at 300 K showed characteristic signs
for confined motions in a restricted volume. That study also revealed that cell water dynamics
in E. coli is not governed by such a slow water fraction (Tehei et al. 2007). As discussed
above, a further study revealed that the major cell water fraction in E. coli has similar
dynamical properties as bulk water (Jasnin et al. 2008). The halophilic cell is a special case.
The cell accumulates large amounts of KCl in the molar level in its cytoplasm and halophilic
proteins are only stable at such high salt concentrations. Solvent interactions of halophilic
proteins are particularly strong and halophilic proteins bind both water and salt ions in their
hydration shell (Madern et al. 2000). Tehei et al. therefore suggested that an ordering effect of
water molecules, KCl and halophilic proteins is responsible for the large slow water fraction
in H. marismortui (Tehei et al. 2007).
The work in this thesis showed that there exists a minor water fraction of ~10% in red blood
cells with slow dynamics. The existence of such a small water fraction with reduced dynamics
might also be possible in E. coli and other cells. In further work, it would be interesting to
study if the slow water fraction in red blood cells, and possibly other types of cells, shows
signs for confined dynamics and to quantify the residence times and diffusion coefficients of
the slow water dynamics. Additionally, molecular dynamics simulations could be performed
of one hemoglobin molecule surrounded with water. By performing sufficiently long
simulations it might be possible to identify water molecules close to the surface of the protein
with reduced dynamics and to correlate their residence times with the neutron measurements.

General Conclusion and Perspectives
158

Abbrevations
159
8. Abbreviations
CD circular dichroism DLS dynamic light scattering DNA deoxyribonucleic acid E. coli Escherichia coli FRM-II Forschungsreaktor München II FWHM full-widths at half-maximum EINS elastic incoherent neutron scattering EISF elastic incoherent structure factor eV electronvolt Hb hemoglobin HWHM half-widths at half-maximum ILL Institut Laue-Langevin kDa kilo Dalton M molar MD molecular dynamics MSD mean square displacements MW molecular weight ns nanosecond NMR nuclear magnetic resonance ps picosecond picosecond PSI Paul Scherrer Institut

Abbrevations
160
q magnitude of the scattering vector QENS quasielastic neutron scattering RBC red blood cells rcf relative centrifugal force RNA ribonucleic acid SASA surface accessible surface area
References
161
9. References
Alberts B. AJ, J. Lewis, M. Raff, K. Roberts, P. Walter (2002) Molecular biology of the cell,
4th edn. Garland Science, New York
Artmann GM, Kelemen C, Porst D, Büldt G, Chien S (1998) Temperature transitions of
protein properties in human red blood cells. Biophys. J. 75:3179-83
Artmann GM, Burns L, Canaves JM, Temiz-Artmann A, Schmid-Schonbein GW, Chien S,
Maggakis-Kelemen C (2004) Circular dichroism spectra of human hemoglobin reveal
a reversible structural transition at body temperature. Eur. Biophys. J. 33:490-6
Artmann GM, Zerlin KF, Digel I (2008) Hemoglobin Senses Body Temperature. In: Artmann
GM, Chien S (eds) Bioengineering in Cell and Tissue Research, vol IV. Springer
Verlag, Berlin, Heidelberg, pp 415-447
Austin RH, Beeson KW, Eisenstein L, Frauenfelder H, Gunsalus IC (1975) Dynamics of
ligand binding to myoglobin. Biochemistry 14:5355-73
Ball P (2008) Water as an Active Constitutent in Cell Biology. Chem. Rev. 108:74-108
Bee M (1988) Quasielastic neutron scattering. Principles and Applications in Solid State
Chemistry, Biology and Materials Science. Adam Hilger, Bristol and Philadelphia
Bellissent-Funel MC, Teixeira J, Bradley KF, Chen SH (1992) Dynamics of hydration water
in protein. J. Phys. I France 2:995-1001
Bellissent-Funel MC, Chen SH, Zanotti JM (1995) Single-particle dynamics of water
molecules in confined space. Phys. Rev. E 51:4558-4569
Bellissent-Funel MC, Zanotti JM, Chen SH (1996) Slow dynamics of water molecules on the
surface of a globular protein. Faraday Discuss. 103:281-294
Bicout DJ, Zaccai G (2001) Protein Flexibilty from the Dynamical Transition: A Force
Constant Analysis. Biophys. J. 80:1115-1123
Bu Z, Neumann DA, Lee SH, Brown CM, Engelmann DM, Han CC (2000) A view of
dynamics changes in the molten globule-native folding step by quasielastic neutron
scattering. J. Mol. Biol. 301:525-536

References
162
Busch, S., W. Doster, S. Longeville, V. Garcia Sakai, and T. Unruh (2007) Microscopic
protein diffusion at high concentration. In QENS2006, P. E. Sokol, H. Kaiser, D.
Baxter, R. Pynn, D. Bossev, M. Leuschner, editors. Materials Research Society,
Bloomington, IN. 107–114.
Carlile CJ, Adams MA (1992) The Design of the IRIS Inelastic Neutron Spectrometer and
Improvements to its Analysers. Physica B 182:431-440
Combet S, Pieper J, Coneggo F, Ambroise JP, Bellissent-Funel MC, Zanotti JM (2008)
Coupling of laser excitation and inelastic neutron scattering: attempt to probe the
dynamics of light-induced C-phycocyanin dynamics Eur. Biophys. J. 37:693-700
Cornicchi E, Marconi M, Onori G, Paciaroni A (2006) Controlling the Protein Dynamical
Transition with Sugar-Based Bioprotectant Matrices: A Neutron Scattering Study.
Biophys. J. 91: 289-297
Cusack S, Doster W (1990) Temperature dependence of the low frequency dynamics of
myoglobin. Measurement of the vibrational frequency distribution by inelastic neutron
scattering. Biophys. J. 58:243-251
Dellerue S, Bellissent-Funel MC (2000) Relaxational dynamics of water molecules at protein
surface. Chem. Phys. 258:315-325
Dellerue S, Petrescu AJ, Smith JC, Bellissent-Funel MC (2001) Radially softening diffusive
motions in a globular protein. Biophys. J. 81:1666-76
De Francesco A, Marconi M, Cinelli S, Onori G, Paciaroni A (2004) Picosecond Internal
Dynamics of Lysozyme as Affected by Thermal Unfolding in Nonaqueous
Environment. Biophys. J. 86:480-487
Demmel F, Doster W, Petry W, Schulte A (1997) Vibrational frequency shifts as a probe of
hydrogen bonds: thermal expansion and glass transition of myoglobin in mixed
solvents. Europ. Biophys. J. 26: 327-335
Diehl M, Doster W, Petry W, Schober H (1997) Water-coupled low-frequency modes of
myoglobin and lysozyme observed by inelastic neutron scattering. Biophys. J. 73:
2726-2732
Digel I, Maggakis-Kelemen C, Zerlin KF, Linder P, Kasischke N, Kayser P, Porst D, Temiz
Artmann A, Artmann GM (2006) Body temperature-related structural transitions of
monotremal and human hemoglobin. Biophys. J. 91:3014-21
Doster, W, Bachleitner A, Dunau R, Hiebl M, Lüscher E (1986) Thermal properties of water
in myoglobin crystals and solutions at subzero temperatures. Biophys. J. 50:213-219

References
163
Doster W, Cusack S, Petry W (1989) Dynamical transition of myoglobin revealed by inelastic
neutron scattering. Nature 337:754-6
Doster W, Cusack S, Petry W (1990) Dynamic instability of liquidlike motions in a globular
protein observed by inelastic neutron scattering. Phys. Rev. Let. 65:1080-1083
Doster W, Settles M (2005) Protein-water displacement distributions. Biochim. Biophys. Acta
1749: 173-186
Doster W, Longeville S (2007) Microscopic diffusion and hydrodynamic interactions of
hemoglobin in red blood cells. Biophys. J. 93:1360-8
Elgsaeter A, Branton D (1974) Intramembrane particle aggregation in erythrocyte ghosts. I.
The effects of protein removal. J. Cell. Biol. 63:1018-36
Ellis RJ, Minton AP (2003) Join the crowd. Nature 425:27-28
Engler N, Ostermann A, Niimura N, Parak F (2003) Hydrogen atoms in proteins: Positions
and dynamics. Proc. Nat. Acad. Sci. U.S.A. 100:10243-10248
Ferrand M, Dianoux AJ, Petry W, Zaccai G (1993) Thermal Motions and Function of
Bacteriorhodopsin in Purple Membranes - Effects of Temperature and Hydration
Studied by Neutron-Scattering. Proc. Natl. Acad. Sci. U.S.A. 90:9668-9672
Fitter J, Lechner RE (1998) Incoherent neutron scattering (INS)
Fraczkiewicz R, Braun W (1998) Exact and Efficient Analytical Calculation of the Accessible
Surface Areas and Their Gradients for Macromolecules. J. Comp. Chem. 19:319-333
Frauenfelder H, Petsko GA, Tsernoglou D (1979) Temperature-dependent X-ray diffraction as
a probe of protein structural dynamics. Nature 280:558-63
Frauenfelder H, Parak F, Young RD (1988) Conformational substates in proteins. Annu Rev
Biophys Biophys Chem 17:451-79
Fraunfelder H, Sligar SG, Wolynes PG (1991) The energy landscapes and motions of
proteins. Science 254:1598-1603
Gabel F, Bicout D, Lehnert U, Tehei M, Weik M, Zaccai G (2002) Protein dynamics studied
by neutron scattering. Q. Rev. Biophys. 35:327-67
Gabel F, Weik M, Doctor BP, Saxena A, Fournier D, Brochier L, Renault F, Masson P,
Silman I, Zaccai G (2004) The influence of solvent composition on global dynamics of
human butyrylcholinesterase powders: a neutron-scattering study. Biophys J 86:3152-
65
Gabel F (2005) Protein dynamics in solution and powder measured by incoherent elastic
neutron scattering: the influence of Q-range and energy resolution. Eur. Biophys. J.
34:1-12

References
164
Garcia de la Torre J (2001) Hydration from hydrodynamics. General considerations and
applications of bead modelling to globular proteins. Biophys. Chem. 93:159-170
Gaspar AM, Appavou MS, Busch S, Unruh T, Doster W (2008) Dynamics of well-folded and
natively disordered proteins in solution: a time-of-flight neutron scattering study. Eur.
Biophys. J. 37:573-582
Goodsell DS (2000) http://mgl.scripps.edu/people/goodsell/illustration/public
Guinier A, Fournet G (1955) Small Angle Scattering of X-Rays. Wiley, New York
Hall D, Minton AP (2003) Macromolecular crowding: qualitative and semiquantitive
successes, quantitative challenges. Biochim. Biophys. Acta 1649:127-139
Hall PL, Ross DK (1981) Incoherent neutron scattering functions for random jump diffusion
in bounded and infinite media. Mol. Phys. 42:673-682
http://neutron.neutron-eu.net/n_nmi3 (2008) NMI3 - Integrated Infrastructure Initiative for
Neutron Scattering and Muon Spectroscopy
http://www.ncnr.nist.gov/dave (2008) DAVE Data Analysis and Visualisation Environment
http://www.isis.rl.ac.uk/molecularSpectroscopy/osiris/Modes_manual.pdf (2008b) MODES a
Graphic User Interface for Iris Data Analysis
Janssen S, Mesot J, Holitzner L, Furrer A, Hempelmann R (1997) FOCUS: A hybrid TOF-
spectrometer at SINQ. Physica B 234:1174-1176
Jasnin M, Moulin M, Haertlein M, Zaccai G, Tehei M (2008) Down to atomic-scale
intracellular water dynamics. EMBO reports 9:543-547
Jasnin M, Moulin M, Haertlein M, Zaccai G, Tehei M (2008) In vivo measurement of internal
and global macromolecular motions in E. coli. Biophys. J. 95:857-864
Kelemen C, Chien S, Artmann GM (2001) Temperature transition of human hemoglobin at
body temperature: effects of calcium. Biophys. J. 80:2622-30
Kendrew JC, Dickerson RE, Strandberg BE, Hart RG, Davies DR, Phillips DC, Shore VC
(1960) Structure of myoglobin: A three-dimensional Fourier synthesis at 2 A.
resolution. Nature 185:422-7
Knapp EW, Fischer SF, Parak F (1982) The influence of protein dynamics on Mössbauer
spectra. J. Chem. Phys. 78:4701-4711
Krueger S, Nossal R (1988) SANS studies of interacting hemoglobin in intact erythrocytes.
Biophys. J. 53:97-105
Lehnert U, Reat V, Weik M, Zaccai G, Pfister C (1998) Thermal motions in
bacteriorhodopsin at different hydration levels studied by neutron scattering:

References
165
correlation with kinetics and light-induced conformational changes. Biophys. J.
75:1945-52
Lichtenegger H, Doster W, Kleinert T, Birk A, Sepiol B, Vogl G (1999) Heme-solvent
coupling: a Mossbauer study of myoglobin in sucrose. Biophys. J. 76: 414-422
Longeville S, Doster W, Kali G (2003) Myoglobin in crowded solutions: structure and
diffusion. Chem. Phys. 292:413–424
Madern D, Ebel C, Zaccai G (2000) Halophilic adaptation of enzymes. Extremophiles 4: 91-
98
Makarov VA, Andrews BK, Smith PE, Pettitt BM (2000) Residence Times of Water
Molecules in the Hydration Sites of Myoglobin. Biophys. J. 79:2966-2974
Mampe W, Ageron P, Bates C, Pendlebury JM, Steyerl A (1989) Neutron lifetime measured
with stored ultracold neutrons. Phys. Rev. Lett. 63:593-596
Marconi M, Cornicchi E, Onori G, Paciaroni A (2008) Comparative study of protein
dynamics in hydrated powders and in solution: A neutron scattering investigation.
Chem. Phys. 345:224-229
McCammon JA, Harvey SC (1987) Dynamics of Proteins and Nuclear AcidsCambridge
University Press, Cambridge, UK
Minton AP (2001) The Influence of Macromolecular Crowding and Macromolecular
Confinement on Biochemical Reactions in Physiological Media. J. Biol. Chem.
276:10577-10580
Natali F, Peters J, Russo D, Barbieri S, Chiapponi C, Cupane A, Deriu A, Di Bari MT, Farhi
E, Gerelli Y, Mariani P, Paciaroni A, Rivasseau C, Schirograve G, Sonvico F (2008)
IN13 Backscattering Spectrometer at ILL: Looking for Motions in Biological
Macromolecules and Organisms Neutron News 19:14-18
Paciaroni A, Cinelli S, Onori G (2002) Effect of the Environment on the Protein Dynamical
Transition: A Neutron Scattering Study. Biophys. J. 83:1157-1164
Paciaroni A, Cornicchi E, De Francesco A, Marconi M, Onori G (2006) Conditioning action
of the environment on the protein dynamics studied through elastic neutron scattering.
Eur. Biophys. J. 35:591-599
Paciaroni A, Orecchini A, Cornicchi E, Marconi M, Petrillo C, Haertlein M, Moulin M,
Schober H, Tarek M, Sacchetti F (2008) Fingerprints of Amorphous Icelike Behavior
in the Vibrational Density of States of Protein Hydration Water. Phys. Rev. Let.
101:148104
References
166
Parak F, Knapp EW, Kucheida D (1982) Protein dynamics. Mossbauer spectroscopy on
deoxymyoglobin crystals. J Mol Biol 161:177-94
Park SY, Yokoyama T, Shibayama N, Shiro Y, Tame JRH (2006) 1.25 angstrom resolution
crystal structures of human haemoglobin in the oxy, deoxy and carbonmonoxy forms.
J. Mol. Biol. 360:690-701
Perez J, Zanotti JM, Durand D (1999) Evolution of the internal dynamics of two globular
proteins from dry powder to solution. Biophys. J. 77:454-69
Persson E, Halle B (2008) Cell water dynamics on multiple time scales. Proc. Natl. Acad.
Scie. U.S.A. 105:6266-6271
Persson E, Halle B (2008) Cell water dynamics on multiple time scales. Proc. Natl. Acad.
Scie. U.S.A. 105:6266-6271
Perutz MF, Rossmann MG, Cullis AF, Muirhead H, Will G, North ACT (1960) Structure of
Haemoglobin: A Three-Dimensional Fourier Synthesis at 5.5-Å Resolution, Obtained
by X-Ray Analysis. Nature 185:416-422
Perutz MF, G. Fermi, B. Luisi (1987) Stereochemistry of Cooperative Mechanisms in
Hemoglobin. Accounts of Chemical Research 20:309-321
Pieper J, Buchsteiner A, Dencher NA, Lechner RE, Hauss T (2008) Transient Protein
Softening during the Working Cycle of a Molecular Machine. Phys. Rev. Let.
100:228103
Réat V, Zaccai G, Ferrand M, Pfister C (1997) Functional dynamics in purple membranes
Biological Macromolecular Dynamics. Adenine Press, New York, pp 117-122
Reat V, Patzelt H, Ferrand M, Pfister C, Oesterhelt D, Zaccai G (1998) Dynamics of different
functional parts of bacteriorhodopsin: H-2H labeling and neutron scattering. Proc.
Natl. Acad. Sci. U.S.A. 95:4970-5
Richter D (2003) Properties of the Neutron - Elementary Scattering Processes, vol Matter and
Materials, Volume 15. Forschungszentrum Jülich
Roh JH, Curtis JE, Azzam S, Novikov VN, Peral I, Chowdhuri Z, Gregory RB, Sokolov AP
(2006) Influence of hydration on the dynamics of lysozyme. Biophys J 91:2573-88
Roh JH, Novikov VN, Gregory RB, Curtis JE, Chowdhuri Z, Sokolov AP (2005) Onsets of
anharmonicity in protein dynamics. Phys. Rev. Lett. 95:038101
Rupley JA, Careri G (1991) Protein hydration and function. Adv. Protein Chem. 41:37-172
Russo D, Perez J, Zanotti JM, Desmadril M, Durand D (2002) Dynamic transition associated
with the thermal denaturation of a small beta protein. Biophys. J. 83:2792-2800

References
167
Russo D, Murarka RK, Copley JRD, Head-Gordon T (2005) Molecular View of Water
Dynamics near Model Peptides. J. Phys. Chem. B 109:12966-12975
Sears VF (1966) THEORY OF COLD NEUTRON SCATTERING BY HOMONUCLEAR
DIATOMIC LIQUIDS: II. HINDERED ROTATION. Can. J. Phys. 44:1299-1311
Sears VF (1992) Neutron scattering lengths and cross sections. Neutron News 3:26-37
Settles M (1996) Die Zeitabhängigkeit und die Geometry der intramolekularen Dynamik
globulärer Proteine bis 100ps aus Neutronenstreudaten Physik Department E13, vol
Dissertation. Technische Universität München, Garching
Singwi KS, Sjölander A (1960) Diffusive Motions in Water and Cold Neutron Scattering.
Phys. Rev. 119:863-871
Smith JC (1991) Protein Dynamics - Comparison of Simulations with Inelastic Neutron-
Scattering Experiments. Q. Rev. Biophys. 24:227-291
Stadler AM, Digel I, Artmann GM, Embs JP, Zaccai G, Büldt G (2008) Hemoglobin
Dynamics in Red Blood Cells: Correlation to Body Temperature. Biophys. J. 95:5449-
5461
Stradner A, Sedgwick H, Cardinaux F, Poon WC, Egelhaaf SU, Schurtenberger P (2004)
Equilibrium cluster formation in concentrated protein solutions and colloids. Nature
432:492-5
Stradner A, Cardinaux F, Schurtenberger P (2006) A small-angle scattering study on
equilibrium clusters in lysozyme solutions. J. Phys. Chem. B 110:21222-21231
Stradner A, Foffi G, Dorsaz N, Thurston G, Schurtenberger P (2007) New insight into cataract
formation: Enhanced stability through mutual attraction. Phys. Rev. Let. 99:1-4
Tang KES, Dill K (1998) Native protein fluctuations: the conformational-motion temperature
and the inverse correlation of protein flexibility with protein stability. J. Biomol.
Struct. Dyn. 16:397-411
Tarek M, Tobias DJ (2002) Role of Protein-Water Hydrogen Bond Dynamics in the Protein
Dynamical Transition. Phys. Rev. Lett. 88:138101
Tehei M, Madern D, Pfister C, Zaccai G (2001) Fast dynamics of halophilic malate
dehydrogenase and BSA measured by neutron scattering under various solvent
conditions influencing protein stability. Proc Natl Acad Sci U S A 98:14356-61
Tehei M, Franzetti B, Madern D, Ginzburg M, Ginzburg BZ, Giudici-Orticoni MT, Bruschi
M, Zaccai G (2004) Adaptation to extreme environments: macromolecular dynamics
in bacteria compared in vivo by neutron scattering. Embo Reports 5:66-70
References
168
Tehei M, Smith JC, Monk C, Ollivier J, Oettl M, Kurkal V, Finney JL, Daniel RM (2006)
Dynamics of immobilized and native Escherichia coli dihydrofolate reductase by
quasielastic neutron scattering. Biophys. J. 90:1090-7
Tehei M, Franzetti B, Wood K, Gabel F, Fabiani E, Jasnin M, Zamponi M, Oesterhelt D,
Zaccai G, Ginzburg M, Ginzburg BZ (2007) Neutron scattering reveals extremely
slow cell water in a Dead Sea organism. Proc. Natl. Acad. Sci. U.S.A. 104:766-71
Tehei M, Zaccai G (2007) Adaptation to high temperatures through macromolecular dynamics
by neutron scattering. Febs J 274:4034-43
Teixeira J, Bellissentfunel MC, Chen SH, Dianoux AJ (1985) Experimental-Determination of
the Nature of Diffusive Motions of Water-Molecules at Low-Temperatures. Phys.
Rev. A 31:1913-1917
Tokuyama M, Oppenheim I (1994) Dynamics of Hard-Sphere Suspensions. Phys. Rev. E
50:R16-R19
Tournier AL, Xu J, Smith JC (2003) Translational Hydration Water Dynamics Drives the
Protein Glass Transition. Biophys. J. 85:1871-1875
Tsai AM, Udovic TJ, Neumann DA (2001) The inverse relationship between protein
dynamics and thermal stability. Biophys. J. 81:2339-2343
Unruh T, Neuhaus J, Petry W (2007) The high-resolution time-of-flight spectrometer
TOFTOF. Nuclear Instruments and Methods in Physics Research Section A:
Accelerators, Spectrometers, Detectors and Associated Equipement 580:1414-1422
Van Hove L (1954) Correlations in Space and Time and Born Approximation Scattering in
Systems of Interacting Particles. Phys. Rev. 95:249-262
Volino F, Dianoux AJ (1980) Neutron Incoherent-Scattering Law for Diffusion in a Potential
of Spherical-Symmetry - General Formalism and Application to Diffusion inside a
Sphere. Mol. Phys. 41:271-279
Wei YZ, A.C K, Sadeghi M, Sage JT, Tian WD, Champion PM, Sridhar S (1994) Protein
Hydration Investigations with High-Frequency Dielectric Spectroscopy. J. Phys.
Chem. 98:6644-6651
Wood K, Plazanet M, Gabel F, Kessler B, Oesterhelt D, Tobias DJ, Zaccai G, Weik M (2007)
Coupling of protein and hydration-water dynamics in biological membranes. Proc.
Natl. Acad. Sci. U.S.A. 104:18049-54
Wood K, Grudinin S, Kessler B, Weik M, Johnson M, Kneller GR, Oesterhelt D, Zaccai G
(2008a) Dynamical Heterogeneity of Specific Amino Acids in Bacteriorhodopsin. J.
Mol. Biol. 380:581-591
References
169
Wood K, Lehnert U, Kessler B, Zaccai G, Oesterhelt D (2008b) Hydration dependence of
active core fluctuations in bacteriorhodopsin. Biophys. J. 95:194-202
Wuttke J (2006) FRIDA (fast reliable inelastic data analysis)
http://sourceforge.net/projects/frida
Yan YB, Wang Q, He HW, Zhou HM (2004) Protein thermal aggregation involves distinct
regions: sequential events in the heat-induced unfolding and aggregation of
hemoglobin. Biophys. J. 86:1682-90
Zaccai G (2000) How soft is a protein? A protein dynamics force constant measured by
neutron scattering. Science. 288:1604-1607
Zanotti JM, Bellissent-Funel MC, Parello J (1999) Hydration-coupled dynamics in proteins
studied by neutron scattering and NMR: The case of the typical EF-hand calcium-
binding parvalbumin. Biophys. J. 76:2390-2411
Zerlin KF, Kasischke N, Digel I, Maggakis-Kelemen C, Temiz Artmann A, Porst D, Kayser
P, Linder P, Artmann GM (2007) Structural transition temperature of hemoglobins
correlates with species' body temperature. Eur. Biophys. J. 37:1-10
Zhang L, Wang L, Kao Y-T, Qiu W, Yang Y, Okobiah O, Zhong D (2007) Mapping
hydration dynamics around a protein surface. Proc. Natl. Acad. Scie. U.S.A.
104:18461-18466
Zimmerman SB, Minton AP (1993) Macromolecular Crowding: Biochemical, Biophysical
and Physiological Consequences. Ann. Rev. Biophys. Biomol. Struct. 22:27-65

References
170

171
10. Appendix

172
173
10.1 From shell to cell: neutron scattering studies of
biological water dynamics and coupling to activity
The following article presents neutron scattering measurements of the dynamics of water in
the hydration shell and the coupling between protein and water motion. Different biological
systems were studied: a soluble protein, a membrane protein, Escherichia coli and red blood
cells.
I contributed to the article with the measurement of water dynamics in red blood cells on the
time-of-flight spectrometer TOFTOF at FRM-II, Munich.

174
Faraday Discussions 141
This volume focuses on condensed phase water and its microscopic structure, properties and behaviour at interfaces. Experimental and theoretical scientists from the gas-phase clusters community, the surface science community and the condensed-phase (liquid) community present work on:
The surface charge of the liquid water surface
Biological interfaces and non-linear optical tools
Ice interfaces
The nanoscale, confined interfaces and electrochemical systems
with the aim of unifying views in order to understand the microscopic structure and behaviour of condensed phases of water at interfaces and progressing into the bulk.
Faraday Discussions Vol 141
Faraday Discussions Vol 141
Faraday Discussions
Vol 141Faraday Discussions documents a long-established series of Faraday Discussion meetings which provide a unique international forum for the exchange of views and newly acquired results in developing areas of physical chemistry, biophysical chemistry and chemical physics.
The papers presented are published in the Faraday Discussion volume together with a record of the discussion contributions made at the meeting. Faraday Discussions therefore provide an important record of current international knowledge and views in the field concerned.
Water – From Interfaces to the Bulk
www.rsc.org/faraday_d
Water – From
Interfaces to the Bulk
2009

From shell to cell: neutron scattering studiesof biological water dynamics and couplingto activity†
A. Frolich,‡a F. Gabel,a M. Jasnin,b U. Lehnert,xa D. Oesterhelt,c
A. M. Stadler,b M. Tehei,b M. Weik,a K. Woodkab and G. Zaccai*ab
Received 1st April 2008, Accepted 19th June 2008
First published as an Advance Article on the web 31st October 2008
DOI: 10.1039/b805506h
An integrated picture of hydration shell dynamics and of its coupling to
functional macromolecular motions is proposed from studies on a soluble
protein, on a membrane protein in its natural lipid environment, and on the
intracellular environment in bacteria and red blood cells. Water dynamics in
multimolar salt solutions was also examined, in the context of the very slow water
component previously discovered in the cytoplasm of extreme halophilic archaea.
The data were obtained from neutron scattering by using deuterium labelling to
focus on the dynamics of different parts of the complex systems examined.
Introduction
Understanding the dynamic state of water in biological systems and its influence onmacromolecular activity is a major scientific challenge. The huge diversity displayedby living organisms is based on a few unifying principles. All known living organismsare constituted of cells or have been through a cellular stage. They require the full setof a variety of macromolecules of specific chemical type (DNA, RNA, proteins.),ions, specific small molecules and water, in order to thrive and reproduce. Life onEarth has colonized every possible niche in conditions that span extremes in solventsalinity and pH values, temperature and pressure. A scoop of soil, a sample of water,of ice, of air or even of rock from just about anywhere on Earth—including thepoles, the tops of the highest mountain ranges, the deepest ocean trenches, neutralor alkaline salt lakes, or very hot acidic volcanic springs—are all likely to reveal bio-logical activity. Ice usually has liquid inclusions, and organisms that live at temper-atures well above 100 C are under high pressure, in which the water is still liquid. Aswas debated at a Royal Society discussion published in 2004,1 the availability ofliquid water may well be the only environmental requirement for Life. The extremehalophilic archaea live in salt lakes and saline ponds in essentially saturated saltwater; they counterbalance the osmotic pressure due to the external multimolar
aInstitut de Biologie Structurale, UMR 5075, CEA–CNRS–UJF, 41 rue Jules Horowitz, 38027Grenoble, FrancebInstitut Laue Langevin, 6 rue Jules Horowitz, BP 156 Grenoble Cedex 9, France. E-mail:[email protected]; Tel: +33 (0)4 76 20 76 79cMax Planck Institut fur Biochemie, Am Klopferspitz 18, D-82152 Martinsried, Germany
† All the authors contributed equally to the work.
‡ Present address: Universitat Karlsruhe, Germany
x Present address: McKinsey & Co., London, UK
Present address: AINSE, School of Chemistry, University of Wollongong, Australia
k Present address: University of Groningen, The Netherlands
PAPER www.rsc.org/faraday_d | Faraday Discussions
This journal is ª The Royal Society of Chemistry 2009 Faraday Discuss., 2009, 141, 117–130 | 117
NaCl concentration by accumulating multimolar KCl in their cytoplasm. Consid-ering the inside of a cell is already very crowded with macromolecules, which occupyclose to 30% of its volume, what is the state of the water compared to that in the bulkliquid? There are about 55 moles in a kilogramme of water. In a six molal solution ofa fully ionised monovalent salt, therefore, there are 4.5 water molecules per ion. Ionsmay be coordinated by six water molecules, so that each and every water moleculehas at least one ion as one of its nearest neighbours, leading to significantly reducedwater activity. The existence of extreme halophiles proves that Life has adapted toreduced water activity, but there is no evidence that water can be done away withaltogether in biological activity.
In this paper, we present and discuss results on water dynamics in differentbiological systems, and on the coupling between biological activity and the environ-ment around macromolecules: water in the case of soluble proteins, water and lipidsin the case of membrane proteins.
Neutron scattering is a particularly suited experimental technique to probe waterdynamics under different conditions. Slow neutrons scatter off bound protonsexchanging energy in the thermal range corresponding to the picosecond–nanosecond(ps–ns) time-scale, and momentum corresponding to the 0.1 nm length-scale. Energy-resolved incoherent neutron scattering, especially in the elastic (EINS) and quasielas-tic (QENS) scattering modes, have been informing us on water dynamics underdifferent conditions for decades. Because the method relies on incoherent scattering,samples need not be crystalline or even monodisperse and measurements can beperformed on highly complex systems such as living cells2 or stacks of naturalmembranes.3 The incoherent neutron scattering cross section of hydrogen is morethan an order of magnitude larger than that of other atomic nuclei usually found inbiological material and their isotopes, including deuterium, and the development ofin vivo specific deuterium-labelling methods permitted the focus on water dynamicsin complex biological samples, and its coupling with biological function and activity.
While a consensus has emerged that water molecules close to protein surfaces aredynamically slowed down with respect to bulk water molecules, quantitative aspectsand the mechanisms involved remain the objectives of active research (reviewed byBall4). Reports on the dynamics of water molecules close to protein surfacesmeasured by neutron spectroscopy were presented at a previous Faraday Discus-sion.5,6 The factors found for the slowing down of the diffusion coefficient of hydra-tion water compared to bulk water varied between 2 and 100, depending on theprotein, temperature and hydration conditions. Bon et al.7 studied hydration waterin lysozyme crystals by QENS. They distinguished two water populations, denotedas ‘‘first’’ and ‘‘second’’ hydration shells, with diffusion coefficients slowed down bya factor of 10 and 50 compared to bulk water respectively. By combining EINS datafrom two spectrometers, Gabel and Bellissent-Funel8 reported diffusion coefficientsof deuterated C-phycocyanin hydration water, in the presence of trehalose mole-cules, which are slowed down by a factor of 10–15 with respect to bulk water. Ashas been pointed out, however, in Gabel et al.9 and by Gabel and Bellissent-Funel,8
results obtained at different energy resolutions, different wave-vector transfers andusing different fit models are not directly comparable.
On the scale of the biological cell, water constitutes the malleable matrix thatenvelops and sustains intracellular components and biological activity. Consideringthat macromolecular concentration in the cytoplasm can reach 400 mg ml1, to whatextent is water dynamics perturbed by steric confinement between macromolecularsurfaces? Does the cell ‘tame’ water behaviour as some believe (reviewed byBall4)? While widely differing opinions concerning the dynamic state of water inthe cell are represented in the biology community, there has been very little workon atomic-scale measurements of intracellular water dynamics in close to physiolog-ical conditions. Below, we present and discuss recent neutron scattering experimentsperformed on different cell systems, which shed light on in vivo intracellular waterdynamics.
118 | Faraday Discuss., 2009, 141, 117–130 This journal is ª The Royal Society of Chemistry 2009

Hydration water is an integral and essential part of a protein structure. Without itthe macromolecule would not be folded correctly. It is essential for the protein tofulfil its biological function. Devoid of hydration water, proteins are inactive10
and lack essential motions, thus implicitly suggesting a close relationship betweenprotein and hydration-water dynamics. The term ‘slaving’ has been used to expressthat water can impose its dynamical fingerprint on a protein.11,12 Cryo-temperature-dependent neutron scattering experiments revealed the solvent dependence ofdynamical transitions in soluble proteins13–21 and in RNA22 and provided insightsinto the coupling between them. Molecular dynamics simulations suggested theonset of water translational diffusion to be at the origin of the dynamical transi-tion.23,24 In contrast, however, the onset of hydration-water translational diffusionat 200 K, in a membrane, was not observed to trigger a dynamical transition inthe membrane protein,25,26 suggesting a more complex interaction between protein,water and the membrane lipid environment. Recent neutron scattering studies, usingspecific deuterium labelling, confirmed that a dynamical transition coincides with theonset of hydration water translational diffusion, in the case of a soluble protein,27
but not in the case of a membrane protein.3,28
By using specific deuteration and samples with controlled hydration, waterdynamics was measured directly by neutron scattering in the hydration shell arounda soluble protein and a natural membrane and correlated with macromoleculardynamics, as well as in situ in prokaryotic and red blood cells.
Maltose binding protein (MBP) is a soluble monomeric protein of 41 kDa. It playsan essential role in the metabolism of E. coli.29 In vivo deuteration of MBP allowed thedirect extraction of hydration-water dynamics in neutron scattering experiments on thedeuterated protein hydrated in H2O. Water dynamics thus obtained were compared toprotein dynamics obtained by measuring the natural abundance of MBP in D2O.27
The purple membrane (PM) of H. salinarum is formed of a highly ordered two-dimensional lattice of archaeal specific lipids and the retinal binding protein, bacte-riorhodopsin (BR).30 BR functions as a light-driven proton pump. Its activity can befollowed quite sensitively by spectroscopic methods because it is associated witha millisecond photocycle of protein conformational changes and retinal colourchanges. Integral membrane proteins are active in a complex environment consti-tuted of lipid hydrocarbon chains, lipid head groups and hydration water in contactwith different parts of the protein. By using fully deuterated membranes hydrated inH2O and natural abundance membranes hydrated in D2O, the coupling betweenhydration water and membrane dynamics has been explored.3,28 In another set ofexperiments, the dynamic coupling between membrane protein and lipids wasobserved by applying in vivo deuterium labelling and in vitro reconstitution of PM.The samples allowed the observation of the lipid and protein dynamics, separately.In vivo neutron scattering measurements in the cytoplasm of deuterated prokary-
otic organisms revealed very different water-dynamic behaviour in bacteria andextreme halophilic archaea. In order to examine the effect of the high salt environ-ment within halophilic archaea, water dynamics was measured in saturated KCl andNaCl solutions. The water dynamics inside red blood cells (RBC), which containmainly the equivalent of a 300 mg ml1 solution of hemoglobin, was also measured.
The joint analysis of the results allowed us to propose a coherent view of waterdynamics in the hydration shell, the lipid environment of a membrane protein andthe intracellular milieu in various cell types, as well as of the dynamic couplingbetween biological activity and environment.
Materials and methods
Samples
The expression and purification of deuterated and natural abundance MBP has beendescribed before.27 For neutron scattering experiments, powders of deuterated and
This journal is ª The Royal Society of Chemistry 2009 Faraday Discuss., 2009, 141, 117–130 | 119

natural abundance MBP were hydrated to a level of 0.4 g water per g MBP in H2Oand D2O respectively (for details see Wood et al.27).
PM was extracted from natural abundance or fully deuterated cultures of H. sal-inarum as described before.31,32 The experiments were performed on membrane-water stacks in H2O or D2O with lamellar spacings of 54 A, corresponding to aninter-membrane water layer of 5 A, and a hydration level of approximately 0.1 gwater per g membrane.28 The specifically labelled lipid and BR samples wereprepared by delipidation and reconstitution as described in detail by Lehnert.33
Three reconstitutions were prepared: (i) a control sample of hydrogenated BR andhydrogenated lipids (H-BR–H-lip or H–H); (ii) a sample with hydrogenated BRand deuterated lipids (H-BR–D-lip or H–D); (iii) a sample with deuterated BRand hydrogenated lipids (D-BR–H-lip or D–H). Several parameters were tested inorder to find optimum reconstitution conditions. When the buoyant density (froma sucrose gradient) of the fully hydrogenated reconstitution (H–H) correspondedto native PM, the conditions were considered as correct and applied to the hybriddeuterated PM samples. The experimental values agreed well with the expectedones indicating that the lipid-to-BR ratio corresponded to that in natural PM.X-ray and neutron diffraction indicated poor lattice formation in the reconstitutedsamples. Light-induced cross-linking indicated that the probability of trimer forma-tion in the reconstituted sample was smaller compared to dimer formation, incontrast to native PM. The UV absorption spectrum indicated a shift of the boundretinal peak to 567 nm, compared to 570 nm in native PM, as observed before inreconstituted samples. The lipid composition of the reconstituted samples was inves-tigated in the negative-ion mode of electrospray ionisation (ESI) mass spectrometry.Traces of hydrogenated phospho- and glyco-lipids were observed indicating thatthey were not removed during the delipidation process. The hydrogenated contribu-tion accounted for about 5% of the total. It arises from lipid strongly associated tothe protein and that was not removed in the delipidation process. The special inter-action between the glycolipids and the protein has been discussed by Weik et al.34
Deuterated E. coli (BLE21(DE3) strain) were cultivated as described previously.35
Cell pellets containing H2O or D2O buffer were prepared in such a way as to reducestrongly the quantity of extracellular water in the sample, which was found to repre-sent less than 7% of the total water (see Jasnin et al.35 for details).
Deuterated H. marismortui cells were grown at 37C to an optical density of 0.8–1(late logarithmic phase) in the medium described before,36 in which yeast extract wasreplaced by deuterated algal extract produced at the Max Planck Institut fur Bioche-mie (Martinsried, Germany). For neutron scattering experiments, cells were pelletedin D2O or H2O buffer (see Tehei et al.36 for details).
For the RBC experiments, samples of human venous blood were taken fromhealthy adults. The cells were washed with phosphate buffer solution (PBS) andwere gassed with CO to increase the stability of hemoglobin. The glycocalyx matrixwas removed as described elsewhere.37 Half of the cells were then washed with D2OPBS buffer until the level of H2O was below 0.1%. No cell lysis was detected duringthe preparation and the shape of the cells was checked with optical microscopy.
Neutron scattering
Elastic incoherent neutron scattering (EINS) experiments provide information onatomic mean-square displacements (MSD) in a sample as a function of tempera-ture.38 These are obtained from a Gaussian approximation plot of the scatteredelastic intensity dependence on scattering vector amplitude,39 Q: ln I(Q) ¼ 1/6hu2iQ2. In an incoherent scattering situation, waves scattered by a single nucleusat different positions as it moves in time interfere to give a Q-dependent scatteringpattern. The pattern then contains information on the shape of the volume tracedby the moving particle in the same way as a small-angle scattering curve containsinformation on the shape of a particle in solution. The Gaussian approximation
120 | Faraday Discuss., 2009, 141, 117–130 This journal is ª The Royal Society of Chemistry 2009

given above is therefore a direct analogy to the Guinier approximation, with theradius of gyration squared defined as half the MSD value; the domain of validityof the approximation is for hu2iQ2 smaller than or about 2.39 The time-scaleexamined of 1 ns on IN16 (http://www.ill.eu/in16/home/) at the Institut Laue Lan-gevin (ILL) depends on the energy resolution of the spectrometer, while the rangeof the scattering vector, Q, in which the scattered intensity is measured, definesthe length-scale which is of the order of 1 A for IN16. Plots of MSD as a functionof absolute temperature are called elastic scans. MSD are in absolute A2 units.An effective dynamic resilience expressed as an elastic force constant (in Newtonsper metre) can be calculated from the inverse of the slope of hu2i versus T.38,40
Elastic scans for proteins and membranes usually show a break in slope at about200 K, which has been interpreted as a dynamical transition from a harmoniclow-temperature regime to an anharmonic regime that has been modelled, forexample, by a double-well free-energy potential.15 In a quasi-harmonic approxi-mation, the dynamical transition is associated with a significant decrease inresilience.
An exhaustive description of quasielastic incoherent neutron scattering (QENS)can be found in Bee.41 QENS is measured as a function of both energy transferand scattering vector, Q. On the energy scale, the elastic scattering appears asa peak centred on zero energy transfer whose width corresponds to the spectrometerresolution. The QENS appears as a significantly broader peak, also centred on zeroenergy transfer. The shape of the QENS peak and its Q variation contain informa-tion on the time and geometry associated with the motion of the scattering particle.In the case of simple exponential diffusion processes, the QENS spectra can be fittedmathematically by Lorentzian functions. By applying various models, such as thejump diffusion, Singwi–Sjolander and Sears models (see Bee41 for details), to fitthe Lorentzian width as a function of Q, it is possible to calculate rotational relax-ation and correlation times, translational residence time and translational androtational diffusion coefficients for the scattering particle. Instruments used forQENS experiments were IN16 at ILL (energy resolution 0.9 meV, correspondingto a time-scale of 1 ns, see above), BSS backscattering spectrometer (energy resolu-tion also of 0.9 meV, at the Julich Neutron Centre, see http://www.jcns.info/), IN6 atILL (energy resolution of 90 meV, corresponding to a time scale of 10 ps, see http://www.ill.eu/in6/home/), TOFTOF at the Munich FRM2 reactor (energy resolutionof 100 meV, similar to IN6; see ref. 42 for instrumental details), IRIS at the ISISspallation neutron source at the Rutherford Laboratory (energy resolution of17 meV, corresponding to a time scale of 50 ps, see http://www.isis.rl.ac.uk/molec-ularSpectroscopy/iris/), and IN5 at the ILL (http://www.ill.eu/in5/), which can betuned for different energy resolution and Q-range values.
Data from the following neutron scattering experiments are discussed in thepaper. In order to avoid laborious repetition and because different experimentalconditions applied to the different studies, more detailed descriptions of experi-mental conditions are given in the relevant Figure caption or results section.
- Elastic scans on deuterated or natural abundance maltose binding protein inH2O or D2O collected on the IN16 spectrometer.
- Elastic scans on native and fully deuterated purple membrane in H2O or D2Ocollected on the IN16 spectrometer.
- Elastic scans on specifically deuterated (in the lipid or protein parts), reconsti-tuted purple membrane collected on the IN16 spectrometer.
- QENS scans on IN6 and IRIS to measure water diffusion inside deuteratedE. coli.
- QENS scans on TOFTOF to measure water diffusion inside red blood cells.- QENS scans on IN16 and IN6 to measure water diffusion in deuterated H. mar-
ismortui, with a control experiment using BSS on deuterated E. coli.- QENS scans on IN5 to measure water diffusion in concentrated solutions of
NaCl and KCl.
This journal is ª The Royal Society of Chemistry 2009 Faraday Discuss., 2009, 141, 117–130 | 121

Results
Hydration-water dynamics and coupling to the soluble maltose binding protein fromE. coli
Water structure43,44 and dynamics5,8,9 at the vicinity of a soluble protein surface aredifferent from in the bulk liquid state. MBP powders hydrated at 0.4 g water per gprotein contain one hydration layer per protein molecule. The deuterated MBP inH2O gave access to the dynamics of hydration water, which contributes 73% tothe total incoherent scattering cross section but only 2% in natural abundanceMBP in D2O. The MSD of water and protein motions, plotted in Fig. 1A, are similarup to 220 K, at which temperature they both exhibit a transition.27 Above 220 K, thewater MSD are above those of the protein.
Fig. 1 (A) Mean square displacements (MSD) of maltose binding protein (MBP) and itshydration water.27 Dynamic transitions in the hydration water and in MBP take place at similartemperatures (220 K). (B) MSD of purple membrane (PM) and its hydration water.28 Dynam-ical transitions take place at 200 K in the hydration water and at 120 and 260 K in PM. Theelastic scans were carried out on the IN16 spectrometer with an energy resolution of 0.9 meV(full-width at half-maximum of the elastic peak and a wavelength of 6.275 A63). MSD wereextracted from data in the following Q [Q with units of A1] ranges: 0.2 < Q2 < 1.8 for hydro-genated MBP in D2O (panel A, grey circles), 0.2 < Q2 < 1.1 for deuterated MBP in H2O (panelA, black diamonds), 0.2 < Q2 < 1.5 for hydrogenated PM in D2O (panel B, grey circles), 0.2 <Q2 < 0.9 for deuterated PM in H2O (panel B, black diamonds).
122 | Faraday Discuss., 2009, 141, 117–130 This journal is ª The Royal Society of Chemistry 2009

Hydration water dynamics in purple membrane and coupling to bacteriorhodopsinand membrane lipids
PM stacks were hydrated to a level that corresponds to one hydration layer permembrane surface (i.e. 5 A of inter-membrane water). EINS experiments ondeuterated PM hydrated in H2O permitted us to access the dynamics of the firsthydration layer directly. In the sample, 60% of the total incoherent scattering crosssection was calculated to be due to the contribution of inter-membrane water. Incontrast, as with the MBP samples discussed above, in natural abundance PMhydrated in D2O the contribution from hydration water is negligible and the totalincoherent scattering cross section is strongly dominated by the PM (77% BRprotein, 23% lipids), thus reflecting membrane dynamics. The elastic temperaturescans are presented in Fig. 1B.28 Hydration-water MSD increase linearly up to200 K, at which temperature there is a break in slope suggesting a dynamicaltransition in water dynamics. The PM MSD show breaks in slope at 120 and260 K, but not at 200 K.
The in vitro reconstituted PM samples were characterised by UV spectrophotom-etry, cross-linking experiments for BR trimer formation, mass spectrometry forlipid composition and deuterium labelling, and X-ray diffraction for lattice forma-tion and order (see Materials and methods). Studying the reconstituted hydroge-nated BR and hydrogenated lipids sample (H-BR–H-lip) probed the globaldynamics of the whole membrane (68% of the incoherent scattering cross sectionis from BR, 31% from lipids), whilst in the hydrogenated BR, deuterated lipidsample (H-BR–D-lip) BR clearly dominated the signal (98%). Using deuteratedBR with hydrogenated lipids (D-BR–H-lip) provided information on the lipiddynamics, which represent 92% of the incoherent scattering cross section. Fig. 2presents the MSD measured for the H-BR–H-lip and D-BR–H-lip reconstitutedsamples at 93% relative humidity which represent, respectively, dynamics of globalPM and of the native archaeal lipids in the membrane on the ns time-scale. TheH-BR–D-lip sample MSD are not shown; they were very close and slightly belowthe H-BR–H-lip values, as expected from the BR-to-lipid ratio in the membranecomposition. The MSD of the H-BR–H-lip sample are very similar to those ofnatural PM. The two-dimensional lattice in the reconstituted samples, however,was not as well ordered as in the natural membrane, indicating that membrane
Fig. 2 Mean-square displacements (MSD) extracted from the analysis of the elastically scat-tered neutron intensity, measured on the IN16 spectrometer at the ILL (energy resolution, full-width at half-maximum, of 0.9 meV). The MSD, hu2i, were calculated using the Gaussianapproximation: Iel,T(Q,u ¼ 0) ¼ Aexphu2iQ 2/6 , in which Iel,T(Q,u ¼ 0) is the elasticallyscattered intensity at temperature T; Q and u are the momentum and energy transfer, respec-tively, and A is a constant. Data are shown for the H-BR–H-lip (H–H) and D-BR–H-lip (D–H)reconstituted samples (see Materials and methods). Samples were hydrated to 93% relativehumidity in D2O.
This journal is ª The Royal Society of Chemistry 2009 Faraday Discuss., 2009, 141, 117–130 | 123

internal dynamics in the ns time-scale is not influenced by lattice order. As seen inFig. 2, between 20 and about 200 K, the MSD of both samples are the same, witha deviation from harmonic behaviour at about 150 K: PM and its lipid componentshave similar vibrational dynamics at very low temperatures and display the anhar-monicity associated with methyl rotations from about 150 K.14,45 We recall that PMlipids do not have fatty acid chains but phytol chains that are rich in methylgroups. Above 200 K, the MSD of the two samples become clearly different,with the archaeal phytol chains displaying greatly increased dynamics comparedto the average membrane. In both samples shown in Fig. 2, further onsets oflarge-amplitude motions occur at 260 K, suggesting coupled increases in dynamicsin the lipid and protein components of PM.
Intracellular water dynamics in E. coli and red blood cells
E. coli water dynamics was studied in fully deuterated cell pellets resuspended inH2O and D2O buffers respectively. A subtraction of the cell spectra measured inD2O from the cell spectra measured in H2O, scaled by the sample mass, provideda good approximation to the scattering signal from the water present in the samples.A sample of H2O buffer alone was measured as well, and used as a reference forinterpreting the data. The measurements were carried out on two neutron spectrom-eters, IN6 and IRIS (see Materials and methods), to cover diffusive motions fromthose of bulk to interfacial water. IRIS and IN6 QENS spectra were well fitted usinga single and two Lorentzian functions, respectively (see Jasnin et al.35 for details).The Lorentzian extracted on IRIS was attributed to translational motions of cellwater. Its half-width at half-maximum (HWHM), GT, was extracted and best fittedusing a jump diffusion model,41 which describes diffusion between sites for the waterprotons with a mean residence time, t0, at each site. We found the followingvalues for the translational diffusion coefficients, DT, and associated t0: DT ¼1.53 105 cm2 s1, t0 ¼ 2.63 ps at 281 K and DT ¼ 2.39 105 cm2 s1, t0 ¼2.16 ps at 301 K. DT values are very close to those of bulk water at correspondingtemperatures, with residence times about twice as long. The rotational water contri-bution emerged from the broad Lorentzian extracted from IN6 QENS spectra. Wefound the following rotational correlation times, tcor,R: tcor,R ¼ 1.96 ps at 281 K,and 1.54 ps at 301 K. The values were close to the values extracted for the bufferunder the same conditions and of the same order as the values measured for bulkwater by QENS46 and NMR.47 From the two sets of data, we concluded thatE. coli water dynamics is dominated by a bulk-like water component at physiologicaltemperature. A similar conclusion was reached for water in RBC, indicating that theresult was not restricted to bacteria (see below).
The diffusion of cytoplasmic water in whole human RBC was measured byQENS. RBC grow in the bone marrow of mammals, and deuterated material isnot available so far. Natural abundance cells were measured in H2O and D2Obuffers with high precision and the scattering data were subtracted from each other,to yield intensities representing the dynamics of water only. As a reference, H2Obuffer solution was measured. The experiment was performed on the time-of-flightneutron spectrometer TOFTOF42 at the Munich FRM2 reactor, with an energyresolution of 100 meV, in the temperature range 290 to 320 K. The measured spectrain the Q-range from 0.5 to 1.5 A1 were well fitted from 1.5 to +1.5 meV witha narrow and a broad Lorentzian function plus linear background, correspondingto translational and rotational motions of the water molecules respectively. TheHWHM profile as a function of Q2 of the narrow Lorentzian are in agreementwith a jump diffusion model.41 The translational diffusion coefficient, DT, and theresidence time, t0, of water were obtained from the fits. The diffusion coefficientsof cytoplasmic water are only slightly reduced compared to those obtained for thebuffer solution, but interestingly the residence times of cytoplasmic water are onaverage five times higher than in buffer solution (details are given in Stadler et al.48).
124 | Faraday Discuss., 2009, 141, 117–130 This journal is ª The Royal Society of Chemistry 2009
Extreme halophiles: a special case?
Intracellular water dynamics in H. marismortui, an extreme halophile originally iso-lated from the Dead Sea, was studied by QENS. Water motions in centrifuged cellpellets were measured by means of two spectrometers, IN6 and IN16, sensitive tomotions with time-scales of 10 ps and 1 ns respectively (see Materials and methods).From IN6 time-of-flight data, using the model of Singwi and Sjolander,49 a transla-tional diffusion constant of 1.3 105 cm2 s1 was determined at 285 K for H. mar-ismortui cells. The value is close to that found previously for other cells and close tothat for bulk water, as well as that of the water in the 3.5 M NaCl solution bathingthe cells.50 A very slow water component was discovered from the IN16 data (energyresolution of 0.9 meV). At 285 K, the values of HWHM are independent on Q2. Thewater protons of this component displayed a residence time of 411 ps (comparedwith a few ps in bulk water). At 300 K, the residence time dropped to 243 ps andwas associated with a translational diffusion of 9.3 108 cm2 s1, or 250 times lowerthan that of bulk water. The slow water accounts for about 76% of cell water inH. marismortui. No such slow water was found in E. coli, measured on the BSS back-scattering spectrometer (energy resolution of 0.9 meV, at the Julich Neutron Centre(see http://www.jcns.info/)). It was hypothesized that the slow mobility of a largepart of H. marismortui cell water indicates a specific water structure responsiblefor the large amount of K+ bound within these extreme halophilic cells.
In order to estimate the influence of the solvent ions on the intracellular waterdynamics in the extreme halophiles, we studied the diffusion coefficients of waterin molar solutions of KCl and NaCl by QENS. To this end, a 3M KCl and a 4MNaCl (each at 50 mM Tris, pH ¼ 7.6, T ¼ 298 K) were measured on the instrumentIN5 at the ILL (see Materials and methods for web details), at an energy resolutionof 63 meV (l ¼ 6 A) in the wave-vector range 0.26 < Q < 1.87. The quasielasticspectra were fitted in the energy transfer range 0.5 to +0.5 meV with a scatteringlaw constituted of a linear background, an elastic intensity and a single quasielasticcontribution, interpreted within the Singwi–Sjolander model.49 The model assumesthat individual water molecules diffuse during a time t1 and vibrate during a timet0 around an equilibrium position. In the approximation t1 [ t0, we extractedthe apparent diffusion coefficient, Dapp, from the HWHM of the QENS spectra asa function of Q (Fig. 3).
The following apparent diffusion coefficients (combining translational and rota-tional motions) were measured (the bulk water value is from the literature): Dapp
(4M NaCl in H2O, T ¼ 298 K) ¼ 1.5 105 cm2 s1; Dapp (3M KCl in H2O,T ¼ 298 K) ¼ 2.0 105 cm2 s1 and Dapp (bulk water,5 T ¼ 298 K) ¼ 2.3 105 cm2 s1. The results showed clearly that the presence of molar salt concentrationof NaCl or KCl hardly affects the diffusive properties of water. The findings supple-ment QENS data published earlier at different salt concentrations and tempera-tures.51 Only a weak dependence of the water diffusion coefficient on NaClconcentration (up to 6 M NaCl) was found. In the case of KCl (up to 3.2 M), thediffusion coefficient was similar to that of bulk water. Furthermore, characteristicwater frequencies (in the range from 100 to 1000 cm1) persisted up to 4.6 M KCland 0.5 M NaCl respectively. It is only in the case of very small or highly chargedions (Li+, Mg2+, La3+ etc.) that the authors could find a decrease of the waterdiffusion coefficient at higher concentrations (>1 M).
It can be concluded that the presence of high salt concentrations in the cytoplasmof extreme halophilic archaea, multimolar NaCl and KCl, is not responsible by itselffor the very slow water component observed by Tehei et al.36
Discussion
The hydration shell is vital to a macromolecule’s biological activity. Without hydra-tion water, proteins would lack not only their correctly folded structure but also the
This journal is ª The Royal Society of Chemistry 2009 Faraday Discuss., 2009, 141, 117–130 | 125

conformational flexibility that brings them to life and allows their biological activity.Consequently, protein and hydration water dynamics are supposed to be intimatelycoupled. One way of exploring the coupling has exploited the so-called proteindynamical transitions, characteristic changes in MSD that appear in at temperaturesbetween about 180 and 250 K. Do hydration-water MSD show similar behaviour,and if so, does the ‘transition’ temperature coincide with the protein dynamical tran-sition temperature? The questions were addressed in the soluble MBP27 and inPM,3,28 by using neutron scattering combined with deuterium labelling to examinethe dynamics of each component separately. The first layer of hydration water inboth PM and MBP showed a characteristic change in MSD at temperatures between200 and 220 K (Fig. 1) that was attributed to the onset of translational diffusion3,27
as proposed earlier.23 Water and protein transitions in MBP appeared at the sametemperature (Fig. 1A), as expected from the intimate coupling between hydrationwater and soluble protein dynamics, which has been reported frequently in the liter-ature (see e.g. Doster et al.;15 Cordone et al.;52 Fitter;16 Reat et al.;19 Tsai et al.;21
Vitkup et al.;53 Zaccai;38 Paciaroni et al.;18 Fenimore et al.;11 Chen et al.;13 Roh
Fig. 3 Q2-Dependence of the Lorentzian half-widths at half-maximum (HWHM) extractedfrom the quasielastic spectra of the multimolar NaCl and KCl solutions measured on IN5(see Materials and methods) with an energy resolution of 63 meV. 4M NaCl and 3M KCl solu-tions were investigated both in D2O (top) and H2O (bottom). The continuous lines representthe fits obtained with the Singwi–Sjolander model,49 which were used to extract the apparentdiffusion coefficients.
126 | Faraday Discuss., 2009, 141, 117–130 This journal is ª The Royal Society of Chemistry 2009

et al.;20 Swenson et al.;54 Joti et al.;17 and Doster14). In the case of PM, however, thehydration water and membrane transitions were found to be separated by as muchas 60 K (Fig. 1B). The onset of water translational motion in the first3,28 andsecond25,26 hydration layers at 200 K did not trigger a dynamical transition inPM. The data from specifically labelled reconstituted PM permitted the separatedobservation of lipid and BR dynamics and showed that the membrane proteindynamics is coupled to the dynamics of its lipid environment, as has been sug-gested,55,56 rather than to that of inter-membrane hydration water. The lipid compo-nent of PM constitutes only 25% of the membrane mass, and most of the lipidmolecules are in contact with protein. The neutron data nevertheless establishedthat the lipids in PM, above 200 K, display higher MSD and softer resilience thanBR (Fig. 2). As discussed above, 200 K is the temperature of onset of hydrationwater translational diffusion. It appears, therefore, that lipid dynamics respondsto the water. At 260 K there is another break in the MSD of the lipids towardsa domain of even smaller resilience (larger slope with temperature), which coincideswith a similar dynamic transition in BR. Early neutron diffraction experiments onPM, using H2O–D2O exchange to highlight water location, and their comparisonwith data from lipid bilayer models, had shown the extent of hydration penetratinginto the membrane around lipid head groups, and its dependence on the relativehumidity of the sample environment.57,58 Following these structural observationsand the observation that PM activity was inhibited in the dry membrane, it hasbeen speculated that a flexible lipid environment induced by high head-group hydra-tion was essential for BR functional dynamics.55 The parallel transitions in the lipidand BR MSD data at 260 K, observed in the reconstituted PM samples (Fig. 2),supports the hypothesis. At 200 K, the onset of translational diffusion in inter-membrane hydration water apparently induced some flexibility in the membranelipids but not sufficiently to free high-amplitude protein motions. At 260 K, perhapsrelated to a ‘melting’ of head-group hydration water, both the lipid and BR compo-nents of the membrane display a dynamical transition to lower-resilience, high-amplitude MSD motions.
At the intracellular level, the studies on E. coli and RBC revealed that waterdynamics is similar to the dynamics of water in the bulk state (Fig. 4D and zoomedin insets A, B, C). Our studies contributed to dismantle the concept that the cellsomehow ‘tames’ water by modifying its dynamics compared to bulk water.59
They confirmed the importance of hydration degree for water dynamics in confinedgeometries; in deuterated C-phycocyanin, for example, increasing water mobilityhad already been observed when hydration coverage reached one water layer.60
The first macromolecular hydration layer accounts for about 0.4 to 0.5 g of waterper g of macromolecule. Macromolecular concentrations in E. coli and RBCcorrespond to about 300 to 400 mg ml1, i.e. to four to six water layers aroundmacromolecular surfaces. The analysis established that because of the relativelyhigh hydration level and resulting low water confinement, intracellular water formsa network of communication that is as fluid as bulk water. In both E. coli and RBC,however, residence times were found to be increased by a factor of 2 and 5, respec-tively, suggesting that water molecules spend longer times in the first hydration shellof macromolecular structures than in the bulk phase.
The extreme halophilic archaea appeared to present an exceptional case withrespect to cytoplasmic water mobility. The presence of multimolar NaCl and KClsalt concentrations in their cytoplasm is clearly not responsible by itself for thevery slow water component observed by Tehei et al.36 (Fig. 3). It was hypothesisedthat the slow mobility of a large part of H. marismortui cell water indicated a specificwater structure, which would also be responsible for the large amount of K+ boundwithin the extreme halophile cells. The absolute requirement of H. marismortui fora high salt environment and its ability to bind potassium ions specifically appearto be closely related to the low mobility of water in the cells. Halophilic proteinshave been shown to have special hydration and ion-binding properties associated
This journal is ª The Royal Society of Chemistry 2009 Faraday Discuss., 2009, 141, 117–130 | 127

with an excess of negative charge in carboxylic groups on their surface.61 The inter-actions may be similar to those of structured water around potassium ions andprotein carboxylic groups observed by MacKinnon62 in the potassium channelprotein. It would be of significant interest to measure water mobility in thesesystems, in order to assess if similar mechanisms are responsible for the slow watercomponent in the extreme halophile.
Acknowledgements
We thank Heloisa Nunes Bordallo, Bruno Deme, Bernhard Frick, Marek Koza,Mark F. Telling and Michaela Zamponi for their help during data collection atthe Institut Laue-Langevin, at ISIS and at the Julich Neutron Centre. This workwas supported by the Commissariat a l’Energie Atomique, the Centre National dela Recherche Scientifique, the Universite Joseph Fourier, an Agence Nationalede la Recherche Grant (project number JC05_45685), the European Union underthe DLAB contracts HPRI-CT-2001-50035 and RII3-CT-2003-505925, and theIntegrated Infrastructure Initiative for Neuron Scattering and Muon Spectroscopy(NMI3).
References
1 Philos. Trans. R. Soc. London, Ser. B, 2004, 359, 1–395.2 M. Tehei, B. Franzetti, D. Madern, M. Ginzburg, B. Z. Ginzburg, M. T. Giudici-Orticoni,
M. Bruschi and G. Zaccai, EMBO Rep., 2004, 5, 66–70.3 K. Wood, M. Plazanet, F. Gabel, B. Kessler, D. Oesterhelt, D. J. Tobias, G. Zaccai and
M. Weik, Proc. Natl. Acad. Sci. U. S. A., 2007, 104, 18049–18054.4 P. Ball, Chem. Rev., 2008, 108, 74–108.5 M. C. Bellissent-Funel, J. M. Zanotti and S. H. Chen, Faraday Discuss., 1996, 103, 281–294.6 M. Settles and W. Doster, Faraday Discuss., 1996, 103, 269–280.7 C. Bon, A. J. Dianoux, M. Ferrand and M. S. Lehmann, Biophys. J., 2002, 83, 1578–1588.
Fig. 4 Summary Figure, which shows hydration and coupling ‘from shell to cell’. TheFigure illustrates the main points presented and discussed in the paper, drawn in a large sche-matic cell. (A) Hydration around a soluble protein and coupling with protein dynamics. (B)Hydration around a membrane not coupled to membrane protein dynamics. (C) Dynamiccoupling between protein and lipid in the membrane. (D) Channels of free water flowingaround the hydrated macromolecules in the cell and the special case of the extreme halophile.
128 | Faraday Discuss., 2009, 141, 117–130 This journal is ª The Royal Society of Chemistry 2009
8 F. Gabel and M. C. Bellissent-Funel, Biophys. J., 2007, 92, 4054–4063.9 F. Gabel, D. Bicout, U. Lehnert, M. Tehei, M. Weik and G. Zaccai, Q. Rev. Biophys., 2002,35, 327–367.
10 J. A. Rupley and G. Careri, Adv. Protein Chem., 1991, 41, 37–172.11 P. W. Fenimore, H. Frauenfelder, B. H. McMahon and R. D. Young, Proc. Natl. Acad. Sci.
U. S. A., 2004, 101, 14408–14413.12 I. E. Iben, D. Braunstein, W. Doster, H. Frauenfelder, M. K. Hong, J. B. Johnson, S. Luck,
P. Ormos, A. Schulte, P. J. Steinbach, A. H. Xie and R. D. Young, Phys. Rev. Lett., 1989,62, 1916–1919.
13 S. H. Chen, L. Liu, E. Fratini, P. Baglioni, A. Faraone and E. Mamontov, Proc. Natl. Acad.Sci. U. S. A., 2006, 103, 9012–9016.
14 W. Doster, Eur. Biophys. J., 2008, 37, 591–602.15 W. Doster, S. Cusack and W. Petry, Nature, 1989, 337, 754–756.16 J. Fitter, Biophys. J., 1999, 76, 1034–1042.17 Y. Joti, H. Nakagawa, M. Kataoka and A. Kitao, Biophys. J., 2008.18 A. Paciaroni, S. Cinelli and G. Onori, Biophys. J., 2002, 83, 1157–1164.19 V. Reat, R. Dunn, M. Ferrand, J. L. Finney, R. M. Daniel and J. C. Smith, Proc. Natl.
Acad. Sci. U. S. A., 2000, 97, 9961–9966.20 J. H. Roh, J. E. Curtis, S. Azzam, V. N. Novikov, I. Peral, Z. Chowdhuri, R. B. Gregory
and A. P. Sokolov, Biophys. J., 2006, 91, 2573–2588.21 A. M. Tsai, D. A. Neumann and L. N. Bell, Biophys. J., 2000, 79, 2728–2732.22 G. Caliskan, R. M. Briber, D. Thirumalai, V. Garcia-Sakai, S. A. Woodson and
A. P. Sokolov, J. Am. Chem. Soc., 2006, 128, 32–33.23 M. Tarek and D. J. Tobias, Phys. Rev. Lett., 2002, 88, 138101.24 A. L. Tournier, J. Xu and J. C. Smith, Biophys. J., 2003, 85, 1871–1875.25 M. Weik, Eur. Phys. J. E: Soft Matter, 2003, 12, 153–158.26 M. Weik, U. Lehnert and G. Zaccai, Biophys. J., 2005, 89, 3639–3646.27 K. Wood, A. Frolich, A. Paciaroni, M. Moulin, M. Hartlein, G. Zaccai, D. J. Tobias and
M. Weik, J. Am. Chem. Soc., 2008, 130, 4586–4587.28 K. Wood, M. Plazanet, F. Gabel, B. Kessler, D. Oesterhelt, G. Zaccai and M. Weik, Eur.
Biophys. J., 2008, 37, 619–626.29 W. Boos and H. Shuman, Microbiol. Mol. Biol. Rev., 1998, 62, 204–229.30 D. Oesterhelt, Curr. Opin. Struct. Biol., 1998, 8, 489–500.31 D. Oesterhelt and W. Stoeckenius, Methods Enzymol., 1974, 31, 667–678.32 H. Patzelt, A. S. Ulrich, H. Egbringhoff, P. Dux, J. Ashurst, B. Simon, H. Oschkinat and
D. Oesterhelt, J. Biomol. NMR, 1997, 10, 95–106.33 U. Lehnert, Thesis in Biophysics, Universite Joseph Fourier, Grenoble, 2002.34 M. Weik, H. Patzelt, G. Zaccai and D. Oesterhelt, Mol. Cell, 1998, 1, 411–419.35 M. Jasnin, M. Moulin, M. Haertlein, G. Zaccai and M. Tehei, EMBO Rep., 2008, 9,
543–547.36 M. Tehei, B. Franzetti, K. Wood, F. Gabel, E. Fabiani, M. Jasnin, M. Zamponi,
D. Oesterhelt, G. Zaccai, M. Ginzburg and B. Z. Ginzburg, Proc. Natl. Acad. Sci.U. S. A., 2007, 104, 766–771.
37 A. Elgsaeter and D. Branton, J. Cell Biol., 1974, 63, 1018–1036.38 G. Zaccai, Science, 2000, 288, 1604–1607.39 V. Reat, G. Zaccai, M. Ferrand and C. Pfister, in Biological Macromolecular Dynamics:
Workshop on Inelastic and Quasielatic Neutron Scattering in Biology, ed. S. Cusack,H. Buttner, M. Ferrand, P. Langan and P. Timmins, Adenine Press, New York, 1996,pp. 117–122.
40 D. J. Bicout and G. Zaccai, Biophys. J., 2001, 80, 1115–1123.41 M. Bee, Quasielastic Neutron Scattering, Principles and Applications in Solid State
Chemistry, Biology and Materials Science, Adam Hilger, Bristol and Philadelphia, 1988.42 T. Unruh, J. Neuhaus and W. Petry, Nucl. Instrum. Methods Phys. Res., Sect. A, 2007, 580,
1414–1422, and erratum 585:1201.43 F. Merzel and J. C. Smith, Proc. Natl. Acad. Sci. U. S. A., 2002, 99, 5378–5383.44 D. I. Svergun, S. Richard, M. H. Koch, Z. Sayers, S. Kuprin and G. Zaccai, Proc. Natl.
Acad. Sci. U. S. A., 1998, 95, 2267–2272.45 J. H. Roh, V. N. Novikov, R. B. Gregory, J. E. Curtis, Z. Chowdhuri and A. P. Sokolov,
Phys. Rev. Lett., 2005, 95, 038101.46 J. Teixeira, M. C. Bellissent-Funel, S. H. Chen and A. J. Dianoux, Phys. Rev. A, 1985, 31,
1913–1917.47 G. Sposito, J. Chem. Phys., 1981, 74, 6943–6949.48 A. M. Stadler, J. P. Embs, I. Digel, G. Artmann, G. Zaccai and G. Bueldt, J. Am. Chem.
Soc., 2008, submitted.49 K. S. Singwi and A. Sjolander, Phys. Rev., 1960, 119, 863–871.
This journal is ª The Royal Society of Chemistry 2009 Faraday Discuss., 2009, 141, 117–130 | 129

50 B. N. Brockhouse, Nuovo Cimento, Suppl., 1958, 9, 45.51 P. Leung and G. Safford, J. Phys. Chem., 1970, 74, 3696–3709.52 L. Cordone, M. Ferrand, E. Vitrano and G. Zaccai, Biophys. J., 1999, 76, 1043–1047.53 D. Vitkup, D. Ringe, G. A. Petsko and M. Karplus, Nat. Struct. Biol., 2000, 7, 34–38.54 J. Swenson, H. Jansson and R. Bergman, Phys. Rev. Lett., 2006, 96, 247802.55 G. Zaccai, J. Mol. Biol., 1987, 194, 569–572.56 M. Kamihira and A. Watts, Biochemistry, 2006, 45, 4304–4313.57 G. Zaccai and D. J. Gilmore, J. Mol. Biol., 1979, 132, 181–191.58 P. K. Rogan and G. Zaccai, J. Mol. Biol., 1981, 145, 281–284.59 P. Mentre, Cell. Mol. Biol., 2001, 47, 709–715.60 M. C. Bellissent-Funel, J. M. Zanotti and S. H. Chen, Faraday Discuss., 1996, 103, 281–294.61 D. Madern, C. Ebel and G. Zaccai, Extremophiles, 2000, 4, 91–98.62 R. MacKinnon, FEBS Lett., 2003, 555, 62–65.63 B. Frick and M. Gonzalez, Phys. B, 2001, 301, 8–19.
130 | Faraday Discuss., 2009, 141, 117–130 This journal is ª The Royal Society of Chemistry 2009


191
10.2 Dynamics of apomyoglobin in the α-to-β transition and of partially unfolded aggregated protein
Protein dynamics during the α-to-β transition associated with amyloid formation was
measured on the model system apo-myoglobin. Characteristic elements for the structural
transition were found using wide angle X-ray solution scattering above around 55°C. Circular
dichroism (CD) was measured as a function of temperature and solvent condition. The
secondary structural content of apo-myoglobin during the structural transition was estimated
from the CD data. Protein dynamics was measured with incoherent elastic neutron scattering.
The data revealed a more resilient β-structure phase. A similar transition was found in holo-
myoglobin that was attributed to protein unfolding and aggregation. Mean square
displacements showed that the dynamical transition at around 200 K also occurs in a heat
denatured aggregated protein.
I contributed to the article with the analysis and interpretation of the neutron scattering
experiments, calculated the secondary structure content from the CD data and participated in
the writing of the article.

192
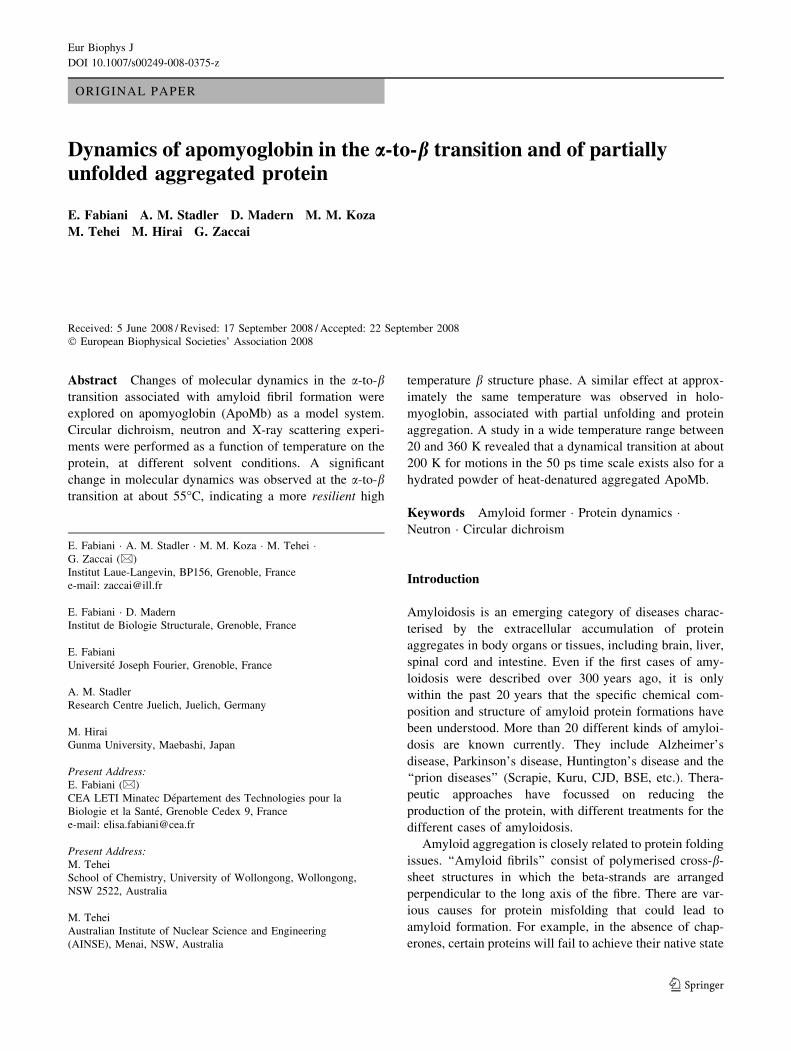
ORIGINAL PAPER
Dynamics of apomyoglobin in the a-to-b transition and of partiallyunfolded aggregated protein
E. Fabiani Æ A. M. Stadler Æ D. Madern Æ M. M. Koza ÆM. Tehei Æ M. Hirai Æ G. Zaccai
Received: 5 June 2008 / Revised: 17 September 2008 / Accepted: 22 September 2008
European Biophysical Societies’ Association 2008
Abstract Changes of molecular dynamics in the a-to-btransition associated with amyloid fibril formation were
explored on apomyoglobin (ApoMb) as a model system.
Circular dichroism, neutron and X-ray scattering experi-
ments were performed as a function of temperature on the
protein, at different solvent conditions. A significant
change in molecular dynamics was observed at the a-to-btransition at about 55C, indicating a more resilient high
temperature b structure phase. A similar effect at approx-
imately the same temperature was observed in holo-
myoglobin, associated with partial unfolding and protein
aggregation. A study in a wide temperature range between
20 and 360 K revealed that a dynamical transition at about
200 K for motions in the 50 ps time scale exists also for a
hydrated powder of heat-denatured aggregated ApoMb.
Keywords Amyloid former Protein dynamics Neutron Circular dichroism
Introduction
Amyloidosis is an emerging category of diseases charac-
terised by the extracellular accumulation of protein
aggregates in body organs or tissues, including brain, liver,
spinal cord and intestine. Even if the first cases of amy-
loidosis were described over 300 years ago, it is only
within the past 20 years that the specific chemical com-
position and structure of amyloid protein formations have
been understood. More than 20 different kinds of amyloi-
dosis are known currently. They include Alzheimer’s
disease, Parkinson’s disease, Huntington’s disease and the
‘‘prion diseases’’ (Scrapie, Kuru, CJD, BSE, etc.). Thera-
peutic approaches have focussed on reducing the
production of the protein, with different treatments for the
different cases of amyloidosis.
Amyloid aggregation is closely related to protein folding
issues. ‘‘Amyloid fibrils’’ consist of polymerised cross-b-
sheet structures in which the beta-strands are arranged
perpendicular to the long axis of the fibre. There are var-
ious causes for protein misfolding that could lead to
amyloid formation. For example, in the absence of chap-
erones, certain proteins will fail to achieve their native state
E. Fabiani A. M. Stadler M. M. Koza M. Tehei G. Zaccai (&)
Institut Laue-Langevin, BP156, Grenoble, France
e-mail: [email protected]
E. Fabiani D. Madern
Institut de Biologie Structurale, Grenoble, France
E. Fabiani
Universite Joseph Fourier, Grenoble, France
A. M. Stadler
Research Centre Juelich, Juelich, Germany
M. Hirai
Gunma University, Maebashi, Japan
Present Address:E. Fabiani (&)
CEA LETI Minatec Departement des Technologies pour la
Biologie et la Sante, Grenoble Cedex 9, France
e-mail: [email protected]
Present Address:M. Tehei
School of Chemistry, University of Wollongong, Wollongong,
NSW 2522, Australia
M. Tehei
Australian Institute of Nuclear Science and Engineering
(AINSE), Menai, NSW, Australia
123
Eur Biophys J
DOI 10.1007/s00249-008-0375-z

and may associate with other unfolded polypeptide chains
to form large amyloid fibrils. Misfolding can also occur
when a protein is subjected to particular conditions, such as
extremes of heat or pH. Understanding the physical bases
of misfolding in these cases is of fundamental scientific and
biotechnological importance. In the context it is important
to characterise the forces that stabilise protein structure,
and therefore its dynamics under relevant solvent
conditions.
Apomyoglobin (ApoMb) was chosen for neutron, X-ray
scattering and circular dichroism (CD) measurements
because previous studies on the protein have shown that its
fibril formation appears under particular conditions of
temperature and pH (Fandrich et al. 2003). Before amyloid
formation, ApoMb can adopt two well-defined structural
conformations at pH 9: below 55C, the helix-rich native-
like structure a, and above 55C, the cross-b structure
characteristic of proteins that can generate amyloid
deposits in humans. The transition arises because the
helical structures in ApoMb are destabilised partially so
that neighbouring strands will interact to form the cross-bstructure between them. Amyloid structures differ from
globular protein structures, which are always encoded in
the amino acid sequence, because they do not depend on
the presence of distinctive sequence patterns or specific
intramolecular side-chain interactions. The structural
aspects of the transition have been characterised by small
and wide angle X-ray scattering (WAXS; Onai et al. 2007).
The total structure factor observed showed two peaks at
0.58 and 1.34 A-1, which are strongly correlated with
amyloid transformation (Onai et al. 2007). The peaks
appear at pH 9 at 55C, and become more pronounced as
the temperature is raised. Further investigations of structure
(Booth et al. 1997; Chamberlain et al. 2001) and folding
dynamics (Takano et al. 2001; Canet et al. 1999, 2002)
have led to a better understanding of the process involved
in the conversion of globular proteins into amyloid fibrils.
The work reported concerns the measurement and
comparison of the structure and dynamics, in a wide tem-
perature range, of ApoMb under different solvent
conditions (at pH 9 and pH 7, in H2O and D2O), by using
CD to characterise secondary structures, and energy
resolved elastic neutron scattering. As it has been demon-
strated for other biological systems, energy resolved
neutron scattering provides quantitative information on the
forces involved in the stabilisation of protein structures
(Zaccai 2000). The scattering cross-section of 1H domi-
nates that of all other atoms in biological material, and of
its isotope, deuterium 2H (D). Thus, heavy water (D2O) is
often used to reduce the contribution of hydration water to
the scattering signal. CD experiments were performed in
H2O and D2O, therefore, to characterise whether or not the
a-to-b transition is affected by the solvent isotope.
A significant change in molecular dynamics towards a
more resilient structure was observed for ApoMb at pH 9,
at the a-to-b transition at about 55C. A similar observation
for holo-myoglobin (HoloMb) was attributed to partial
unfolding and protein aggregation, indicating that dena-
tured and aggregated protein display similar dynamics as
b-amyloid. In a further examination of the dynamics of
irreversibly heat-denatured and aggregated protein, a
hydrated powder sample of ApoMb was shown to undergo
a dynamical transition at about 200 K as has been observed
for native HoloMb (Doster et al. 1989), purple membranes
(Ferrand et al. 1993; Lehnert et al. 1998).
Materials and methods
ApoMb preparation
Apomyoglobin was obtained by removing the heme from
HoloMb. Several protocols yield the apo-protein with
similar properties. We successfully adapted the method of
Rothgeb (Rothgeb and Gurd 1978) to obtain the apo-protein
form in gram quantities for the neutron scattering experi-
ments. The process was promoted by acid conditions in
suitable solvent. An appropriate amount of lyophilised
horse heart HoloMb purchased from SIGMA-ALDRICH
was dissolved in water. The pH of the HoloMb solution was
then lowered to 1.5 with concentrated HCl at 4C. The
acidified solution was extracted as quickly as possible with
4 volumes of 2-butanone. The upper organic layer was
decanted, and the extraction was repeated at least twice
more in order to obtain a hazy, colourless aqueous layer
which was dialysed exhaustively against a dilute bicar-
bonate solution followed by pure water. After salt was
completely removed by dialysis, the protein was lyophi-
lised. For the neutron experiments, the powder was
hydrated by pipetting uniformly buffer solutions to the
sample to a level of 0.73 g H2O/g protein or corresponding
0.8 g D2O/g protein. This corresponds to approximately
two hydration layers per protein and allows for pH effects.
CD experiments were performed on the protein solution
before lyophilisation.
Solvent conditions
For neutron experiments, the lyophilised ApoMb was re-
hydrated under different solvent conditions in H2O and
D2O potassium phosphate buffer (20 mM KH2PO4, pH/pD
7 and pH/pD 9). Potassium phosphate was purchased from
SIGMA.
All solutions were obtained by dissolving the buffer in
distilled water (H2O) or heavy water (D2O). The pH (pD)
was adjusted to the desired value by adding acid or base.
Eur Biophys J
123
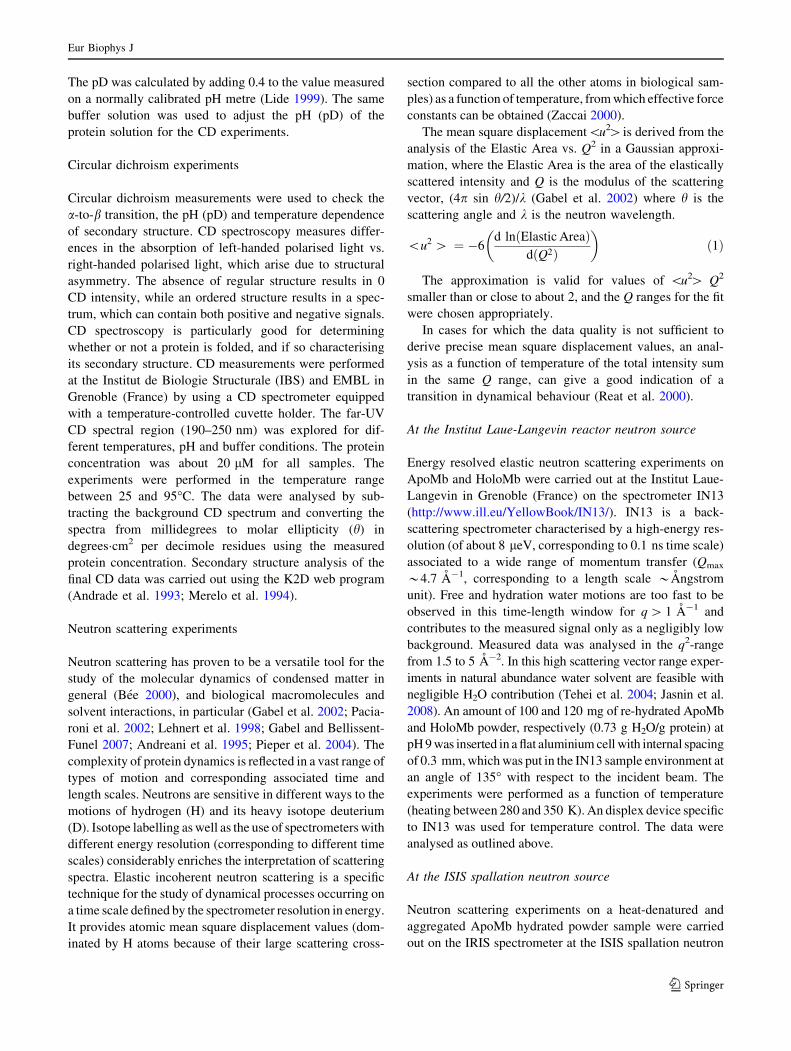
The pD was calculated by adding 0.4 to the value measured
on a normally calibrated pH metre (Lide 1999). The same
buffer solution was used to adjust the pH (pD) of the
protein solution for the CD experiments.
Circular dichroism experiments
Circular dichroism measurements were used to check the
a-to-b transition, the pH (pD) and temperature dependence
of secondary structure. CD spectroscopy measures differ-
ences in the absorption of left-handed polarised light vs.
right-handed polarised light, which arise due to structural
asymmetry. The absence of regular structure results in 0
CD intensity, while an ordered structure results in a spec-
trum, which can contain both positive and negative signals.
CD spectroscopy is particularly good for determining
whether or not a protein is folded, and if so characterising
its secondary structure. CD measurements were performed
at the Institut de Biologie Structurale (IBS) and EMBL in
Grenoble (France) by using a CD spectrometer equipped
with a temperature-controlled cuvette holder. The far-UV
CD spectral region (190–250 nm) was explored for dif-
ferent temperatures, pH and buffer conditions. The protein
concentration was about 20 lM for all samples. The
experiments were performed in the temperature range
between 25 and 95C. The data were analysed by sub-
tracting the background CD spectrum and converting the
spectra from millidegrees to molar ellipticity (h) in
degreescm2 per decimole residues using the measured
protein concentration. Secondary structure analysis of the
final CD data was carried out using the K2D web program
(Andrade et al. 1993; Merelo et al. 1994).
Neutron scattering experiments
Neutron scattering has proven to be a versatile tool for the
study of the molecular dynamics of condensed matter in
general (Bee 2000), and biological macromolecules and
solvent interactions, in particular (Gabel et al. 2002; Pacia-
roni et al. 2002; Lehnert et al. 1998; Gabel and Bellissent-
Funel 2007; Andreani et al. 1995; Pieper et al. 2004). The
complexity of protein dynamics is reflected in a vast range of
types of motion and corresponding associated time and
length scales. Neutrons are sensitive in different ways to the
motions of hydrogen (H) and its heavy isotope deuterium
(D). Isotope labelling as well as the use of spectrometers with
different energy resolution (corresponding to different time
scales) considerably enriches the interpretation of scattering
spectra. Elastic incoherent neutron scattering is a specific
technique for the study of dynamical processes occurring on
a time scale defined by the spectrometer resolution in energy.
It provides atomic mean square displacement values (dom-
inated by H atoms because of their large scattering cross-
section compared to all the other atoms in biological sam-
ples) as a function of temperature, from which effective force
constants can be obtained (Zaccai 2000).
The mean square displacement\u2[ is derived from the
analysis of the Elastic Area vs. Q2 in a Gaussian approxi-
mation, where the Elastic Area is the area of the elastically
scattered intensity and Q is the modulus of the scattering
vector, (4p sin h/2)/k (Gabel et al. 2002) where h is the
scattering angle and k is the neutron wavelength.
\u2 [ ¼ 6d lnðElastic AreaÞ
dðQ2Þ
ð1Þ
The approximation is valid for values of \u2[ Q2
smaller than or close to about 2, and the Q ranges for the fit
were chosen appropriately.
In cases for which the data quality is not sufficient to
derive precise mean square displacement values, an anal-
ysis as a function of temperature of the total intensity sum
in the same Q range, can give a good indication of a
transition in dynamical behaviour (Reat et al. 2000).
At the Institut Laue-Langevin reactor neutron source
Energy resolved elastic neutron scattering experiments on
ApoMb and HoloMb were carried out at the Institut Laue-
Langevin in Grenoble (France) on the spectrometer IN13
(http://www.ill.eu/YellowBook/IN13/). IN13 is a back-
scattering spectrometer characterised by a high-energy res-
olution (of about 8 leV, corresponding to 0.1 ns time scale)
associated to a wide range of momentum transfer (Qmax
*4.7 A-1, corresponding to a length scale *Angstrom
unit). Free and hydration water motions are too fast to be
observed in this time-length window for q [ 1 A-1 and
contributes to the measured signal only as a negligibly low
background. Measured data was analysed in the q2-range
from 1.5 to 5 A-2. In this high scattering vector range exper-
iments in natural abundance water solvent are feasible with
negligible H2O contribution (Tehei et al. 2004; Jasnin et al.
2008). An amount of 100 and 120 mg of re-hydrated ApoMb
and HoloMb powder, respectively (0.73 g H2O/g protein) at
pH 9 was inserted in a flat aluminium cell with internal spacing
of 0.3 mm, which was put in the IN13 sample environment at
an angle of 135 with respect to the incident beam. The
experiments were performed as a function of temperature
(heating between 280 and 350 K). An displex device specific
to IN13 was used for temperature control. The data were
analysed as outlined above.
At the ISIS spallation neutron source
Neutron scattering experiments on a heat-denatured and
aggregated ApoMb hydrated powder sample were carried
out on the IRIS spectrometer at the ISIS spallation neutron
Eur Biophys J
123
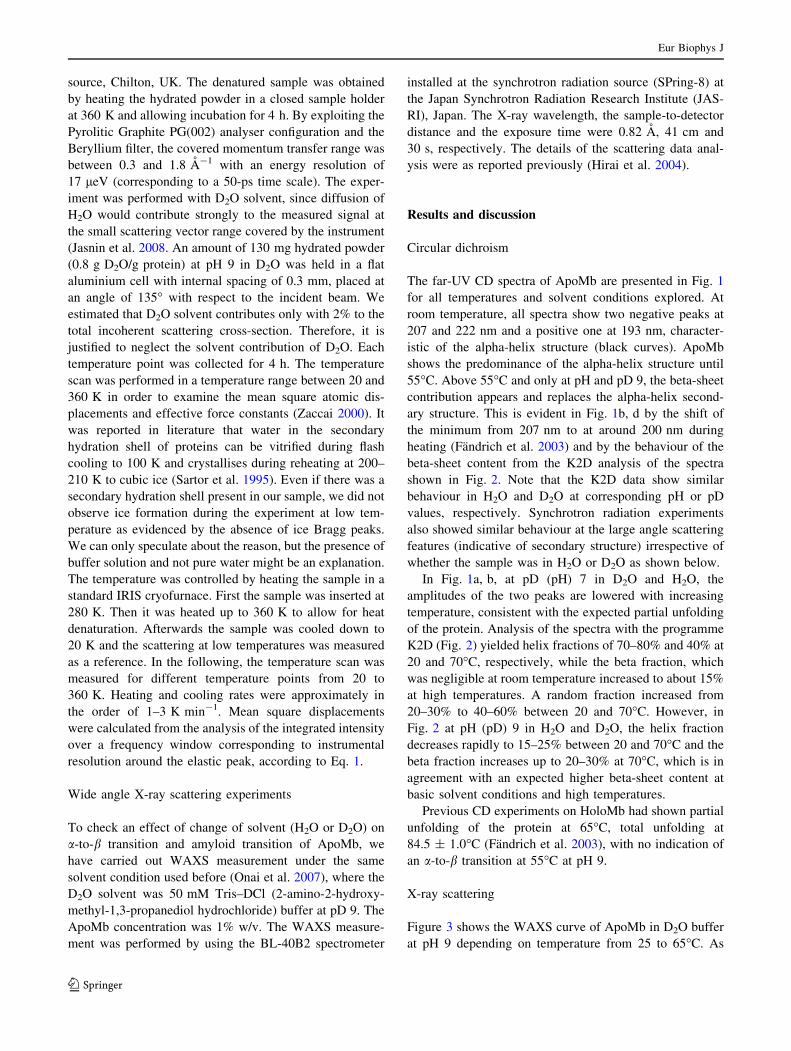
source, Chilton, UK. The denatured sample was obtained
by heating the hydrated powder in a closed sample holder
at 360 K and allowing incubation for 4 h. By exploiting the
Pyrolitic Graphite PG(002) analyser configuration and the
Beryllium filter, the covered momentum transfer range was
between 0.3 and 1.8 A-1 with an energy resolution of
17 leV (corresponding to a 50-ps time scale). The exper-
iment was performed with D2O solvent, since diffusion of
H2O would contribute strongly to the measured signal at
the small scattering vector range covered by the instrument
(Jasnin et al. 2008. An amount of 130 mg hydrated powder
(0.8 g D2O/g protein) at pH 9 in D2O was held in a flat
aluminium cell with internal spacing of 0.3 mm, placed at
an angle of 135 with respect to the incident beam. We
estimated that D2O solvent contributes only with 2% to the
total incoherent scattering cross-section. Therefore, it is
justified to neglect the solvent contribution of D2O. Each
temperature point was collected for 4 h. The temperature
scan was performed in a temperature range between 20 and
360 K in order to examine the mean square atomic dis-
placements and effective force constants (Zaccai 2000). It
was reported in literature that water in the secondary
hydration shell of proteins can be vitrified during flash
cooling to 100 K and crystallises during reheating at 200–
210 K to cubic ice (Sartor et al. 1995). Even if there was a
secondary hydration shell present in our sample, we did not
observe ice formation during the experiment at low tem-
perature as evidenced by the absence of ice Bragg peaks.
We can only speculate about the reason, but the presence of
buffer solution and not pure water might be an explanation.
The temperature was controlled by heating the sample in a
standard IRIS cryofurnace. First the sample was inserted at
280 K. Then it was heated up to 360 K to allow for heat
denaturation. Afterwards the sample was cooled down to
20 K and the scattering at low temperatures was measured
as a reference. In the following, the temperature scan was
measured for different temperature points from 20 to
360 K. Heating and cooling rates were approximately in
the order of 1–3 K min-1. Mean square displacements
were calculated from the analysis of the integrated intensity
over a frequency window corresponding to instrumental
resolution around the elastic peak, according to Eq. 1.
Wide angle X-ray scattering experiments
To check an effect of change of solvent (H2O or D2O) on
a-to-b transition and amyloid transition of ApoMb, we
have carried out WAXS measurement under the same
solvent condition used before (Onai et al. 2007), where the
D2O solvent was 50 mM Tris–DCl (2-amino-2-hydroxy-
methyl-1,3-propanediol hydrochloride) buffer at pD 9. The
ApoMb concentration was 1% w/v. The WAXS measure-
ment was performed by using the BL-40B2 spectrometer
installed at the synchrotron radiation source (SPring-8) at
the Japan Synchrotron Radiation Research Institute (JAS-
RI), Japan. The X-ray wavelength, the sample-to-detector
distance and the exposure time were 0.82 A, 41 cm and
30 s, respectively. The details of the scattering data anal-
ysis were as reported previously (Hirai et al. 2004).
Results and discussion
Circular dichroism
The far-UV CD spectra of ApoMb are presented in Fig. 1
for all temperatures and solvent conditions explored. At
room temperature, all spectra show two negative peaks at
207 and 222 nm and a positive one at 193 nm, character-
istic of the alpha-helix structure (black curves). ApoMb
shows the predominance of the alpha-helix structure until
55C. Above 55C and only at pH and pD 9, the beta-sheet
contribution appears and replaces the alpha-helix second-
ary structure. This is evident in Fig. 1b, d by the shift of
the minimum from 207 nm to at around 200 nm during
heating (Fandrich et al. 2003) and by the behaviour of the
beta-sheet content from the K2D analysis of the spectra
shown in Fig. 2. Note that the K2D data show similar
behaviour in H2O and D2O at corresponding pH or pD
values, respectively. Synchrotron radiation experiments
also showed similar behaviour at the large angle scattering
features (indicative of secondary structure) irrespective of
whether the sample was in H2O or D2O as shown below.
In Fig. 1a, b, at pD (pH) 7 in D2O and H2O, the
amplitudes of the two peaks are lowered with increasing
temperature, consistent with the expected partial unfolding
of the protein. Analysis of the spectra with the programme
K2D (Fig. 2) yielded helix fractions of 70–80% and 40% at
20 and 70C, respectively, while the beta fraction, which
was negligible at room temperature increased to about 15%
at high temperatures. A random fraction increased from
20–30% to 40–60% between 20 and 70C. However, in
Fig. 2 at pH (pD) 9 in H2O and D2O, the helix fraction
decreases rapidly to 15–25% between 20 and 70C and the
beta fraction increases up to 20–30% at 70C, which is in
agreement with an expected higher beta-sheet content at
basic solvent conditions and high temperatures.
Previous CD experiments on HoloMb had shown partial
unfolding of the protein at 65C, total unfolding at
84.5 ± 1.0C (Fandrich et al. 2003), with no indication of
an a-to-b transition at 55C at pH 9.
X-ray scattering
Figure 3 shows the WAXS curve of ApoMb in D2O buffer
at pH 9 depending on temperature from 25 to 65C. As
Eur Biophys J
123
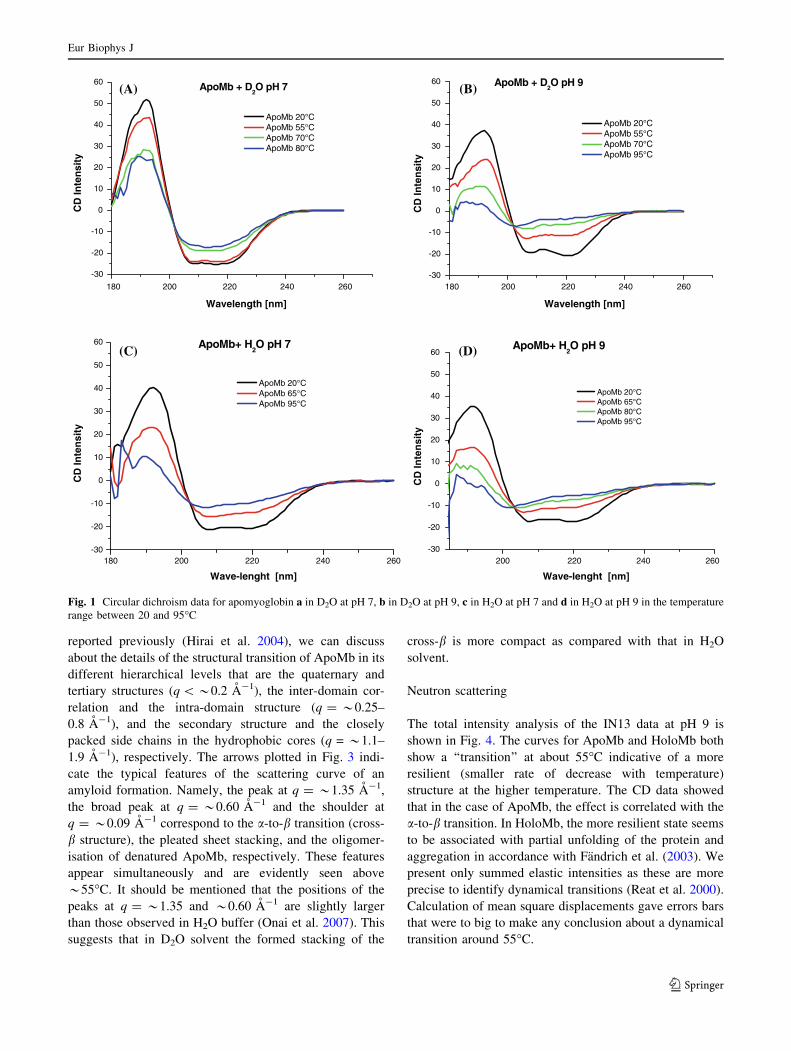
reported previously (Hirai et al. 2004), we can discuss
about the details of the structural transition of ApoMb in its
different hierarchical levels that are the quaternary and
tertiary structures (q \*0.2 A-1), the inter-domain cor-
relation and the intra-domain structure (q = *0.25–
0.8 A-1), and the secondary structure and the closely
packed side chains in the hydrophobic cores (q = *1.1–
1.9 A-1), respectively. The arrows plotted in Fig. 3 indi-
cate the typical features of the scattering curve of an
amyloid formation. Namely, the peak at q = *1.35 A-1,
the broad peak at q = *0.60 A-1 and the shoulder at
q = *0.09 A-1 correspond to the a-to-b transition (cross-
b structure), the pleated sheet stacking, and the oligomer-
isation of denatured ApoMb, respectively. These features
appear simultaneously and are evidently seen above
*55C. It should be mentioned that the positions of the
peaks at q = *1.35 and *0.60 A-1 are slightly larger
than those observed in H2O buffer (Onai et al. 2007). This
suggests that in D2O solvent the formed stacking of the
cross-b is more compact as compared with that in H2O
solvent.
Neutron scattering
The total intensity analysis of the IN13 data at pH 9 is
shown in Fig. 4. The curves for ApoMb and HoloMb both
show a ‘‘transition’’ at about 55C indicative of a more
resilient (smaller rate of decrease with temperature)
structure at the higher temperature. The CD data showed
that in the case of ApoMb, the effect is correlated with the
a-to-b transition. In HoloMb, the more resilient state seems
to be associated with partial unfolding of the protein and
aggregation in accordance with Fandrich et al. (2003). We
present only summed elastic intensities as these are more
precise to identify dynamical transitions (Reat et al. 2000).
Calculation of mean square displacements gave errors bars
that were to big to make any conclusion about a dynamical
transition around 55C.
(A)
-30
-20
-10
0
10
20
30
40
50
60 ApoMb + D2O pH 7
CD
Inte
nsi
ty
Wavelength [nm]
ApoMb 20°C ApoMb 55°C ApoMb 70°C ApoMb 80°C
(B)
-30
-20
-10
0
10
20
30
40
50
60 ApoMb + D2O pH 9
CD
Inte
nsi
ty
Wavelength [nm]
ApoMb 20°C ApoMb 55°C ApoMb 70°C ApoMb 95°C
(C)
180 200 220 240 260-30
-20
-10
0
10
20
30
40
50
60 ApoMb+ H2O pH 7
CD
Inte
nsi
ty
Wave-lenght [nm]
ApoMb 20°C ApoMb 65°C ApoMb 95°C
(D)
-30
-20
-10
0
10
20
30
40
50
60
CD
Inte
nsi
ty
Wave-lenght [nm]
ApoMb 20°C ApoMb 65°C ApoMb 80°C ApoMb 95°C
ApoMb+ H2O pH 9
260240220200180 260240220200180
260240220200
Fig. 1 Circular dichroism data for apomyoglobin a in D2O at pH 7, b in D2O at pH 9, c in H2O at pH 7 and d in H2O at pH 9 in the temperature
range between 20 and 95C
Eur Biophys J
123

As the temperature is increased and before total
unfolding at higher temperatures, both ApoMb and Ho-
loMb display a transition to a more resilient aggregated
dynamic structure at about 55C. In the case of ApoMb at
pH 9, the structure is the b-structure associated with
amyloid fibre formation. While in the case of HoloMb, the
structure is likely due to partial unfolding and an undefined
aggregate state (Fandrich et al. 2003). The transition to a
more resilient high temperature dynamics structure at
*55C was also observed in IN13 experiments on ApoMb
at pH 7 (data not shown), suggesting that like for HoloMb,
ApoMb at pH 7 partially unfolds and aggregates in this pre-
transition to total unfolding. In order to explore further the
dynamic behaviour of aggregated protein, a temperature
scan of the elastic intensity was performed on heat-dena-
tured ApoMb on the IRIS spectrometer at ISIS (Fig. 5).
The 17 leV energy resolution condition chosen on the
instrument corresponds to a time scale of 50 ps. Interest-
ingly, the data showed a dynamical transition for the
sample at about 200 K, similar to that observed in hydrated
Fig. 2 Analysis of the structural content of ApoMb at pH 7 and pH 9
in a H2O and b D2O
10.1
25 °C354550556065
q (Å-1)
log
I(q)
(a
rb. u
nits
)1
Fig. 3 Wide angle X-ray scattering curve of apomyoglobin in D2O
solvent at pH 9 in the temperature range from 25 to 65C. The arrows(the peaks at q = *1.35 and *0.60 A-1, the shoulder at q = *0.09
A-1) indicate typical features of amyloid transition. This transition
occurred above *55C
Fig. 4 IN13 sum of intensities vs. temperature for apomyoglobin and
holo-myoglobin. The broken line is a linear fit for holo-myoglobin
and the straight line is a linear fit to apomyoglobin. Due to limitations
of the temperature control, no experimental points could be measured
between around 45 and 55C
Eur Biophys J
123

native HoloMb (0.38 g D2O/g protein) by Doster et al.
(1989), indicating that the transition is also a property of
heat-denatured and aggregated protein. The force con-
stant \k[ and the effective force constant \k0[ were
determined for the low temperature range below
200 K with \k[ = 3.7 ± 0.3 N m-1 and above 200 K
with \k0[ = 0.17 ± 0.01 N m-1 (Zaccai 2000). In the
100 ps time range values of \k[ = 3 N m-1 and
\k0[ = 0.3 N m-1 were obtained for hydrated HoloMb
powder (Zaccai 2000). At low temperatures the force
constants \k[ between ApoMb and HoloMb are similar.
Above the dynamical transition temperature, the effective
force constant\k0[of ApoMb is significantly smaller than
that of HoloMb. The higher degree of hydration of the
ApoMb sample might facilitate protein motion and be the
cause of this discrepancy.
Conclusion
In this paper, ApoMb was used as a model biochemical
system in order to explore the molecular changes of
dynamics in the a-to-b transition associated with amyloid
fibril formation. CD and neutron scattering experiments
were performed on the protein, at pH 9 in H2O and D2O, in
a wide temperature range. Similar experiments were car-
ried out on HoloMb, on the same solvent condition. WAXS
was used to confirm the occurrence of the a-to-b transition
of ApoMb in D2O solution at pD 9 by the appearance of
characteristic Bragg peaks. CD experiments emphasised
that the transition is present above 55C and only at pH and
pD 9 in dilute solution. ApoMb results show a significant
change in molecular dynamics at the a-to-b transition at
about 55C, indicating a more resilient high temperature b
structure phase. The behaviour of the holo-protein as
function of temperature is associated with partial unfolding
and protein aggregation.
Acknowledgments The authors acknowledge the IN13 and IRIS
staffs for their support during the experiment at ILL and ISIS facil-
ities. Thanks are due to Dr. Felix Fernandez-Alonso and Dr. Franz
Demmel for helpful discussions. Technical and financial support from
the ILL and ISIS facilities is gratefully acknowledged. The WAXS
measurement was done under the approval of the JASRI Program
Advisory Committee (Proposal #2006A1339). M. Tehei acknowl-
edges the ILL, the AINSE, the CNRS and the Institut de Biologie
Structurale (UMR 5075) for financial support of this work.
References
Andrade MA, Chacon P, Merelo JJ, Moran F (1993) Evaluation of
secondary structure of proteins from UV circular dichroism
using an unsupervised learning neural network. Protein Eng
6:383–390
Andreani C, Filabozzi A, Menzinger F, Desideri A, Deriu A, Dicola D
(1995) Dynamics of hydrogen atoms in superoxide dismutase by
quasielastic neutron scattering. Biophys J 68:2519–2523
Bee M (2000) La diffusion quasielastique des neutrons; introduction
et principes generaux. Diffusion Quasielastique des Neutrons. J
Phys IV France 10:Pr1-1–Pr1-14
Booth DR, Sunde M, Bellotti V, Robinson CV, Hutchinson WL,
Fraser PE, Hawkins PN, Dobson CM, Radford SE, Blake CCF,
Pepys MB (1997) Instability, unfolding and aggregation of
human lysozyme variants underlying amyloid fibrillogenesis.
Nature 385:787–793
Canet D, Sunde M, Last AM, Miranker A, Spencer A, Robinson CV,
Dobson CM (1999) Mechanistic studies of the folding of human
lysozyme and the origin of amyloidogenic behaviour in its
disease related variants. Biochemistry 38:6419–6427
Canet D, Last AM, Tito P, Sunde M, Spencer A, Archer DB, Redfield
C, Robinson CV, Dobson CM (2002) Local cooperativity in the
unfolding of an amyloidogenic variant of human lysozyme. Nat
Struct Biol 9:308–315
Chamberlain AK, Receveur V, Spencer A, Redfield C, Dobson CM
(2001) Characterization of the structure and dynamics of
amyloidogenic variants of human lysozyme by NMR spectros-
copy. Protein Sci 10:2525–2530
Doster W, Cusack S, Petry W (1989) Dynamical transition of
myoglobin revealed by inelastic neutron scattering. Nature
337:754–756
Fandrich M, Forge V, Buder K, Kittler M, ChM Dobson, Diekmann S
(2003) Myoglobin forms amyloid fibrils by association of
unfolded polypeptide segments. Proc Natl Acad Sci USA
100:15463–15468
Ferrand M, Dianoux AJ, Petry W, Zaccai G (1993) Thermal motions
and function of bacteriorhodopsin in purple membranes: effects
of temperature and hydration studied by neutron scattering. Proc
Natl Acad Sci USA 90(20):9668–9672
Gabel F, Bellissent-Funel MC (2007) C-phycocyanin hydration water
dynamics in the presence of trehalose: an incoherent elastic
neutron scattering study at different energy resolutions. Biophys
J 92:4054–4063
Gabel F, Bicout D, Lehnert U, Tehei M, Weik M, Zaccai G (2002)
Protein dynamics studied by neutron scattering. Q Rev Biophys
35:327–367
Hirai M, Koizumi M, Hayakawa T, Takahashi H, Abe S, Hirai H,
Miura K, Inoue K (2004) Hierarchical map of protein unfolding
Fig. 5 Mean square displacement \u2[ vs. temperature from IRIS
elastic scan measurements on heat-denatured and aggregated ApoMb.
Error bars are within the symbols
Eur Biophys J
123

and refolding at thermal equilibrium revealed by wide-angle X-
ray scattering. Biochemistry 43:9036–9049
Jasnin M, Moulin M, Haertlein M, Zaccai M, Tehei M (2008) Down
to atomic-scale intracellular water dynamics. EMBO Rep 9:543–
547
Lehnert U, Reat V, Weik M, Zaccai G, Pfister C (1998) Thermal
motions in bacteriorhodopsin at different hydration levels
studied by neutron scattering: correlation with kinetics and
light-induced conformational changes. Biophys J 75:1945–1952
Lide DR (1999) CRC Handbook of chemistry and physics, 80th edn
edn. CRC, Boca Raton
Merelo JJ, Andrade MA, Prieto A, Moran F (1994) Proteinotopic
feature maps. Neurocomputing 6:443–454
Onai T, Koizumi M, Lu H, Inoue K, Hirai M (2007) Initial process of
amyloid formation of apomyoglobin and effect of glycosphin-
golipid GM1. J Appl Cryst 40:s184–s189
Paciaroni A, Cinelli S, Onori G (2002) Effect of the environment on
the protein dynamical transition: a neutron scattering study.
Biophys J 83:1157–1164
Pieper J, Irrgang KD, Renger G, Lechner RE (2004) Density of
vibrational states of the light-harvesting complex II of green
plants studied by inelastic neutron scattering. J Phys Chem B
108:10556–10565
Reat V, Dunn R, Ferrand M, Finney JL, Daniel RM, Smith JC (2000)
Solvent dependence of dynamic transitions in protein solutions.
Proc Natl Acad Sci USA 97:9961–9966
Rothgeb TM, Gurd FR (1978) Physical methods for the study of
myoglobin. Methods Enzymol 52:73–86
Sartor G, Hallbrucker A, Mayer E (1995) Characterizing the
secondary hydration shell on hydrated myoglobin, hemoglobin,
and lysozyme powders by its vitrification behavior on cooling
and its calorimetric glass ? liquid transition and crystallization
behavior on reheating. Biophys J 69:2679–2694
Takano K, Funahashi J, Yutani K (2001) The stability and folding
process of amyloidogenic mutant human lysozymes. Eur J
Biochem 268(1):155–159
Tehei M, Franzetti B, Madern D, Ginzburg M, Ginzburg BZ, Giudici-
Orticoni MT, Bruschi M, Zaccai G (2004) Adaptation to extreme
environments: macromolecular dynamics in bacteria compared
in vivo by neutron scattering. EMBO Rep 5:66–70
Zaccai G (2000) How soft is a protein? A protein dynamics force
constant measured by neutron scattering. Science 288:1604–1607
Eur Biophys J
123

201
10.3 Hemoglobin senses body temperature
The following article presents a study on whole red blood cells using different experimental
methods. The effect of heavy water on the passage transition of RBC was examined using the
micropipette technique. RBC volume measurements were performed with very narrow
micropipettes. The T1 relaxation time in RBC was measured with NMR. The colloid osmotic
pressure of whole RBC in autologous plasma was determined as a function of temperature.
The data revealed the onset of hemoglobin aggregation at body temperature. The use of heavy
water results in a higher aggregation temperature. The mechanism was interpreted as being
similar to a colloidal phase transition. It was concluded that hemoglobin senses body
temperature.
I contributed to the article with the micropipette experiments on red blood cells in heavy
water.

202

203
European Biophysics Journal, 2009, in revision
Hemoglobin senses body temperature
Artmann G.M., Digel I., Zerlin K.F1., Maggakis-Kelemen Ch., Linder Pt., Porst
D., Kayser P., Stadler A.M.2, Dikta G., and A. Temiz Artmann
Aachen University of Applied Sciences and 1Research Center Juelich,
Projektträger Juelich, 52428 Juelich, Germany 2 Institute Laue Langevin, 38042, Grenoble, France
Contact address of corresponding author*:
Prof. Dr. rer.nat. habil. G. M. Artmann
University of Applied Sciences Aachen, Division Juelich
Ginsterweg 1
52428 Juelich
Phone: (0049) 241 6009 53073
E-mail: [email protected]
Abbreviations: RBC – red blood cells, NMR – nuclear magnetic resonance, Hb hemoglobin,
COP – colloid-osmotic pressure, temperature sensation
Running Title: Hemoglobin senses body temperature
Keywords: red blood cells, hemoglobin, temperature transition, body temperature, colloid
osmotic pressure, confined water, glass transition, NMR T1

204
* This article is dedicated to Ludwig Artmann who died on July 21, 2001 on a beautiful
summer day during which we performed experiments far away. Ludwig Artmann was a man
who encouraged us to be strong and to study hard no matter what were the costs.

205
Abstract
When aspirating human red blood cells (RBCs) into 1.3 µm pipettes (∆P = -2.3kPa), a
transition from blocking the pipette below a critical temperature Tc = 36.3 ± 0.3°C to passing
it above the Tc occurred (micropipette passage transition). With a 1.1 µm pipette no passage
was seen which enabled RBC volume measurements in particular above Tc. With increasing
temperature RBCs lost volume significantly faster below than above a Tc = 36.4 ± 0.7
(volume transition). Colloid osmotic pressure (COP) measurements of RBCs in autologous
plasma (25°C ≤ T ≤ 39.5°C) showed a Tc at 37.1 ± 0.2°C above which the COP rapidly
decreased (COP transition). In NMR T1-relaxation time measurements, the T1 of RBCs in
autologous plasma changed from a linear (r = 0.99) increment below Tc = 37 ± 1°C at a rate
of 0.023 s/K into zero slope above Tc (RBC T1 transition). In conclusion: An amorphous
hemoglobin-water gel formed in the spherical trail, the residual partial sphere of the aspirated
RBC. At Tc, a sudden fluidization of the gel occurs. All changes mentioned above happen at a
distinct Tc close to body temperature. The Tc is moved + 0.8°C to higher temperatures when a
D2O buffer is used. We suggest a mechanism similar to a “glass transition” or a “colloidal
phase transition”. At Tc, the stabilizing Hb bound water molecules reach a threshold number
enabling a partial Hb unfolding. Thus, Hb senses body temperature which must be inscribed
in the primary structure of hemoglobin and possibly other proteins.
206
Introduction
Nonlinearities in the physical, biological and chemical properties of cells (Hennig et al.,
2002;Hennig et al., 2002), membranes (Gowrishankar et al., 1998) and biological molecules
(Braxenthaler et al., 1997;Pascher, 2001) have developed into a growing field of interest. For
some types of cells, intrinsic, pronounced nonlinearity is a well known feature, essential for
normal cell function and successful signal transduction (Hennig et al., 2002). Some authors
even prefer the term ´phase transition` instead of nonlinearities (Pollack, 2001a;Pollack,
2001b). The concept of nonlinearity and phase transitions in protein and cell function is on the
brink of revolutionizing cell biology (Pollack, 2001b).
Nonlinear features of hemoglobin (Hb) function have been repeatedly reported (Lukin et al.,
2003;Bettati et al., 1998). Allosteric properties regarding its R-T transition and oxygen
binding (Bettati et al., 1998) suggest increased dynamics of “ligation intermediate” species
and the distinctive role of the hydration shell in Hb function (Knapp et al., 1999;Levantino et
al., 2003). For many years it was assumed that the hemoglobin solution viscosity
monotonically depended on temperature and concentration (Danish and Harris, 1983;Chien et
al., 1982;Muller et al., 1992). However, none of these studies used highly elevated, non-
physiological Hb concentrations (i.e. significantly higher than 33 g dL-1). In fact, investigators
ended their studies at concentrations too low to observe an accelerated viscosity drop around
body temperature (Kelemen et al., 2001). In our previous studies on human red blood cells
(RBCs) that began a decade ago, sudden temperature-induced changes in passage behavior
through narrow micropipettes were found (micropipette passage transition) (Artmann et al.,
1998). Hemoglobin was identified as the molecule causing the transition. Further studies on
these discontinuities using RBCs and/or standardized Hb solutions showed nonlinear changes
at temperatures all close to the human body temperature (Kelemen et al., 2001;Zerlin et al.,
2007e;Artmann et al., 2004;Hennig et al., 2002). Lately we showed that Hb obtained from
monotreme animals such as the echidna and the platypus, having body temperatures of 33°C,
underwent a temperature transition around their respective body temperatures (Digel et al.,
2006). All these and further studies (Zerlin et al., 2007d) suggested that the structural
transition in hemoglobin involving an unknown mechanism is linked to the species` body
temperature. However, for methodological reasons, many of these studies did not reflect the
natural environment which Hb molecules reside in.
This paper aims to show that the sudden structural transition of hemoglobin at body
temperature (Artmann et al., 1998) can be shown in a series of other experiments: 1) RBC
volume changes as measured with micropipettes, 2) by colloid osmometry, and 3) by NMR T1

207
relaxation time measurements (Zefirova et al., 1991) using individual RBCs or whole blood,
respectively. The results gave hints on the molecular mechanism of the structural transition.
They supported the idea put forward earlier (Kelemen et al., 2001) that a Hb structural
rearrangement was initiated by a steady thinning of the Hb bound water shell with rising
temperature. Below Tc, the bound water shell stabilized the molecule. At Tc this had reached
a threshold. It enabled a molecular rearrangement initiating the transitions observed. It occurs
in the spherical trail of an aspirated RBC where a Hb-water gel forms below Tc. At Tc this gel
suddenly turns fluid caused by a break down of intermolecular Van der Waals forces. The fact
that Tc depends on the species` body temperature implies that this temperature is somehow
inscribed in the primary Hb structure. Thus, the Tc observed may generally reflect body
temperature and the Hb molecule “senses” this particular temperature by undergoing certain
structural transitions.
208
Materials and Methods
Blood sample preparation: Blood samples were obtained from healthy donors in EDTA-
filled syringes, centrifuged at 500×g for 10 min and with the buffy coat removed from the
pellet. Samples were obtained and processed just before the beginning of an experiment. This
paper presents data obtained with intact RBCs.
Micropipette measurements: In micropipette experiments used for single cell volume
determinations washed RBCs were used. After centrifugation, the RBC pellet was re-
suspended in HEPES buffer (pH = 7.4, 300mOsm) at a hematocrit of 0.1%. In a separate set
of experiments, D2O was used instead of H2O for HEPES buffer preparation.
NMR measurements: In the the NMR as well as in the COP experiments, RBCs were
resuspended in autologous blood plasma. The major differences to real blood in the NMR and
COP experiments were 1) the absence of shear stress, 2) the absence of leucocytes and
thrombocytes, and 3) an elevated hematocrit. The preparation protocols were essential for the
results presented below. Plasma and RBC pellets were separated and degassed for 5min. For
samples containing RBC, 0.5 mL plasma and 0.225 mL D2O were added to 3.5 mL RBC
pellet.
Colloid osmotic pressure (COP) measurements: The RBC pellet was re-suspended with
autologous plasma. The average hematocrit was 77.6 ± 5.3 % (N = 16 blood samples).
Micropipette System Set-up: Aspiration experiments for individual RBC volume
determination were carried out with an inverted microscope and bright field light (1000 x )
microscopy (CLSM, AxioverT 100, Carl Zeiss, Göttingen, Germany). A micromanipulator
system (Luigs and Neumann, Ratingen, Germany), a hydrostatic pressure system and a
temperature chamber (Cell and Tissue Technology, Aachen, Germany) at an accuracy of ±
0.2°C were used for micropipette experiments. Cylindrical micropipettes with an inner
diameter of 1.1 µm were pulled (Mecanex SA, Nyon, Switzerland; BB-CH-PC) from
borosilicate glass tubes (World Precision Instruments, Berlin, Germany). The inner diameter
was measured microscopically using image analysis. The aspiration pressure was adjusted at -
2.3kPa.
Single RBC volume measurements: For individual RBC volume determinations of N = 12
RBCs one and the same micropipette was used. Procedure of volume determination: An RBC
was aspirated at T = 34.5 °C and geometrical data (Figure 1) were obtained. The cell was then
blown out. The temperature was raised by about 0.3 to 0.4 °C and equilibrated. The same cell
was re-aspirated and the new geometrical data were measured. The cell was blown out and the
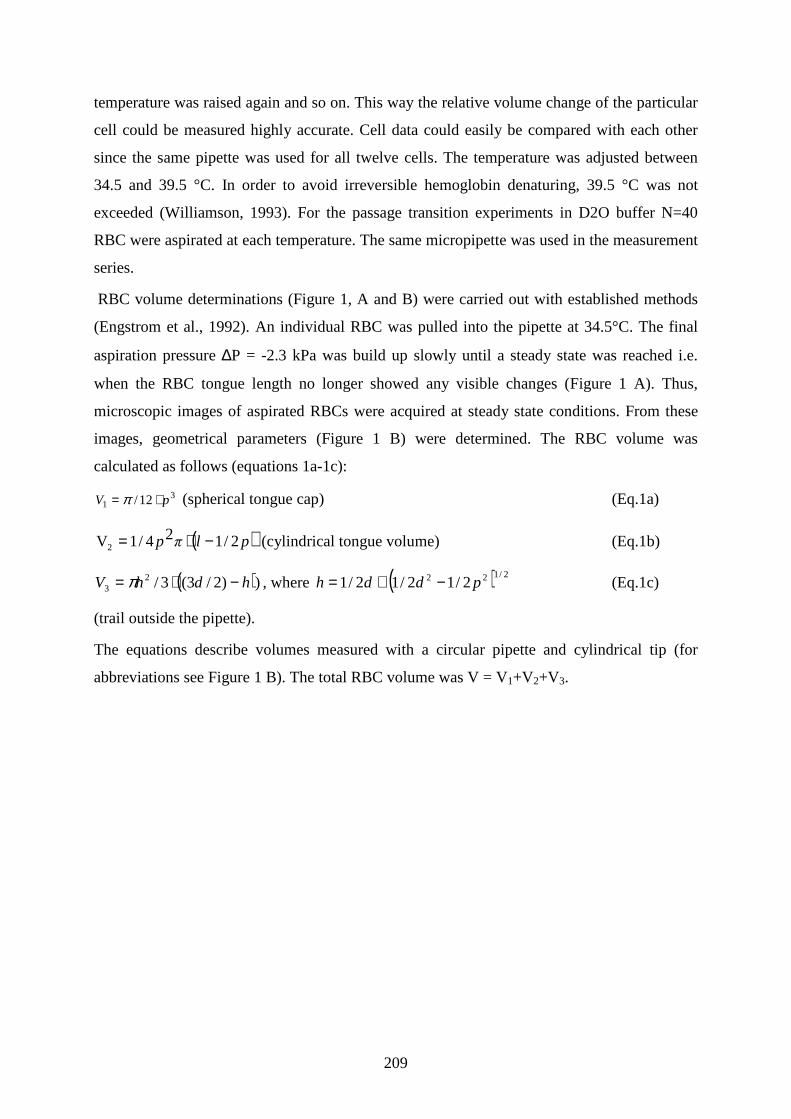
209
temperature was raised again and so on. This way the relative volume change of the particular
cell could be measured highly accurate. Cell data could easily be compared with each other
since the same pipette was used for all twelve cells. The temperature was adjusted between
34.5 and 39.5 °C. In order to avoid irreversible hemoglobin denaturing, 39.5 °C was not
exceeded (Williamson, 1993). For the passage transition experiments in D2O buffer N=40
RBC were aspirated at each temperature. The same micropipette was used in the measurement
series.
RBC volume determinations (Figure 1, A and B) were carried out with established methods
(Engstrom et al., 1992). An individual RBC was pulled into the pipette at 34.5°C. The final
aspiration pressure ∆P = -2.3 kPa was build up slowly until a steady state was reached i.e.
when the RBC tongue length no longer showed any visible changes (Figure 1 A). Thus,
microscopic images of aspirated RBCs were acquired at steady state conditions. From these
images, geometrical parameters (Figure 1 B) were determined. The RBC volume was
calculated as follows (equations 1a-1c):
31 12/ pV ⋅= π (spherical tongue cap) (Eq.1a)
( )plπp 2/124/1V2 −⋅= (cylindrical tongue volume) (Eq.1b)
( )))2/3(3/23 hdhV −⋅= π , where ( ) 2/122 2/12/12/1 pddh −+= (Eq.1c)
(trail outside the pipette).
The equations describe volumes measured with a circular pipette and cylindrical tip (for
abbreviations see Figure 1 B). The total RBC volume was V = V1+V2+V3.

210
Figure 1: A: Typical micropipette aspiration experiment. The spherical trail outside the
pipette is clearly visible. The arrow indicates the end of the aspirated RBC’s tongue. B:
Individual volume compartments of an aspirated RBC used for single cell volume calculation.
C: Volume change over temperature of an individual RBC. There was a clear turning point
indicating a critical temperature at Tc. The slopes of the linear curve below and above Tc
differed significantly according to the statistical analysis applied.
p
d
L h
VRBC= V1 +V2 +V3
60
70
80
90
100
110
32 33 34 35 36 37 38 39 40
temperature (°C)
RB
C v
olum
e (µ
m3 )
A C
B
Spherical trail
RBC tongue
Temperature (°C)

211
Hemoglobin molecular radius estimations from micropipette experiments: At an
aspiration pressure of -2.3 kPa, the pulling force vector acting on an aspirated RBC tongue
and pointing into the micropipette had a higher norm than the colloid osmotic force vector
caused by the very high Hb concentration inside the spherical RBC trail (Kelemen et al.,
2001) pointing outwards. At this pressure, it was reasonable to assume that most of the
cytosolic bulk water had been squeezed out and cytosolic Hb molecules together with their
bound water shell were closely packed, leaving only traces of unbound water within the
intermolecular gaps. We have developed a simple geometrical model to estimate the Hb
molecular radius, rHb, under the boundary condition of a circumferential isotropic membrane
tension compressing the Hb molecules inside RBCs during aspiration. We considered
physiological data as the intracellular Hb concentration in RBCs, CHb, = 330 g/L, molecular
weight of tetrameric human Hb, MWHb = 64.000 g/Mol, and an average RBC volume of VRBC
= 88 fL. The molecular Hb radius was calculated using following equations (2a-2c):
RBCHbRBC VcHb ⋅= (Eq.2a)
HbRBCaHb MWHbNN /⋅= (Eq.2b)
3/1)4/3( HbRBCHb NVr ⋅= π (Eq.2c)
where NA is Avogadro’s number, HbRBC is the total intracellular Hb content of a single RBC,
and where NHb is the number of Hb molecules per RBC. For the calculation of the number of
hydration layers per hemoglobin molecule, it was assumed that the amount of 0.35g H2O/ g
protein corresponds to one hydration layer. A physiological concentration of hemoglobin at
330 g/L in red blood cells at conditions was assumed. The concentration of hemoglobin in the
aspirated cells was calculated using the measured cell volume. The amount of cell water was
then estimated by assuming a constant density of the hemoglobin solution. The number of
hydration layers was finally obtained by dividing the amount of cellular water per hemoglobin
molecule by the assumed value for one hydration layer.
NMR measurements: NMR T1 relaxation time measurements were carried out with samples
inserted into NMR tubes at temperatures of 15, 25, 30, 35, 37, 39 and 42°C, respectively. The
samples were allowed to equilibrate for 10 min at each temperature step. A DRX 600 (Bruker
Co., Germany) NMR device was used for T1 measurements carried out at a static magnetic
field strength of 14.7 T corresponding to a Larmor frequency of 600 MHz (Finnie et al.,
1986;Zefirova et al., 1991). An inversion recovery pulse sequence was used and data were
analyzed with the XMGR software (http://math.nyu.edu/aml/software/xmgrace.html).

212
Colloid osmotic pressure (COP) measurements: The colloid osmometer (Wescor Co.,
USA) was placed into a heating chamber at 39 °C and the temperature was equilibrated for 30
min. Then the blood plasma sample was injected into the measurement chamber and the
colloid osmotic pressure (COP) was observed. When steady state was reached, this value was
taken as the COP of the plasma sample at this temperature. Afterwards, the sample was
exchanged with the RBC-in plasma sample and the procedure was repeated. Subsequently, the
blood plasma and the RBC-in plasma COP were obtained at steps of about 1°C going
stepwise down to 29°C.
Statistical data analysis (Dikta et al., 2006): The volumes of 12 RBCs were measured at
temperatures of 34.5, 36.4 ( = Tc), and 39.5 (°C). For each cell, three dependent observations
were available, while the 12 measurements at each temperature step were independent of each
other, since they originated from different cells.
To check whether the expected volume at the temperature Tc = 36.4°C was less than the one
at 34.5°C, a t-test was applied, where the differences (D1) between individual RBC volumes
at 34.5°C and Tc = 36.4°C were taken as
D1 = RBC volume (Tc = 36.4°C) – RBC volume (34.5°C). (Eq. 3a)
These differences were checked for normality by the Shapiro-Wilks test. If this test showed no
significant departure from normality, the one-sided t-test was applicable. The t-test was used
to check the null-hypothesis that the expected value of the difference was zero against the
alternative that the expected value of the difference was less than zero. A significant departure
from the null hypothesis must therefore be interpreted as a significant negative slope of the
first straight line in Figure 2. The same approach was used to check the second straight line
between Tc = 36.4 and 39.5°C, i.e. to analyze
D2 = RBC volume (39.5° C) – RBC volume (Tc = 36.4 °C) (Eq.3b)
Since D1 and D2 can be associated with one of the two slopes, they can be used to check for
differences (D) between the two slopes. For each cell, the D = D2-D1 calculation was
performed and analyzed statistically as described above.

213
Figure 2: RBC volume vs. temperature during micropipette aspiration (mean ± SD, N = 12
cells). The volume of individual RBCs was taken at 15 different temperature steps between
34.5 and 39.5 °C at steps of about 0.3 to 0.4 degree (compare Figure 1). For the sake of clarity
in this Figure 2 there are only three data points shown. The RBC volume decreased with
increasing temperature but at two significantly different slopes below and above Tc = 36.4 ±
0.7 °C, respectively. Below Tc, RBCs lost volume at a rate of 7.8 fL/K, and above at 3 fL/K.
The inserts represent Hb molecule schemes; dark: hemoglobin, light: remaining cytosolic
water per molecule. On the left: the remaining cytosolic water decreased continuously. Right:
The water decreased further, however at a significantly lower rate. The error bars in vertical
direction include systematic and random errors. However, these error bars are dominated by
the varying individual RBC volumes.
VRBC=76,7fLrRBC= 4.19 nm
VRBC=96,2 fLrHb= 4.52 nm
VRBC=69,2fLrRBC= 4.05 nm
60
70
80
90
100
110
34 35 36 37 38 39 40
temperature (°C)
RB
C v
olum
e, V
RB
C (
fL)
Tc= 36.4±0.7 °C
VRBC=76,7fLrRBC= 4.19 nm
VRBC=96,2 fLrHb= 4.52 nm
VRBC=69,2fLrRBC= 4.05 nm
60
70
80
90
100
110
34 35 36 37 38 39 40
temperature (°C)
RB
C v
olum
e, V
RB
C (
fL)
Tc= 36.4±0.7 °C
Temperature (°C)
rHb
rHb=4.05 nm

214
Results
This paper presents data obtained with intact RBCs from healthy donors. Except for the
micropipette experiments in single cell volume determinations, RBCs remained in their
natural chemical environment - in blood plasma. There was no shear force acting on the cells
during measurements, no leucocytes and thrombocytes were present, and the hematocrit was
elevated. These preparation protocols were essential for the results presented below.
Micropipette experiments: During RBC aspiration (Figure 1), tongue formation was
observed to occur in two time-phases, 1) a fast initial entrance phase which typically lasted
less then a second and 2) a subsequent slow creeping phase for a couple of seconds where the
tongue length usually changed less then 10%. A steady state of tongue length was considered
to be reached, when an aspiration pressure of -12 kPa was applied for a short time and no
further tongue length increment was observed. Figure 1 C shows a typical volume (Formula
1) vs. temperature curve of one individual. The average volume over temperature data of
twelve individual RBCs showed a distinct and significant change in slope with a significant
kink at Tc = 36.4 ± 0.7 (N = 12) (Figure 2). The RBC volume below Tc decreased at a rate of
7.8 fL/K with increasing temperature. Setting on Tc, the rate was decreased to only 3 fL/K.
The calculated average RBC volume data at various t
emperatures are shown in Table 1.
Temperature
(°C)
Mean RBC
volume
(fL)
Hemoglobin
molecule
volume
(nm3)
Hemoglobin
molecule
radius
(nm)
Number of
hydration
layers per
Hemoglobin
molecule
25°C MCV = 88±6 321,6* 4.25* 6
34.5 ± 1°C 96.2 ± 7 352,0 4.38 7
Tc = 36.4 °C 76.7±7.1 280,3 4.06 5
39.5°C 69.2 ± 7.8 252,3 3.92 4
Table 1: Estimated RBC and hemoglobin molecule data resulting from micropipette
experiments (Legend: MCV, mean cellular RBC volume, * calculated for freely suspended
RBCs at an average volume of 88 fL). Please note that Hb molecules were mechanically
confined and under elevated pressure due to pipetting.

215
Statistical analysis revealed that the data were normally distributed since the Shapiro test
resulted in 0.5029 for D1, in 0.6798 for D2, and in 0.7433 for D (see methods). The p-values
of the t-test were p (D1) = 0.0000, p (D2) = 0.0021, and p (D) = 0.0016 and confirmed that all
three differences deviated significantly from the null hypothesis. Thus, the slopes between
34.5°C and Tc and between Tc and 39.5°C, respectively were both significantly negative. In
addition, the slope in the lower temperature range was significantly more negative than the
one above Tc. With formulae 2a-2d Hb molecular volumes, surfaces and radii were estimated
from the micropipette data (Table 1). The Hb radii correspond to a water layer thinning rate
per one individual Hb molecule of 0.084 nm/K below Tc and of 0,052 nm/K above,
respectively.
NMR T1 measurements: Two NMR T1 relaxation time measurements were carried out in
parallel 1) with blood plasma containing 83% RBCs (RBC-in-plasma sample, Figure 3A) and
2) with blood plasma alone (plasma-only-sample, Figure 3B). With both samples, a two-
phasic behavior of T1 vs. temperature was observed, showing a transition temperature at Tc =
37 ± 1°C. The RBC-in-plasma-sample showed a change from a steady, linear (r = 0.99)
increment of T1 below Tc at a rate of 0.023 s/K. Setting on at Tc, T1 did not show any visible
dependency of temperature.
The plasma-only-sample showed converse characteristics: No temperature dependency below
37°, a transition temperature at 37°C and a decrease with temperature at the modest rate of
3.8⋅10-3 above Tc (Figure 3B). The T1 of the plasma-only-sample was about three to five
times higher as compared to the RBC-in-plasma-sample.
Colloid osmotic pressure experiments: As shown in Figure 4, the COP of the plasma-only-
sample increased linearly up to 39.5°C. The COP of the RBC-in-plasma-sample was in
general 2 mmHg lower than the one of pure plasma samples at the same temperature. Setting
on at Tc = 37.1 ± 0.2°C, the COP of the RBC containing sample decreased rapidly and
significantly.
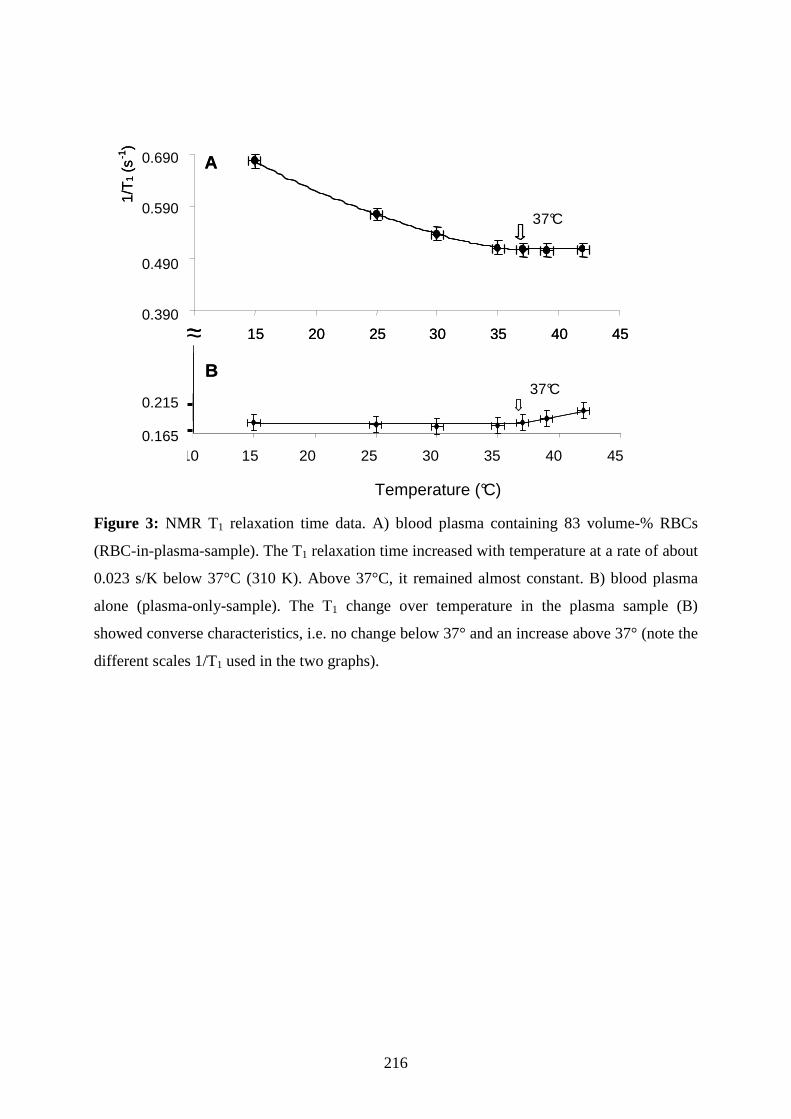
216
Figure 3: NMR T1 relaxation time data. A) blood plasma containing 83 volume-% RBCs
(RBC-in-plasma-sample). The T1 relaxation time increased with temperature at a rate of about
0.023 s/K below 37°C (310 K). Above 37°C, it remained almost constant. B) blood plasma
alone (plasma-only-sample). The T1 change over temperature in the plasma sample (B)
showed converse characteristics, i.e. no change below 37° and an increase above 37° (note the
different scales 1/T1 used in the two graphs).
0,165
0,215
10 15 20 25 30 35 40 45temperature (°C)
37°C
A
B
~~0,390
0,490
0,590
0,690
15 20 25 30 35 40 45
1/T
1(s
-1)
37 °C
0,215
0,165
10 15 20 25 30 35 40 45
temperature (°C)
37°C
37°C
0,165
0,215
10 15 20 25 30 35 40 45temperature (°C)
37°C
A
B
~~0,390
0,490
0,590
0,690
15 20 25 30 35 40 45
1/T
1(s
-1)
37 °C
0,215
0,165
10 15 20 25 30 35 40 45
temperature (°C)
37°C
37°C
Temperature (°C)
0.690 0.590 0.490 0.390
0.215 0.165

217
Figure 4: Temperature course of the colloid osmotic pressure (COP) over temperature. Upper
curve: Blood plasma without RBC (plasma-only sample), below: RBCs re-suspended in
autologous plasma at an average of 77,6 ± 5.3 volume-% RBC (RBC-in-plasma-sample). At
each temperature step, N = 16 individual samples of healthy donors were measured (average ±
1 SEM). The 95% confidence interval is indicated with dotted lines. The RBC-in-plasma-
sample showed a 2mmHg lower COP below Tc and a linear increment with temperature and
was in parallel with the plasma-only-sample. Beginning at Tc = 37°C, its COP dropped
significantly. Instead, the plasma-only sample showed a regular temperature course with no
turning point at 37 °C.
Temperature (°C)
*
**
blood Plasma
RBC in plasma
*
**
*
**
Blood Plasma
RBC in Plasma
Temperature (°C)

218
Discussion
There is growing evidence that the cell cytosol has the properties of a hydrogel consisting of
proteins, protein-bound and bulk water. The current opinion is controversial. Some studies
showed that the cell cytosol of cells mainly consists of bulk water (Stadler et al.,
2008b;Zaccai, 2004), some that the cell content predominantly is gel-like (Pollack,
2001a;Pollack, 2001b). However, the methods probe either microscopic or macroscopic
properties and the results might not be directly comparable. Sudden phase transition like
changes of protein function or cell behavior, respectively, could also be related to protein-
bound and bulk water effects. In our earlier studies (Figure 5) a sharp temperature transition
of RBC passage behavior through narrow pipettes occurred within less than a degree Celsius
at Tc = 36.3 ± 0.3°C (Artmann et al., 1998;Artmann et al., 2004;Kelemen et al., 2001).
Moreover, studies with hemoglobins from various species with body temperatures different
from those of humans revealed that temperature transitions occurred as well. Those critical
temperatures were close to the specific species` body temperature (Digel et al., 2006;Zerlin et
al., 2007c). We concluded that the hemoglobin molecule senses the species’ body temperature
by undergoing a partial unfolding at Tc (Stadler et al., 2007;Stadler et al., 2008a). Thus, the
critical transition temperature separates two distinctly different physical molecular stages and,
consequently, cellular behaviors.

219
Figure 5: Micropipette passage experiment. The red blood cell passage curves were obtained
with human RBCs. Left curve: RBCs were suspended in a H2O based buffer (Artmann et al.,
1998), Right curve: RBCs were suspended in a D2O based buffer (Buldt et al., 2007;Stadler
et al., 2007;Artmann et al., 1998). The Tc measured with H2O based buffer was by 0.7 - 0.8°C
smaller then the one with D2O buffer. This indicated that stronger water bonds exerted by
deuterium replacing hydrogen caused a shift in the critical temperature by 0.7 - 0.8 °C.
Temperature (°C)
Glas-like Fluid-like

220
Micropipette RBC volume measurements: When an RBC enters a narrow micropipette, an
isotropic RBC membrane tension builds up until balance of forces was established (Evans,
1983;Hochmuth et al., 1979;Chien et al., 1978). During the aspiration process, cellular bulk
water was squeezed out across the membrane and the RBC lost volume (Fairbanks et al.,
1971;Farinas et al., 1993;Jay, 1996;Poschl et al., 2003;Walz et al., 1997;Yokoyama et al.,
1978). In our experiments a short term increase of the aspiration pressure up to -12 kPa did
not show any further RBC volume decrement. Thus, the Hb molecules inside RBCs were
assumed to be in closest possible contact to each other leaving only traces of bulk water inside
the RBC, if at all. The remaining cell water must therefore be trapped between (mostly)
hemoglobin molecules and must be constrained in its transversal diffusion (Dencher et al.,
2000). This conclusion seems to contradict recent neutron scatter experiments which showed
that only 10% of the RBC´s cytosolic water exhibit reduced dynamics (Stadler et al., 2007).
However, in the spherical trail of an aspirated RBC the cytosol is compressed due to the
aspiration pressure. The remaining distance between adjacent Hb molecules was estimated to
be about ten water molecule diameters only (Kelemen et al., 2001). Such protein water
arrangement should reduce the translational diffusion of water molecules. A hemoglobin-
water-gel had formed in the RBC`s spherical trail (Figure 1) which did not allow RBC
passage through the pipette below Tc (Artmann et al., 1998).
However, why do at Tc the RBCs set on passing the pipette in an almost step-function like
manner (Figure 5)? From figure 5 must be concluded, that the transition is related to
hemoglobin-water interaction. It is known, that hydrogen bonds formed by heavy water are a
little more stable than those in normal water. The average protein dynamics was measured
with neutron scattering in Escherichia coli (Jasnin et al., 2008). Mean protein flexibility and
macromolecular resilience (protein ‘stiffness’) were found to be reduced in D2O compared to
H2O buffer. It was concluded that D2O favors the packing of non-polar residues in the core of
the protein and at the same time enhances the sampling of conformational substates. The
reduced protein flexibility and enhanced sampling rate of conformational substates in D2O
would therefore contribute to thermal stabilization of protein structure. Micropipette passage
experiments carried out with a heavy water buffer (D2O buffer) showed a temperature
transition at only 0.7 – 0.8 degrees higher temperature (Figure 5). Interestingly, in a
completely different biological system (Tetrahymena cells) the optimum temperature for cell
division shifted upward as the heavy water concentration was increased. A maximum shift of
1 °C was observed in 40% heavy water (Moner, 1972). It is well known from neutron small
angle experiments that D2O causes protein aggregation in certain systems. If only simple

221
protein aggregation would be the cause for the passage phenomenon observed in micropipette
experiments, then the usage of heavy water would cause a reduced passage temperature as
compared to normal water. However, the micropipette experiments revealed that the passage
temperature in D2O buffer is increased compared to H2O buffer. Recent neutron scattering
experiments with RBCs and hemoglobin solutions, respectively, revealed that at Tc a small
partial unfolding of Hb molecules occurred (Stadler et al., 2007;Stadler et al., 2008a;Stadler et
al., 2008b). We concluded that this effect initiated the fluidization of aspirated RBCs and their
passage through the pipette. Probably the hemoglobin´s surface hydrophobicity pattern
changed as well which was followed by cytsosolic Hb aggregation. Therefore, the stabilizing
effect of heavy water on protein flexibility and on thermal unfolding might be the cause for
the increase of the passage temperature observed in micropipette experiments (Buldt et al.,
2007;Stadler et al., 2007;Goldenfeld and N., 1992).
RBC volume vs. temperature experiments were carried out with micropipettes (Linderkamp
and Meiselman, 1982). The inner pipette diameter of 1.1µm was small enough to prevent any
RBC passages. Measurements performed between 34.5°C and 39.5°C showed that the RBC
volume decreased in general with increasing temperature. However, this happened at two
significantly different slopes. There was a critical temperature of Tc = 36.4 ± 0.7°C observed
where the volume vs. temperature curves showed a kink.
The RBC volume of 96.2 fL ± 7.0 at 34.5°C and -2.3 kPa (Table 1) fit to 94.3 fL at -1.96 kPa
and to 91.2 fL at 2.45 kPa aspiration pressure at room temperature, respectively, as observed
in an earlier publication. With the set of formulae developed for estimating the Hb molecular
volume inside an RBC during aspiration (formulae 2a-d), we determined Hb molecule radii,
rHb, (Table 1). Results on rHb were surprisingly consistent with those derived in previous light
scattering data (Zerlin et al., 2007b;Digel et al., 2006). This method, thus, may be a step
forward in terms of estimating the Hb molecule radius (Engstrom and Sandstrom,
1989;Engstrom and Meiselman, 1996).
The major findings of these RBC volume experiments were that RBCs lost volume with
increasing temperature significantly more readily below than above Tc. Obviously, the Hb
molecules handle water in two distinctly different ways below and above Tc, respectively.
Discussing a decreasing molecular radius for Hb with increasing temperature (Figure 2, Table
1) seemed to contradict two earlier findings: Light scattering data (Zerlin et al., 2007a;Digel et
al., 2006) as well as preliminary X-ray diffraction studies (Buldt et al., 2007) showed
increasing hydrodynamic radii and lattice constants with increasing temperatures until Tc was

222
reached. The preliminary X-ray studies with Hb-crystals showed in addition, that the Hb
crystal disintegrated at Tc (Figure 6 A).
Figure 6: Summary slide: A) X-ray diffraction: Below Tc, the Hb crystal lattice constant
increases disproportionate with increasing temperature. At Tc, the Hb crystal disintegrates
(Buldt et al., 2007), B) NMR T1 relaxation time (RBC in plasma-sample): Below Tc, T1
increment, at Tc, structural Hb transition, above Tc, no net T1 change with temperature, C)
Colloid osmotic pressure (RBC-in-plasma sample): Below Tc, the COP increases, at Tc =
37.1 ± 0.2°C on-set of Hb aggregation causing RBCs to release cell water - COP decreases,
D) Micropipette aspiration (single RBCs): Hb molecule volume remains unchanged with
temperature due to hydrostatic pressure inside the spherical trail of the aspirated RBC and
bound water turns into bulk water. This was squeezed out due to aspiration pressure. At Tc,
glass-like-transition and further RBC volume loss occur because of hemoglobin aggregation.

223
In postulating two assumptions, a clearer understanding of the volume loss of RBCs with
rising temperature was achieved. First, during aspiration the fluctuations of the cytosolic Hb
molecules as well as the cell water diffusion are mechanically constrained. The Hb molecule
could not expand with temperature as it does in free solution and crystals. Water diffusion was
as well constricted. Second, the number of water molecules associated with hemoglobin
continuously decreased (“melted off”) and this water was squeezed out from the cell. This
effect caused the RBC volume loss below Tc where the hemoglobin water complex had the
consistency of an amorphous gel. The term “melting” used here is just a more descriptive
word for a shift of the equilibrium between Hb-bound water and bulk water toward bulk water
(Cameron et al., 1988).
At Tc the amount of Hb bound water molecules had reached a threshold value at which the
Hb-water complex was destabilized. This enabled the partial unfolding and the assumed Hb
surface hydrophobicity changes. The latter initiated Hb molecular aggregation which we also
found in neutron scattering experiments (Stadler et al., 2007;Digel et al., 2006;Zerlin et al.,
2007i).
Above Tc, with increasing temperature ongoing cytosolic Hb aggregation determined the
RBC volume loss (Figure 6) due to colloid osmotic effects. We concluded that Hb
aggregation lead to an imbalance of the osmotic pressures inside vs. outside the cell
constituting of native blood plasma. As consequence RBCs release water to the blood plasma
to re-balance osmotic pressures. Thus, the colloid osmotic pressure decreased above Tc with
increasing temperature (Figure 4, see discussion below).
NMR T1 measurements: NMR T1 relaxation time data reflect magnetic interactions of
hydrogen nuclei with their environment (lattice). However, interpreting them when the sample
consisted of complex protein water solutions is not simple (Victor et al., 2005;Kiihne and
Bryant, 2000). Although these measurements were not in the focus of this study, they revealed
important information. The RBC-in plasma sample consisted of 83 % RBCs and 17 % blood
plasma, thus the protons participating in the NMR experiment originated in its majority from
water, both protein-bound and free, of hemoglobin, and to a smaller percentage of human
albumin. At 83% hematocrit the NMR sample contained 26.4 g dL-1 Hb. Thus, the T1 signal
can be attributed to an high extend to Hb-internal proton interactions and Hb-proton
interactions with their water-proton environment. We observed a critical temperature at Tc =
37 ± 1°C (Figure 3). Below Tc, T1 rose linearly with increasing temperature. We concluded
that these interactions became less and less strong. Since we observed at the same time a
“melting-off” of water from hemoglobin (Figure 1 and Figure 2 and table I) much of this

224
signal increment may have derived from increasing bulk water. At Tc, the T1 (T)-curve turned
into zero slope. Thus, Tc represents the onset of a temperature interval where the T1 relaxation
time became independent of temperature. Interestingly, in the plasma-only sample the T1 (T)-
curve showed exactly a vice versa behavior: Zero slope below Tc and a small negative slope
above. In summary, above Tc temperature did not affect any longer the spin lattice
interactions in the RBC-in-plasma sample but began increasing the spin lattice interactions in
the plasma-only sample. In other words, in the RBC-in plasma sample the intramolecular
proton-proton interactions as well as the hemoglobin-proton to water interactions have
overruled the interaction of plasma proteins with water. This might arise from the partial
unfolding of hemoglobin at Tc and its consequences for hemoglobin aggregation and changes
of the hemoglobin bound and free water balance (Artmann et al., 2004;Kiihne and Bryant,
2000;Stadler et al., 2007;Stadler et al., 2008a).
Colloid osmotic pressure (COP) of RBC suspensions in blood plasma: Some effects in
cells can only be seen when cells and proteins are kept in their natural environment
(Eisenberg, 2003;Zheng and Pollack, 2003;Lucas et al., 1991;Todd, III and Mollitt,
1994;Artmann et al., 1998). In our studies, COP data were obtained from both plasma-only-
samples and RBC-in-plasma-samples at a hematocrit of 77.6 as function of temperature
(Figure 4). In contrast to micropipette experiments, COP data were gathered both at shear
stress-free conditions within the RBC cytosol and at a cell internal hydrostatic pressure
unmodified by external mechanical forces acting on RBC membranes (Figure 6C, D). It was
found that 1) the COP of the plasma-only-sample at 29°C fits to the physiological COP found
in text books, 2) it increased linearly with temperature, and 3) it did not show any kink
(change in slope) at any temperature. However, the RBC-in-plasma-sample as compared to
the plasma-only-sample below 1) exhibited a visible but not significant 2mmHg lower COP,
and 2) showed a turning point at Tc = 37°C where the COP began decreasing with
temperature (Figure 4). Thus, a temperature transition was observed in COP measurements at
mechanically unaffected conditions.
How can the COP drop above Tc be explained? For low protein concentrations the COP
follows van´t Hoff`s law. In the plasma-only-sample therefore the COP increased linearly
with temperature. As for the RBC-in-plasma-sample (Figure 4), however, things are more
complex. Two sample volume compartments must be considered, 1) the volume occupied by
RBCs, on average 77.6 ± 5.3 %, and 2) the remaining plasma volume at 22.4%. The COP of
this sample should be identical to the plasma-only-sample since RBCs are too big to
contribute significantly to the COP. In order to understand why the COP of the RBC-in-

225
plasma-samples dropped above Tc, we need to remember that the COP depends upon the
particle number in the RBC cytosol and not on its total protein content. When Hb molecules
inside RBCs aggregate as suggested and confirmed earlier (Digel et al., 2006;Zerlin et al.,
2007h;Stadler et al., 2008a;Stadler et al., 2008b) then the particle number and at the same time
the intracellular COP decrease. Consequently, cell water moves outwards, diluting the outside
plasma until equilibrium is reached. Due to this extra water derived form the RBCs cytosol
above Tc the COP of whole RBC-in-plasma-sample decreased.
The global picture: In many experiments on the temperature dependency of Hb properties
using light scattering, CD spectroscopy (Artmann et al., 2004;Digel et al., 2006;Zerlin et al.,
2007g), micropipette volume (Figure 2) or Hb viscosity measurements (Kelemen et al., 2001)
a transition temperature, Tc, was found. However, the transition gradient was never as sharp
as in the micropipette passage change (Figure 5) and in the viscosity experiments of highly
concentrated Hb solutions (Kelemen et al., 2001). This implies an unknown mechanism
making these two particular transitions significantly sharper. We suggest that TC marks the
temperature at which a colloidal phase transition of second order occurred (Goldenfeld and
N., 1992;Heller and Hofer, 1975;Landau, 2007). In the micropipette passage experiments, the
transition would take place inside the spherical trail of the aspirated RBC where the Hb
concentration was between 45 g dL-1 and 50 g dL-1 (Kelemen et al., 2001). Below Tc, a
“disordered Hb-water gel” was formed consisting of hemoglobin plus bound water and
cellular water with dynamics similar to bulk water (i.e. in physical terms “amorphous glass”
or “colloidal system with gel like properties”). Below Tc, sample enthalpy, entropy and
volume are continuous functions of temperature. Near the “glass like transition” temperature,
Tc, the hemoglobin `glass` or ‘colloidal gel’ would suddenly “soften” and set on flowing
under mechanical cytosolic shear forces exerted when an RBC enters the micropipette (Figure
5). Above Tc the spherical trail’s cytosol (Figure 2) would exhibit properties approaching
those of an ordinary fluid (Artmann et al., 1998;Kelemen et al., 2001), although still more
viscous than low-molecular weight liquids. We suggest that the very sharp micropipette
passage transition represents a phenomenon similar to a ”glass transition” or “colloidal phase
transition” common to many polymers and proteins (Craig and Terentjev, 2005;Hill et al.,
2005;Smith et al., 2004). In strict classical sense the term “glass transition” or “dynamic
transition” is used for a change in protein dynamics at 200K (-73°C). However, some “glass
transition” features fit surprisingly well to the properties of the temperature transition
observed in the micropipette experiments.

226
What would now be the links of physics to physiology? Our answer is that Tc 1) marks the
set-point of a species body temperature originating from a partial unfolding of hemoglobin at
Tc (Digel et al., 2006;Zerlin et al., 2007f;Stadler et al., 2008a;Stadler et al., 2008b), 2) Tc
represents the set point of a reversible Hb denaturation (Artmann et al., 2004), finally, Tc
marks the beginning of the pyrexia zone on the temperature scale. In this pyrexia zone,
depending on the actual stage of cell internal Hb aggregation followed by COP changes cell
water moves in and out of the cell depending on the direction of temperature change (Figure
4). The latter might contribute to blood homeostasis during fever. The pyrexia zone in humans
ends physiologically at a temperature, TID = 42,6 °C, where proteins thermally denature
irreversibly. The pyrexia zone might now be defined by two distinct temperatures, the lower
one marked by Tc and the upper one marked by TID. Evidently, new perspectives on cell
biophysics using completely different approaches from those used by molecular and cell
biologists will become more and more important in our attempt to understand cells as gels,
and muscles as engines based on principles of polymer science.
Acknowledgements
This work was supported by the Ministry of Innovation, Science, Research and Technology of
the State of North Rhine-Westphalia to G. M. Artmann and by the Centre of Competence in
Bioengineering Juelich, Germany. Dipl.-Ing. Carsten Meixner acquired most of the COP data.
NMR data were acquired together with the Giuseppe Melachini, Ph.D., University of
California, San Diego, USA. The work was supported by great discussions with Prof. Y.C.
Fung and Prof. Shu Chien, University of California, San Diego. We thank Prof. Georg Büldt,
Research Center Jülich, Germany, who supported us with DSC and X-ray structural studies on
Hb crystals. Additionally, we thank J. Zaccai, Institute Laue-Langevin (ILL) in Grenoble for
good discussions.

227
Reference List
1. Artmann,G.M., L.Burns, J.M.Canaves, A.Temiz-Artmann, G.W.Schmid-Schonbein,
S.Chien, and C.Maggakis-Kelemen. 2004. Circular dichroism spectra of human
hemoglobin reveal a reversible structural transition at body temperature. Eur. Biophys.
J. 33:490-496.
2. Artmann,G.M., C.Kelemen, D.Porst, G.Buldt, and S.Chien. 1998. Temperature
transitions of protein properties in human red blood cells. Biophys. J. 75:3179-3183.
3. Bettati,S., A.Mozzarelli, and M.F.Perutz. 1998. Allosteric mechanism of haemoglobin:
rupture of salt-bridges raises the oxygen affinity of the T-structure. J. Mol. Biol.
281:581-585.
4. Braxenthaler,M., R.Unger, D.Auerbach, J.A.Given, and J.Moult. 1997. Chaos in
protein dynamics. Proteins 29:417-425.
5. Buldt, G., Artmann, G. M., Zaccai, G., Digel, I., and Stadler, A. M. Differences of
water and D2O binding to proteins; temperature dependent DSC measurements and
lattice constants of hemoglobin crystals. 7-5-2007. Personal Communication
6. Cameron,I.L., V.A.Ord, and G.D.Fullerton. 1988. Water of hydration in the intra- and
extra-cellular environment of human erythrocytes. Biochem. Cell Biol. 66:1186-1199.
7. Chien,S., R.G.King, A.A.Kaperonis, and S.Usami. 1982. Viscoelastic properties of
sickle cells and hemoglobin. Blood Cells 8:53-64.
8. Chien,S., K.L.Sung, R.Skalak, S.Usami, and A.Tozeren. 1978. Theoretical and
experimental studies on viscoelastic properties of erythrocyte membrane. Biophys. J.
24:463-487.
9. Craig,A. and E.M.Terentjev. 2005. Stretching globular polymers. I. Single chains. J.
Chem. Phys. 122:194901.
10. Danish,E.H. and J.W.Harris. 1983. Viscosity studies of deoxyhemoglobin S: evidence
for formation of microaggregates during the lag phase. J. Lab Clin. Med. 101:515-526.
228
11. Dencher,N.A., H.J.Sass, and G.Buldt. 2000. Water and bacteriorhodopsin: structure,
dynamics, and function. Biochim. Biophys. Acta 1460:192-203.
12. Digel,I., C.Maggakis-Kelemen, K.F.Zerlin, P.Linder, N.Kasischke, P.Kayser, D.Porst,
A.A.Temiz, and G.M.Artmann. 2006. Body temperature-related structural transitions
of monotremal and human hemoglobin. Biophys. J. 91:3014-3021.
13. Dikta,G., M.Kvesic, and C.Schmidt. 2006. Bootstrap Approximations in Model
Checks for Binary Data. Journal of the American Statistical Association 101:521-530.
14. Eisenberg,H. 2003. Adair was right in his time. Eur. Biophys. J. 32:406-411.
15. Engstrom,K.G. and H.J.Meiselman. 1996. Effects of pressure on red blood cell
geometry during micropipette aspiration. Cytometry 23:22-27.
16. Engstrom,K.G., B.Moller, and H.J.Meiselman. 1992. Optical evaluation of red blood
cell geometry using micropipette aspiration. Blood Cells 18:241-257.
17. Engstrom,K.G. and P.E.Sandstrom. 1989. Volume regulation in mouse pancreatic islet
cells as studied by a new technique of microperifusion. Acta Physiol Scand. 137:393-
397.
18. Evans,E.A. 1983. Bending elastic modulus of red blood cell membrane derived from
buckling instability in micropipet aspiration tests. Biophys. J. 43:27-30.
19. Fairbanks,G., T.L.Steck, and D.F.Wallach. 1971. Electrophoretic analysis of the major
polypeptides of the human erythrocyte membrane. Biochemistry 10:2606-2617.
20. Farinas,J., A.N.Van Hoek, L.B.Shi, C.Erickson, and A.S.Verkman. 1993. Nonpolar
environment of tryptophans in erythrocyte water channel CHIP28 determined by
fluorescence quenching. Biochemistry 32:11857-11864.
21. Finnie,M., G.D.Fullerton, and I.L.Cameron. 1986. Molecular masking and unmasking
of the paramagnetic effect of iron on the proton spin-lattice (T1) relaxation time in
blood and blood clots. Magn Reson. Imaging 4:305-310.
22. Goldenfeld and N. 1992. Lectures on Phase Transitions and the Renormalization
Group.

229
23. Gowrishankar,T.R., W.E.I.CHEN, and R.C.Lee. 1998. Non-Linear Microscale
Alterations in Membrane Transport by Electropermeabilization. Ann NY Acad Sci
858:205-216.
24. Heller,K.B. and M.Hofer. 1975. Temperature dependence of the energy-linked
monosaccharide transport across the cell membrane of Rhodotorula gracilis. J. Membr.
Biol. 21:261-271.
25. Hennig,M.H., K.Funke, and F.Worgotter. 2002. The Influence of Different Retinal
Subcircuits on the Nonlinearity of Ganglion Cell Behavior. J. Neurosci. 22:8726-8738.
26. Hill,J.J., E.Y.Shalaev, and G.Zografi. 2005. Thermodynamic and dynamic factors
involved in the stability of native protein structure in amorphous solids in relation to
levels of hydration. J. Pharm. Sci. 94:1636-1667.
27. Hochmuth,R.M., P.R.Worthy, and E.A.Evans. 1979. Red cell extensional recovery and
the determination of membrane viscosity. Biophys. J. 26:101-114.
28. Jasnin,M., M.Tehei, M.Moulin, M.Haertlein, and G.Zaccai. 2008. Solvent isotope
effect on macromolecular dynamics in E. coli. Eur Biophys J 37:613-617.
29. Jay,D.G. 1996. Role of band 3 in homeostasis and cell shape. Cell 86:853-854.
30. Kelemen,C., S.Chien, and G.M.Artmann. 2001. Temperature transition of human
hemoglobin at body temperature: effects of calcium. Biophys. J. 80:2622-2630.
31. Kiihne,S. and R.G.Bryant. 2000. Protein-bound water molecule counting by resolution
of (1)H spin-lattice relaxation mechanisms. Biophys J 78:2163-2169.
32. Knapp,J.E., M.A.Oliveira, Q.Xie, S.R.Ernst, A.F.Riggs, and M.L.Hackert. 1999. The
structural and functional analysis of the hemoglobin D component from chicken. J.
Biol. Chem. 274:6411-6420.
33. Landau,L.D.a.L.E.M. 2007. Statistical Physics Part 1 (of Course of Theoretical
Physics). Pergamon.
34. Levantino,M., A.Cupane, and L.Zimanyi. 2003. Quaternary structure dependence of
kinetic hole burning and conformational substates interconversion in hemoglobin.
Biochemistry 42:4499-4505.

230
35. Linderkamp,O. and H.J.Meiselman. 1982. Geometric, osmotic, and membrane
mechanical properties of density-separated human red cells. Blood 59:1121-1127.
36. Lucas,C.E., A.M.Ledgerwood, W.J.Rachwal, D.Grabow, and J.M.Saxe. 1991. Colloid
oncotic pressure and body water dynamics in septic and injured patients. J. Trauma
31:927-931.
37. Lukin,J.A., G.Kontaxis, V.Simplaceanu, Y.Yuan, A.Bax, and C.Ho. 2003. Quaternary
structure of hemoglobin in solution. Proc. Natl. Acad. Sci. U. S. A 100:517-520.
38. Moner,J.G. 1972. The effects of temperature and heavy water on cell division in heat-
synchronized cells of tetrahymena. J Protozool. 19:382-385.
39. Muller,G.H., H.Schmid-Schonbein, and H.J.Meiselman. 1992. Development of
viscoelasticity in heated hemoglobin solutions. Biorheology 29:203-216.
40. Pascher,T. 2001. Temperature and driving force dependence of the folding rate of
reduced horse heart cytochrome c. Biochemistry 40:5812-5820.
41. Pollack,G.H. 2001a. Cells, Gels and the Engines of life. Ebner and Sons, Seattle.
42. Pollack,G.H. 2001b. Is the cell a gel--and why does it matter? Jpn. J. Physiol 51:649-
660.
43. Poschl,J.M., C.Leray, P.Ruef, J.P.Cazenave, and O.Linderkamp. 2003. Endotoxin
binding to erythrocyte membrane and erythrocyte deformability in human sepsis and
in vitro. Crit Care Med. 31:924-928.
44. Smith,J.C., F.Merzel, A.N.Bondar, A.Tournier, and S.Fischer. 2004. Structure,
dynamics and reactions of protein hydration water. Philos. Trans. R. Soc. Lond B Biol.
Sci. 359:1181-1189.
45. Stadler,A.M., I.Digel, G.M.Artmann, J.P.Embs, G.Zaccai, and G.Buldt. 2008a.
Hemoglobin dynamics in red blood cells: correlation to body temperature. Biophys J
95:5449-5461.
46. Stadler,A.M., J.P.Embs, I.Digel, G.M.Artmann, T.Unruh, G.Buldt, and G.Zaccai.
2008b. Cytoplasmic water and hydration layer dynamics in human red blood cells. J
Am. Chem. Soc. 130:16852-16853.

231
47. Stadler, A. M., Zerlin, K. F., Digel, I., Artmann, G. M., Embs, J. P., Buldt, G., and
Zaccai, G. Dynamics of hemoglobin and water in human red blood cells and
concentrated hemoglobin solutions. Abstract 128. 14-7-2007. London, European
Biophysics Congress. 14-7-2007. Conference Proceeding
48. Todd,J.C., III and D.L.Mollitt. 1994. Sepsis-induced alterations in the erythrocyte
membrane. Am. Surg. 60:954-957.
49. Victor,K., A.Van Quynh, and R.G.Bryant. 2005. High frequency dynamics in
hemoglobin measured by magnetic relaxation dispersion. Biophys J 88:443-454.
50. Walz,T., T.Hirai, K.Murata, J.B.Heymann, K.Mitsuoka, Y.Fujiyoshi, B.L.Smith,
P.Agre, and A.Engel. 1997. The three-dimensional structure of aquaporin-1. Nature
387:624-627.
51. Williamson,D. 1993. The unstable haemoglobins. Blood Rev. 7:146-163.
52. Yokoyama,K., T.Terao, and T.Osawa. 1978. Membrane receptors of human
erythrocytes for bacterial lipopolysaccharide (LPS). Jpn. J. Exp. Med. 48:511-517.
53. Zaccai,G. 2004. The effect of water on protein dynamics. Philos. Trans. R. Soc. Lond
B Biol. Sci. 359:1269-1275.
54. Zefirova,T.P., A.N.Glebov, E.N.Gur'ev, R.S.Mavliautdinov, and O.I.Tarasov. 1991.
[Nuclear magnetic relaxation of aqueous solutions of proteins, plasma, erythrocytes,
and blood]. Biull. Eksp. Biol. Med. 112:378-381.
55. Zerlin,K.F., N.Kasischke, I.Digel, C.Maggakis-Kelemen, A.A.Temiz, D.Porst,
P.Kayser, P.Linder, and G.M.Artmann. 2007i. Structural transition temperature of
hemoglobins correlates with species' body temperature. Eur. Biophys. J.
56. Zerlin,K.F., N.Kasischke, I.Digel, C.Maggakis-Kelemen, A.A.Temiz, D.Porst,
P.Kayser, P.Linder, and G.M.Artmann. 2007a. Structural transition temperature of
hemoglobins correlates with species' body temperature. Eur. Biophys. J.
57. Zerlin,K.F., N.Kasischke, I.Digel, C.Maggakis-Kelemen, A.A.Temiz, D.Porst,
P.Kayser, P.Linder, and G.M.Artmann. 2007b. Structural transition temperature of
hemoglobins correlates with species' body temperature. Eur. Biophys. J.

232
58. Zerlin,K.F., N.Kasischke, I.Digel, C.Maggakis-Kelemen, A.A.Temiz, D.Porst,
P.Kayser, P.Linder, and G.M.Artmann. 2007c. Structural transition temperature of
hemoglobins correlates with species' body temperature. Eur. Biophys. J.
59. Zerlin,K.F., N.Kasischke, I.Digel, C.Maggakis-Kelemen, A.A.Temiz, D.Porst,
P.Kayser, P.Linder, and G.M.Artmann. 2007e. Structural transition temperature of
hemoglobins correlates with species' body temperature. Eur. Biophys. J.
60. Zerlin,K.F., N.Kasischke, I.Digel, C.Maggakis-Kelemen, A.A.Temiz, D.Porst,
P.Kayser, P.Linder, and G.M.Artmann. 2007g. Structural transition temperature of
hemoglobins correlates with species' body temperature. Eur. Biophys. J.
61. Zerlin,K.F., N.Kasischke, I.Digel, C.Maggakis-Kelemen, A.A.Temiz, D.Porst,
P.Kayser, P.Linder, and G.M.Artmann. 2007h. Structural transition temperature of
hemoglobins correlates with species' body temperature. Eur. Biophys. J.
62. Zerlin,K.F., N.Kasischke, I.Digel, C.Maggakis-Kelemen, A.A.Temiz, D.Porst,
P.Kayser, P.Linder, and G.M.Artmann. 2007d. Structural transition temperature of
hemoglobins correlates with species' body temperature. Eur. Biophys. J.
63. Zerlin,K.F., N.Kasischke, I.Digel, C.Maggakis-Kelemen, A.A.Temiz, D.Porst,
P.Kayser, P.Linder, and G.M.Artmann. 2007f. Structural transition temperature of
hemoglobins correlates with species' body temperature. Eur. Biophys. J.
64. Zheng,J.M. and G.H.Pollack. 2003. Long-range forces extending from polymer-gel
surfaces. Phys. Rev. E. Stat. Nonlin. Soft. Matter Phys. 68:031408.

Summary Incoherent quasielastic and elastic neutron scattering were used to measure protein and cell water dynamics in the picosecond time and Ångstrom length scale.
Hemoglobin dynamics was measured in human red blood cells, in vivo. The experiments revealed a change in the geometry of internal protein dynamics at 36.9°C, human body temperature. Above this temperature amino acid side-chain dynamics occupy larger volumes than expected from normal temperature dependence. Global macromolecular diffusion was interpreted according to theoretical concepts for short-time self-diffusion of non-charged hard sphere colloids.
The influence of hydration on hemoglobin dynamics was studied with neutron scattering. The residence times of localized jumps in the order of a few picoseconds were found to be significantly reduced in concentrated solution compared to fully hydrated powder. The change in the geometry of amino acid side-chain dynamics at body temperature was found in concentrated hemoglobin solution, but the body temperature transition in protein dynamics was absent in fully hydrated powder. This indicated that picosecond protein motions responsible for the body temperature transition are activated only at a sufficient level of hydration, and that hydrated powders may not reflect fully all functional protein dynamics.
The dynamics of cell water in human red blood cells was measured with quasielastic incoherent neutron scattering. A major fraction of around 90% of cell water is characterized by a translational diffusion coefficient similar to bulk water. A minor fraction of around 10% of cellular water exhibits reduced dynamics. The slow water fraction was attributed to dynamically bound water on the surface of hemoglobin, which accounts for approximately half of the hydration layer.
Keywords: incoherent neutron scattering, hemoglobin, red blood cells, cell water dynamics, protein dynamics, body temperature,
Résumé Les techniques de diffusion incohérente élastique et quasiélastique de neutrons ont été utilisées pour mesurer la dynamique de la protéine et de l’eau cellulaire sur les échelles de quelques picosecondes et de quelques Ångstroms.
La dynamique de l’hémoglobine a été mesurée dans les globules rouges, in vivo. La dynamique interne de la protéine montre un changement de régime à 36.9°C, la température physiologique. À des températures plus élevées que la température physiologique, les chaînes latérales des amino acides occupent des volumes plus grands que prévu par la dépendance normale sur la température. La diffusion globale de l’hémoglobine a été interprétée avec la théorie pour la diffusion des particules colloïdales à temps de courte durée.
L’influence de l’hydratation sur la dynamique de l’hémoglobine a été étudiée avec la diffusion de neutrons. Les temps de résidence entre les sauts locaux dans l’ordre de quelques picosecondes sont réduits en solution concentrée et augmentés en poudre d’hémoglobine hydratée. La transition dans la géométrie des mouvements internes à la température du corps a été trouvée dans la solution concentrée, mais pas dans la poudre hydratée. Il a été conclu que les poudres hydratées ne représentent pas un bon modèle pour la dynamique de la protéine dans l’ordre de quelques picosecondes, qui est corrélée à la fonction biologique.
La dynamique de l’eau cellulaire dans les globules rouges a été mesurée avec la technique de diffusion incohérente quasiélastique de neutrons. Une fraction de l’eau cellulaire d’environ 90% est caractérisée par un coefficient de diffusion translationnel similaire à celui de l’eau volumique. Les 10% restant présentent une dynamique ralentie de façon significative. La fraction ralentie a été attribuée à l’eau en interaction avec l’hémoglobine. Elle correspond à environ la moitié de l’eau dans la première couche d’hydratation de la protéine.
Mots clefs: diffusion incohérente de neutrons, hémoglobine, globules rouges, dynamique de l’eau cellulaire, dynamique de la protéine, température physiologique