kpi’s, dashboards and metrics: what’s it all about? june 7 ... · kpi’s, dashboards and...
TRANSCRIPT

KPI’s, Dashboards and Metrics: What’s it all About?
June 7, 2016 8:30am – 10:30am
Agenda
KPIs, Metrics, Dashboards Defined
Sample KPI Progress Report
Case Study
Benefits
Questions & Answers

3
What is a KPI?
3
A significant metric that measures business performance.
A KPI is an actionable scorecard that keeps your strategy on track. KPIs enable you to manage, control, and achieve desired business results.
KPIs differ depending on the nature of the organization and its strategy and goals. A Secretary of State’s corporation division may monitor the number of online hits daily to learn how eFiling usage is increasing or decreasing.

4
What is a Metric?
4
Metrics are a group of measurable data points related to core functions using data readily available in the agency systems.
The best way to determine the set of metrics is by defining a vision of success for an agency and evaluating which metrics most accurately measure progress towards an end goal.

5
What is a Dashboard?
Dashboards are best known as real-time depictions of KPIs and Metrics utilizing graphical/data cues.
Dashboards for monitoring business performance can be easily constructed from existing data systems.
Agencies should also consider leveraging technology and options built into backend systems such as MS SQL Server and Google Analytics.

6
Desired Business Results (Agency Goals)
• Goal # 1 - Increase online filings by 25% annually
• Goal # 2 - Reduce rejections by 15% (Accuracy)
• Goal # 3 - Increase staff productivity by 30% (Velocity)

7
KPI Progress Report (Scorecard)
Goal 1 Goal 2 Goal 3
Example
Data Source
Frequency
Chart
8
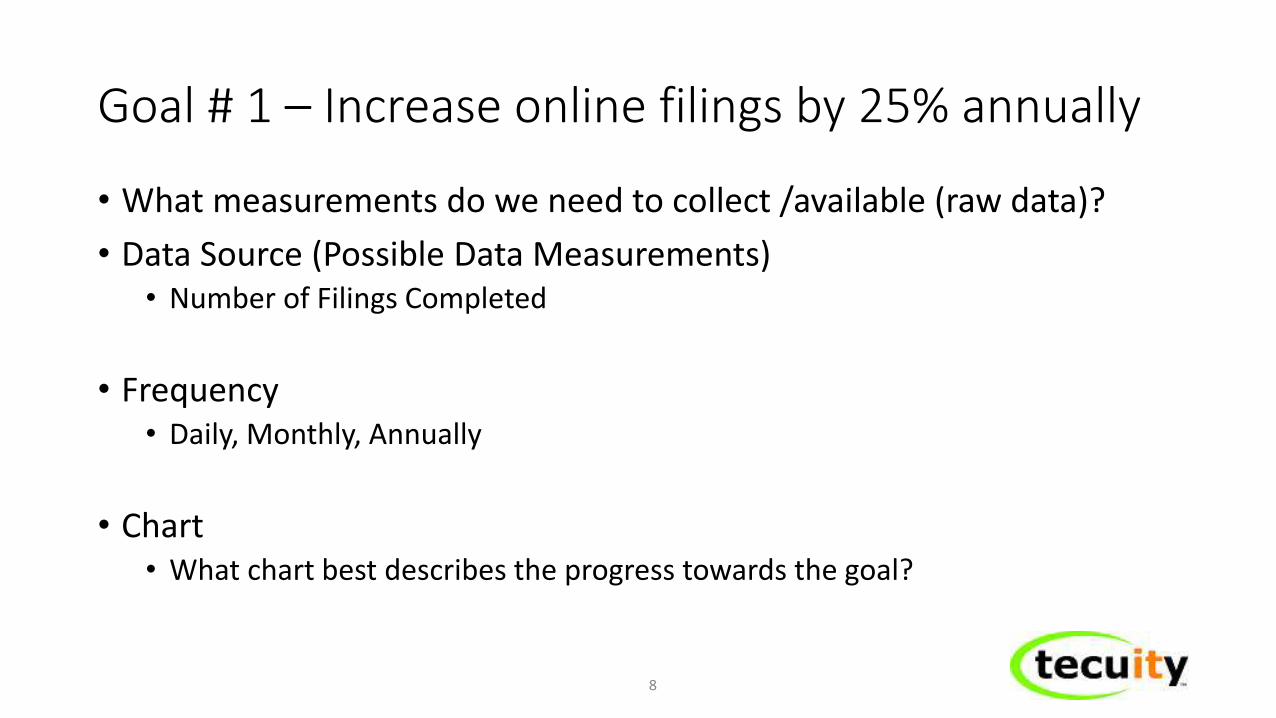
Goal # 1 – Increase online filings by 25% annually
• What measurements do we need to collect /available (raw data)?
• Data Source (Possible Data Measurements) • Number of Filings Completed
• Frequency • Daily, Monthly, Annually
• Chart • What chart best describes the progress towards the goal?

9
Goal #1 - Scorecard
Goal 1 Goal 2 Goal 3
Example Increase online filings by 25% annually
Data Source Number of Filings Completed
Frequency Monthly
Chart Line Graph

10
Goal #1 - Dashboard

11
Goal # 2 – Reduce rejections by 15% (Accuracy)
• What measurements do we need to collect /available (raw data)?
• Data Source (Possible Data Measurements) • Number of rejected filings
• Frequency • Daily, Monthly, Annual
• Chart • What chart best describes the progress towards the goal?
12
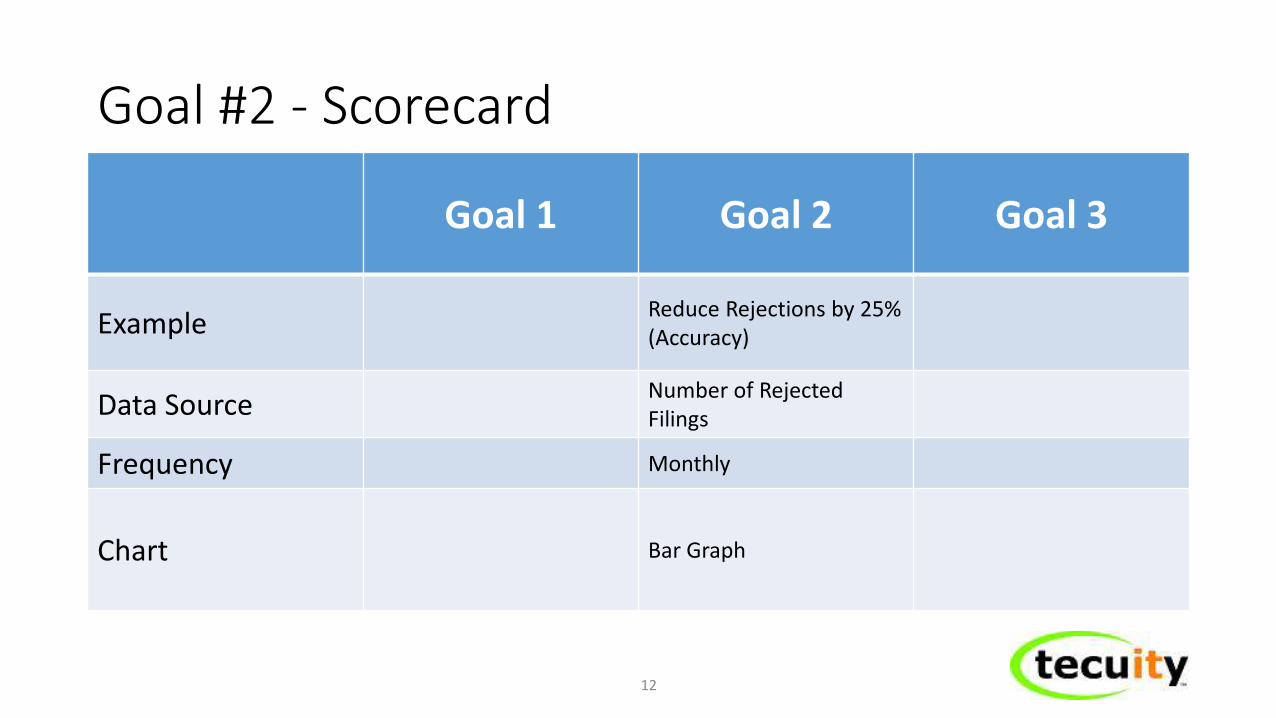
Goal #2 - Scorecard
Goal 1 Goal 2 Goal 3
Example Reduce Rejections by 25% (Accuracy)
Data Source Number of Rejected Filings
Frequency Monthly
Chart Bar Graph

13
Goal #2 - Dashboard

14
Goal # 3 – Increase staff productivity by 30 %
• What measurements do we need to collect /available (raw data)?
• Data Source (Possible Data Measurements) • User Completed Filings • Agency Completed Filings (Average)
• Frequency • Daily, Monthly, Annual
• Chart • What chart best describes the progress towards the goal?

15
Goal #3 - Scorecard
Goal 1 Goal 2 Goal 3
Example Increase staff productivity by 30 % (Velocity)
Data Source User Completed Filings vs Agency Completed Filings (Average)
Frequency Monthly
Chart Line Graph

16
Goal #3 - Dashboard

17
Key Benefits
17
Agency Goals Defined/Organizational Objectives
Improve Staff Efficiencies
Reduce Workflow Bottlenecks
Real-time Activity Monitoring-Intranet Dashboard
Measurable Results

18
Case Study – Tennessee Secretary of State
• 2015 Workload Statistics
• Annual Report Volume
• Web Filed Top 8
• Sessions by Device Category
• Sessions by Country
• Page Views
• Sessions by Browser

19
Case Study – 2015 Workload Statistics
9.4%
32.3%
7.5%
21.7%
32.4%
55.5%
25.8%
30.0%
4.9%
4.5%
25.6% 64.8% 17.0%
87.6%
78.3%
63.1%
18.9% 20.7%
0%
10%
20%
30%
40%
50%
60%
70%
80%
90%
100%
1 2 3 4 5 6
Business Services Workload Filing Statistics
Series1 Series2 Series3 Series4

20
Case Study – Annual Report Volume
0
50,000
100,000
150,000
200,000
250,000
2009 2010 2011 2012 2013 2014 2015 2016
Annual Reports Filed by Year
Paper Filed Web Prepared Web Filed Total

21
Case Study – Web Filed Top 7 (Q4-2015) Document / Filing Type Count
Annual Report - Limited Liability Company 58,665
Annual Report - For-profit Corporation 53,600
Annual Report - Nonprofit Corporation 22,732
Certificate of Existence/Authorization 18,097
Motor Vehicle Temporary Lien Application 16,910
UCC Financing Statement (UCC1) 15,431
New Business Filing - Limited Liability Company 13,295

22
Case Study – Sessions by Country (Q4-2015) Country Sessions
United States 437,770
India 9,889
Philippines 7,193
United Kingdom 2,951
Canada 1,103
Germany 979
(Not Set in Browser) 844
Netherlands 563
Hong Kong 281
Australia 210

23
Case Study – Page Views – Top 8 (Q4-2015) Page Views
Business Entity Search 1,341,725
UCC Search 106,676
Business Services Home 58,261
Name Availability Search 56,156
Worker’s Comp Exemption Registry Search 48,775
UCC Home 28,652
New Business Registration Instruction 27,131
New Business Registration Start 25,859

24
Case Study – Sessions by Device Category
[CATEGORY NAME]
[PERCENTAGE]
[CATEGORY NAME] [PERCENTAGE]
Tablet 2%
Sessions by Device
Desktop
Mobile
Tablet

25
Case Study – Sessions by Browser
Internet Explorer 55%
Chrome 30%
Firefox 8%
Safari 6%
Edge 1%
Internet Explorer
Chrome
Firefox
Safari
Edge

26
A ge n c y S ta f f B u y - i n D ef i n e , A rc h i tec t , a n d I mp l ement K PI / M et r i c s C on s i d e rat i on s C ont i n u a l P roc e s s I mp rove me nt
26
Wrap-up

27
Questions & Answers
27

28
Additional Possible Performance Indicators • Backlog
• Unprocessed Images • Number of items in work queue by category
• User Statistics • Velocity
• Number of Filing processed by day / hour • Number of Filings by document type • Processing time (Start to Finish)
• Accuracy Percent • Number of Filings – Voids / Number Filings
• Economic data • Trending – new filings by filing type over time • Which months are hot months for new business registrations? • Pull data by county/city, which ones have growth