kpis and dashboards q&a
TRANSCRIPT

KPIs and Dashboards Q&A
I have more than 100 KPIs, so why am I only seeing 100 on the KPIs page?
First, check the “Rows to return” drop-down menu that’s available if you expand your filters for the KPIs:
You can select up to 1000 KPIs here. And if you don’t want 1000 in your list, or have more than that, you can add some other filters to cut down your list and ensure you see the ones you want.
For those of you on version 2.9, there is no drop-down menu, so we are limited to be able to view 100 KPIs, unless we can add additional filters to see the ones that we need. We can filter by Category, Type, Goal Status, Site, and As of date. The “Rows to return” field was added in version 2.91.
It is worth noting that even though more than 100 KPIs may not show up on the list here, we can see and organize ALL KPIs in the KPI Dashboard, regardless of how many there are.
There was an issue with the Windows Sidebar Gadget (Start Page > Utilities > Gadgets) and Mobilize functionality, where we could only see 100 KPIs and there were no scrolling or filter options, but this issue was resolved for version 3.0. We have to edit the “appsettings” section web.config file for the database to add the following entry, which will increase the number of KPIs we can see there:
<add key="KPIMaxRecordsDefault" value="1000" />
Is data used in KPIs permissioned by site security and system roles assigned to the KPI user? Say for example, in our context, we have restricted certain details of constituent to Service team to fundraisers team but if we build a KPI based on service team data and add to fundraiser side, would it work same for both teams?
KPIs are permissioned in your system roles as unique features. So, when we grant rights to a KPI instance in your system roles, on the KPIs tab, users will be able to see that KPI regardless of whether

they have access to the information that builds the KPI data. For example, a user may not have rights to view any constituent or revenue information in the database (primarily assigned on the Features tab), but if they have rights to a revenue KPI, they will be able to see that information. This can be really helpful for users who only need a high-level overview of activity in the database, or who only need “view-only” access.
Currently, only *some* KPIs can be site secured. Here’s a list:
Total Raised Towards a Designation Goal (in Fundraising > Goals node)Total Raised Towards a Fundraising Purpose Goal (in Fundraising > Goals node)Revenue Growth (in Fundraising node)Total Revenue Count for a Designation (in Fundraising node)Total Revenue Count for a Fundraising Purpose (in Fundraising node)Total Revenue Count for an Appeal (in Fundraising node)Total Revenue for a Designation (in Fundraising node)Total Revenue for a Fundraising Purpose (in Fundraising node)Total Revenue for an Appeal (in Fundraising node)
Percentage of Revenue Money Total (in Revenue node)Percentage of Revenue Money Count (in Revenue node)Total Revenue Record Count in Selection (in Revenue node)Total Revenue Record Money in Selection (in Revenue node)
These KPIs all have a tab called “Site Filtering” that allows you to select which sites’ users should be able to see the KPI:
How can we roll out a set of dashboards to a group of users?
It depends on the type of dashboard.

For KPI Dashboards:
In order for users to be able to see the KPI Dashboards at all, they’ll need to have rights granted to the following:
“KPI Dashboards” task on the Tasks tab of the system role “KPI Goal Summary” and “KPI Goal Instance Trend” features on the Features tab of the system
role
While we cannot configure permissions that are specific to the KPI dashboard, we can decide which user roles should see which KPIs when we create the KPIs themselves. You’ll see that on the KPIs screen, there is an “Assign permissions” button which you can click for any KPI, and you’ll be able to check off the system roles that you want to grant rights to access that KPI. You can also assign rights to KPIs on the KPIs tab of your system roles.
Once you grant a role these rights, each user will be able to go to his/her KPI dashboard, click “Customize dasboard,” and organize the KPIs that they have rights to in any combination of tabs and pages that they want. By default, when they first go to their KPI Dashboard, each user will see all of their assigned KPIs on one page.
So, in summary, the way that we would create and then roll out a set of KPI dashboards to users is to create the KPIs and the KPI dashboard, and create a role that grants rights to all of those things, and THEN assign that role to the appropriate users when it is all ready.
For Web Dashboards:
There appear to be some issues with security and web dashboards that I am working out with Product Development. I will update the blog and forum when I have detailed information on how to handle this.
Also is there a way we can figure out who is using our existing KPIs, we have created quite a few over the time, but we don’t know its current usage?
Currently, the only auditing available in CRM is for Inserts, Edits, and Deletes. We don’t have anything right now for pages views, unfortunately. For those of you who have done much auditing, you know that even just tracking the actions performed on records can take up massive amounts of space in your database. Based on that I would guess that auditing page views is a ways off for us, but if it’s something that you’d like to have considered for the future, feel free to share it in the IdeaBank (http://bbecfeedback.uservoice.com)!
Where are archived values (for KPIs) stored?
They are stored in the SQL table KPIINSTACEHISTORY. Each KPI instance is assigned its own unique ID number, and every time a KPI instance is updated a row is added to that table and associated with that unique ID.
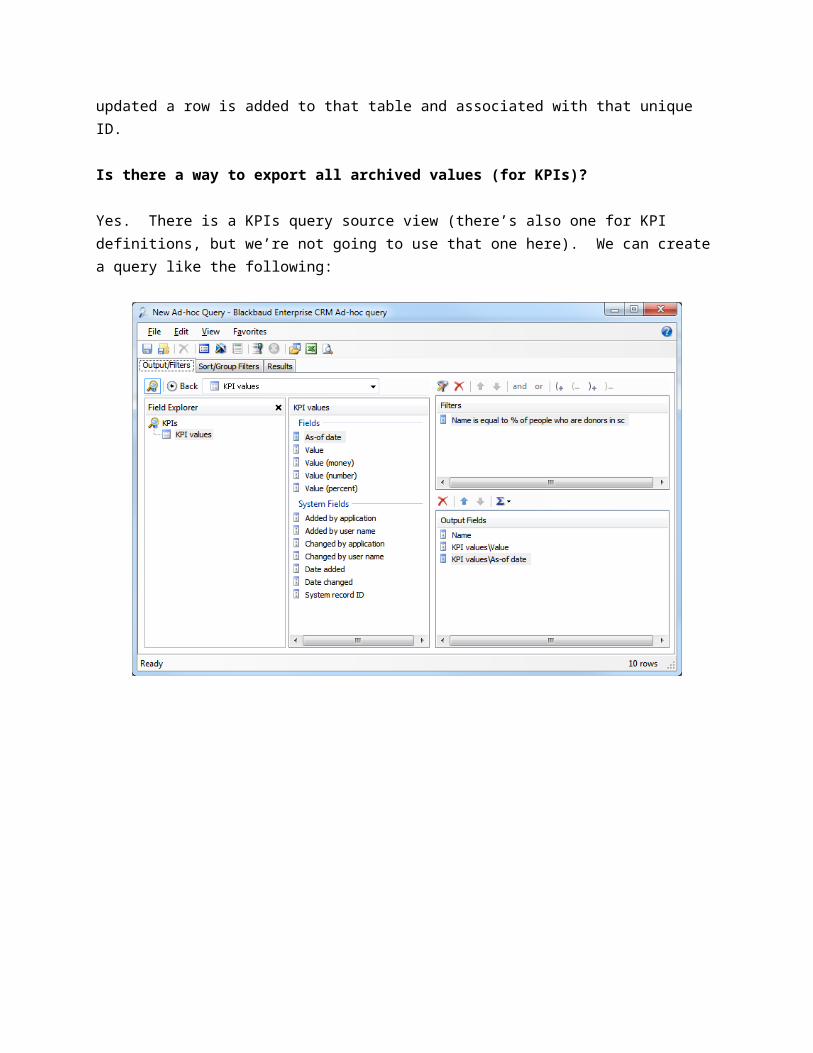
Is there a way to export all archived values (for KPIs)?
Yes. There is a KPIs query source view (there’s also one for KPI definitions, but we’re not going to use that one here). We can create a query like the following:
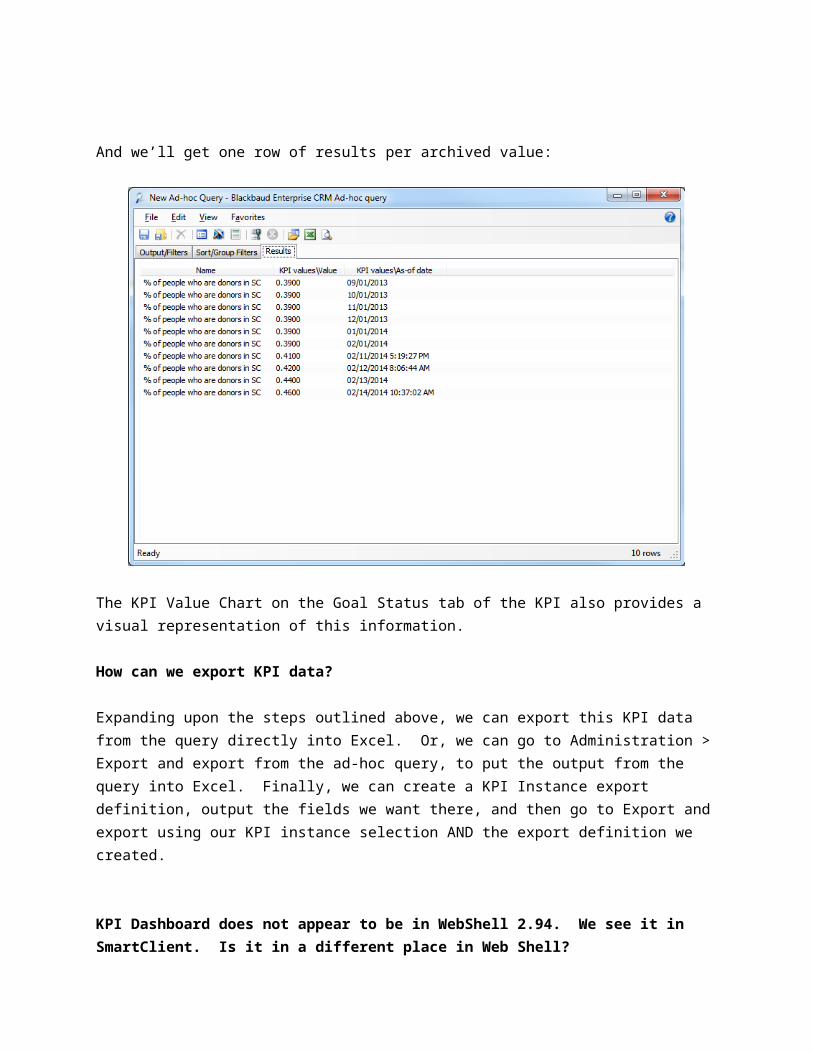
And we’ll get one row of results per archived value:
The KPI Value Chart on the Goal Status tab of the KPI also provides a visual representation of this information.
How can we export KPI data?
Expanding upon the steps outlined above, we can export this KPI data from the query directly into Excel. Or, we can go to Administration > Export and export from the ad-hoc query, to put the output from the query into Excel. Finally, we can create a KPI Instance export definition, output the fields we want there, and then go to Export and export using our KPI instance selection AND the export definition we created.
KPI Dashboard does not appear to be in WebShell 2.94. We see it in SmartClient. Is it in a different place in Web Shell?
This was a low priority bug for Web Shell in 2.93 and 2.94, and as such it was fixed for version 3.0 and will not be patched back, unfortunately. We can access the KPI Dashboard in Web Shell by searching in the features search at the top of the browser. And while we cannot edit the KPI Dashboard from web shell in these versions, we can edit it in Smart Client and view those updates in Web Shell.
Can we view Dashboards from a smart phone?
The KPI Dashboards are accessible via Mobilize functionality. If you go to your CRM Start Page and click the Mobilize tile, you’ll be able to get the link for KPI dashboards.
For Web Dashboards, if you are on version 2.93 or higher and can use Web Shell, you’ll be able to log in and see your entire database as you would from a desktop browser – including your Web Dashboards.
Is there a way to set up KPIs on Productivity? Ex: Gifts processed, records added or edited, deceased constituent processing, records merged, attributes added, etc.
My department is responsible for getting gift and bio info into BBEC. Upper management has requested that we develop KPIs for the work we do—but I don’t see a way to track productivity. The things that you showed yesterday were mostly focused on prospects and dollars raised. But in order to show those numbers, the work that the people in my department do is also necessary. Is there a way to track KPIs for the ‘behind the scenes’ work? We struggle with this because it is transactional and doesn’t easily translate to quality or value—but important none-the-less. Examples that we’ve kicked around are: number of gifts/batches entered by processor, number of records deceased, number of biographical updates such as address, phone, email additions or updates, number of duplicate records merged, etc. If nothing else, at least these show volume and productivity.
Are you aware of ways to track the work being done in BBEC and not just about the dollars raised?
First, the most straightforward KPI that we have that will be helpful is the Batch Statistics KPI. This KPI allows us to select a user, a batch type, and a batch transaction (add, commit, etc.) and keep track of how many times the user has performed that action. It is somewhat limited, because we have to select a user (can’t do a group of users), and only one transaction type and batch type. However, we have the option to set goals, and more importantly, milestones. So we can say that we would expect our data entry people to commit a certain number of Enhanced Revenue Batches each month/week etc., for example.
Outside of that, we’ll have to get a bit creative.
We have KPIs for things like “Total Revenue Record Money/Count in Selection” and “Total Constituents in Selection.” That selection can be anything we want – including, in this case, a filter for “Added by user.”
Let’s take a look at an example for each of those two options, starting with the KPI option:
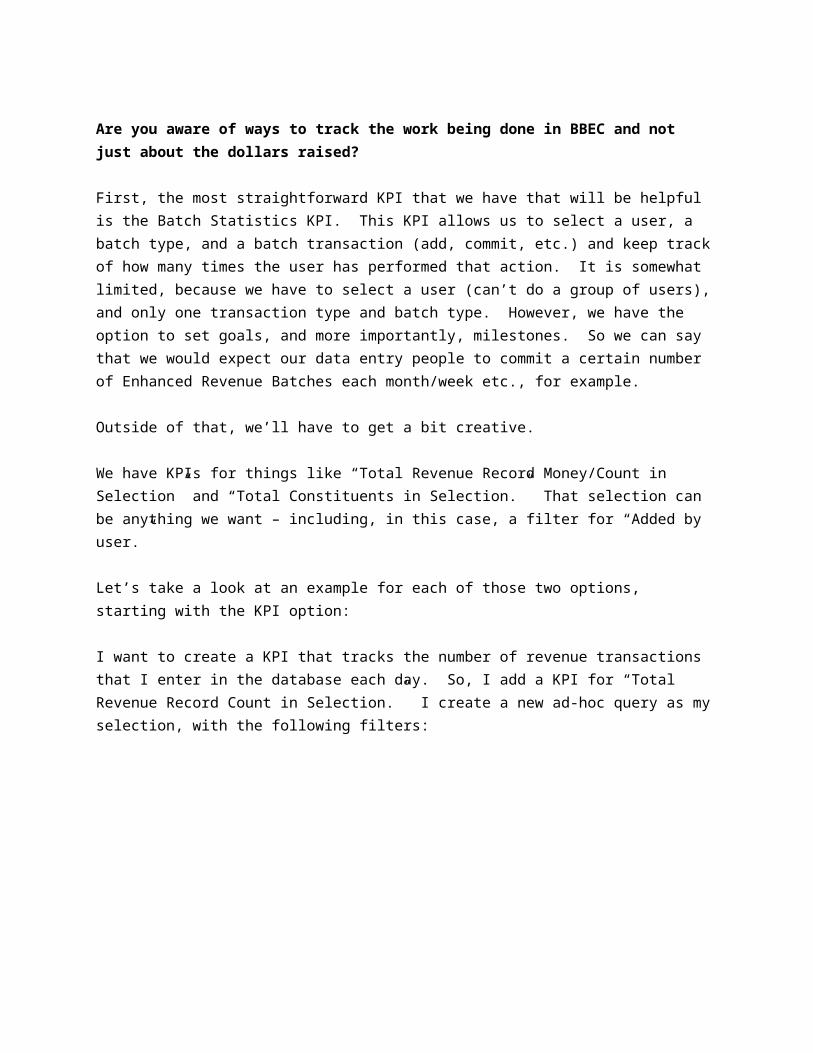
I want to create a KPI that tracks the number of revenue transactions that I enter in the database each day. So, I add a KPI for “Total Revenue Record Count in Selection.” I create a new ad-hoc query as my selection, with the following filters:
Depending on what the goal is (daily/weekly/monthly/etc.) you can set your goal to be that value. So even if I’m going to be running this KPI all year, if I have to enter 5 gifts per day, that would be my goal value. That way, I’ll see whether or not I reached my goal for that period each time the KPI is updated. If your goal is a longer time period, such as a monthly data entry goal, you could set up milestones along the way (it probably wouldn’t be necessary for a daily goal, since you’re likely not going to be updating your KPIs multiple times a day!).
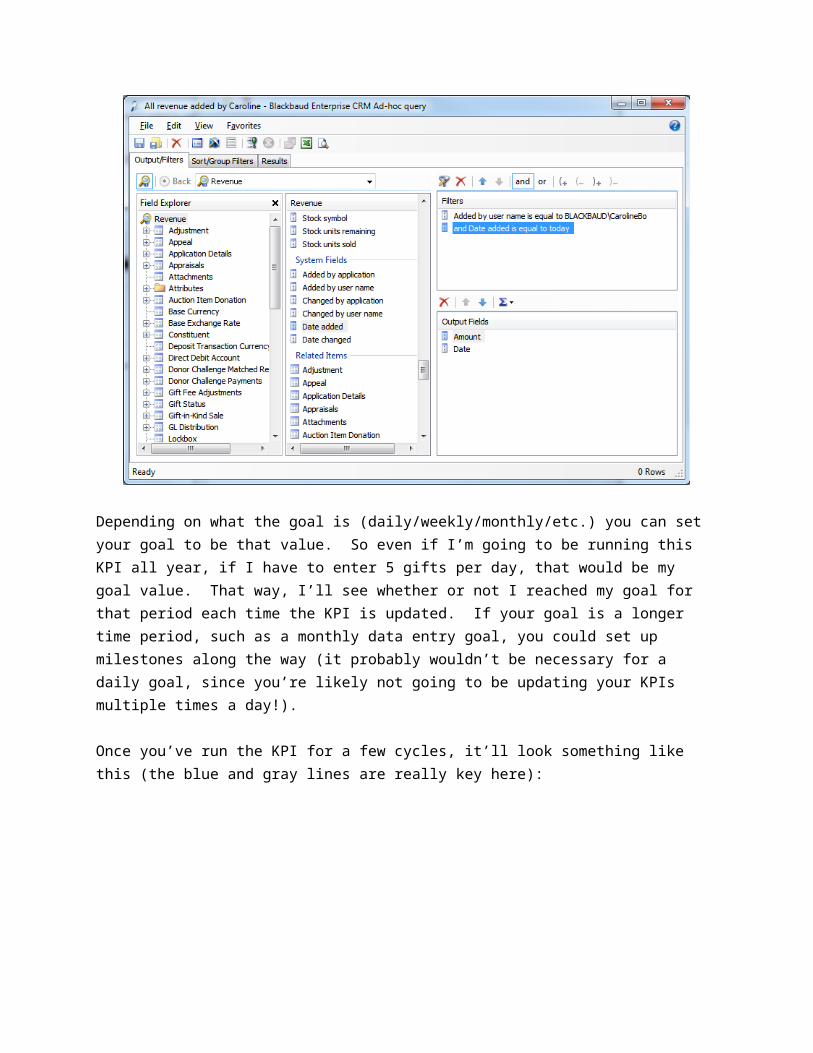
Once you’ve run the KPI for a few cycles, it’ll look something like this (the blue and gray lines are really key here):
If you want to go even further, you can put this into a KPI Dashboard, or a Web Dashboard. For a Web Dashboard, remember what we saw on slide 18 of the webinar: you need a KPI Data Provider + A way to view the data (a KPI Chart would probably be great in this case) + an optional KPI Date Range (if you want to be able to change your viewable time frame.
Some things to be consider:
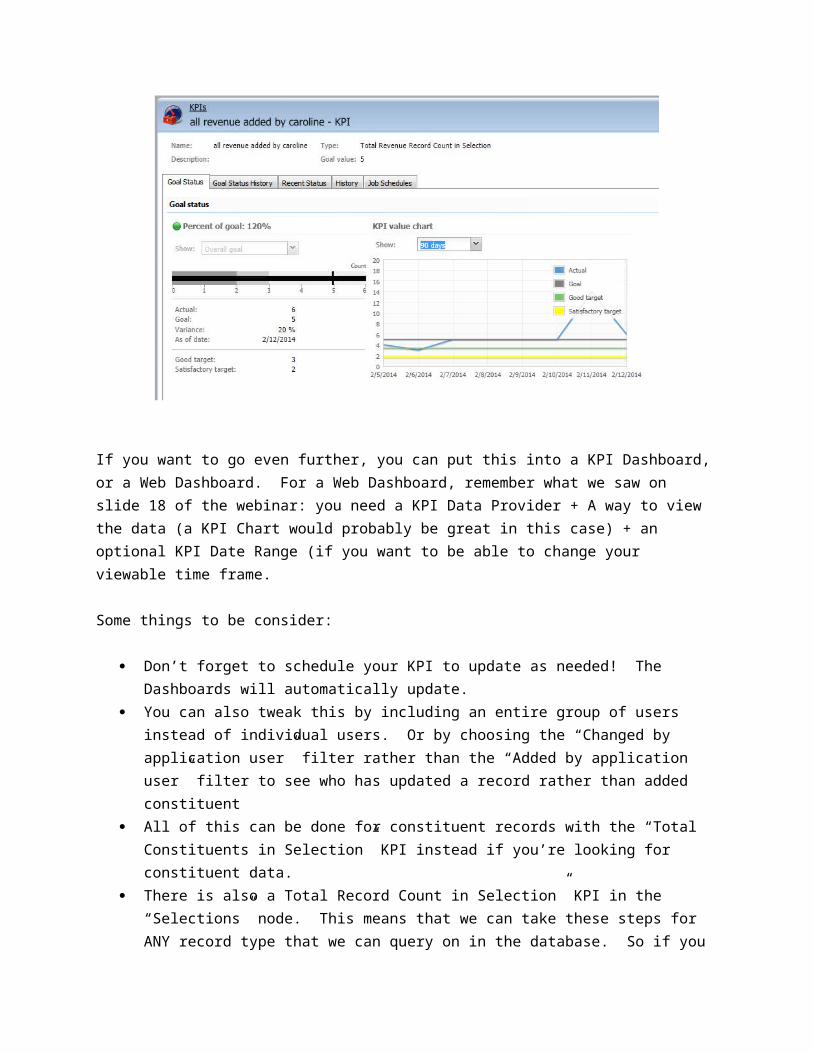
Don’t forget to schedule your KPI to update as needed! The Dashboards will automatically update.
You can also tweak this by including an entire group of users instead of individual users. Or by choosing the “Changed by application user” filter rather than the “Added by application user” filter to see who has updated a record rather than added constituent
All of this can be done for constituent records with the “Total Constituents in Selection” KPI instead if you’re looking for constituent data.
There is also a Total Record Count in Selection” KPI in the “Selections” node. This means that we can take these steps for ANY record type that we can query on in the database. So if you want to count Deposits added or changed, prospect plans added or changed, volunteers added or changed, you can do all of that.
o The only limitation is that we’re counting the number of that type of record in the selection, so we can’t do the number of phone numbers or email addresses changed – those aren’t record types with their own query source view.
o You can, however, query on the number of constituent records whose phone numbers or email addresses have been edited or added by a user.
Pretty powerful stuff!
Finally, I just attended a roadmap meeting for CRM Version 4.0, which is coming out in Q4 of 2014. The exciting and timely news that I heard was that we are adding functionality to the Analysis area to track user activity specifically. There are plans to add an ad-hoc query view that’s called Application User Activity. We’re planning to have functionality that shows Recent Activity, Most Active Users, Activity by Role, as well as specific timestamps and durations. Of course, until the release is finalized I can’t make any promises 100%, but we’re aware that there is a huge need to be able to track productivity, and are making an effort to develop functionality that will make it easier to do so – soon!
Can you edit an existing KPI to give it another name?
Yes! If we open the KPI instance and go to File > Properties, the Options tab has an editable title field. We can change the name (and add a description) here.
Do you need to link Yahoo Widgets with a yahoo account?
No – you can download the application from this link: http://www.filehippo.com/download_yahoo_widget/ and run it without a Yahoo account.
Can we use a KPI Chart to show a year over year graph of a donor’s giving?
There isn’t a quick and easy answer here, but there are some options. We can’t set up KPIs to start over each year. So if you wanted to show a year over year change, you’d have to set up one KPI per year to show the total for that constituent – and you’d have to do different ones for each constituent, because we can’t change the constituent on a KPI and have it automatically update all of the history of the KPI. So, you could potentially create constituent-specific KPIs for each time frame you wanted to compare. This would probably only be realistic for major donors that you wanted to track carefully.
However, we can do some things in Web Dashboard with Data Lists that will get you close (and we’ll be able to change the constituent context to see the data for any constituent in the database). Basically, we’ll create a data list to display the total revenue for each year you’ll want to compare. We can then link them all up to a constituent record context and change them all at once to show the values for the selected constituent in the dashboard. Here’s how:
1. We’re going to create a custom data list from a constituent ad-hoc query. The only filter you need is the revenue date range that you want as your first comparison year. Required output fields will be “Constituent record” and “SUM(Revenue\Amount)” and probably the name of the constituent (although that’s not 100% necessary). Include any other information about that constituent in the output that you’d like to see in your Dashboard:
2. Save the data list with your Context Record ID Field specified as the constituent record, and the Context Record Type as Constituent. I chose to hide that field though, because I don’t want to see that GUID value in the dashboard. Doing all of this will mean that when we set up our dashboard with a constituent context record type, we’ll be able to match this data list up, and then switch to any constituent record we want in our context record search field.
3. Repeat these two steps for all other date ranges you want to compare.
4. Go to your Web Dashboard and create a page for your YOY comparison. Choose a context record type of constituent for the page, and choose which constituent search list you want to use to identify your constituents.
5. Go into edit mode so you can add your data list parts.
6. Add a data list part, and select your first year that you want to compare. You may want to expand the “Appearance” section so that you can name your parts with the appropriate year. Repeat this for each year you want to compare.
a. Note: If you prefer the visual, you can choose to use a data list ticker for each year instead. Here are the fields you’ll specify:

7. Still in Edit mode, use the blue and yellow flashing lights to connect each data list part to the context record. Then exit edit mode.
Here’s what the final page could look like. Note that I used the data list parts on the left, and the data list tickers on the right (the same data in both, so you can see how they look). I also went ahead and added a constituent contact information part at the top so we have that person’s information easily accessible.

Is there a way to see the SQL behind the KPI calculation?
Yes – we can do this two ways. First, in the front end of CRM, if we go to Administration > Application > Features, you’ll see a KPI search task. From here, you can search for the KPI you want to see. On that KPI record, there is a View XML button in the Tasks pane. In the XML, the SQL for the KPI calculation is in the <CreateProcedureSql> section.
In SQL Server Management Studio, we can also locate the stored procedure for any given KPI. From your Database, expand the Programmability node. Then right-click on the Stored Procedures and filter by Names that contain USP_KPI. Then, expand the Stored Procedures, and you’ll see all of the procedures for each KPI in the database. If you double click on any one of them, it’ll pull up the SQL for the KPI so you can see how it’s calculated.
Is it possible to surface custom reports to the dashboard?
Yes. The simplest way to do this is going to be for those organizations that are using Web Shell. Here are the steps we need to take:
1. Browse to the link for the report that we want to display, custom or not, and copy that link. 2. In your dashboard, add a new dashboard part with a type of Link Builder (it’s an Embedded web
content part). 3. Give the link a name in the Link text, mark the checkbox to “Open link in new window” and
paste your URL into the URL template field. 4. Click Ok. Exit Edit mode for the dashboard page. You’ll see the name of the link in blue, and
when you click on it it’ll take you directly to that report.