korsbaek & madsen 2007
TRANSCRIPT

Master’s Thesis M.Sc. in Finance and Strategic Management Dept. of Finance Copenhagen Business School 2007 Advisor: Henrik Sornn-Friese Associate Professor Dept. of Industrial Economics and Strategy Author: Søren Korsbæk 231080-1863 Henrik Madsen 090480-2743 January 17th, 2007
The Mechatronics Cluster in Southern Jutland
- An application of social network analysis and cluster theory
The Mechatronics Cluster in Southern Jutland - An application of social netw
ork analysis and cluster theory

Abstract
The objective of this paper is to identify the strategic challenges and opportunities within the mechatronics cluster. This allows us to develop practical and deliverable cluster initiatives. Our emphasis differs from much of the previous work on clusters as we combine the theoretical insights from cluster theory with the methodology from social network analysis. Thereby we construct an operational typology of clusters where we emphasize how relations create benefits for cluster members. Based on this we carry out a firm-level analysis of the cluster in which we identify structural patterns and subgroups within the cluster based on actors’ attributes.

Acknowledgements
To begin with, we would like to express our gratitude to Jørgen Mads Clausen, Hans Martens and Hans Henrik Fischer for initially allowing us ‘inside’ the mechatronics cluster. In addition, through personal interviews and correspondence; Hans Martens, Søren Sloth Møller, Hans Henrik Fischer and Sune Søndergaard have been very helpful by allowing us access to prior studies, and in discussing the current state of the cluster and their vision for it. This thesis must also be attributed to the many participants in our empirical study, who have given us invaluable insights into the complexity and dynamics of the mechatronics cluster (in alphabetical order); Clas Nysted Andersen (Managing Director of Nielsen & Nielsen Holding), Steen Askholm (Head of Finance at PCS-gruppen), Bo Balstrup (CEO of Center for Software og Innovation), Erling Bjærre (Head of Development at OJ Electronics), Hans Peter Boisen (Director Business Development at Danfoss Drives), Jan Christensen (Coordinator of Health Care Innovation), Søren Eckhoff (Project manager at COWI), Christen Espersen (President of Minibooster Hydraulics), Michael Hansen (Owner and manager of IO-Connect), Egon Borgkvist Jensen (Vice President & COO of Linak), Poul Jessen (CEO of PAJ Systemteknik), Ulrik Jensen (Investment manager at Syddansk Venture), Frank Kirchheiner (Owner and manager of Kirchheiner El-Teknik, Tønder), Lars Bo Kjøng-Rasmussen (Head of Development at Focon Electronic Systems), John Klindt (CEO of Micotron), Brian Kristiansen (CEO of Lodam Automation), Erik Krogh-Rasmussen (Managing director of Danlamp), Per Lachenmeier (CEO of Lachenmeier), Hans Martens (CEO of Center for Erhvervsudvikling, Sønderborg), Bjørn Peters (CEO of SKAKO), Amy Petersen (P.A. to the management at Danimex Communication), Henrik Petersen (CEO of Alsmatik), Peter Petersen (CEO of Delfi Electronics), Karsten Ries (Project manager and co-owner of Powerlynx), Jesper Schack (CEO of Telebilling), Claus Schmidt (Project manager at UdviklingsRåd Sønderjylland), Henning Schmidt-Petersen (CEO of Servodan), Kristian Strand (CEO of Lodam Electronics), Michael Lundgaard Thomsen (CEO of Siemens Flow Instruments), Flemming Toft (CEO of Scientific-Atlanta Denmark), Søren Vilby (CEO of Senmatic), Hans Ørum (CEO of Høier og Vendelbo). Finally, we wish to express our gratitude to our advisor Henrik Sornn-Friese for his guidance throughout the process of writing the thesis. We thank him for the many helpful references and suggestions on the direction and focus of the thesis; for his meticulous review of our work; and for the many rewarding discussions.

Table of contents
1 Introduction ....................................................................................................... 1 1.1 Motivation........................................................................................................................1 1.2 Problem statement............................................................................................................2 1.3 Delimitation .....................................................................................................................3 1.4 Methodology....................................................................................................................5
1.4.1 Nature of the study...................................................................................................5 1.4.2 Structure...................................................................................................................8
2 Theoretical framework ..................................................................................... 9
2.1 Introduction to clusters and how they work.....................................................................9 2.1.1 Concentration of interdependent firms ..................................................................10 2.1.2 Institutions .............................................................................................................12 2.1.3 Relations and benefits from industrial clustering ..................................................12
2.2 Cluster typology.............................................................................................................20 2.2.1 Relations ................................................................................................................20 2.2.2 Composition of actors ............................................................................................21 2.2.3 Cluster development over time ..............................................................................27
2.3 Cluster initiatives ...........................................................................................................30 2.3.1 What is the purpose of CI? ....................................................................................30 2.3.2 How should CI be carried out and who should do it?............................................32
3 Methods of empirical investigation of clusters............................................. 33
3.1 Quantitative Techniques ................................................................................................34 3.2 Qualitative Techniques ..................................................................................................35 3.3 Social Network Analysis ...............................................................................................36
3.3.1 SNA as a methodology ..........................................................................................37 3.3.2 The impact of SNA on our empirical investigation...............................................44
4 Introduction to the mechatronics cluster...................................................... 47
4.1 Prior studies ...................................................................................................................47 4.2 Our study........................................................................................................................49
4.2.1 The focus of our empirical investigation ...............................................................49 4.2.2 The scope of the cluster studied.............................................................................49 4.2.3 Sampling ................................................................................................................52 4.2.4 The empirical data .................................................................................................52 4.2.5 Outline of the empirical analysis ...........................................................................55
5 The importance of the cluster in a larger context........................................ 56
5.1 Customers ......................................................................................................................56 5.2 Suppliers ........................................................................................................................57 5.3 Competitors....................................................................................................................58 5.4 Cooperation....................................................................................................................59 5.5 Conclusion on the importance of the cluster in a larger context ...................................61

6 The composition of actors in the core of the cluster .................................... 63
6.1 The cluster as a social network ......................................................................................63 6.1.1 Data on organizational ties ....................................................................................63 6.1.2 Data on personal ties..............................................................................................64 6.1.3 The aggregated network of formal and informal ties ............................................66
6.2 Knowledge of organizations ..........................................................................................68 6.3 Technological scope of the cluster.................................................................................71 6.4 Geographical scope of the cluster ..................................................................................78 6.5 Cluster growth................................................................................................................81 6.6 The labor pool in the cluster ..........................................................................................84 6.7 Conclusion on the composition of actors in the cluster .................................................85
7 The network positions of cluster members................................................... 87
7.1 The strength of strong ties .............................................................................................87 7.2 Contact between organizations ......................................................................................88
7.2.1 The purpose and strength of the organizational ties in the cluster.........................89 7.2.2 Visualization ..........................................................................................................91 7.2.3 Structural properties...............................................................................................92 7.2.4 Interpretation of structural properties based on attribute data ...............................97 7.2.5 Summary of findings ...........................................................................................101
7.3 Contact between individuals ........................................................................................103 7.3.1 The distribution and strength of the personal ties in the cluster ..........................103 7.3.2 Visualization ........................................................................................................104 7.3.3 Structural properties.............................................................................................105 7.3.4 Interpretation of structural properties based on attribute data .............................107 7.3.5 Summary of findings ...........................................................................................107
7.4 The aggregate network of formal and informal ties revisited......................................108 8 Cluster initiatives .......................................................................................... 111
8.1 SWOT analysis ............................................................................................................111 8.2 Cluster initiatives .........................................................................................................113
9 Retrospect and Prospects ............................................................................. 119 10 References ..........................................................................................................ii
10.1 Primary sources................................................................................................................ii 10.2 Secondary sources............................................................................................................ii
1 Introduction
1.1 Motivation
The aim of the thesis was chosen together with members of the ‘mechatronics workgroup’. This
is a group of mechatronics firms and support organizations that meet regularly to discuss cluster

0
1 Introduction .........................................................................................................................................................................................................................................1 1.1 Motivation..............................................................................................................................................................................................................................1 1.2 Problem statement .................................................................................................................................................................................................................2 1.3 Delimitation ...........................................................................................................................................................................................................................3 1.4 Methodology..........................................................................................................................................................................................................................5
1.4.1 Nature of the study...................................................................................................................................................................................................5 1.4.2 Structure...................................................................................................................................................................................................................8
2 Theoretical framework ........................................................................................................................................................................................................................9 2.1 Introduction to clusters and how they work ..........................................................................................................................................................................9
2.1.1 Concentration of interdependent firms ..................................................................................................................................................................10 2.1.2 Institutions..............................................................................................................................................................................................................12 2.1.3 Relations and benefits from industrial clustering ..................................................................................................................................................12
2.2 Cluster typology...................................................................................................................................................................................................................20 2.2.1 Relations ................................................................................................................................................................................................................20 2.2.2 Composition of actors ............................................................................................................................................................................................21 2.2.3 Cluster development over time ..............................................................................................................................................................................27
2.3 Cluster initiatives .................................................................................................................................................................................................................30 2.3.1 What is the purpose of CI? ....................................................................................................................................................................................30 2.3.2 How should CI be carried out and who should do it? ...........................................................................................................................................32
3 Methods of empirical investigation of clusters .................................................................................................................................................................................33 3.1 Quantitative Techniques ......................................................................................................................................................................................................34 3.2 Qualitative Techniques ........................................................................................................................................................................................................35 3.3 Social Network Analysis .....................................................................................................................................................................................................36
3.3.1 SNA as a methodology ..........................................................................................................................................................................................37 3.3.2 The impact of SNA on our empirical investigation...............................................................................................................................................44
4 Introduction to the mechatronics cluster ...........................................................................................................................................................................................47 4.1 Prior studies .........................................................................................................................................................................................................................47 4.2 Our study..............................................................................................................................................................................................................................49
4.2.1 The focus of our empirical investigation ...............................................................................................................................................................49 4.2.2 The scope of the cluster studied.............................................................................................................................................................................49 4.2.3 Sampling ................................................................................................................................................................................................................52 4.2.4 The empirical data..................................................................................................................................................................................................52 4.2.5 Outline of the empirical analysis ...........................................................................................................................................................................55
5 The importance of the cluster in a larger context..............................................................................................................................................................................56 5.1 Customers ............................................................................................................................................................................................................................56 5.2 Suppliers ..............................................................................................................................................................................................................................57 5.3 Competitors..........................................................................................................................................................................................................................58 5.4 Cooperation..........................................................................................................................................................................................................................59 5.5 Conclusion on the importance of the cluster in a larger context .........................................................................................................................................61
6 The composition of actors in the core of the cluster .........................................................................................................................................................................63 6.1 The cluster as a social network............................................................................................................................................................................................63
6.1.1 Data on organizational ties ....................................................................................................................................................................................63 6.1.2 Data on personal ties..............................................................................................................................................................................................64 6.1.3 The aggregated network of formal and informal ties ............................................................................................................................................66
6.2 Knowledge of organizations................................................................................................................................................................................................68 6.3 Technological scope of the cluster ......................................................................................................................................................................................71 6.4 Geographical scope of the cluster........................................................................................................................................................................................78 6.5 Cluster growth .....................................................................................................................................................................................................................81 6.6 The labor pool in the cluster ................................................................................................................................................................................................84 6.7 Conclusion on the composition of actors in the cluster.......................................................................................................................................................85
7 The network positions of cluster members .......................................................................................................................................................................................87 7.1 The strength of strong ties ...................................................................................................................................................................................................87 7.2 Contact between organizations............................................................................................................................................................................................88
7.2.1 The purpose and strength of the organizational ties in the cluster ........................................................................................................................89 7.2.2 Visualization ..........................................................................................................................................................................................................91 7.2.3 Structural properties...............................................................................................................................................................................................92 7.2.4 Interpretation of structural properties based on attribute data...............................................................................................................................97 7.2.5 Summary of findings ...........................................................................................................................................................................................101
7.3 Contact between individuals..............................................................................................................................................................................................103 7.3.1 The distribution and strength of the personal ties in the cluster..........................................................................................................................103 7.3.2 Visualization ........................................................................................................................................................................................................104 7.3.3 Structural properties.............................................................................................................................................................................................105 7.3.4 Interpretation of structural properties based on attribute data.............................................................................................................................107 7.3.5 Summary of findings ...........................................................................................................................................................................................107
7.4 The aggregate network of formal and informal ties revisited ...........................................................................................................................................108 8 Cluster initiatives.............................................................................................................................................................................................................................111
8.1 SWOT analysis ..................................................................................................................................................................................................................111 8.2 Cluster initiatives ...............................................................................................................................................................................................................113
9 Retrospect and Prospects.................................................................................................................................................................................................................119 10 References.................................................................................................................................................................................................................................... ii
10.1 Primary sources .................................................................................................................................................................................................................... ii 10.2 Secondary sources ................................................................................................................................................................................................................ ii

1
1 Introduction The purpose of this chapter is to introduce the reader to the motivations behind this thesis as well
as the structure and methodology applied. Furthermore, we will touch upon considerations with
regards to the nature of the study and its limitations.
1.1 Motivation
The aim of the thesis was chosen together with members of the ‘mechatronics workgroup’. This
is a group of mechatronics1 firms and support organizations that meet regularly to discuss cluster
initiatives (CIs). Their mission statement is; ”…to strengthen the competitiveness and the profile
of the Danish mechatronics cluster by identifying the strategic challenges and opportunities the
cluster is facing and subsequently take action on this background”2. With this in mind, we
investigated the cluster literature and the prior studies of the cluster, and were intrigued by the
opportunity to deliver new and exciting findings on the mechatronics cluster, and to be pioneers
within a new and promising approach of empirical studies of clusters;
Prior studies of the mechatronics cluster have made extensive analysis of the ‘frame conditions’
in Southern Jutland and of the composition of industries in the cluster. There is, however, a lack
of knowledge on the dynamics within the cluster, more specifically, why and how much cluster
members interact with each other. At the same time, a large stream of the cluster literature states
that many of the benefits from clustering are directly or indirectly dependent on the degree of
interaction between cluster members. However with respect to the mechatronics clusters, little
empirical work has been done in this area.
As such, it is our endeavor to attain an in depth understanding of the dynamics within the
mechatronics cluster in Southern Jutland. More specifically, we strive to understand the purpose,
extent and nature of the relationships between the organizations in the cluster and to characterize
the cluster members in terms of their attributes, but also in terms of their position in the cluster.
This will enable us to develop CIs that specifically target the strategic challenges and
opportunities within the cluster.
1 Mechatronics is defined as the synergistic combination of mechanical engineering ("mecha" for mechanisms, i.e., machines that 'move'), electronic engineering ("tronics" for electronics), and software engineering (wikipedia.org). 2 The chairman of the mechatronics workgroup is the director of Center for Erhvervsudvikling (CfE) in Sønderborg. CfE has formulated the above mentioned mission statement for the mechatronics cluster (www.cfe.dk).

2
We believe that our investigation into the strengths and weaknesses of the dynamics within the
mechatronics cluster is of a unique nature due to its great empirical background and the
innovative methodological approach. Consequently, we are hoping that this study will first of all
be of value to the mechatronics cluster in Southern Jutland, but also make a contribution to
academics and especially practitioners within the cluster field in general.
1.2 Problem statement
The aim of this thesis is to derive at practical and deliverable insights that will enable us to get an
overview, especially, of the dynamics inside the mechatronics cluster in Southern Jutland, and on
this background, strategize on CIs that will enable the cluster to move forward from its present
stage. As such, we seek to answer the following problem statement;
“Based on an empirical analysis of the mechatronics cluster we wish to investigate the
composition of actors and their relations in order to construct a strategy that will address the
identified weaknesses and threats and augment any strengths and opportunities”
In carrying out the analysis and arriving at a well documented answer to the problem statement
we seek to answer the following research questions:
1. How important are relations inside the cluster in a larger context?
We seek an understanding of the overall importance of the actors and ties within the
cluster as compared to outside
2. What is the composition of actors in the core of the cluster?
We seek an understanding of the attributes of the cluster members and distinguish
between central and peripheral actors
3. What are the network positions of cluster members?
We seek an understanding of the roles of central cluster members and any structural
patterns within the cluster as defined by cluster members’ formal and informal ties
Finally, based on the mechatronics cluster’s strategic objectives and the understanding of the
cluster, which we will gain through our research questions; we will answer our problem
statement by proposing CIs that can drive the cluster forward.

3
1.3 Delimitation
In this section we discuss the limitations of our research. These limitations are mainly a result of
two factors; the large literature within cluster theory and the nature of our empirical investigation.
Our ambition to analyze the mechatronics clusters by combining cluster theory and social
network analysis causes us to focus more on relations, than what is typical for cluster scholars.
However, our theoretical perspective on clusters is not limited entirely to this focus, as we
recognize that many schools within the cluster literature have compelling insights. We will later
clarify our theoretical perspective on clusters, but here briefly account for some discussions in the
cluster literature, which have not been included due to the focus of this thesis.
First of all, we note that agglomeration theory can be separated into two classes; agglomeration
forces operating at a general level and agglomeration forces at the level of related firms and
industries (Malmberg et al 1996). Since the mechatronics cluster is defined by prior studies as an
agglomeration of related firms and industries we have chosen to focus our theoretical discussion
on this. Consequently, we only implicitly consider the arguments for agglomeration in general to
the extent that the two classes overlap.
Secondly, topics like ‘social capital’, ‘knowledge’, ‘innovation’ and ‘competitive advantage’
are all disciplines in themselves and we could spend significant amounts of time on each;
however, we introduce them only to the extent they function as a prerequisite for understanding
how clusters work. Also, we discuss the theoretical benefits from clustering; however, we do
not discuss how to directly measure these benefits, as this is seen as a next step in relation to our
ambition of exploring the cluster and proposing CIs. The frame conditions of the cluster have
been extensively explored in prior studies and will therefore not play a central role in this thesis.
To the extent that we touch upon frame conditions, we mainly focus on institutions (non-firms)
as their role can be traced through a relations-centered view. Finally, since the mechatronics
cluster is to a large extent privately led and since frame conditions, which are often the aim of
policy intervention, are outside the scope of our thesis, we only to a very limit extent consider
how government and policy making can play a role.
Finally, it should be noted that although our theoretical discussion of clusters focuses heavily on
knowledge flows and how these presumably translate into innovation advantages, we choose not
to look at the internal workings of firms. Although focusing on how firms translate cluster

4
location into competitive advantage is an interesting topic and would make for a likewise
interesting study, it is considered to be too extensive to include in the study at hand.
There are also limitations to our empirical investigation, which are important to note.
First of all, we note that most of our empirical data stems from questionnaires filled out by the
respondents. Two sources of uncertainty derive from this; firstly, we have not had the
opportunity to make follow-up questions on unclear or interesting aspects of the collected data.
As such, information that we have not been able to uncover through our data collection and
which is not readily accessible through secondary sources is outside the scope of our project. The
second source of uncertainty derives from the fact that our empirical investigation is based on
respondents’ answers with regards to qualitative data, such as their knowledge of other
organizations and the frequency of contact with other cluster members. We deal appropriately
with this uncertainty in our analysis, as we recognize that respondents’ answers are dependent on
their subjective realities, and their ability to remember interactions. However, we will not go into
detail with such considerations, as it is beyond our focus on inter-firm relations in clusters.
Secondly, our empirical investigation is limited by the fact that only 32 out of 65 targeted
organizations participated in our study by filling in the questionnaire (see appendix 1.1).
Although this is by far the best participation rate in any study of the mechatronics cluster so far, it
still means that there is some uncertainty with regards to the non-respondents role in the cluster.
We must also note that the exact boundaries of the cluster from a social network perspective
would require a much larger study, primarily in terms of access to potential cluster members.
Although we have valid grounds to state that the boundary specification of the cluster is as found
in our study, which we will explain in more depth later, it cannot be said with certainty.
Finally, we will in accordance with the aim of this paper, concentrate our empirical
investigation, entirely on the mechatronics cluster and especially the relations between
cluster members. Therefore, a comparison of the mechatronics cluster with other similar clusters
is outside the scope of our thesis, although it would be very insightful. Also, we will not verify
the findings of prior studies of the cluster as they have mainly dealt with aspects of the cluster
outside our scope (frame conditions). However, we acknowledge that the validity of these earlier
findings becomes more and more outdated.

5
1.4 Methodology
In this section, we will account for some of the methodological considerations of our study and
present the structure of the thesis. The purpose is to introduce the reader to the basis of our study
and to allow the reader already at this stage to get an overview of the following analysis.
1.4.1 Nature of the study
As noted in the motivation to this study, there is a lack of empirical studies on clusters in general
and on the dynamics within clusters in particular. Although, many renowned scholars adhere to
the view that benefits from clustering are directly or indirectly dependent on the degree of
interaction between cluster members, much of the cluster literature is very theoretical and lacks a
practical and systematic methodology. As a consequence, we have married the theoretical
insights from cluster theory with the methodological approach of social network analysis. This
has proven to be a very powerful combination that has allowed us to arrive at a far more complex
picture of the dynamics within the mechatronics cluster than any of the prior studies.
In this section we will discuss some of the methodological challenges and considerations, which
we have dealt with throughout writing the thesis; we discuss the case study as a research method,
and the extensive empirical data collected and used in the thesis.
With regards to our study as a case study, we note that in cluster studies and especially in
social network analysis, case studies are often used to test the validity of certain arguments or
specific measures for their ability to explain cluster theoretical attributes of a cluster. Our thesis
is markedly different from such theoretical discourses, as the aim is to derive at solutions
specifically for the case studied; the mechatronics cluster. As such, we consider theory and
models from cluster theory and SNA in order to construct a typology of clusters, and then use
this to analyze the case in question. However, the purpose is not to test the constructed typology,
rather it is to develop CIs that can drive the cluster forward. That is, we focus on the first and last
step in the research process proposed by Harald Enderud, 1979 (in Flyvbjerg 1988). For this
reason, we do not formally propose that the insights gained throughout our thesis can be applied
more generally, although, we briefly consider this in our final conclusion. We also note that due
to our primary use of cluster theory as a prerequisite for our empirical investigation, we take on a
pragmatic view of clusters in which focus is on understanding clusters based on different
arguments and perspectives rather than challenging, and discussing their differences.

6
The basis of our thesis is a large empirical investigation based on input from cluster members.
More specifically, our empirical analysis is based on correspondence with people that are seen as
experts on the mechatronics cluster, such as the chairman of the mechatronics workgroup, a
cluster consultant from Center for Erhvervsudvikling (CfE) in Sønderborg, and a few CEOs and
higher level managers for firms in the cluster. However, most of our empirical data stems from
information gathered through a questionnaire sent to relevant organizations in what was
perceived to be the core of the mechatronics cluster (in section 4.2.2 we account for the selection
of organizations that make up the cluster as defined in this study). The questionnaire, which can
be reviewed in appendix 1.4 and 1.5, was developed based on the knowledge of the cluster from
prior studies (chapter 4), and the insights from cluster theory and SNA (chapters 2 and 3). The
main topics covered by the questionnaire were the respondents’ and the firms’ background, the
identification of the firms’ “most important” customers, suppliers, competitors and cooperative
partner, as well as cluster members’ relations with each other. More specifically, the latter part of
the questionnaire consists of a roster list of the 65 organizations in the cluster as defined in our
study and covers questions about the cluster members’ mutual knowledge of each other as well as
their perceived technological distance and any personal and organizational relations that exist
between them. Finally, we have also gathered data on the age, size and industry of the
organizations, their geographical proximity, and their attendance of mechatronics workgroup
meetings. This information is based on own research on the firms and institutions in the cluster as
well as data supplied to us by CfE. Therefore, we have data on all actors with regards to these
properties.
Given that 32 out of 65 targeted organizations in the cluster have participated in our study, we
have achieved the highest participation rate of any study of the mechatronics cluster so far and
have an overwhelming amount of data from CEOs, owners and higher-level managers (see
appendix 1.3). To raise the response rate for our study, we ‘pitched’ our project to all the
organizations by phone before sending out our questionnaire, and also have a much more focused
target group than prior studies. In comparison, COWI’s (2006) study was also based on
questionnaires send to selected organizations, but only had a response rate of 25%. It has required
several months of data analysis to fully comprehend and compress the main insights from all this
data, and as such all cannot be included in this thesis. The reader will note the extensive size of
the exhibits, but also the overwhelming amount of data and analysis, which can be reviewed on
the enclosed CD.

7
Another factor, which works to increase the size of the thesis and the exhibits, is the space
consuming nature of the graphical social network analysis. The most important graphs are
included in the project, but the majority is placed in the exhibits. This is reasonable because
graphical representations of the networks in question are really just ordered representations of
respondents’ answers to different questions3. The graphs summarize many of the cross
tabulations of data, which truly enrich our analysis and findings. Therefore, we take care to
extensively explain what conclusions can be drawn from the graphical analysis, and although we
believe it is interesting and furthers the understanding of the findings, the project can be read
without referring to the exhibits.
Finally, we note that in order to ensure respondents’ confidentiality on certain aspects, which
has been required of us, we will refer to actors using unique numbers based on actors’
classification according to NACE codes (see appendix 1.2). Thereby, we conceal actors’ identity,
but still make it possible to meaningfully refer to organizations (furthermore, we allow ourselves
to refer to non-participants, and participants who have given their consent, by name). We will
later go into the composition of actors according to the different industry groupings (NACE
codes), but here note that NACE code “00” has been established to ensure confidentiality. It
consists of 6 firms; two manufacturers of electrical construction equipment, a telecommunication
company, a venture capital firms, a consulting firm, and a wholesale trader of mechatronics
related equipment. The diversity of this group naturally affects our ability to draw conclusions on
behalf of its constituents firms. Finally, although we use NACE codes to refer to actors and to
some extent analyze properties of actors in each NACE code, we acknowledge that these
groupings can be very broad and for this reason we analyze relations and attributes of actors
irrespective of their NACE codes as well.
3 A network refers to the collection of data on a specific dimension of the cluster, such as the network of personal contact or the network of technological distance between cluster members.

8
1.4.2 Structure
The aim of our thesis is to answer our problem statement and research questions. In large part, we
do this by fully understanding the overall structure and drivers of the mechatronics cluster
together with its mission statement as discussed earlier.
The understanding of the cluster will
come as follows; firstly, we introduce
our theoretical and methodological
perspective on clusters, which
explains our focus when examining
clusters, and how we intend to do this
empirically by developing concrete
tools for analysis (see figure). Next,
we introduce the mechatronics
cluster by briefly presenting the most
important findings from prior studies
of the cluster and then introduce our
own empirical investigation, by
discussing the boundaries of the
cluster and the following structure of
the investigation. Finally, we reach
our own empirical investigation,
which comes in three steps in accordance with our research questions. We will go into more
detail about the three steps and their interrelatedness later, but for now we note that we follow a
logical structure in the sense that each chapter goes deeper and deeper into the complexity of the
cluster. We conclude and summarize our findings in a SWOT analysis and on this background
propose cluster initiatives that can drive the cluster forward. In the final chapter, we very briefly
present an overview of our thesis and discuss the applicability of our study in a larger context.
Finally, we note that the fairly extensive exhibits are structured in accordance with the chapters
in the thesis, so that references within a chapter generally refer to the equivalent chapter in the
appendix.

9
2 Theoretical framework In this chapter, we will construct a framework reflecting our perspective on clusters. This will
give us a theoretically founded basis for structuring our empirical investigation of the
mechatronics cluster, interpreting the results and based on that suggest appropriate CIs. We split
the chapter into three parts; in the first part, we introduce clusters as a concept and argue for our
theoretical perspective on clusters. Next we use this knowledge to construct a typology of
clusters and explain how various types of clusters function. This provides us with a theoretical
framework, which we can use to structure and interpret our findings on the mechatronics cluster.
The final part uncovers questions regarding cluster initiatives (CIs)4, which is a natural extension
of the first two parts, since efficient CIs precondition a thorough understanding of the specific
cluster and its setting.
2.1 Introduction to clusters and how they work
In this section, we discuss our perspective on cluster. A natural starting point is to discuss what
clusters are and how they function. To do this we will introduce the concept of clusters based on
a list of frequently cited definitions, which we break down into their shared components.
There has not yet been put forward an agreed upon definition of what clusters are; Feser (1998)
states “there is no cluster theory per se, rather a broad range of theories and ideas that constitute
the logic of clusters.” Martin and Sunley (2003) support this by noting that clusters are subject to
“definitional and conceptual elasticity.” To understand this critique let us look at a list of
definitions proposed by some of the most renowned cluster scholars (table adapted from Martin
and Sunley (2003));
Porter (2000, p. 16) “A cluster is a geographically proximate group of interconnected companies and associated institutions in a particular field, linked by commonalities and complementarities”.
Porter (1998, p. 10) “A cluster is a critical mass of companies in a particular field in a particular location, whether it is a country, state or region, or even a city. Clusters take varying forms depending on their depth and sophistication, but most include a group of companies, suppliers of specialised inputs, components, machinery, and services, and firms in related industries. Clusters also often include firms in downstream (e.g. channel, customers) industries, producers of complementary products, specialised
4 Cluster initiatives are defined by Sölvell et al (2003) as “…organised efforts to increase growth and competitiveness of clusters within a region, involving cluster firms, government and/or the research community.” Cluster initiatives is broader than cluster policies as the latter includes only measures undertaken by actors in the public sphere (Andersson et al 2004)

10
infrastructure providers and other institutions that provide specialised training, education, information, research, and technical support, such as universities, think tanks, vocational training providers, and standards-setting agencies. Finally many clusters include trade associations and other collective bodies covering cluster members”
Rosenfeld (1997, p. 4) “A cluster is very simply used to represent concentrations of firms that are able to produce synergy because of their geographical proximity and interdependence, even though their scale of employment may not be pronounced or prominent.”
Feser (1998, p. 26) “Economic clusters are not just related and supporting industries and institutions, but rather related and supporting institutions that are more competitive by virtue of their relationships.”
Swann and Prevezer (1998, p. 1) “A cluster means a large group of firms in related industries at a particular location”. Simmie and Sennett (1999a, p. 51) “We define an innovative cluster as a large number of interconnected industrial and/or service companies having a high degree of collaboration, typically through a supply chain, and operating under the same market conditions.”
Roelandt and den Hertag (1999, p.9) “Clusters can be characterised as networks of producers of strongly interdependent firms (including specialised suppliers) linked to each other in a value-adding production chain.”
Van den Berg, Braun and van Winden (2001, p. 187) “The popular term cluster is most closely related to this local or regional dimension of networks … Most definitions share the notion of clusters as localised networks of specialised organisations, whose production processes are closely linked through the exchange of goods, services and/or knowledge.” Enright (1996, p. 191) “A regional cluster is an industrial cluster in which member firms are in close proximity to each other.”
Although the focus and wording of the definitions differ, they tend to share four main
components; (1) concentration of interdependent firms, (2) institutions, (3) relations and (4)
benefits from industrial clustering5. In the following, we will review these four components, and
thus explain our focus area within the large and complex cluster literature.
2.1.1 Concentration of interdependent firms
Industrial clusters evolve around a concentration of interdependent firms. When breaking this
term down, we find that it consists of two elements. One is; concentration of firms, another is;
interdependency between firms.
5 Some of the above definitions also mention the importance of location and market conditions. Such ‘frame conditions’ must to some extent be in place to support the cluster. However, due to the empirical focus of our thesis, we will only touch upon such frame conditions briefly in the following. According to Porter (2000a) factor (or frame) conditions are human-, natural- and capital- resources as well as physical-, technological-, administrative- and information- infrastructure. Therefore, we note that ‘institutions’ are a subset of frame conditions.

11
We note that a concentration of firms conditions a geographically confined area, as well as a
standard to which the observed concentration can be compared. When focusing on concentration
levels, there are mixed opinions of how large the concentration has to be. Some scholars argue
that the minimum concentration depends on the specific case (Ecotec 2004), while others
advocate fixed measures, such as specific minimum values of location quotients (Bergman and
Feser 1998)6. However since location quotients consider only one type of measure (number of
employees) and not others; such as number of firms, collected revenue, or the cluster firms’
global market shares there is a dependence on the empirical method applied. At the same time
young clusters with a large growth potential are very likely not to exhibit a high concentration,
but that is not sufficient grounds for ruling them out. One way of setting a lower concentration
limit would be to make it a function of when a cluster starts producing benefits. If this is the case
the limit comes to depend on the industries involved, the absolute- and relative concentration of
firms, how concentration is measured, as well as a host of other parameters which differ both
from cluster to cluster and from study to study7. Based on this, we believe the concentration limit
to be an empirical question where the answer depends on the specific case.
With regards to the interdependence between firms, we note that interdependence preconditions a
shared denominator among the firms. This shared denominator is related to functional proximity,
i.e. that the firms either cater to the same or similar end-market(s) and/or build upon comparable
competencies. As can be seen from the definitions of clusters on page 9-10, functional proximity
operates on two dimensions. One is the vertical dimension where firms occupying various parts
of the value chain establish interdependency through input-/output relationships. The other is the
horizontal dimension, where firms operating in the same or related markets at similar levels of
the value chain either cooperate or compete on input, output and competencies. The reason why
functional proximity is important will be investigated later. However, we note that by allowing
not only geographical proximity, but also functional proximity, to play a role, we divide
agglomeration theories into two groups; those that deal with agglomeration of economic activity
in general and those that deal with spatial clustering of related firms and industries (Malmberg et
al 1996). The latter is the focus of this thesis.
6 Location quotients compare employment levels in the regional industries in question with corresponding national industry employment levels. They will be discussed in detail in chapter 3. 7 Unfortunately this does not fully consider young clusters with a large growth potential since benefits have not necessarily set in at this early stage

12
2.1.2 Institutions
In addition to interdependent firms, cluster definitions also contain institutions. In some studies
‘institutions’ refer to certain norms and values8, however, in our thesis they refer to the following
non-firm organizations; “…economic agents (e.g., research institutes; universities; primary,
secondary, and higher education; other training institutes; authorities; financial intermediaries
and so on)” (Sornn-Friese 2003). Supporting institutions, such as research institutes and
universities produce knowledge that may be exploited by the firms, and training and educational
institutes provide the firms with a highly skilled labor pool. Furthermore, institutions may work
as intermediaries between firms.
2.1.3 Relations and benefits from industrial clustering
The interdependency between firms in clusters means that there must also be relations or ties
between cluster members, which is the third component in cluster definitions. In the following,
we will briefly introduce the cluster as a social network of relations and the important notion of
social capital. However, since relations produce the majority of benefits from industrial
clustering, we afterwards consider the interplay between these two components in more depth.
The following sub-sections are then divided into two parts in accordance with the nature of
benefits, pecuniary and non-pecuniary benefits.
2.1.3.1 Relations
From the definitions of clusters on page 9-10, we see that especially Rosenfeld, Feser, Simmie
and Sennett as well as Roelandt and den Hertog support a view of clusters as defined by its social
network in that their definitions of clusters entail some notion of relations between cluster
members leading to synergies, competitiveness, or innovativeness.
In a cluster we expect cluster members to be connected through both vertical and cooperative
relations in accordance with the functional proximity between them. In many cases such formal
relations among cluster members over time develop into informal ties (Wolfe and Gertler 2004).
To this end, Gordon and McCann (2005) state that the relations between organizations or
individuals in a cluster rely on; “…a common culture of mutual trust, the development of which
depends largely on a shared history and experience of the decision-making agents”. This culture
8 Such norms and values will be discussed later when discussing relations and social capital in a cluster.

13
of trust is also known as social capital, which Wolfe (2002) refers to as "…various features of the
social organization of a region, such as the presence of shared norms and values that facilitate
coordination and cooperation among individuals, firms, and sectors for their mutual advantage."
More practically social capital works in a cluster because favors are expected to be returned later,
trustworthiness is communicated and tested, past successes of collaboration exist and there is a
real threat of punishment of those who act opportunistically by excluding them from the network
(Sirianni and Friedland 1995).
Finally, since social capital is either attributable to historic or cultural factors in a region's past
(communitarian) or built up through dense networks of interactions of firms engaged in
interrelated activities with a high level of mutual trust (performance-based) it is confined to a
given region (Wolfe 2002, Rawad 2005).
2.1.3.2 Pecuniary benefits
The majority of pecuniary benefits stem from formal trade linkages between actors in various
parts of the value chain. As a consequence most of these linkages are vertical, which produce
benefits in terms of lower transportation- and search costs, a more specialized division of labor,
local outsourcing possibilities and economies of scale.
Proximity between firms located in clusters cause trade between two firms to be subject to lower
transportation costs, especially for distance sensitive goods, such as large and heavy goods
(Johansson 2005). At the same time the high concentration of potential trading partners and the
close geographical proximity lowers search costs, which is important for firms frequently looking
for new suppliers and/or customers (Johansson 2005). In clusters, firms will by focusing on core
competencies often “…gradually move from the horizontal to the vertical dimension of the
cluster by concentrating on some particular process, where they believe they possess or might
develop certain lucrative capabilities, dissimilar to others” (Maskell 2001). Hence, over time
cluster firms typically become more and more specialised causing a deepening division of labor,
which in return leads to improved firm profitability (Bergman and Feser 1999). The
concentration and variety of suppliers that emerges from this movement in return allows for
outsourcing of non-core business to local suppliers which might not only result in increased
profitability, but also increased flexibility with respect to responding to complex and rapidly
changing customer demands (Lublinski 2002). Finally, Krugman (1991) finds that locating close
to a large market might provide firms with a chance to exploit economies of scale.

14
In addition to the above vertical linkages, firms might also obtain pecuniary advantages through
cost sharing. These can be in the form of shared transportation or shared sales and marketing9.
The above pecuniary benefits stem to a large extent from proximity between actors. However in
recent years drivers of globalization, such as; reduced barriers to trade, improved communication,
enhanced and fastened transportation of goods and people, global finance and the widespread
availability and use of technology have all worked to reduce the role of distance (Enright 1998).
As a result the above pecuniary advantages are being challenged. At the same time, given
globalization and the competitive pressures from low cost countries, technologically
sophisticated firms have been forced to compete, not on cost, but on the basis of differentiated
performance and innovation (Sornn-Friese 2003, Feldman and Martin 2004). This limits the
importance of pecuniary benefits and leads us to discuss what many consider the most important
cluster-benefit; knowledge accumulation10.
2.1.3.3 Non-pecuniary benefits
To understand why knowledge accumulation occurs and how it can be valuable to firms locating
in clusters, let us consider how knowledge is produced, applied, and through an understanding of
the nature of knowledge, also how it ‘flows’.
In broad terms, firms tap into two sources of knowledge; one is knowledge originating from
inside the firm, which can stem from R&D or intentional and unintentional upgrading of
processes and knowledge. The other is knowledge originating from outside the firm in the form
of knowledge flows from the firm’s environment (Cohen and Levinthal 1990, Johansson 2005).
Internal knowledge creation has a dual effect. The first and most direct effect is the creation of
knowledge that can be applied in innovations and improvement of processes and day-to-day
routines. The second and more subtle effect of internal knowledge creation is that it raises the
firm’s absorptive capacity, which Cohen and Levinthal (1990) define as “the ability of a firm to
recognize the value of new, external information, assimilate it, and apply it to commercial ends,”
and add that “the ability to evaluate and utilize outside knowledge is largely a function of the
9 If this occurs between functionally proximate firms in similar parts of the value chain, it might be competition distorting behaviour and therefore might conflict with written law (Johansson 2005) 10 There exist different schools of thought in cluster thinking and by viewing knowledge accumulation as the most important benefit from clustering we adhere to the view of mainly “regional innovation systems” and “dynamic externalities schools”. For a brief introduction to the different schools please refer to appendix 2.1.
15
level of prior related knowledge”. Sornn-Friese (2003) states that “…globalization forces firms to
innovate faster and rely still more on outside sources of knowledge”, which means that
absorptive capacity becomes increasingly important. However, absorptive capacity can only be
valuable to firms, if they are exposed to external knowledge in sufficient degree and quality,
which is exactly the case for firms located in clusters. To understand why this is so, we need to
look at the nature of knowledge.
Basically knowledge can be divided into two groups, explicit and tacit. Explicit knowledge can
be articulated, codified and stored and can consequently be communicated over long distances.
Examples hereof are manuals, documents, procedures, etc. Tacit knowledge on the other hand
cannot be codified and can thus only be transmitted via training or gained through personal
experience. A simple example of tacit knowledge is”…that one does not know how to ride a bike
or swim due to reading a textbook, but only through personal experimentation, by observing
others, and/or being guided by an instructor” (wikipedia.org). The immobility of tacit knowledge
makes it very valuable to firms that possess it, as it can be source of sustainable competitive
advantages (Barney 2002).
To understand how knowledge can be beneficial on a cluster scale we remember that social
capital within a dense network of relations in a cluster reduces transactions costs and induces
more frequent knowledge sharing. Comparing this insight to Cohen and Levinthal’s (1990)
finding that knowledge is not subject to complete appropriability, we find that in clusters it is
social capital which allows for the rapid diffusion of knowledge. Due to the high concentration of
functionally proximate firms this diffusion results in a large pool of relevant and novel
knowledge, which is accessible at low costs and can be used by firms for innovation purposes.
Adding to this, we find that untraded interdependencies in the form of "…technology spillovers,
conventions, rules and languages for developing, communicating and interpreting knowledge"
allow for transmittance of tacit knowledge among local actors, which is essentially the most
difficult type of knowledge to transmit and therefore also the most valuable (Storper 1995 in
Rawad 2005).
To understand why knowledge does not flow to actors outside the cluster, we recall that
transmitting tacit knowledge requires face-to-face contact which naturally requires more effort if
actors are positioned far away from each other. At the same time, untraded interdependencies are
lacking in relationships to actors outside the cluster making it hard to transmit tacit knowledge.
16
Finally, since social capital is mainly confined to a given region it does not exist to the same
extent in relationships to actors located outside clusters, which is why these relationships are
more costly and always precondition immediately foreseeable benefits for the parties involved
(Baptista 2000, Bathelt et al 2002, Martin and Sunley)11. In this way cluster members have
proprietary access to novel knowledge that can be used for innovation purposes12.
Now that we have talked about why knowledge flows can occur inside clusters and why they can
be valuable to cluster firms, let us look at how they occur as this allows us to come full circle on
the relations that exist in clusters. In broad terms we can separate knowledge flows into two
separate classes; knowledge spillovers and knowledge transfers. We note that “at every possible
interaction, there is a potential for knowledge exchange. If knowledge is exchanged with the
intended people or organizations, it is knowledge transfer, while any knowledge that is
exchanged outside the intended boundary is spillover” (Fallah and Ibrahim 2004). Firms in a
cluster are in a good position to exchange both types of knowledge flows, while knowledge flows
to/from actors outside the cluster are mainly limited to knowledge transfers due to the lack of
social capital. In the following, we will first explore the two types of knowledge flows as they
occur in cluster, and next discuss knowledge flows to/from actors located outside the cluster.
2.1.3.3.1 Knowledge spillovers (unintended knowledge flows)
Knowledge spillovers occur because “proximity and equal conditions for the firms make
benchmarking easy, at the same time peer pressure based on pride forces companies to perform”
(Porter 2000b). Maskell (2001) complements; “co-localized firms undertaking similar activities
find themselves in a situation where every difference in the solution chosen, however small, can
be observed and compared. While it might be easy for firms to blame the inadequate local factor
market when confronted with the superior performance of competitors located far away, it is less
so when the premium producer lies down the street.” Hence co-localization of like firms displays
the weaknesses of the individual firms. Or in other words, co-localization provides for
observability which refers to the fact that “spatial proximity brings with it the special feature of
11 The regional nature of social capital is reflected in the name, since capital implies that we are dealing with an asset and social tells us that it is attained through membership of a community 12 It can be argued that modern inventions like state-of-the-art communication equipment allow for long-distance communication and that fastened transportation allows for frequent face-to-face contact. However building shared norms, values and beliefs between geographically and culturally distant firms takes long time, possibly limiting the tacit knowledge diffusion process. As we shall see later unintentional flows of tacit knowledge still mainly occur in geographical proximity through shared experience, random observations, comparisons and worker movement.

17
spontaneous automatic observation” and comparability where “each firm in the horizontal
dimension of the cluster is provided with information about the possibilities to improve and the
incentives to do so” (Malmberg and Maskell 2001).
Since observability and comparability work best between similar firms with equal factor
conditions it most frequently occurs between functionally proximate firms and along the
horizontal dimension. Maskell (2001) adds to this that; “if the firms operating along the
horizontal dimension of the cluster were to be spread thinly throughout a large city among many
unrelated businesses their ability to monitor and subsequently learn from each other’s mistakes
and successes would be severely restricted.” This explains why a concentration of interdependent
firms is important for the workings of clusters.
Since firms acquire knowledge by observing and comparing their own solutions to those of their
competitors, most of the knowledge that spills over is tacit. As mentioned earlier, it is believed
that social capital and untraded interdependencies aids knowledge spillovers inside clusters. At
the same time, since knowledge spillovers are unintentional, in the majority of cases they do not
involve formal relations between the firms involved. This makes knowledge spillovers very hard
to identify empirically.
2.1.3.3.2 Knowledge transfers (intended knowledge flows)
Most knowledge-sharing relations inside clusters build on informal relations, mainly based on
personal contacts (Baptista 2000). These can originate from supplier or customer (vertical)
relationships, shared place of work, fellow students as well as other forms of social ties fostered
by the spatial proximity of firms and workers in clusters.
An important type of knowledge transfer is vertical relationships, which mainly occur in clusters
where more parts of the value chain are represented. As noted earlier, over time such formal trade
relations among cluster members in many cases develop into informal ties, where shared culture
and frequent interactions, create a basis for knowledge sharing on both the traded product and
possibly also the production process for the benefit of both (Wolfe and Gertler 2004). Another
possible knowledge transfer can be sourced from local institutions, such as universities, research
centers, etc. (Porter 2000a). In line with Porter (2000a), who argues that cluster firms obtain
value from increasingly specialized factor inputs, Breschi and Lissoni (2000) note that local
universities and research institutions are valuable to cluster firms because “… local universities

18
provide critical inputs for firms’ innovative activities even without producing any research which
is directly relevant for firms’ current innovation projects, namely training and consultancy.”
Intentional cooperation between competitors (horizontal ties) may in some cases violate written
law due to functional proximity (Johansson 2005). However, in broad clusters cooperation can
occur between firms belonging to different, but related industries. Cooperation in these cases
does not hold the same jurisdictional limits and can therefore entail many different types.
Finally, the most important source of knowledge transfers seems to be the movement of the local
work force. Since tacit knowledge is confined to individuals, according to Breschi and Lissoni
(2000) “it is suggested that high, but localized labor mobility and firm spin-offs ensure both fast
diffusion inside the area, and no diffusion outside it.” One might suspect that this type of
knowledge transfer resembles more that of knowledge spillovers, however Breschi and Lissoni
(2000) argue that as workers move from one firm to the other, they help diffuse knowledge
through a certain region production complex, thus creating a local manufacturing environment in
which firms build cumulatively upon a common stock of technological successes and failures.
Apparently, this outcome resembles local knowledge spillovers (LKS), but it does not require any
face-to-face, inter-personal or inter-firm sharing of tacit knowledge. Another reason why work
force mobility should not be viewed as a knowledge spillover is that it can be assumed that
people are hired and paid on the basis of their knowledge, which makes the knowledge transfer
intentional. One final note is that, worker mobility is mainly intra-regional. Feldman and Martin
explain it by noting that “labor is less mobile than capital and workers become more skilled as
they age but then correspondingly become more immobile as they form relationships, raise
families and become members of communities.”
2.1.3.3.3 Formal relationships with actors outside the cluster
Unlike many of the linkages that cause knowledge flows inside clusters, “the processes behind
the establishment and maintenance of global pipelines must be pre-designed and planned in
advance, and they require specific investments13” (Bathelt et al 2002). Furthermore, the trust that
naturally exists between firms inside the cluster does not exist between cluster firms and outside
firms and has to be built up over time. Consequently there is a limit to the number of pipelines a
firm can hold. However, it is suspected that “a large number of related independent firms in a
13 The term ‘global pipelines’ covers formal and informal relationships with actors outside the cluster

19
cluster can manage a larger number of pipelines than one single large firm alone. If this is true,
this could provide a possible explanation why spatial clustering gives rise to competitive
advantage”, as knowledge sourced via pipelines often is absorbed and spills over to other firms
inside the cluster (Bathelt et al 2002). In fact, Rosenfeld (1996) sees this spillover process as an
indicator of how well a cluster functions; “If the firm is operating in an effective cluster, the
learning it acquires through relationships outside of the cluster is more apt to be rapidly diffused
to other firms, multiplying its impact.” In this way cluster firms benefit from the shared number
of pipelines to the extent that the cluster is effective, which we shall later see depends on the total
amount and strength of relations between actors.
To sum up how knowledge accumulation works, please see the model below. As can be seen,
innovation builds on two knowledge sources; internal knowledge and external knowledge. In
general knowledge created inside firms unavoidably flows to other firms in the cluster. At the
same time the process of creating knowledge also creates absorptive capacity which can be used
for exploiting external knowledge. What is particular to firms located in clusters is that social
capital and untraded interdependencies allow for rapid and costless diffusion of valuable and
distance sensitive tacit knowledge inside the cluster. Knowledge stems either from relationships
with external actors or from knowledge transfer or knowledge spillovers inside the cluster. Of
particular value seems to be the mobility of the local work force which is highly mobile inside
the cluster, but much less so outside the cluster. This knowledge accumulation results in both a
pressure- and a platform for constant upgrading, causing cluster firms to be competitive vis-à-vis
firms outside the cluster.

20
2.2 Cluster typology
At this point, we have gained an understanding of what clusters are and how they work. As such,
we are ready to construct a typology of clusters, which will allow us to distinguish between
clusters based on their composition of actors and their relations, and make theoretical inferences
about how a given cluster works, and what its strengths and weaknesses are. The typology will
consist of three parts. First, the overview and consequences of relations in a cluster is made more
concrete. Secondly, we consider the composition of actors in a cluster, and finally, we add a
dynamic dimension to the discussion as we investigate how clusters develop over time.
2.2.1 Relations
From our discussion of the interplay between relations and benefits from industrial clustering we
found that relations work to produce most of the firm specific benefits from clustering14. Since
none of the relations discussed had any negative effect for the cluster firms, it follows that a high
degree of relations in a cluster is equivalent to more benefits for its members.
Enright (1998) considers this issue in his typology of latent clusters and working clusters, where
he argues that “latent clusters have a critical mass of firms in related industries sufficient to reap
the benefits of clustering, but have not developed the level of interaction and information flows
necessary to truly benefit from co-location.” The reason Enright (1998) argues is “a lack of
knowledge of other local firms, a lack of interaction among firms and individuals, a lack of a
common enough vision of their future, or a lack of the requisite level of trust for firms to explore
and exploit common interests”. Working clusters on the other hand “tend to have dense patterns
of interactions among local firms that differ quantitatively and qualitatively from the interactions
that the firms have with those not located in the cluster” (Enright 1998). Naturally firms’ ability
to reap benefits from being in a cluster is not only a function of the number of relations, but also
the distribution of these relations with respect to strength and type, e.g. the benefits from a
vertical relation might be different from those gained from a cooperative relation. Also, whether
the relation is between organizations or between individuals has an impact on the formalization
and strength of the relation.
14 Regions can also benefit from the presence of clusters in that clusters among other things work to create jobs and promote the region internationally, as is the case with Champagne, Bordeaux (wine) and Parma (ham).
21
2.2.2 Composition of actors
In this section, we consider how a cluster is affected by its size, the functional proximity between
firms and whether the entire value chain of the constituent industries is included.
2.2.2.1 Absolute size and Density
When we consider the size of a cluster we need to acknowledge that size can either be absolute
(the overall size of the cluster) or relative (the size of the cluster compared to the size of the
region it is located in), and that size depends on the unit of analysis (number of firms, number of
employees, a financial measure such as total turnover, etc.). If we allow ourselves to consider
size in terms of number of firms we can make some inferences from our existing knowledge
about clusters.
We have previously established that firm specific benefits from clustering to a large extent stem
from the relations that exist between firms. If we consider the absolute size of a cluster we find
that as the number of firms increases so does the incentive and pressure for specialization. This is
based on the notion that firms competitiveness depends on their core competencies; as
competition increases firms must increasingly focus on activities that build on core competencies
and in this process outsource or shut down activities where they hold no competitive advantage.
Based on this observation we find it likely that large clusters (measured in number of firms)
display high specialization levels among the organizations. If this is indeed the case, firms in
large clusters are more likely to reap benefits than similar firms located in small clusters, as there
are many different suppliers and partners to chose from as well as competitors and related firms
to learn from.
But is there a threshold where efficiency declines? One such threshold could stem from mere
information overload caused by the many actors’ knowledge outflows. Bathelt et al. (2002) argue
that information in clusters is constantly subject to filtering processes so that each piece of
information which is transmitted face-to-face already has been filtered for relevance and
customized to the receiver. In this way mere size of a cluster, measured in number of firms, is not
perceived to constitute any disadvantage to the quality of knowledge flows, on the contrary; the
larger the cluster the better.
So far we have only considered absolute size, but we must not forget that clustering deals with a
concentration of interdependent firms, which in return makes the relative size important. Enright
22
(1998) notes that the geographic scope of a cluster refers to the territorial extent of the cluster,
and accordingly divides clusters into localized clusters which “…are tight groupings found in a
small geographic area, often a single town” and dispersed clusters, which “…are spread across
wider geographies.” Acknowledging that relative size depends on the geographical scope allows
us to formally define relative size or density as the number and economic weight of firms in a
cluster compared to the cluster's geographical scope (Enright 1998)15. Applying the concepts of
dense and sparse clusters to our existing knowledge, we find that increased density brings with it
a better ability to monitor and learn from others’ mistakes, paving the way for knowledge
spillovers (Maskell 2001). It allows for frequent interactions which foster trust and build social
capital. Yet, although dense clusters are from a theoretical viewpoint more apt to provide benefits
for cluster firms than sparse clusters, the comparison needs to include the absolute size also. This
is because specialization-levels in organizations, the number of potential trading partners,
competitors, institutions, etc. depend on the absolute size of the cluster. Consequently a dense,
but small cluster may not function better than a large and sparse cluster, while a dense cluster of
the same absolute size as a sparse cluster can be expected to function better.
Contrary to the absolute size of clusters, the density is subject to an upper limit with respect to
efficiency. Bekele and Jackson operate with two opposing forces, namely centripetal and
centrifugal forces. In essence the centripetal forces are the benefits from clustering we have
discussed above, while centrifugal forces, on the other hand; “…include immobility of labor,
increases in land rent and external diseconomies such as congestion and environmental problems
that develop within increased concentration” (Bekele and Jackson 2006). Thus, the benefits firms
obtain from industrial clustering have to be balanced against inevitable negative forces, such as
increasing land and labor prices. As clusters become more and more dense, negative externalities
increase in importance. The centrifugal forces described in the above quote are in most cases
equal to or dependent on the cluster’s frame conditions. In this way dense clusters put pressure on
scarce and immobile factors and cause them to be bid up. This in turn raises costs and ultimately
limits the attractiveness of the region.
15 Enright (1998) measures density in terms of market shares. However as we have already discussed density is subject to the unit of measurement, and also depends on the unit of comparison, e.g. the cluster’s market share compared to the world market or the cluster’s total employment compared to national employment. For consistency and explanatory reasons we here consider it in terms of number of firms compared to a given region.
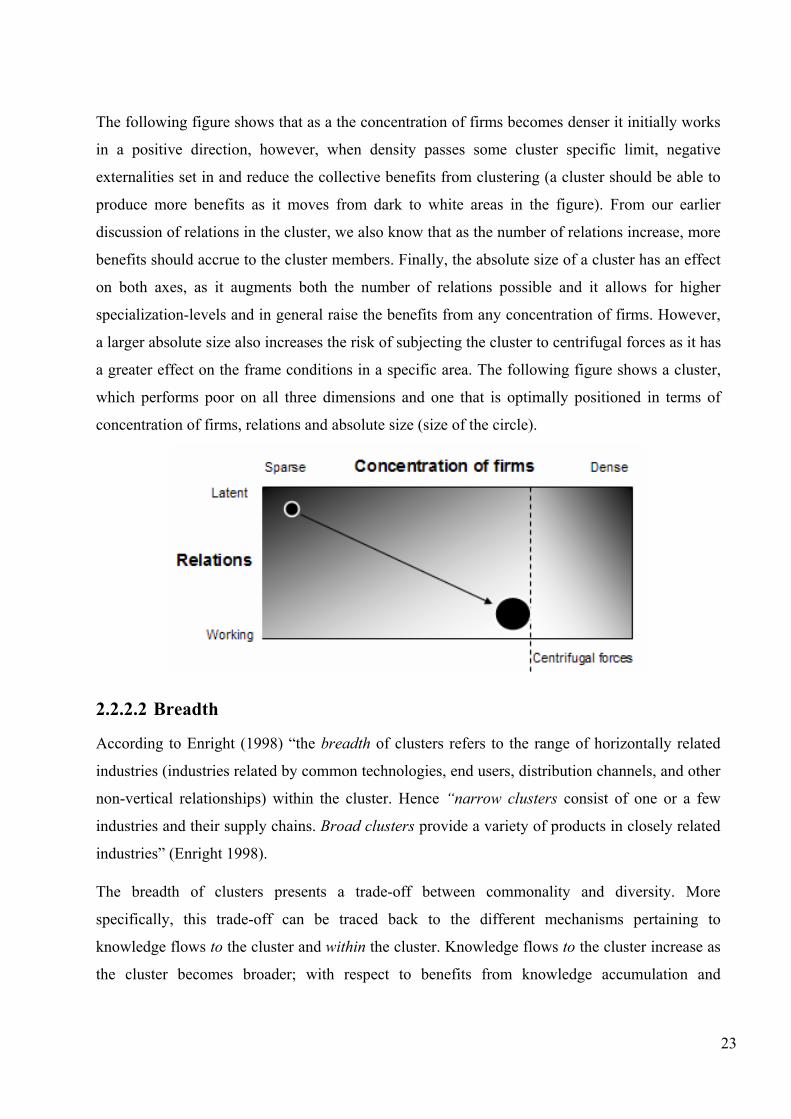
23
The following figure shows that as a the concentration of firms becomes denser it initially works
in a positive direction, however, when density passes some cluster specific limit, negative
externalities set in and reduce the collective benefits from clustering (a cluster should be able to
produce more benefits as it moves from dark to white areas in the figure). From our earlier
discussion of relations in the cluster, we also know that as the number of relations increase, more
benefits should accrue to the cluster members. Finally, the absolute size of a cluster has an effect
on both axes, as it augments both the number of relations possible and it allows for higher
specialization-levels and in general raise the benefits from any concentration of firms. However,
a larger absolute size also increases the risk of subjecting the cluster to centrifugal forces as it has
a greater effect on the frame conditions in a specific area. The following figure shows a cluster,
which performs poor on all three dimensions and one that is optimally positioned in terms of
concentration of firms, relations and absolute size (size of the circle).
2.2.2.2 Breadth
According to Enright (1998) “the breadth of clusters refers to the range of horizontally related
industries (industries related by common technologies, end users, distribution channels, and other
non-vertical relationships) within the cluster. Hence “narrow clusters consist of one or a few
industries and their supply chains. Broad clusters provide a variety of products in closely related
industries” (Enright 1998).
The breadth of clusters presents a trade-off between commonality and diversity. More
specifically, this trade-off can be traced back to the different mechanisms pertaining to
knowledge flows to the cluster and within the cluster. Knowledge flows to the cluster increase as
the cluster becomes broader; with respect to benefits from knowledge accumulation and

24
innovation, Feldman and Martin (2004) note that “diversity is important for innovation, and so as
a local economy becomes too dependent on one firm or one industry it may drive out new ideas.”
Feldman and Martin (2004) supplement this by stating “that diversity across complementary
economic activities sharing a common science base is more conducive to innovation than is local
specialization.” The optimal breadth depends on the specific cluster, yet we can conclude that as
breadth increases, so does the ability of the cluster to draw knowledge to it from different areas
and innovate in different directions. On the other hand, knowledge flows within the cluster
increase as the cluster becomes narrower; Malmberg and Maskell (2002) note that as diversity
(functional distance between firms) increases a shared culture will be more difficult to develop
and maintain. At the same time it becomes more difficult to constantly observe and interpret
other firms, which can be seen as a function of a firm’s absorptive capacity (Cohen and Levinthal
1990). This implies that firms’ ability to apply external knowledge is reduced when the cluster is
very broad because the external knowledge cannot spillover- nor be absorbed effectively. Enright
(1998) further questions the quality of very broad clusters, such as tradable business services,
engineering, technology, tourism and agriculture. A cluster at either of the two extremes with
regards to breadth has downsides, and the specific breadth of a cluster is thus an empirical
question, which depends on the nature of the industries involved, and several other factors.
Especially, we note that the efficiency in applying external knowledge (absorptive capacity)
depends not only on technological proximity between firms, but also on relational-,
social/cultural and geographical proximity between actors sending and receiving information.
2.2.2.3 Depth
“Cluster depth refers to the range of vertically related industries within the cluster” (Enright
1998). Deep clusters (or traded industry clusters, applying Monitor Group’s (2004) terminology)
contain nearly complete supply chains of an industry or a set of related industries, whereas
shallow clusters “are those that rely principally on inputs, components, equipment, technology,
and support services from outside the region” (Enright 1998).
Increasing depth leads to a larger number of potential trading partners. This in turn provides for
the existence of a dense web of vertical linkages, which can potentially produce pecuniary
benefits for the firms involved. At the same time these trade linkages can evolve into informal
linkages which facilitate knowledge transfers.

25
Assuming first a fixed number of firms in a cluster reveals that as depth increases, breadth
decreases. This consequently results in a trade-off between the previously mentioned benefits
from depth, and those stemming from breadth, namely horizontal linkages in the form of co-
operation and knowledge spillovers. However, allowing the absolute size of clusters to vary
allows for a preferred distribution of breadth and depth. Consider the figure below for an
illustration (the size of the circle reflects the absolute size of the cluster).
2.2.2.4 Cluster archetypes
Based on type of firms and linkages, Markusen (1996) divides clusters into 4 different types;
Marshallian (Italianate) industrial districts, hub-and-spoke districts, satellite industrial districts
and state-anchored industrial districts.
Marshallian (Italianate) industrial districts are dominated by small locally owned firms, which
have limited economies of scale. These firms have a high level of intra-district trade based on
long-term contracts works. Largely the only linkages that exist with actors outside the cluster are
in the form of sales, which do not entail cooperation of any sort. Workers are committed to the
district and are highly flexible and mobile, allowing for a high degree of knowledge transfer
between the firms. Since workers are so highly committed to the region a strong culture develops,
which allows for the transmittance of tacit knowledge. In addition, trust between firms works to
promote frequent exchanges of personnel between customers and suppliers and causes
competitors to share risk, stabilize markets and share innovations. Excellent examples are the
Northern Italian industrial districts, hence the name.

26
Hub-and-spoke districts are dominated by one or several large vertically integrated and
international firms (hubs),”…with suppliers and related activities spread out around them like
spokes of a wheel” Markusen (1996). Two forms exist. A strongly linked form in which the
smaller firms are highly dependent on the hub either as a supplier or as a market, and a nucleated
form in which the smaller firms enjoy the externalities created by the hub, such as specialized
factors in the form of skilled labor, infrastructure, research institutions, etc. Usually there is a
development from the former type towards the latter over time as entrepreneurs benefit from the
externalities created by the hub, but not necessarily from linkages to the hub. Hub-and spoke
districts may display cooperation, but generally on the terms of the hub. Cooperation among
competitor firms is strongly lacking. Strategic alliances on behalf of the hub occur mainly with
partners outside the district. Exchange of employees may take place, yet employees are mainly
loyal to the hub. This is also why the culture tends to develop around hub activities. Hub-and-
spoke district often lack specialized venture capital. Finally, dominant firms may be actively
involved in “…issues that affect their work force and their ability to do business – especially in
improving area educational institutions and the provision of infrastructure” Markusen (1996). All
in all hub-and-spoke districts are strongly dependent on the hubs and their presence in the region.
Examples are Toyota in Toyota City, USA or Boeing in Seattle, USA.
Satellite platform districts are dominated by branches of large and externally headquartered firms
and are often located in outer regions due to lower costs of doing business. Firms here enjoy
moderate to high level of economies of scale and have almost no linkages inside the area.
Consequently although satellite platform districts might look like clusters they certainly do not
function as working clusters, and therefore benefits from clustering cannot be observed.
Finally in state-anchored industrial districts public or non-profit organizations are central players
and function much like the hub-and-spoke district mentioned above.
The four types of cluster should not be seen as either-or types, but rather as arch-types that can be
blended and co-occur in clusters. With respect to linkages, it seems that the composition and
workings of Marshallian (Italianate) districts produce more cluster benefits than for instance
satellite platform districts which suffer from almost a complete lack of linkages. State-anchored-
and hub-and-spoke districts are likely to be found somewhere in between.

27
2.2.3 Cluster development over time
Cluster development over time has thus far not been properly explored. We noted earlier that a
cluster might change from a latent to a working cluster and that Markussen’s archetypes might
develop over time. In this section, we adopt a dynamic view on clusters, and thereby explain
more in detail how and why clusters develop over time.
The number of ways in which researchers have tried to explain and generalize the growth
patterns of clusters reflects the fact that no two clusters are alike. Even the ‘birth’ of a cluster is
strongly discussed. Porter (2000a) argues that; “a cluster’s roots can often be traced to parts of
the diamond that are present in a location due to historical circumstances. One prominent
motivation for the formation of early companies is the availability of pools of factors, such as
specialized skills, university research expertise, an efficient physical location, or particularly
good or appropriate infrastructure”. Xu and McNaughton (2003) support Porter’s view and add
as an explanation; unusual local demand and the existence of related industries. Malmberg and
Maskell (2002) propose that “research on origin and developments of clusters usually find three
things; they often originate in a series of events leading to the start of a new firm at the place of
residence of the founder, they develop through spin-offs and imitation within the local milieu,
and they are sustained by various forms of inertia, meaning that firms rarely relocate once they
have been reproduced in a place.” Porter (2000a) supplements; “The early formation of
companies in a location often reflects acts of entrepreneurship not completely explainable by
reference to favorable local circumstances. These companies, in other words, could have sprouted
at any one of a number of comparable locations.” This supports the view that chance plays a
prominent role in describing the ‘birth’ of clusters (Rosenfeld 2002, Bekele and Jackson 2006).
Once established Porter (2000a) argues that “in a healthy cluster, the initial critical mass of firms
triggers a self-reinforcing process in which specialized suppliers emerge; information
accumulates; local institutions develop specialized training, research, infrastructure and
appropriate regulations; and cluster visibility and prestige grows. Perceiving a market
opportunity and facing falling entry barriers, entrepreneurs create new companies. Spin-offs from
existing companies develop, and new suppliers emerge.” Martin and Feldman 2004 note that this
occurs because “the cumulative nature of innovation manifests itself not just at firm and industry
levels, but also at the geographical level, creating an advantage for firms locating in areas of
concentrated activity. These factors can generate positive feedback loops or virtuous cycles, as

28
clusters attract additional specialized labor and other inputs, as well as the greater exchange of
ideas.”
Various important mechanisms set in as clusters grow and age. The number of actors in the
cluster increases which allows for many complementarities to occur. Similarly, as a function of
the age of the cluster, actors become increasingly aware of each other, start interacting and
thereby develop social capital. In turn this forms the basis for more and stronger relations,
producing benefits for the actors thereby causing them to grow and others to spawn. Furthermore,
relations and trust work to improve knowledge sharing as well as other externalities in clusters.
Growth of clusters can occur through growth of existing firms, establishment of new firms and
through the attraction of outside-firms. Cluster benefits create a platform for growth of existing
firms. Companies start to relocate from less productive locations or invest in subsidiaries inside
the cluster in order to benefit from the cluster’s location advantages. Finally, the level of new
firm creation is dependent on the existence of entrepreneurs in the cluster. Various explanations
exist as to why entrepreneurs should be more common inside clusters. Porter (2000b) proposes
that higher levels of new business formation exist due to lower entry barriers – as needed assets,
skills, inputs and staff are already present, local investors with industry familiarity might require
a lower risk premium, a market for the products already exists, and the entrepreneur might have
valuable connections. Another explanation can be the ability to perceive of potential “holes in the
market” created by demand from existing firms or insight into local demand. The common
denominator in these explanations appears to be a lowered perceived risk and uncertainty which
is thought to be what limits the supply of entrepreneurs in the first place (Feldman et al 2003).
The above is a generic explanation that works to describe the reasons for growth in most clusters.
However as we have just seen clusters differ in a number of ways which affect the speed and
magnitude of growth. Firstly, the ability for firms to grow on the basis of knowledge flows,
strongly depends on their innovative capacity (the ability “…to generate the key innovations in
products, processes, designs, marketing, logistics, and management that are relevant to
competitive advantage” (Enright, 1998)). This can either be firm- or industry specific. Secondly,
growth rates and the overall growth capacity of a cluster is determined by the underlying
industry/industries’ life cycle. Industries in the early stages of a life cycle have a larger growth
potential, than those in later stages, and some industries grow bigger and live longer than others.
At the same time growth capacity is also dependent on the cluster firms’ competitiveness vis-à-

29
vis competitors outside the cluster. Thirdly, firms in both broad and deep clusters operate and
develop in different ways due to their functional distance. Consequently, they are in need of
different, but highly specialized factor conditions at different times, making it hard to satisfy the
needs of everybody. This is also the case for large clusters where individual firms tend to be
highly specialized. Finally, factor conditions also affect the growth potential of a cluster. For
instance, although clustering might work to improve entrepreneurship in a cluster, the overall
level of entrepreneurial activity is still dependent on location specific factor conditions. For
instance it might be that industry familiarity lowers the risk premium charged by local investors,
but what happens if no local investors exist? The Monitor Group (2004) also point out other
important factors such as; legitimacy, attitudes towards bankruptcy, individualist culture and
attitudes towards income tax. In general factor conditions can either be a catalyst for- or an
obstacle to cluster growth, and might therefore work to explain why some clusters grow faster
and become more competitive than other.
As we have discussed earlier, clusters are subject to centripetal and centrifugal forces. In clusters
that have grown very dense centrifugal forces set in and with them also negative externalities.
Another reason for clusters to stop growing and possibly decline is proposed by Martin and
Feldman (2004); “…there is a risk of cluster members narrowing their focus to the cluster and
thereby not reacting to shocks and opportunities from surrounding industries – this problem
becomes more and more severe as the cluster grows older.” Consequently, technological
discontinuities, introduced by firms outside the cluster, can - if cluster firms fail to react timely -
“neutralize many cluster advantages simultaneously. Market information, employee skills,
scientific and technical expertise, and supplier bases may be rendered inappropriate” (Porter
2000a). Alternatively, Andersson et al (2004) argue that as time passes market, technologies and
products change. If cluster firms want to remain competitive they adapt to these changes. This
process might in turn lead to a transformation in which the clusters break apart into several
smaller clusters or in extreme cases even dissolve.
The figure on the next page is modified from that on page 23 to reflect our finding that clusters
develop over time; we have drawn in Markusen’s (1996) cluster types as well as possible
development paths for various clusters. The development paths are intended to show that as
clusters grow, they gradually move from latent to working clusters, which reflects the fact that
opportunities for creating relations increase. The end position and paths reflect our finding that
cluster-development and growth potential is different from cluster to cluster (here symbolized by

30
Markusen’s archetypes, although the many other issues discussed also have an impact), and that
high density is the end-station for cluster growth, beyond which the cluster usually either stops
growing or decline/transformation sets in. Please note that the speed at which the development
takes place is different from cluster to cluster, and that the cluster types have been positioned in
the figure to reflect our finding that Marshallian districts are more likely to create linkages than
hub-and-spoke and state-anchored districts, while satellite platform districts are expected to have
the least linkages. In the next section, we explore how CIs can affect clusters and the direction
and speed of the development paths.
2.3 Cluster initiatives
In this section we explore clusters initiatives (CI). This is done in order to provide a theoretical
platform for suggesting potential CI to the mechatronics cluster based on the findings from our
empirical study. In order to obtain a holistic approach and thereby also a complete basis for
suggesting initiatives we deal with questions of what, how and who. To make the section
approachable for the reader we have structured the section according to these questions. Provided
its purpose, emphasis will be put on the section that deals with what CI should focus on.
2.3.1 What is the purpose of CI?
The overall objective of CI is by definition to improve the functioning of clusters by increasing
cluster growth and competitiveness (Sölvell et al 2003). Scholars broadly agree that CI should
“refrain from taking steps that allow clusters to distance themselves from the overall productivity
frontier” such as subsidizing firms or industries (Andersson et al 2004). Instead CI should
facilitate a more organic clustering process by addressing market-, systemic-, and government
failures (Enright 1998, Den Hertog et al 1999, Andersson et al 2004).

31
In clusters, market failures typically consist of co-ordination failures which arise from an
inability of actors to initiate or sustain linkages that can be favorable – this can occur due to
prisoners’ dilemma situations in which firms “foresee temptation to grab the surplus” (Enright
1998, Andersson et al 2004). Systemic failures occur when there is a mismatch or inconsistency
between knowledge producing actors, both public and private. This can occur in the form of
problems in coordination or interaction, as for instance when two actors produce the same
knowledge (Andersson et al 2004). Since systemic failures among other things derive from
inefficiencies in the institutional set-up, corrective actions can be both complex and far-
reaching16. Finally, government failures can be undersupply of public goods, such as specialized
education, training and infrastructure (Enright 1998).
CIs dealing with the above inefficiencies can generally be divided into two groups. One works to
promote dialogue and co-operation among actors, and is often referred to as broker policies
(Andersson et al 2004), while the other focuses on improving the institutional set-up in terms of
education, infrastructure, laws and regulations, and social capital (Den Hertog et al 1999,
Andersson et al 2004). Based on a sample of more than 200 clusters, Sölvell et al (2003) have
set-up a list of CI objectives according to how frequently they are pursued (see appendix 2.2).
The most common objectives mainly relate to the inefficiencies mentioned above. In addition,
there is another category which relates to the expansion of clusters by attracting outside firms,
promoting the region, attracting FDI, etc. Although they generally rank lower than especially
networking objectives they are still considered important.
Based on our previous discussion of cluster types it is clear that no two clusters are alike, and
consequently their needs differ; as Brown (2000) notes; “it is important … to stress that the needs
of clusters will vary and there is no uniform ‘tool-kit’ which can foster cluster development.” and
supplements that “…it is absolutely vital that cluster programs and actions are properly tailored
to the individual needs and requirements of any given cluster and the specific characteristics of
any given region” (Brown 2000). This has several implications for CI; the formulation of CIs
preconditions a thorough understanding of the specific cluster and its context, and the failures
that are revealed should only be addressed if CI can be presumed to improve these inefficiencies
16 According to Sorrn-Friese (2003) the the institutional set-up of a cluster is "…the rules of the game defining the general habits of action and thought within the cluster, including its specific division of labor and means of interfirm coordination"

32
(Andersson et al 2004). Furthermore, since clusters are unique, CI intervention may cause mixed
results from cluster to cluster (Sornn-Friese 2003). Despite these inherent differences we can,
based on our typology of clusters, conclude that CI should focus on deepening and growing
clusters and intensify the network of relations.
2.3.2 How should CI be carried out and who should do it?
CI can be initiated for a variety of reasons, which determine the appropriate starting point for
actions to be undertaken. Governments can initiate CI as part of an industrial or innovation
policy. Local public actors can initiate CI as part of a regional development plan. Finally, firms
can initiate CI as a response to a crisis, due to a dynamic leader or as an outcome of a tightening
of already existent regional networks (Andersson et al 2004). Since the starting points for these
scenarios differ, it is typically recommended that once interest is established the first thing CI
should focus on is to thoroughly identify and define the cluster in question (AEEMA 2004).
Once this has been done it is recommended that a cluster specific governing body is set down
which represents the member companies (Rosenfeld 2001). Keeping in mind that the objective of
CI is to correct inefficiencies in which political actors and academia play an important role,
including these two groups in the governing body makes sense. With regards to the distribution
of roles, Porter (2000a) notes it should be “active government participation in a private-led effort,
rather than an initiative controlled by government.” This is because on one hand “companies can
usually better identify the obstacles and constraints in their path, as well as the opportunities, than
can government” (Porter 2000a) and on the other hand, political dependence exposes clusters to
political cycles. Although including all these different types of actors in the governing body leads
to a host of different and sometimes opposing visions, motivations and objectives, it facilitates an
understanding of the relative importance of needs and objectives in the cluster and creates buy-in
from different types of actors. Together with the investigation of the cluster this provides for the
development of an efficient strategy on behalf of the cluster. Finally, the implemented strategy
should be reviewed periodically and adjusted to new goals and visions (Andersson et al 2004).

33
3 Methods of empirical investigation of clusters In this section, we introduce the ‘tool box’, which cluster scholars and practitioners interested in
identifying and/or investigating clusters can choose from. The purpose is to provide the reader
with an understanding of the underlying assumptions, virtues and shortcomings of the empirical
work that can be carried out on clusters. At the same time, we hope to reveal the tools that are
missing in the toolbox, not only with respect to the identification and investigation of the
mechatronics cluster, but also with respect to clusters in general. In the first two sections of this
chapter, we investigate the strengths and weaknesses of quantitative and qualitative techniques,
which lead us to the identification of social network analysis (SNA) as a very promising
methodological tool in cluster studies. The third section goes into more detail with regards to
SNA as a methodology and we review the theoretical framework in light of this methodology. In
the following, we will start by introducing the different levels of analysis in cluster studies.
Cluster studies with the aim of either identifying or investigating clusters are typically grouped
based on their level of analysis. OECD has worked to make the the tripartite grouping of levels
presented in the figure below the de facto standard (figure from Den Hertog et al (1999));
In accordance with Bergman and Feser (1998), the figure reveals that the meso- and micro levels
are those most relevant for cluster studies. Micro-level studies look for inter-firm relations
between pre-determined sectors and meso-level studies look for inter- and intra-industry
linkages, across a wide and diverse range of industries in a given region. Consequently, clusters
detected through micro-level studies typically include firms that produce similar products (i.e.
34
industries) and pay only scant attention to value chain relations (Bergman and Feser, 1998). On
the other hand, meso-level studies look for a more diverse set of relations across a broader range
of industries. This helps to reveal broader clusters that not only include more parts of the value
chain, but also clusters that build on less traceable factors such as shared competencies. This is
why “most cluster analyses use a combination of different techniques at different levels of
aggregation to overcome the limitations of a single technique and to answer different questions”
(Den Hertog et al 1999). A possible approach could be to make use of a two-stage process
consisting of first an initial scan of the regional economy, using detailed quantitative sources and
subsequently a detailed investigation of industrial groupings using more in-depth and time-
consuming techniques, often qualitative (Bergman and Feser 1998, Brown 2000). To get a more
profound understanding of the building blocks in such an approach, we account for the available
investigation techniques, which are here grouped into quantitative and qualitative techniques.
3.1 Quantitative Techniques
The first of two quantitative techniques is the location quotient. By definition the location
quotient is a ratio of “regional industry i’s share of total regional employment over national
industry i’s share of total national employment” (Bergman and Feser 1998). If the ratio exceeds
1.25, a cluster is said to exist (Bergman and Feser 1998, Brown 2000). Due to ease of
application, the location quotient is frequently applied, however with respect to identifying
industrial clusters it has some shortcomings. Firstly, the location quotient is by nature static and
therefore incapable of identifying young clusters with growth potential. However, the growth
share matrix which combines measures of the size of the sector in a given region, in terms of
employment, the average annual regional growth rate in employment for that sector, and its
location quotient can mend this problem (Brown 2000). Secondly, since location quotients focus
on total industry employment they do not pay attention to the importance of economies of scale
(Lublinski 2002). As a consequence results are the same regardless of whether production is
concentrated in few large firms or a host of small firms - the latter clearly representing the
custom understanding of a cluster. Thirdly, analyses applying the location quotient are dependent
on the availability of statistical data, which often poses significant limitations with respect to the
geographical scale. Finally, location quotients do not capture potential interrelations with other
industries in the region and therefore analyses solely applying the location quotient must be
viewed merely as sector studies (Bergman and Feser 1998). This is why location quotients are
only useful in concert with other methods of investigation (Brown 2000).

35
The second method makes use of input-output (I/O) data and typically works to identify clusters
based on strong linkages between industries in the form of physical flows of goods17. Due to the
focus on product flows, I/O based analyses tend to identify clusters bound together by value
chain relations (Brown 2000). Thus “linkages that do not include economic transactions (e.g.
personal linkages between individual decision-makers in different firms or inter-firm linkages of
knowledge sharing and transfer) are not measured in I/O tables” (Sornn-Friese 2003). However,
to mend this problem a number of OECD countries have carried out I/O analyses based on
innovation interaction between industries, either stand-alone or in concert with traditional
product flow I/O analysis (Bergman and Feser 1998). Strong as it might seem the I/O based
technique is problematic as well. Firstly, since there is no agreed upon definition of what a strong
I/O linkage is, the analysis comes to depend on individual judgment. In addition, “the
aggregation in I/O tables is in advance at a given level, which might be unsuitable for identifying
the most important user-producer linkages” (Drejer et al 1999 in Sornn-Friese 2003).
3.2 Qualitative Techniques
Qualitative techniques consist of expert opinions gathered from regional experts such as industry
leaders, public officials and other key decision makers as well as industry association reports,
newspaper articles and other published documents (Brown 2000). To obtain expert opinions
various data gathering techniques exist such as interviews, focus groups and traditional desk
research (Bergman and Feser 1998). Expert opinions are the most common approach to
identifying clusters, most probably because they “transcend the limitations of the purely
statistical approach to shed new light on the underlying social and institutional dynamics that
create the extra-firm dimensions of the cluster’s strength” (Wolfe and Gertler 2004). However
expert opinions are used not only to identify clusters, but also to investigate them. More
accurately, expert opinions applied in case studies “yield important insights into the nature and
dynamics of regional industry clusters and the sources of their success” (Wolfe and Gertler
2004). However, case studies alone cannot provide complete information on the quantitative
importance of regional clusters and they are limited in their ability to compare findings across
clusters. Finally, expert opinions may be subject to bias and suffer from the experts’ limited
experience with the broader economy, which particularly manifests itself in broad clusters.
17 Various techniques exist; some use matrices to identify maximal I/O linkages, other apply graph theory and yet other complex cut-off schemes. Lublinski (2002) provides an review of the various techniques, and Bergman and Feser (1998) hold important references on the subject.

36
3.3 Social Network Analysis
When comparing the above techniques to our theoretical perspective on clusters we find a
substantial shortcoming, which lies in the investigation of relations that lead to non-pecuniary
benefits through both knowledge transfers and knowledge spillovers. Relations leading to non-
pecuniary benefits can only be captured either via innovation based I/O analysis or via qualitative
techniques. The former is limited by the fact that it can only measure relations focusing on
innovation and at the same time only capture those that lead to successful outcomes. The latter
suffers from a lack of a shared framework that would make it applicable across clusters. Bergman
and Feser (1999) propose that social network theory may be able to bridge this methodological
gap as they point out that; ”qualitative analysis of industry clusters using techniques perfected in
the social network analysis literature is promising though has not been attempted to our
knowledge.” More recently, Quimet et al (2004) point out; “the fact that networking and
knowledge exchange are key characteristics of industrial clusters renders the utilization of social
network concepts and methods highly relevant.”
The relevancy of SNA in cluster studies can best be explained by recognizing that data can be
divided into two principal types; ‘attribute data’ and ‘relational data’ (Scott, 2000). ‘Attribute
data’ refers to “…properties, qualities or characteristics…” that relate specifically to an
individual or a group, while ‘relational data’ on the other hand are the “…contacts, ties, and
connections, the group attachments and meetings, which relate one agent to another and so
cannot be reduced to the properties of the individual agents themselves.” (Scott, 2000). As is
clear from our theoretical perspective on clusters, relations between actors are seen as one of the
most important aspects of clusters in generating benefits to the cluster members. SNA is a
methodology dedicated to the investigation of relational data, or as Wasserman & Faust (1994)
appropriately define it as the analysis of;”…relationships among social entities, and on the
patterns and implications of these relationships.”
In the following, we will account for social network analysis (SNA) by first explaining the basis
of SNA as a methodology, and next using this knowledge to make the theoretical framework
developed in chapter two even more concrete.

37
3.3.1 SNA as a methodology
A few, very established and well-known texts are frequently cited in social network literature as
‘the manuals’ of the field. Especially, Wasserman and Faust (1994), Scott (2000), and recently
Carrington et al (2005) give a very exhaustive overview of the field of SNA in terms of
methodology and applicability. It is outside the scope of this thesis to give an in-depth
explanation of the field of SNA. Instead, we will focus on giving the reader an introduction to the
field in terms of how social networks can be analyzed, and what such analysis brings in terms of
clarification and understanding of the relations within a cluster. We will account for SNA in three
stages; first, we introduce the reader to the specific considerations regarding the collection and
manipulation of relational data. Next, we consider structural measurements of relational data,
which gives a mathematical and standardized way of viewing networks18, and finally, we
introduce visualization techniques, which help give an overview of the networks.
Data collection and manipulation
We noted earlier that we have used questionnaires to collect the empirical data. Here we note
some considerations specific to a network study in the design of such a questionnaire. Most
importantly, there is a distinction between ‘free recall’, where the respondents, on their own,
generate a list of (in our case) organizations with which they have some type of relation, and
‘roster’, where respondents are presented with a complete list of the organizations that we, as
researchers, are interested in (Wasserman and Faust 1994). We use both methods in our study;
we use the ‘free recall’ method to identify the ‘most important’ customers, suppliers, competitors
and cooperative partners, which are mainly used to examine how important relations inside the
cluster are in a larger context. In contrast, the ‘roster’ method is used to identify different type of
relations specifically between cluster members.
We mainly use SNA to analyze respondents’ answers to the ‘roster’ section of the questionnaire,
which consists of 6 questions. The data acquired through the questionnaires is ordered into
sociomatrices, more specifically case-by-case matrices, which are matrices with number of rows
and columns equal to the amount of actors in the study (see also appendix 3.1). Furthermore, the
relational data can be characterized in terms of its directionality and its numeration (Scott, 2000).
18 As earlier mentioned, a network refers to the collection of data on a specific dimension of the cluster, such as the network of personal contact or the network of technological distance between cluster members.

38
1 3
42Valued
Binary
Undirected DirectedDirectionality
Numeration1 3
42Valued
Binary
Undirected DirectedDirectionality
Numeration
Directed relational data distinguishes between outdegree (choices sent) and indegree (choices
received) for each actor, e.g. many organizations may know who Danfoss is (indegree), but this
acquaintanceship may not be reciprocated by Danfoss (outdegree). The other dimension; the
numeration of network data, can be either valued or binary. Most of our relational data is valued;
e.g. we have asked respondents to rate the strength of a tie to other organizations, by specifying
the frequency of contact from 0-4. On the other hand, a binary network is when there is only a
choice between having a relation or not. Scott (2000) points out that the complexity of data can
be classified according to their numeration and directionality as just described. The figure
summarizes these “levels of measurement in
relational data”, where 4 is the most complex and
1 is the least complex. In our study, we mainly
start of with data that is highly complex, as it is
both directed and valued. However, some of the
following measures and visualizations require that we manipulate the data by symmetrizing it
(making it undirected), and/or dichotomizing it (making it binary). When manipulating data it is
important to consider how it may distort and simplify the data. This depends on the nature of the
data, and such considerations are therefore saved for later, when dealing with the empirical data.
Structural and locational properties
SNA involves several measures, which will help to make the theoretical framework developed in
the last chapter more concrete. Most importantly, we will discuss measures of actors’ role in the
cluster, and how to identify sub groupings in the cluster.
The structural measures, which are accounted for, can both be defined at the level of the
individual actor and they can be aggregated over all actors to obtain a group-level measure of the
structure of the network. Such group level measures are good at obtaining a standardized measure
of the cluster and can facilitate comparisons with other clusters in future studies. However, as this
is outside the scope of our thesis and the standardized actor-level measures would presumably
also be slightly different had the entire population participated, we only briefly consider such
group-level measures. In the following we first discuss different measures of actors’ centrality
(degree centrality, betweenness centrality and closeness centrality) and how active the cluster is.
Afterwards, we will investigate measures of the cohesiveness of the cluster. Please note that
further explanation of the following measures is available in appendix 3.2.

39
The most basic measure of actors’ centrality was developed by several researchers, but is usually
attributed Freeman and is also called Freeman’s degree (Wasserman and Faust 1994, Borgatti et
al. 2002). It is “…the number of ‘direct ties’ that an actor has within a network.” 19 (Quimet et al,
2004). For directed relational data, this measure covers both degree centrality and degree
prestige. Degree centrality measures how central/important the actor is, as defined by the actor’s
outdegree, while prestige measures how prestigious/important the actor is, as defined by the
actor’s indegree (Wasserman and Faust, 1994)20. What measure is best at describing the relations
of an actor depends on the nature of the network, but mostly the indegree is the most interesting
measure in directed data, as it is less subject to variance in individual actors’ choices. This is also
the case in our study as half of the actors (the non-respondents) have no outdegree, but do have
meaningful indegrees. If dichotomized, the degree measures can be standardized so that they
explain the proportion of actors in the network, an actor has direct ties to21.
Group centralization and group prestige are measures that tell us how unequal the individual
actors are to each other. The value will always be between 0 and 1, where 1 is when one actor
“completely dominates or overshadows” the other actors and 0 is when “all actors have exactly
the same centrality index” (Wasserman and Faust, 1994). Another measure also uses the amount
of direct ties between actors to give a simple overview of how active the cluster is. This is called
a network’s density and is calculated simply by dividing the number of ‘effective ties’ (actors
that are directly related) with all theoretical possible ties in a network (Wasserman and Faust
1994, Borgatti et al. 2002).
Although, the degree centrality measure gives us a good understanding of actors’ direct
connections to others, we would also like to know how important actors are when considering
also their indirect ties. The betweenness- and closeness measures explore this property of
networks22.
19 Direct ties means that only ties between to adjacent actors are counted. Indirectly (/through others), the actor may be connected to many more actors. 20 For undirected (/symmetric) relational data, there is no difference between indegree and outdegree as they refer to actor i’s column and row in a sociomatrix, respectively. Therefore, there is only degree centrality. 21 The measure is standardized by dividing the degree by (g-1), where g is the number of actors in the network. 22 The following indices can be measured similar to degree in terms of directional relations as well, but as the main purpose is to give an overview of the application and interpretation of the indices, we will only introduce them for non-directional relations here. This is the equivalent of putting together indegree and outdegree measures and only concerning oneself with degree (in a symmetrical network).

40
The degree gives us an indication of, who the ‘connector’ or ‘hub’ in the network may be.
However, this is not necessarily so, as it depends on where the connections lead to and whether
they connect otherwise unconnected actors. The betweenness measure explores exactly this, as it
captures the extent to which an actor is in a position to play an intermediary (or broker) role in a
network (Quimet et al., 2004). The betweenness of an actor is measured by calculating the
number of times the actor lies on the geodesic between two nonadjacent actors, where a geodesic
refers to the shortest path between two actors (Wasserman and Faust 1994, Borgatti et al. 2002).
If an actor has a high betweenness it means that it is in a strong position, however, it also points
towards a weakness in the network, as a very high betweenness of a single actor can represent a
single point of failure (Krebs, 2006). This is especially the case, when an actor is the only link
between separate groups of actors, which is known as a bridge (Granovetter 1973). The group-
level betweenness measure indicates much heterogeneity or variability there is among the
different actors’ betweenness (Wasserman and Faust, 1994).
Finally, the closeness centrality measure clarifies the pattern of the ties within a network by
summarizing how close an actor is to the other actors in a network (Wasserman and Faust, 1994).
It is defined as the minimum possible theoretical distance to all other actors (when an actor is
adjacent to all other actors) divided by the farness, which is the sum of the lengths of the
geodesics connecting the actor with all other actors (Borgatti, 2002). Actors with high closeness
centrality are in a good position to monitor information and knowledge flows in the network, and
are optimally suited to communicate with all other actors in the network. The group-level
closeness index measures the heterogeneity among different actors’ closeness in the same way as
the betweenness centralization index.
Taken together, the above centrality measures give us a good overview of the structural
properties of a network. It allows us to identify the most important players in the network in
terms of direct connections, in terms of bridging otherwise unconnected actors, and in terms of
monitoring and information flow.
In order to fully appreciate the structural properties of a network, we must also explore it in terms
of cohesiveness. These measures differ from centrality measures in that they search for the
existence of cohesive subgroups in the networks, instead of individual actor properties.
Wasserman and Faust (1994) define cohesive subgroups as “…subsets of actors among whom
there are relatively strong, direct, intense, frequent, or positive ties.” As we noted above, the

41
closeness centrality show us who are best connected to all actors in the network, however, many
researchers state that a reach beyond two steps (one intermediate) is not realistic without
considerable costs and information distortions (Granovetter 1973, Krebs 2006). Therefore, we
will search for cohesive subgroups within the cluster.
We start by the strongest definition of a cohesive subgroup; a clique. In a clique, all actors are
adjacent to all other actors or as Wasserman and Faust (1994) define it; “a maximal complete
subgraph of three or more nodes.” The identified cliques are interesting as collaboration and
information flows should be higher, and because of their structural robustness, which is “the
degree to which the structure is vulnerable to the removal of any given individual” (Seidman and
Foster, 1978). Due to the size of our sociomatrices, we will concentrate on identifying the largest
cliques in the network. We hypothesize that these will constitute the core(s) of the network to the
extent that the identified clique(s) consist of actors to that are central in the network as well. To
understand fully the inclusion and exclusion of actors in certain cliques, we will also search for k-
plexes, which are cliques, where the notion of adjacency is weakened by k-degrees (Borgatti et
al. 2002). Thus, a 1-plex corresponds to a clique, while a 2-plex means that actors have (at least)
direct ties to all members in the clique except one. As such, actors that are closely related to
almost all of the actors in the clique, and therefore deserve inclusion will be identified.
The notion of a clique can be further weakened, by searching for cohesive subgroups of actors
that are no more than 2 steps apart. As noted earlier, 2 steps is a meaningful cut-off, when
investigating the flow of knowledge. N-clans, or more specifically in our case, 2-clans are
cohesive subgroups of actors, where each actor is no more than 2 steps away from any other actor
in the network, using only ties inside the N-clan (Wasserman and Faust, 1994). The identification
of 2-clans thereby gives us a full overview of the realistic knowledge flows in the cluster.
In terms of knowledge flows in the cluster, we will make one final note with regards to relational
data, which is that we will use our valued data to distinguish between weak and strong ties.
Granovetter’s (1973) defines the strength of a tie as; “…a (probably linear) combination of the
amount of time, the emotional intensity, the intimacy (mutual confiding), and the reciprocal
services which characterize the tie”. We argue that the stronger defined networks will provide a
better basis for exploring the flow of innovatory ideas and knowledge flows, as strong ties in our
study imply more frequent interactions. The assertion that stronger ties imply more knowledge
sharing will be proven empirically later in our analysis, but we note here that strong ties imply

42
more frequent interaction and if the relation is personal, it should generate more emotional
intensity and more intimacy than less frequent ties (Jones et al. 2001, Quimet et al. 2004).
However, this does not mean that weak ties in the cluster should be ignored as they are very
important in creating information benefits, since they often connect otherwise disconnect parties
and therefore offer more diverse information to actors (Granovetter 1973, Burt 1992). This means
that strong ties are less likely to be bridges, as strong ties between actors imply that other ties
should be present (Granovetter 1973). This contention is empirically very well-founded
(Wasserman and Faust, 1994). For the above reasons, we will consider valued networks both in
terms of weak and strong ties in our analysis.
The above structural indices are used to get an overview of the network, and together with the
network visualizations, which will be accounted for now, we achieve a complete insight of the
structural properties of the network in question and the reason for those properties.
Network visualization
As de Nooy et al. (2005) note; “Network visualizations have been an important tool for
researchers from the very beginning of social network analysis.” Visualizations work best for
small (some dozens of vertices) to medium-sized networks (some hundreds of vertices), and as
such the network we study is a good candidate for this type of analysis (de Nooy et al., 2005).
We use network visualizations in two ways; (1) to get a visualization of the cluster as defined by
the network of relations and its structural properties as laid out above, which can further help us
in identifying and substantiating its structural properties, and (2) to be able to explore the reason
for the structural properties of the network. The latter is in fact the main objective of the
visualizations in this thesis and is accomplished by a method called partitioning, which is defined
as a “classification … of the vertices in the network such that each vertex is assigned to exactly
one class…” (de Nooy et al., 2005). The pattern that emerges can then be analyzed to see if the
chosen classification can explain the network positions of actors.
Before such partition analysis can be carried out, however, it is necessary to discuss how to
produce the visualization or the ‘graph’ of the network. A graph is defined by de Nooy (2005) as
“a set of vertices and a set of lines between pairs of vertices”. The primary concern is that the
graph should reflect the structural patterns of the network, which is a challenge due to the fact
that the sociomatrices are N-dimensional, where n refers to the number of actors in the network.

43
This N-dimensional matrix must be simplified to three dimensions or less, so we can see it in a
picture. There are several techniques for doing this, where we will focus on graph layout
algorithms (GLA) and multi-dimensional scaling (MDS).
MDS is the most commonly used technique for visualizing proximity data (similarity or
dissimilarity information for pairs of objects (Buja et al., 2004)) and was specifically developed
for such purposes (Kruskal and Wish 1978, Freeman 2004, DeJordy et al. 2006). According to
Borgatti (1997), MDS maps the actors so that those with small Euclidean distances are close to
each other. Euclidean distance, in turn, is a “distance measure of structural equivalence” for two
actors, and refers to how similar two actors are in their ties to other actors23 (Wasserman and
Faust, 1994). Furthermore, the degree to which the graphical representation captures the
properties of the input matrix or the raw data, which as mentioned earlier is N-dimensional, is
measured by the ‘criterion function’ called stress24. The accepted rule of thumb for stress values
is that values below 0.1 are excellent, between 0.1 and 0.2 are acceptable, and above 0.2
unacceptable (Kruskal & Wish 1978, Borgatti et al. 2002). There are several ways to improve the
quality of the MDS and thus reduce the stress level. Again, it depends on the nature of the
network, whether it is possible to improve the MDS as it is done by altering the input/raw data.
Most importantly, however, we will note that MDS is only possible if the matrix of input data is
symmetric, and that removing isolates from the matrices will improve the image25. The graphs
made by MDS will enable us to identify clusters of actors that are similar, and is especially good
in representing the overall structure of the network (DeJordy et al, 2006). Freeman (2004) further
supports this as he states that such visualizations of networks “displays important structural
properties” and therefore allows us to visually identify many interesting properties such as
clusters, bridges, connectors etc. For these reasons MDS images are also well suited for the
partition analysis, where we explore the reason for the structural properties of the network.
23 Please see appendix 3.1 for a simple visualization using MDS. 24 The statistic is the squared differences between the actual distance data (the raw data) and the “MDS” distance divided by the actual distances squared. This stress is zero if the MDS solution perfectly replicate the measured distances (Borgatti et al. 2002) 25 If the directionality in relations is very important it is not reasonable to make it symmetrical. Removing isolates (actors that are unconnected from the rest of the network) improves the image, because less space is spent representing such extreme outliers. Please also note that there are also two important varieties of the MDS; a metric and non-metric form. The MDS in its non-metric form usually produces a lower stress, and is the one primarily used here. For further explanation please see appendix 3.1.2.

44
However, while MDS is good at representing the overall structure of the network and the general
clustering of points into distinct clumps, the ‘local properties’ of the graph are less reliable when
there is stress26. Therefore, we will also use graphic layout algorithms (GLAs), which produce a
schematic visualization of a network based on the geodesic distance between actors. However,
GLAs use as input only binary data, and therefore only show the presence or absence of a
relation, although ties can be explored at different levels of strength according to how the data is
dichotomized. DeJordy et al. (2006) refers to this as filtering criteria, which thus decides whether
lines are drawn between nodes in the graph. As such, ties between vertices ‘locally’ in a MDS
picture, which can be potentially misleading, can be further explored in GLAs at different
filtering levels. As all the visualizations in the body of the text are done using MDS, we will not
go further into detail with GLAs here, but further explanation is available in appendix 3.3.
The network visualizations combined with the partition analysis as laid out in the beginning of
this section gives us a powerful way of identifying patterns and attributes of the cluster.
However, as several scholars point out graphical analysis is not an exact science, but needs
careful management both when producing the image and when interpreting it (Scott 2000,
Freeman 2004). As such, we will be very careful in scrutinizing the validity of the network
visualizations and the patterns that emerge from the partition analysis.
3.3.2 The impact of SNA on our empirical investigation
At this point, having a thorough understanding of both cluster theory and SNA, we can review
the earlier mentioned concepts of density, breadth and depth of the cluster and discuss the
proposed archetypes of clusters, and the identification of cohesive subgroups in a new light.
Finally, we also refer to some of the few existing cluster studies using social network analysis.
With respect to the concentration of firms and number of relations in the cluster as shown in
the model on p. 23, we can at this point make the analysis more concrete. We can find the density
of the cluster in terms of concentration of firms, by first identifying the actors that are connected
formally or informally to the network of actors that constitute the mechatronics cluster, and
secondly define the geographical scope of the cluster based on the location of those
26 DeJordy et al. (2006) explain that MDS attempts to minimize the distortion in the graphical solution “…through a least squared mechanism, which implies that (mis)placements of distant items have a greater impact on the error calculation than does the placement of near items”. Kruskal and Wish (1978) has referred to this as the better representation of the data’s ‘global structure’ than their ‘local structure’.
45
organizations. Based on this clear knowledge of the amount of firms in a geographical area, we
have a better basis for discussing whether it is a high/low concentration. The other dimension in
the model, the number of relations in the cluster is in fact, the network’s density (in terms of
direct ties). It tells us how active or inactive the cluster is or using Enright’s (1998) vocabulary;
whether it is working or latent27. As our study is pioneering in terms of the applied methodology,
we suffer from a lack of relevant benchmarks that could define the range of the two axes.
However, we note that the axes are subject to the size of the firms in the cluster, the type of firms
and organizations that are contained in the cluster, and many more factors. Therefore we evaluate
the position of the cluster in the model on such qualitative aspects as well28.
This brings us to the depth and breadth of the cluster, which we can also make more concrete, at
this point. In terms of the depth of the cluster, we can go beyond an aggregate analysis of
whether the industries are vertically integrated, and actually go inside the cluster and analyze the
existing vertical relations between cluster members. Furthermore, we can test the cluster’s
reliance on input from outside the region by comparing the relative importance of the vertical ties
within the cluster as compared to those to actors outside the cluster.
The breadth of the cluster can also be investigated in detail, as we can trace the relations
between actors on several parameters that allow us to measure the degree of commonality and
comparability across the different firms and industries contained in the cluster (e.g. inter-industry
knowledge of firms and the technological distance between firms in different industries). With
regards to the breadth of the cluster, we also remember that a cluster will have several pipelines
depending on the diversity of the cluster. To this end, we note that Burt’s (1992) social theory of
competition is based on the importance of ‘network diversity’. For Burt, increasing network size
without considering diversity can cripple a network in significant ways. Therefore, an important
part of our research should also be to establish the diversity in the pipelines to the cluster, as this
tells us whether actors’ pipelines provide different information benefits.
27 We note that from a social network perspective, there is a conceptual problem with the definition of a cluster as being latent to the extent that there has to be some relations to be perceived / identified as a cluster. 28 Density in terms of relations/actors has a natural maximum in that there is a limit to the amount of meaningful (=beneficial) relations an individual/organization can have. Naturally this has an effect on the density measure; e.g. if individuals can only have 10 meaningful relations, the density in a network of 11 persons is 1, while in a network of 20 persons, the density is .53 ((10*20) / (20*19)). As such, some normalized density formula is needed, but given the lack of benchmarks it is not possible to know the relevant weights between density and size of the cluster. A similar discussion on density in terms of firms/geography is possible, although other factors would constitute the weights.

46
We can use SNA to recognize cohesive subgroups by investigating the centrality and
cohesiveness of actors in the cluster. One of the key benefits from clusters is the proposed ability
to benefit from other cluster members’ pipelines (Bathelt et al., 2002) and Rosenfeld (1996)
indeed see this spillover process as an indicator of how well a cluster functions. To this end,
Giuliani (2005), in her study of the structure of cluster knowledge networks, concludes that a
geographically and relationally proximate cluster does not necessarily translate into a pervasive
and collective network of knowledge flows. Instead Giuliani (2005) finds that, while business
interactions may be pervasive and collective, knowledge flows are uneven and selective. She
argues that so-called ‘knowledge networks’ will form in cliques among “cohesive subgroups of
firms” and firms with similarly strong knowledge bases. Furthermore, the firms with strong
knowledge bases, and thus high absorptive capacity, are most likely to have significant pipelines.
To this end, we also note that Quimet et al. (2004) have found that a high degree centrality in
general means that the actor in question has access to more diverse knowledge and this should
raise the organizations’ ability to innovate. This means that there might be distinct subgroups
within the cluster, which exchange knowledge flows, but this may not diffuse throughout the
cluster. We should also expect spin-offs, and firms with a high degree of worker movement
between them, to be structurally closer to each other according to Breschi and Lissoni (2000)
findings.
We may also consider Markusen’s (1996) archetypes of clusters, where we would expect actors
to have different centrality and cohesiveness in different clusters. A Marshallian district would
have a dense network of ties both formal and informal, and furthermore have low centrality,
betweenness and closeness indices. On the other hand a hub and spoke district in its hub form
would have very high centrality indices as one or a few firms would act as hubs, while in its
nucleated form it could eventually resemble a Marshallian district. A state-anchored industrial
district would also have high centrality indices, but here the central actors would be public
organizations instead of firms. Finally, we would expect a very sparse network in the Satellite
platform district.
As already mentioned in the methodology section, we have structured our empirical investigation
in accordance with the research questions, and therefore especially chapters 6 and7 concerning
the composition of actors in the cluster and their network positions contain many of the above
models and considerations.
47
4 Introduction to the mechatronics cluster The purpose of this section is to introduce the reader to the mechatronics cluster and our
empirical investigation. First, the reader will be introduced to earlier mechatronics cluster studies
and their main findings. This will give the reader a preliminary understanding of the cluster, but
also an understanding of the aspects of the cluster that have- and have not been investigated in
prior studies. This is a natural first step, as we take certain aspects of prior studies as given as
they are outside the scope of our own empirical investigation. In the second section, the reader
will be introduced to our own empirical investigation. In particular, we discuss how our study
differs from prior studies and give an overview of the composition of actors in the population and
in the sample. Finally, this section gives an outline of the following empirical analysis.
4.1 Prior studies
Several studies of the cluster or the region have been made prior to ours. We have here focused
on three of the newest and most comprehensive studies. IBM’s (2003) study is a comparative
study of the mechatronics cluster in Southern Jutland to similar clusters in Helsinki, Stuttgart and
a number of other places. Monitor Group (2004) was engaged by Danfoss to identify clusters in
Southern Denmark. This was done mainly to turn around the negative development Southern
Jutland was going through, and thereby ensure that Danfoss also in the future would have access
to talented engineers (Søndergaard 2006). Finally, COWI (2006) investigated more qualitative
aspects of the cluster, such as how important the cluster is to cluster members. Due to page
constraints we will not go through these studies in detail, but on the next page we present the
most important strengths, weaknesses, opportunities and threats, which were identified through
an extensive analysis of the prior studies (available in appendix 4.1).
The earlier studies find that although the mechatronics cluster is reasonably large, low levels of
regional competition exist, which may be due to the relatively wide breadth compared to the
absolute size of the cluster. In addition, prior studies have identified few formal relations inside
the cluster. This is mainly because local firms are not keen on sharing information, which could
be explained by a lack of social capital. The consequence of this is, that although innovation is
deemed important within mechatronics, cluster membership does not provide companies with
particular knowledge sharing benefits - at least when it comes to formal relations. Since existing
studies have only attempted to identify formal relations inside the cluster, it is unknown whether
the companies rely on actors outside the cluster, knowledge spillovers or internal knowledge for

48
idea generation and development issues. Therefore, uncovering “global pipelines” and potential
“knowledge spillovers” in the mechatronics cluster will provide a more complete picture.
As is evident from the above SWOT-analysis, prior studies have revealed much information on
the frame conditions of the mechatronics clusters today and have to some extent revealed the
importance of the region to its members. However, they have failed in addressing issues
important to this thesis, such as; what the appropriate boundary specification of the cluster is (not
merely an aggregate concentration measure, but based on relations between firms and
individuals), what the composition of the actors that constitute the core of the mechatronics
cluster is, what the different roles of cluster members are and whether there are any structural
patterns within the cluster as defined by cluster members formal and informal ties. Also, the
functional boundary of the cluster has not been explored properly; so far the industries that
constitute the mechatronics cluster have been identified through location quotients, and have
been brought together based on expert opinion and not detailed input-output analysis.
Furthermore, it still remains to be explored whether and to what extent relations exist between
firms in the cluster and especially across industries. Along similar lines the geographical
boundaries should also be questioned. Especially, because there was a strong representation of
actors from the new Sønderborg municipality in the COWI study, which suggests that the heart
of the mechatronics cluster is located in this region. Finally, a more complete picture of the
relations will tell us how well the mechatronics cluster functions and at the same time reveal
what potential areas of improvement there might be.

49
4.2 Our study
In this section, we will briefly summarize how the focus of our study differs from the prior
studies. Next we will define the scope of the cluster as we define it in this study, and discuss the
limitations of our study in that we only have data from a sample of the total population in the
cluster. Finally, we will give a brief overview of the actors in our sample and in the total
population and we close the chapter with an outline of the following empirical analysis.
4.2.1 The focus of our empirical investigation
It is clear that our study differed substantially from prior studies of the cluster. The prior studies
define well the characteristics of the cluster at an aggregate level and its context in terms of factor
conditions. However, the dynamics within the cluster are largely unknown as illustrated in the
figure below, where the relations between cluster members are only vaguely revealed.
As such, both our theoretical perspective on clusters and the analysis of prior studies on the
mechatronics cluster show that there is a lack of empirical focus on the dynamics within the
cluster and the resulting benefits that accrue to cluster members. However, our study
preconditions knowledge of the factor conditions and a general idea of the characteristics of the
cluster. Therefore, we use the insights from prior studies to define the cluster in a very strict
manner, which is necessary given our methodological approach to the empirical investigation.
4.2.2 The scope of the cluster studied
In line with our data collection method, we need to determine the population of the network
under study and find its boundaries. In identifying the scope of the cluster, we may start by
applying Laumann et al.’s (1989) ‘realist’ approach, which focuses on actor set boundaries and
membership as perceived by the actors themselves. In terms of the mechatronics cluster, most of

50
the organizations in the ‘mechatronics workgroup’ perceive themselves as part of the cluster29.
However, as clusters need not be formalized, this can be seen as the strictest definition of the
cluster. On the other hand, Laumann et al’s (1989) ‘nominalist’ approach to boundary
specification is based on the theoretical concerns of the researcher, and thus the actors in the
network do not need to perceive themselves as a social entity. In accordance with this, the
boundary of the cluster is defined by its geographical scope and its scope in terms of
competencies fitting the ‘mechatronics’ definition. Monitor Group’s study of the region fits this
category and the identification of 1,200 organizations in the cluster may therefore be seen as a
relaxed definition of the cluster. We are interested in a more relevant boundary specification
between these two levels.
We will base our further boundary specification on expert opinions and on the quasi-relational
data already acquired through the COWI (2006) study. Primarily, the cluster members in our
survey have been selected based on the expert opinion of CEO of Center for Erhvervsudvikling
Hans Martens, who has been involved in several studies on the cluster and is the chairman of the
mechatronics workgroup. As such, Hans Martens is seen as a reliable source. The list of firms
given to us by Hans Martens contains 51 firms, but does not include the institutions in the
mechatronics workgroup, which have thus been included (see appendix 4.2.2).
The COWI study focused on 260 firms, which the Center for Erhvervsudvikling (CfE) selected
from the 1,200 firms identified by the Monitor Group. According to Hans Martens from CfE, the
aim was that they should represent different company sizes and be dispersed throughout Southern
Jutland and Funen. These 260 organisations were sent an electronic questionnaire and 59
organizations replied. We will analyze the COWI data to see whether there are any organizations
that should be included in our study based on how active they are in the cluster. Especially,
question 37 and 38 in the COWI study are used as proxies for the relevancy for organizations
chosen in our study as compared to the COWI study30. Question 37 and 38 ask the respondents to
rate how much interaction the firm has with different organizations in the region in its idea
creation (Q. 37) and in its R&D and commercialization process (Q. 38). As such, these questions
are an indication of the dynamics between organizations in Southern Denmark. Based on this
29 As we will return to later, a few of the members are only in the workgroup, because the group needed some ‘outside input’ at the beginning of the cluster initiative. See appendix 4.2.1 for an overview of the workgroup. 30 Although, the COWI study only deals with the cluster at an aggregate level, we have been given access to the original data from respondents, which enables us to check each respondent’s answers to these questions.

51
analysis, which can be reviewed in appendix 4.2.3, we find that six organizations stand out with
significantly higher scores in terms of collaboration and have therefore been included in our final
population, which is then comprised of 59 firms and 6 institutions.
There is still a lack of knowledge on the exact boundary of the cluster, and Wasserman and Faust
(1994) also note that; “…network studies of actors such as … inter organizational networks …
have less well-defined boundaries”. To this end, it should be noted that network researchers often
define boundaries based on “the relative frequency of interaction, or intensity of ties among
members as contrasted with non-members”31 (Wasserman and Faust 1994). However, knowledge
on the relative frequency of interaction and the intensity of ties between actors is ex-post
knowledge in our study. In fact, our preliminary boundary specification here can be viewed as the
beginning of a snowball network sample32, as we in our empirical research ask respondents to
nominate five of their ‘most important’ customers, suppliers, competitors and cooperative
partners irrespective of their geographical location. Snowball network sampling is used in several
applications when the boundary is unknown (Wasserman and Faust 1994), however, in our study
we primarily use this information to evaluate the relative importance of the ties within the cluster
compared to ties to actors outside the cluster. This means that the cluster as it is defined at this
point may contain more actors than the social network of the mechatronics cluster supports, but it
may also lack actors that could be identified through a more extensive snowball network
sampling. Due to the constraints with regards to time and access to empirical data, we in this
study assume that the 65 organizations in our study contain all the most relevant potential cluster
members. This is seen as a relatively fair assumption given that we have based the selection of
the organizations on the expert opinion of the director of the mechatronics workgroup and on the
findings of prior studies33.
31 As noted earlier, this boundary specification of a network is very close to Enright’s definition of a working cluster. 32 According to Wasserman and Faust (1994) a snowball network sample begins “…when the actors in a set of sampled respondents report on the actors to whom they have ties of a specific kind.” The nominated actors constitute the “first-order” zone of the network, and this process is then repeated so that the actors in the first-order zone nominate actors that then constitute the “second-order” zone. This snowballing proceeds through several zones. 33 Other researchers may follow up on our study, which would be interesting both for the purpose of more correctly defining the boundaries of the cluster, but as the cluster (and any network) is continuously evolving it would be more interesting as a longitudinal study of the evolution of the cluster; its boundaries and the structural variables in it.

52
4.2.3 Sampling
Another limitation of the empirical investigation is that not all the organizations we have
targeted, have participated in our study. As a consequence of the extensive preliminary work, as
discussed in the methodology nearly half of the targeted organizations participated in our study.
However, a sample of 49.2% still leaves out much data. In terms of the relational data, this is
easy to show; as 32 organizations participate in our study, we have data on 1984 possible
relations (32 times 64). The total amount of possible relations are 4160 (65 times 64), and
therefore, we have knowledge of 49.2% of the relations34. However, as we will touch upon later,
it is in some cases reasonable to assume reciprocity in relations35, which means that it is fair to
symmetrize the data (make it undirected). In these cases we have data on 74.6% of the relations36
(see also appendix 4.2.4). Furthermore, our sample can also be argued to be above 50% as
several potential respondents stated as reason for their non-participation that they had no
connections to anyone in the geographical area concerned or that they were not part of any
cluster. In the same train of thought, participation in our study can also be seen as an
organization’s commitment/enthusiasm about the cluster and thus of their membership in the
cluster. As such, the sample from the total population of 65 organizations is not a random sample,
but meaningful in the sense that these are presumably the ones most committed to the cluster.
4.2.4 The empirical data
As we noted earlier, 65 organizations have been included in our study as they are seen as the core
of the mechatronics cluster. The figure on the next page displays an industry breakdown of the 65
organizations that were included in the study as well as the 32 organizations that chose to
participate. From the figure it is clear that among the 65 organizations there is an overweight of
firms from NACE codes 29 (manufacturers of machinery and equipment) and 31 (manufacturers
of electrical machinery and apparatus). However, when considering only the 32 organizations
that chose to participate, the picture changes, as the response rates for each ‘group’ of
organizations differ a lot. With a response rate of only 16% firms in NACE code 29 are not well-
34 The formula is a variant of the density formula, which is used to measure how many ties exist in a network. However, here we use it simply to show how many of the possible relations we have knowledge of. As such, it does not matter if there in fact is a tie between actors or not, as long as we have access to the knowledge. 35 Reciprocity refers to the case in which “…whenever ‘i’ chooses j, then j also chooses i…” (Wasserman and Faust, 1994). We dedicate a considerable amount of time an effort in testing the validity of assuming reciprocity for the relational data in our study. We explain the results and implications of these tests later. 36 All relations; 65*64 = 4160. Originally known relations (32 respondents*64actors) + assuming reciprocity (33non-respondents*32 respondents) = 3104. 3104/4160*100 = 74.6%.

53
represented in our study. On the other hand, the high response rates of firms in NACE codes 31
together with 72 (manufacturers of firms within computer and related activities) and 00
(various)37 cause them to constitute the majority of respondents in our sample. With respect to
absolute size, our focus of “only” 65 firms means that it is a fairly small cluster if this
specification of the cluster is found to be correct.
0
1
1
1
4
5
5
12
3
2
4
4
4
4
7
7
14
19
Participants
Non-participants
Participants
Non-participants
Response rate according to NACE codeNumber in brackets indicates NACE code
Manufacturers of machinery and equipment (29)
Manufacturers of electrical machinery and apparatus (31)
Computer and related activities (72)
Various (00)
Membership organizations (91)
Manufacturers of medical, precision and optical instruments, watches and clocks (33)
Manufacturers of radio, television, communication equipment and apparatus (32)
Manufacturers of fabricated metal products (28)
Education (80)
The distribution of the sample (the 32 participants in the study), compared to both the total
population (the 65 firms) and the mechatronics cluster in Southern Denmark as defined by earlier
studies can be seen in the figure on the next page. Obviously, the total population does not
exactly reflect the composition of the industries in Southern Denmark. Since the total population
has been selected on the basis of expert opinion it does not make sense to calculate the statistical
significance of the deviation. It is on the other hand interesting to explore the deviation between
the total population and the sample, since this is important for our ability to draw conclusions for
the total population. To this end, we find that NACE codes “29” (manufacturers of machinery
and equipment) and “31” (manufacturers of electrical machinery and apparatus) display
statistically significant deviations from the expected participation rate (see appendix 4.2.5). One
possible explanation for the observed deviation is that the response rates might be interpreted as
an indication of organizations’ membership in the cluster, at least in terms of interest and
openness towards developing the cluster. The high response rate of firms within NACE code
37 As noted in our methodology section, NACE code “00” has been established to ensure confidentiality and as it consists of diverse firms it naturally effects our ability to draw conclusions on behalf of its constituents

54
“31” points in the direction that the constituent firms see themselves as members of the cluster,
while the opposite is true for firms within NACE code “29”.
6%
0%
48%
13%
3%7%
22%
12%
7%
32%
24%
7% 7%
12%
18%
4%
11%
43%
4% 4%
18%
"00" "28" "29" "31" "32" "33" "72"
Southern Denmark Study sample Study Participants
Distribution of firms according to NACE codesNumber in brackets indicates NACE code
6%
0%
48%
13%
3%7%
22%
12%
7%
32%
24%
7% 7%
12%
18%
4%
11%
43%
4% 4%
18%
"00" "28" "29" "31" "32" "33" "72"
Southern Denmark Study sample Study Participants
Distribution of firms according to NACE codesNumber in brackets indicates NACE code
It is also useful to get an overview of the geographical distribution of the organizations. To this
end, we note that 54 of the 65 organizations are located in Southern Jutland, with the highest
concentration being in the surrounding area of Sønderborg. This is true for both the total
population and the sample. The fact that very few organizations from outside the Southern
Jutland area have participated in the study, suggests that the cluster might indeed be centered in-
and around Sønderborg.
In the empirical investigation, the organizations’ geographical distribution and industry codes
along with several other measures will be compared to their network positions in order to specify
who the central actors in the cluster are.
Finally, we note that the network positions of actors is derived from respondents’ answers to the
‘roster’ section of the questionnaire, which consists of 6 questions; first, we ask respondents to
nominate those firms, they have knowledge of and rate this knowledge from ‘basic’ to ‘very
deep’. As a ‘basic’ knowledge of the existence of another organization is a precondition for any
contact (organizational or personal) and any perceived technological distance, we only ask
respondents to rate their frequency of contact and the perceived technological distance on
organizations they have knowledge of. Finally, we ask respondent whether they use their

55
personal contacts for sparring for business purposes and what the purpose of their organizational
contact is. The prerequisites of questions are summarized in appendix 4.2.6.
4.2.5 Outline of the empirical analysis
The empirical investigation is structured into three stages in accordance with our three research
questions (see figure below). We first answer how important are relations inside the cluster in a
larger context by investigating the attributes of the respondents’ ‘most important’ customers,
suppliers, competitors and cooperative partners. This gives us an indication of the significance
and importance of the ties inside the cluster as compared to those outside the cluster. As such, we
are able to perceive the following analysis, which only considers the dynamics within the cluster
in a greater context. In the second stage, which thus deals only with the 65 organizations in our
study, we dichotomize the cluster into two groups according to their centrality in terms of their
organizational and personal ties to other cluster members. This allows us to answer important
questions regarding the density of the cluster and its breadth and depth. Furthermore, it gives an
understanding of the attributes of the actors in the cluster. Finally, we analyze the network
positions of cluster members in more detail, as we investigate the organizational and personal ties
in the cluster separately. This allows us to investigate the purpose and use of these ties, and any
structural patterns within the cluster. As such, this analysis fuels our discussion on the breadth
and depth of the cluster, but also allows us to characterize the cluster in accordance with, for
instance, Markusen’s (1996) archetypes.
The above structure is logical in the sense that it goes deeper and deeper into the complexity of
the cluster, and each preceding stage gives the reader the necessary understanding to appreciate
the analysis in a larger context.

56
5 The importance of the cluster in a larger context We now turn to the analysis of our own empirical investigation. In this chapter we deal with the
first research question and we thus seek an understanding of the overall importance of the actors
and ties within the cluster as compared to outside. To answer this research question we will
investigate the cluster members’ affiliation to the region compared to actors outside the region.
More specifically, we will deal with the ‘free recall’ section of our questionnaire, where we ask
respondents to nominate their ‘most important’ suppliers, customers, competitors, and
partnerships. The nomination of the ‘most important’ business ties’ is based on the respondents
individual opinion; however, to test their selection criteria they are asked about various aspects of
the nature of the business ties; the geographical location, duration of relationship, frequency of
contact and whether the traded good is standardized or customized38. In the following, we will go
through these four categories of actors in turn.
5.1 Customers
With regards to respondents’ most important customers, we see that 61% are located outside
Denmark (see also appendix 5.2). Only 8% are located in the cluster region (the area between
Als, Rødekro and Tinglev) and 16% in Southern Denmark (Southern Jutland, Funen). This
resembles the figures obtained in the COWI (2006) study and suggests that firms in the cluster
are internationally competitive39. This can either be attributed to competencies within the firms or
to benefits accruing to the firms based on their location in the cluster. If the latter is the case, this
would suggest that firms’ competitiveness stems from process- or product innovations, as
knowledge accumulation is seen as the main benefit from clustering40.
78% of the nominated customers are contacted either on a daily- or a weekly basis, and the same
proportion of customers receives customized products. This high frequency of contact and
customization strongly suggests that customers are a source of knowledge transfers. Furthermore,
38 Monetary value is presumably one of the most important factors for nominating a business relation. We have not included value in the survey as firms are not likely to disclose such information and therefore may choose not to participate in the study at all on those grounds. At the same time such information may be timely to obtain for the respondents, which might also affect the respondents’ attitude towards participating in the study. 39 Firms’ are found to be competitive as 93% of the companies’ important customers have been customers for more than 3 years and almost half of them for more than 10 years, indicating that they can compete over the long run. 40 Firms could also compete on low-cost or best-value proposition seeing that Southern Jutland has a very strong cost/quality mix in comparison to other European mechatronics clusters (IBM 2003). However, as many of the firms compete with manufacturers from very low cost countries it seems unlikely that the firms compete on cost alone.

57
92% of the customers in Southern Denmark are contacted either on a daily- or a weekly basis and
they receive customized products 86% of the time. As such, this is evidence that local customers
are even more important as sources of knowledge. According to theory, this would be attributable
to the existence of social capital, however, COWI (2006) found firms in the region not to be
open, which indicates that important knowledge is not shared, despite frequent contact.
Looking at the geographical distribution of customers by industry reveals that firms in NACE
codes 00 (various) and 72 (computer and related activities) have nominated a large share of
customers in Southern Denmark. The main reason for this seems to be that these firms are for the
most part young and small and have not yet managed to become internationally competitive. In
contrast, firms in NACE code 31 (manufacturers of electrical machinery) nominate only 1 (out of
39) customer located in Southern Denmark, indicating that these firms are very international.
5.2 Suppliers
As with the customers, the respondents’ most important suppliers are also mainly located outside
Denmark, further underlining the sample's international focus. More accurately 51% of the most
important suppliers are located outside Denmark, whereas 6% are located in the cluster region
and 19% are located in South Denmark41 (see appendix 5.3). Furthermore, only one of the
nominated suppliers is one of the 59 firms in the core of the cluster as defined in our study. This
could be interpreted as a lack of depth in the cluster; however, we must note that there may be
many vertical relations still, as only the ‘most important’ relations have been identified.
Breaking the findings down by industry reveals that especially firms in NACE codes 29
(manufacturers of machinery and equipment), 00, and 72 have nominated suppliers from South
Denmark. We concluded above that the two latter have a national/regional focus, based on the
location of their customers, and the overrepresentation of local suppliers consequently support
this finding. The firms in NACE code 31 again have a large amount of suppliers located outside
South Denmark, which was also the case for their customers.
The perceived importance of both supplier and customer relations is clearly a function of the
length of the relation, since many customer relations and even more supplier relations are more
than 5 years old. The reason for this could be that suppliers and customers become more vital to
41 The 19% include the 6% that are located in the cluster region.

58
the business as the traded products become increasingly customized, which is supported by the
relatively high level of customization.
Finally, cluster theory predicts ease of communication with actors inside the cluster. However,
looking at frequency of contact reveals no significant difference between suppliers located in
Southern Denmark and those outside. Approximately 85% of the suppliers are contacted daily or
weekly and there is a large share of customized products. The fact that most of the important
suppliers are located outside the cluster suggests that the cluster might suffer from a lack of
depth; however, it can also be viewed positively when considering the supplier relations as global
pipelines. Theory predicts that clusters can gain from global pipelines, provided that internal
linkages allow for the filtering and diffusion of obtained knowledge. To this end, we also note
that both customer and supplier relations outside the cluster are very diverse, which is positive as
it means that different knowledge flows into the cluster. This diversity is most probably a
function of the breadth of the cluster and later we investigate whether the cluster is too broad to
diffuse this knowledge optimally.
5.3 Competitors
Looking at the geographical distribution of competitors supports the international profile of the
respondents as 64% of respondents’ most important competitors are located outside Denmark
(see appendix 5.4). A small Danish home market as well as the close proximity to Germany can
have been important factors in causing many of the firms to internationalize. However,
considering only the nominated competitors in Southern Denmark, which in total account for
14% of the most important competitors, we see that 72.7% of these are located within the cluster
region42. This means that by far the most of the cluster firms’ ‘most important’ competitors that
are located in Southern Denmark are concentrated within the cluster region (an area roughly
equal to Southern Jutland). As Southern Jutland represents only 20.5% of the employment in
Southern Denmark this certainly suggests that there is an overrepresentation of competitors in the
cluster region as compared to Southern Denmark43. This concentration of competitors within the
cluster region supports a stricter geographical boundary specification. However, in total, only
10% of all the nominated competitors are situated in the cluster region and this does imply that
42 8 competitors are mentioned, which are situated in Southern Jutland (Area between Als, Rødekro and Tinglev), while 3 are mentioned, which are situated in Southern Denmark (outside Southern Jutland; 8/11 = 72.7% 43 According to Monitor Group (2004) South Jutland represents 4.8% of total employment in Denmark and Southern Denmark represent 23.4% (4.8/23.4 = 20.5%).

59
regional competition levels are rather low. This negatively affects the capacity for knowledge
spillovers through observability and comparability which in returns limits pressure and the
capability to upgrade and innovate.
Again, we note that firms in NACE code 00 and 72 have a substantial amount of competitors in
Southern Denmark, which supports previous findings of competition in these groups to also be
regional/national level44. In contrast, the firms in all the other NACE-codes have together only
nominated 5% of competitors situated in Southern Denmark, which suggests that, most cluster
members compete mainly on an international scale.
As firms in the cluster compete on an international scale it is interesting to note that none of the
nominated international competitors (e.g. ABB, Siemens, York, SKF and Liebherr) have
established themselves in the cluster region. There are many possible reasons for this; the region
might not marketed well enough; it may not be the cluster, but firms’ internal competencies that
make them competitive, or the participants in our study, with their average size of 100
employees, might cater to international niche markets, and their large international competitors
may follow a different strategy which does not build on factors present in Southern Denmark.
However, in line with prior studies, we must also note that the poor frame conditions in the
cluster region work against such relocation. Furthermore, the limited pool of workers in the
cluster region would most likely not be able to absorb the pressure that would arise if one of
these large companies were to move substantial parts of their business to the region. This is a
significant downside and challenge for the cluster, with respect to marketing and future growth.
5.4 Cooperation
The limited level of intraregional competition leaves room for cooperative agreements between
the firms. In contrast to the other business ties, a substantial share of the cooperative relations is
with partners in the region (see appendix 5.5). More specifically 45% are in Southern Denmark,
and 80% of these are within the cluster region. Furthermore, 73% of the cooperative relations
within the cluster region are with one of the 65 firms in the total population. This implies that
both the geographical scope and the organizations included in our population cover well the
cooperative relations in the cluster. Still, 55% of the nominated cooperative partners are located
44 In NACE code 00, 33% of the mentioned competitors are located in the region and in NACE code 72, 31% of the competitors are located in the region.

60
outside Southern Denmark. These can be viewed as important pipelines and can according to
cluster theory provide benefits for the cluster members given relations inside the cluster are
substantial enough for the diffusion of the acquired knowledge to take place.
As shown in the figure here, almost half of all cooperative relations revolve around development
programs. The fact that co-operation on development is so popular stresses the importance of
innovation for mechatronics firms, which is in line with COWI’s (2006) findings (appendix 4.1).
Co-operations according to purposePercent
0%
10%
20%
30%
40%
50%
60%
Development Sharedmarketing
Sharedtraining
Sharedpurchasing
Employee-sharing
Other
Purpose of all cooperations
Purpose of cooperations in Southern DenmarkPurpose of cooperations outside Southern Denmark
Co-operations according to purposePercent
0%
10%
20%
30%
40%
50%
60%
Development Sharedmarketing
Sharedtraining
Sharedpurchasing
Employee-sharing
Other
Purpose of all cooperations
Purpose of cooperations in Southern DenmarkPurpose of cooperations outside Southern Denmark
The second most frequent type of cooperation (except ‘others’) is employee-sharing, which is the
outcome of a CI dating back approximately 3 years. Employee-sharing increases the usage of
certain skilled labour, which cannot be put to use optimally in only one organization, but also
works to promote social relations between firms as employees build networks in the companies
they work for, which in turn can be used for knowledge sharing and problem solving.
It is interesting to note that only two of the firms in the sample share marketing with other firms
in the region and none cooperate with regards to purchasing. The fact that the majority of firms in
the sample are international and operate in different industries may explain why there is limited
shared marketing and -purchasing. However, both types of cooperation should be possible, as the
firms are related through their affiliation to mechatronics. Thus, it is likely that they could
promote their products on their combined attributes, and to the extent that they use similar input
material, they could also use their combined purchasing power to their advantage.
Finally, we note that 88% of all co-operations are less than 5 years old, and almost half of these
are less than 2 years old. This suggests that although firms in Southern Denmark are perceived to

61
be closed and not willing to share knowledge, it appears as if they are going through a process of
opening up and sharing knowledge and resources with other firms; a tendency that should be
nurtured in the future. It is likely that the formalization of the cluster can be ascribed an
important role in this process, for instance through the above mentioned employee sharing
program, but also through meetings and other CIs.
5.5 Conclusion on the importance of the cluster in a larger context
Based on the expert opinion of the director of the mechatronics workgroup and the participation
rate in earlier studies, we know that there is a relatively strong support for the CI in Southern
Jutland, which was also reflected by the geographical profile of the sample in our study. We
found further support for Southern Jutland (the cluster region) as a geographical boundary in the
high concentration of respondents’ most important cooperative partners in this region. On the
other hand, very few of the respondents’ most important customers, suppliers, and competitors
are located in the cluster region or even in Southern Denmark. This very clear distinction
between cooperative ties and the other business ties is readily observable from the following
figure, which shows the geographical location of the nominated actors.
Firms are internationally competitive, which can be ascribed either to their location in the cluster
or competencies inside the firms. Although, cluster members are internationally competitive,

62
their international competitors do not locate in the region. We imagine this is due to a lack of
marketing, but even more so, the lack of factor conditions in the region, and possibly that the
cluster is not functioning efficiently and therefore does not generate benefits to its members. This
means that growth will have to come from inside the cluster, at least in the near future.
Based on this chapter and our review of existing studies we also conclude that there are low
levels of competition within the cluster, presumably due to the cluster’s breadth compared to its
absolute size. Still, we must acknowledge that 10% of nominated competitors are inside the
cluster region, which compared to its absolute size is a significant amount. To this end, firms
within NACE codes 72, and 00 compete more locally than most other firms, while especially
firms in NACE code 31 are very international.
Few of the most important customers and suppliers are located within the cluster region. This
does not bode well for the amount of vertical linkages inside the cluster, but does reflect that
there are many diverse global pipelines from/to the cluster. Whether this knowledge is diffused
throughout the cluster is one of the questions that will be answered in the following analysis.
Finally, we see that there are many cooperative ties within the cluster region and the majority of
these have been established within the last 5 years. This indicates that cluster members are
opening up towards each other, which is presumably an effect of the recent CIs.
In conclusion, we know that there is a larger concentration of especially competitors, but also of
customers and suppliers than what the employment in Southern Jutland merits. However, given
the concentration of mechatronics firms, this is only a validation of the findings from the Monitor
2004) study. Although, there is a lack of benchmarks, we would expect a higher concentration of
the ‘most important’ vertical and competitive ties in a cluster. In fact, the concentration of the
cooperative partners seems more in line with what could be expected. The high level of
cooperation relative to the business ties also indicates that the cluster build upon comparable
competencies, however, this cannot be said with certainty as the dynamics within the cluster are
still unknown.

63
6 The composition of actors in the core of the cluster We now have an understanding of how important the cluster is to its members, which gives us a
general context in which to place the following analysis, which deals only with the 65
organizations in our study. In this chapter, we will analyze the attributes of the actors in the
cluster, which answers important questions regarding the concentration of firms, the breadth of
the cluster and whether it is working or latent according to Enright’s terminology. First, we
introduce the cluster as a social network of formal and informal ties, and then we analyze the
attributes of actors.
6.1 The cluster as a social network
The purpose of this section is to arrive at a visualization of the cluster as a social network of
formal (organizational) and informal (personal) relations. Therefore, we start by reviewing the
relational data on personal and organizational contact, and consider the manipulation of the data.
6.1.1 Data on organizational ties
29 organizations responded to our question on the degree of contact between organizations,
which is equivalent to 44.6% of the total population. However, a relation such as contact between
organizations is by nature symmetric and it is therefore reasonable to assume reciprocity, which
raises the level of data available to 69.7%45. We have tested the legitimacy of this assumption on
the data available by analyzing the degree of reciprocity in respondents’ answers regarding their
mutual relations. As can be seen in appendix 6.1.1, 71% of the time respondents agree on
whether there is a relation or not. When respondents disagree, they do so especially, when one
respondent says there is a weak tie to the other (as compared to when there is a strong tie
involved). This means that in 80% of the cases, where there is a disagreement between
respondents answers it involves ‘only’ a weak tie, which is defined as contact ‘seldom’ or
‘sometimes’. The reason for the discrepancy between respondents’ answers is presumably due to
respondents’ inability to oversee all ties to other organizations, and that the importance of a tie
varies from organization to organization mainly as a function of an organization's overall number
of ties. In any case, we need to deal appropriately with possible dissimilarities when
45 Contact is by nature symmetric as actor i cannot be in contact with actor j, unless j is in contact with i. Therefore, the only data we do not have access to is the relations between non-respondents, which account for 30.3% of the possible ties in the network, please refer to section 4.2.3 and appendix 6.1.1 for explanation and calculations.
64
symmetrising the data. In the case of dissimilarity in the values set by two respondents regarding
their mutual relation, we thus take the average value when symmetrising as this gives us the best
measure of their mutual relation, given that all respondents have equal credibility and
importance. However, when symmetrising between respondents and non-respondents, the best
measure of their relations is seen as the value set by the respondent. Although it might overvalue
these relations in some cases, it would obscure the picture more if instead taking the average. In
this manner, we have a fairly certain picture of the important relations between respondents and
non-respondents, although non-respondents might have more relations to respondents than
apparent from our sample, in that reciprocity in relations does not hold all the time. However, it
is a greater concern that the possible ties between non-respondents are unknown. We assume that
no relations exist, but it is very likely that this is not always the case. To the extent that non-
respondent do have relations with each other it is especially the ‘location’ of peripheral non-
respondents, which is uncertain, as they may form in groups or clusters of their own.
Assuming reciprocity naturally has an effect on the data. In appendix 6.1.1, the consequence of
the manipulation on actors’ degree centrality is reviewed. Both before and after the data
manipulation, there is an overweight of participants in the top 30 most central actors. The data
manipulation does change actors’ ranking so that respondents are generally ranked higher, but
this is an unavoidable effect of the data manipulation. However, especially the strong ties
between actors (those that have contact often or very often) are almost identical before and after
the manipulation. The above suggests that the data manipulation gives us a symmetric graph,
which ensures the validity of actors’ ties by averaging their answers, and allows us to rank both
respondents and non-respondents in a meaningful way46.
6.1.2 Data on personal ties
The data, we have, on personal contact is only a very small part of all the personal relations in the
cluster. Specifically to this question 25 individuals responded, while the total size of the cluster
consists of more than 12,521 individuals or more than 78 million possible ties47. Of course such a
study is not feasible in terms of data collection and would even pose problems in terms of
46 However, the manipulation will obscure the picture, when a respondent has a higher than average outdegree to non-respondents as compared to respondents, because the symmetry-procedures are different. 47 The possible number of ties in a network of 12,521 actors is 12,521 times 12,520, which is 156,762, 920 relations. Assuming symmetry the number of relations is halved and thus equals 78,381,460 relations. Even assuming that all actors only have 5 personal contacts each, there would still be 62,605 direct relations.

65
analyzing it with the available software today. Coincidentally, our perspective of clusters as a
social network argues for the significance of relations between decision making agents as it is
reasonable to assume that higher level employees have a more direct impact on an organization’s
strategic direction and knowledge accumulation than lower level employees do. In line with these
considerations, 17 CEOs, 7 managers, and one secretary responded to our question on the
existence and strength of personal ties within the cluster. Thus, the respondents should give us a
meaningful interpretation of the personal network of higher-level managers and CEOs in the
cluster. As was the case with organizational relations, it is reasonable to assume reciprocity in
personal relations, and this raises the level of data to 64.4% of the possible relations in the
network. However, it should be noted that because we have asked respondents whether he/she
had a personal relation to anyone in organization X, the reciprocity in relations occur on an
organizational level, while respondents answers are at an individual level. In terms of reciprocity
in relations, we note that 68% of the time respondents’ agree on whether there is a relation or not
(see appendix 6.1.2). When making the data symmetrical, we are interested in the best possible
measure of the degree of personal relations between two organizations and therefore it makes
sense to take the average of the two respondents answer if they differ48. That is, we symmetrize
the data in the same way as we did with the organizational ties.
The consequence of the data manipulation can be assessed in appendix 6.1.2. There are greater
differences between respondents’ perception of the same tie on an organizational level, which is
why there is slightly greater variation between respondents’ indegree and outdegree than in the
organizational network. Most importantly, we must note that 13 of the 20 most central actors are
respondents before the manipulation, while 18 of the 20 are respondents afterwards49. This is a
clear distortion of the original data and implies that some non-participants are presumably ranked
lower than they really should be. It also means that some of the very prominent non-participants
based on the original data are ranked lower as a consequence of the data manipulation. The
prominent non-participants are 29.18 (Danfoss), 29.14 (Sauer Danfoss), 32.2 (Mærsk Data
Defence), 80.2 (SDU Odense), and the participant 31.1050. These are all large organizations,
48 Although two respondents’ answers with regards to their personal ties to anyone in the other organization might not refer to the same individual relation, an aggregation of these answers given that all respondents have equal credibility and importance must necessarily be an average of the two. 49 While non-participants have the same degree before and after the symmetry procedure, participants’ indegree become equal to their outdegree, which raises their ranking considerably (non-participants’ outdegree is zero). 50 Please note that we cannot reveal the identity of participants in our study.
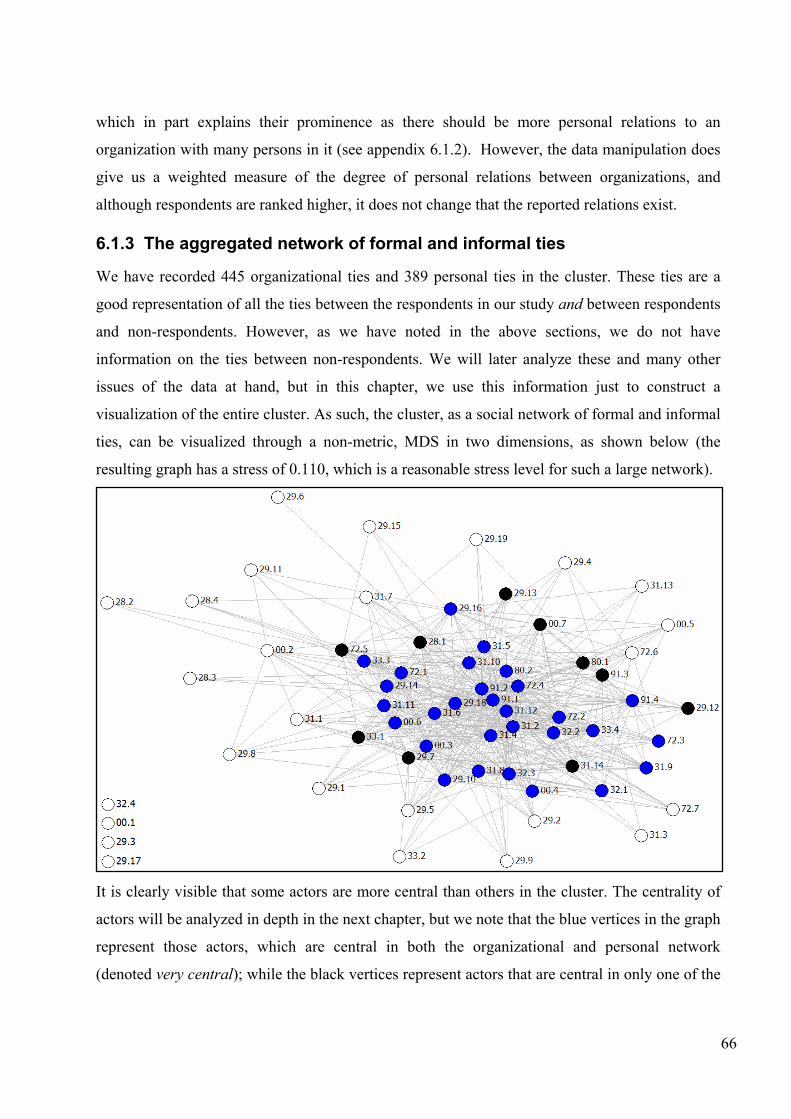
66
which in part explains their prominence as there should be more personal relations to an
organization with many persons in it (see appendix 6.1.2). However, the data manipulation does
give us a weighted measure of the degree of personal relations between organizations, and
although respondents are ranked higher, it does not change that the reported relations exist.
6.1.3 The aggregated network of formal and informal ties
We have recorded 445 organizational ties and 389 personal ties in the cluster. These ties are a
good representation of all the ties between the respondents in our study and between respondents
and non-respondents. However, as we have noted in the above sections, we do not have
information on the ties between non-respondents. We will later analyze these and many other
issues of the data at hand, but in this chapter, we use this information just to construct a
visualization of the entire cluster. As such, the cluster, as a social network of formal and informal
ties, can be visualized through a non-metric, MDS in two dimensions, as shown below (the
resulting graph has a stress of 0.110, which is a reasonable stress level for such a large network).
It is clearly visible that some actors are more central than others in the cluster. The centrality of
actors will be analyzed in depth in the next chapter, but we note that the blue vertices in the graph
represent those actors, which are central in both the organizational and personal network
(denoted very central); while the black vertices represent actors that are central in only one of the

67
two networks (denoted central). Finally, the white vertices represent actors that are not central in
both the organizational and the personal network (denoted peripheral). The four ‘isolates’ in the
left corner have very few and weak ties to the rest of the cluster (32.4 has no ties), and it
therefore improved the image to not include them in the original MDS, which is why they have
been inserted manually afterwards. We use this representation of the cluster to distinguish
between central and peripheral actors in the cluster. Therefore, we will at this point not go further
into the network positions of actors, but simply note that we can dichotomize the cluster into
central and peripheral actors.
A good starting point for our analysis is to get an overview of the network positions of the
participants in our study. We earlier noted that we had a participation rate of 49.2%, and at this
point we see that more than 80% of the participants (26 out of 32) are central actors in the cluster
(see graph below). This tells us that the data we have is mainly on the relations and attributes of
actors’ in the core of the cluster. Besides the 26 participants, the core of the cluster also includes
13 non-participants, which gives a total of 39 actors that are central in the cluster.
In the following, we focus on the attribute data we have on the actors in our study, but also take
into consideration the relational data on respondents’ knowledge of the other organizations in the
cluster and their perceived technological distance. On this background, we will then clarify the
geographical scope of the cluster, and discuss the density of the cluster, both in terms of
Colors
Participants
Non-participants Shapes
(Circle) Very central actors
(Diamond) Central actors
(Triangle) Peripheral actors

68
concentration of firms and in terms of relations between cluster members. Finally, we investigate
the composition of the labor pool in the cluster and how to grow the cluster in the future.
6.2 Knowledge of organizations
A good starting point for our analysis of the dynamics within the cluster is to get an overview of
the cluster members’ knowledge of each other. This will give us a preliminary understanding of
the centrality of actors and the breadth of the cluster, but it will also substantiate our earlier
contention that participation in the study is an indication of actors’ membership in the cluster.
We use the original data on knowledge of organizations in the following analysis, as it is not fair
to assume reciprocity51. The outdegree thus measures how well respondents know the other
cluster members and as respondents are for the most part central actors, it is mainly the central
actors’ knowledge of other organizations we study (see appendix 6.2.2).
The indegree, in turn, is a measure of the prominence of organizations and we find that none of
the 65 organizations are completely unknown to the respondents (see appendix 6.2.3). In the
below graph, actors have been partitioned according to how many respondents know them.
From the perspective that knowledge of an organization is a precondition for any formal or
informal ties, it is not surprising that it is mainly the central actors in the cluster, who know each
51 While contact by nature must be reciprocated, knowledge is to a very high degree only directional; e.g. most firms in the region know who Danfoss is, but Danfoss does not have knowledge of all the other firms.
Colors
More than 90% of the respondents know the actor
66-90% of the respondents
40-66% of the respondents
Below 40% of the respondents Shapes
(Circle) Very central actors
(Diamond) Central actors
(Triangle) Peripheral actors

69
other. However, we further note that the very prominent organizations are mainly firms in NACE
code 31, along with Danfoss (29.18), Sauer-Danfoss (29.14), SDU Odense (80.2) and the
membership organization CfE (91.1), which are all known by more than 90% of the respondents.
Furthermore, around 20% of the respondents have a deep knowledge of the latter four, and
Danfoss is the only organization, which is known by all respondents. We will later investigate the
consequence of this high centrality and prominence in terms of knowledge of a few actors. On
the other hand, there are organizations which may not be part of the cluster due to their
anonymity. In particular, there are 11 firms, which are known by less than 33% of the
respondents. None of the organizations are completely unknown, which is positive, but we shall
later see whether the actors that are known by few are relevant to actively target in future CIs.
We have earlier hypothesized that firms’ willingness to participate in our study could be taken as
an indicator of firms’ enthusiasm about the cluster and arguably of firms’ membership in the
cluster. At this point, we can test this hypothesis empirically. As is already apparent from the
above graph, most of the well-known actors are central in the cluster, and we know that most of
these are participants in our study. More specifically, however, we can test how many of the most
well-known actors (top 30 in indegree) are participants in our study. To this end, we see that
more than 70% of the actors, which respondents have a deep knowledge52 of are participants in
our study (see also appendix 6.2.4). Keeping in mind that 49.2% of the total population
participated in our study, we can see that there is a fairly strong correlation between actors’
prominence and their participation in our study. This clearly shows that there is a strong
relationship between participants in our study, which supports our earlier hypothesis that
participation is an indication of membership in the cluster.
The reason why participants have deep knowledge of other participating organizations can also be
attributed to the fact that many of the participants in our study are members of the mechatronics
workgroup. This implies that they meet once every 1-4 months if they attend all workgroup
meetings. Clearly, this raises the knowledge of the other participating organizations, and thereby
works to promote collaboration and knowledge sharing between them. Evidence of this is found
in the fact that 16 of the 22 mechatronics workgroup members are very central actors in the
52 Deep knowledge is defined as having a ‘good’ or ‘deep’ knowledge of an organization, whereas weak/superficial knowledge is defined as merely knowing an organization by name or knowing its general business area.

70
network of formal and informal ties, 4 are central actors, and finally only 2 workgroup members
are peripheral; 00.5 and 31.1353 (see graph 1 in appendix 6.1.4).
Another factor that has an impact on organizations’ prominence in the region is the size of the
organization. In the following diagram, the correlation between the size of an organization and its
prominence (ranking in terms of indegree) is shown.
Correlation between Indegree and size of organization
-300
-100
100
300
500
700
900
1100
1300
1500
1 4 7 10 13 16 19 22 25 28 31 34 37 40 43 46 49 52 55 58 61 64
Ranking
Empl
oyee
s
Basic
Deep
Linear tendency
We see that a few very large organizations are known by most of the respondents, and although it
is not a linear trend it does not change the fact that the cluster, and the workforce in the region, is
strongly exposed to a few large firms. We note that total employment in the 65 organizations is
12,521, which represent 71% of total employment in the mechatronics firms in Southern
Jutland54. Of the 65 organizations, Danfoss, Danfoss Drives and Sauer-Danfoss, which are all
very prominent actors, represent around 58% of total employment (7,258 employees). In total, 9
firms have more than 200 employees, and these firms represent 78% of employment in the total
population (9,806 employees). In addition to this 18 firms employ between 50 and 200
employees, and 32 firms have less than 50 employees, which due to their small size together
employ only 834 people. For this reason public officials in the region react seriously to the news
of some of these firms considering moving. In addition, if these firms hold local supplier- and
customer relations it is clear that the effect of them moving out of the region will be magnified.
Another aspect of this is that the dominating position of a few large firms suggests that the cluster
53 00.5 was only a member in the beginning of the CI to “give input from outside, while the respondent at 31.13 has only participated in two meetings, over a year ago, and did not see himself as a member of the workgroup. 54 Since 54 of the organisations in the sample are located in Southern Jutland we find this to be a more meaningful proxy than the total employment in the South Denmark mechatronics cluster, which is 47,544 (Monitor 2004).

71
might be a variant of the hub-and-spoke cluster type. We will return to these issues in the next
chapter, when investigating the formal and informal relations in the cluster in more depth.
Finally, we note that in terms of industry groupings, the three very large firms, Danfoss (4,200
employees) and Sauer-Danfoss (2,100 employees) are part of NACE code 29, while Danfoss
Drives (950 employees) is part of NACE code 31. By investigating the knowledge of
organizations according to these NACE codes, we note that cluster members’ basic knowledge of
each other transcends industry groupings, which indicates that the current breadth of the cluster
might be sustainable (see appendix 6.2.6). However, in terms of respondents’ deep knowledge it
is mainly the membership organizations (91) in the cluster that are known, and very few
respondents have a deep knowledge of firms in NACE code 28. This indicates that firms in
NACE code 28 (manufacturers of fabricated metal products, except machinery and equipment)
are not members of the mechatronics cluster, which also seems fair in that the technological
content seems distant from ‘mechatronics’55. We will investigate the breadth of the cluster in
more detail in the next section.
In this section, we have proven that the assumption of participation in our study as an indicator of
membership in the cluster is fair. Furthermore, we have found that the cluster, and the workforce
in the region, is strongly exposed to a few large firms, which are central in the cluster. These
firms, along with the universities and membership organizations are the most well-known actors
in the cluster, while several small- and medium-sized firms are unknown to many and may not
benefit from being members of the cluster. In particular, firms in NACE code 28 are unknown to
many, but otherwise the functional breadth of the cluster seems appropriate.
6.3 Technological scope of the cluster
In this section, we further investigate the breadth of the cluster. First, we investigate the
composition of industry groupings in the centre of the cluster and how it has evolved over time,
and next, we investigate the technological distance between cluster members in terms of
comprehensibility and interest in peers’ technologies.
55 We note that 28.1 is central in the network of formal and informal ties in the cluster. This actor was included in this NACE code for confidentiality purposes, but is a manufacturer of rubber and plastics products, specialized in designing plastic solutions for industrial products.

72
In terms of the historical roots of the cluster, the diagram here (see also appendix 6.3.1) tells us
that the manufacturers of fabricated metal products (NACE code 28) and manufacturers of
machinery and equipment (29) on average are the oldest firms in the cluster. However, firms that
are more than 50 years old are mainly located in NACE code 29, which strongly suggests that the
clusters’ foundation is within machinery and equipment. As the years go by we see that other
fields are added to this base within machinery and equipment; first electrical machinery (31),
then radio, television, communications (32), medical, precision and optical instruments (33) and
recently firms within computer and related activities(72). Finally, the support organizations have
all been established very recently in connection with the CI.
0 5 10 15 20 25 30 35 40
*28*
*29*
*31*
*32*
*33*
*80*
*00*
*72*
*91*
NA
CE
code
Average age of organizations in NACE code
Est. Less than 5 years ago
Est. Between 6 and 10 years ago
Est. Between 11 and 25 years ago
Est. Between 26 and 50 years ago
Est. more than 50 years ago
When examining the network of formal and informal ties in the cluster according to these
industry groupings, (see graph 2 in appendix 6.1.4) we see that today manufacturers of electrical
machinery and equipment (31) make up the core of the cluster. These firms are almost as old on
average as firms in NACE code (29), and as many of the central actors within this NACE code
are spin-offs from Danfoss (29.18), this seems to be the direction that the cluster has taken over
the years. Furthermore, most firms in NACE codes 32, 33 and 72 are also central actors. In
contrast, the firms in NACE codes 29 and 28 are almost exclusively peripheral actors; the only
very central players in NACE code 29 are Danfoss and Sauer-Danfoss along with 29.10 and
29.16, while the only firm in NACE code 28, which is central, is a manufacturer of rubber and
plastics products. Finally, we note that the only firms more than 50 years old that are very central
players in the cluster today are Danfoss and Danfoss Drives, which is a clear testament to
Danfoss’ importance in the region (see appendix 6.3.1).
We will substantiate the above findings in the following, when investigating the boundary of the
cluster based on firms’ technological base. To this end, we have asked respondents to rate how

73
understandable and interesting the technology in the other firms is. In dealing with technological
proximity it is again not fair to assume reciprocity56, and we therefore analyze the data in its
original form. We start by identifying firms with technologies that are distant and
incomprehensible and afterwards investigate those that are comprehensible.
We again start by identifying, who the respondents are that have rated many firms’ technologies
incomprehensible (outdegree). We already know that most of the participants are central actors in
the cluster, and the respondents to this question follow the same pattern. There are 16
respondents that have stated from 1-34 firms, whose technologies are distant and
incomprehensible to them, while 5 respondents stated that none of the firms they knew of had
incomprehensible technologies (see graph in appendix 6.3.5). Besides the two respondents with
the highest outdegree, all other respondents have a central position in the network of formal and
informal ties. This strongly indicates that the two actors with the highest outdegree that are
peripheral in the cluster (72.6 and 31.7) are technologically very distant from the core of the
mechatronics cluster, and also means that other firms’ technologies should be incomprehensible
to more/other than these two firms before it has any significant meaning (thus, firms technologies
must be ‘distant’ to more than 10% of the respondents (2 out of 21) to be of any consequence).
To this end, the following graph shows the firms with technologies that are incomprehensible to
the respondents as well as the two peripheral respondents with high outdegrees.
56 This is because a respondents’ understanding or interest in another firm need not be reciprocated by that actor.
Colors
33% or more of the respondents do not understand the actor’s technology
25-32% of the respondents
20-24% of the respondents
10-19% of the respondents
Below 10% of the respondents or institutions
Respondents’ with highest outdegree

74
First, we note that 7 firms have technologies that are distant and incomprehensible to more than
one-third of the respondents, and 6 of these are peripheral actors. This strongly indicates that
these firms are too distant from the core of the cluster to gain any significant advantages from
being members of the cluster. Furthermore, we see that there is a clear overweight of firms in
NACE code 29 that have distant and incomprehensible technologies, and most are peripheral
actors. This strongly indicates that firms in NACE code 29 (except for Danfoss (29.18), Sauer-
Danfoss (29.14), and a few others) have technologies that do not merit their inclusion in the
cluster. This is clear evidence of a large gap between these firms and the core of the cluster, and
we also suspect that the firms in NACE code 29 have less interest in the CI as many of them are
non-participants in our study. However, exactly because they are non-participants, we do not
know whether they have ties with each other, which would suggest that there exists a separate
subgroup consisting of many of these firms. Whether this should be seen as part of the
mechatronics cluster would then depend on the cohesiveness between this subgroup and the
already identified core of the cluster. For instance, the central non-participants in this industry
grouping; Danfoss and Sauer Danfoss may be in contact with them. Because of the lack of data,
we cannot determine this with certainty in the present study, but we will later investigate the
degree of intra-industry ties, which will give further clues as to the soundness of this hypothesis.
Furthermore, we note that all the organizations that have been included in our study have been
chosen based on expert opinions and the findings in prior studies, and this does suggest that the
many firms in NACE code 29 should have some relevancy to the cluster.
To further decide the technological focus of the mechatronics cluster, we look at firms’
prominence in terms of ‘understandable and interesting technologies’. We deal with the same 21
respondents as with incomprehensibility, however, while only 16 respondents stated there were
firms with incomprehensible technologies in the cluster, 20 respondents knew firms with
understandable technologies (see graphs in appendix 6.4.5). We will again first clarify; which
respondents understand and are interested in the technologies in other firms in the cluster, and
next investigate those firms, whose technologies are understandable and interesting to the
respondents. The respondents that find the most firms’ technologies uninteresting are 00.4, 29.10,
and four manufacturers of electrical machinery and apparatus (31), and these are all very central
actors in the network of formal and informal ties. The respondents finding many firms’
technologies interesting are also mostly very central actors and mainly firms in ‘72’, ‘31’, as well

75
as 28.1. As such, the answers of these actors are an indication of the technological scope and
interest of the core of the cluster.
Before turning our attention to the respondents’ choices (actors’ indegree), we will make one
final note on the distribution of respondents answers to this question. The 21 respondents, who
have responded to the question on technological distance (both incomprehensible and
understandable technologies) have in total made 745 nominations (see appendix 6.4.2). 48% of
these nominations are regarding understandable technologies, and a further 25% are both
understandable and interesting. Finally, 27% are firms with incomprehensible technologies. This
tells us that even if most firms’ technologies are understandable, the majority of respondents do
not find their peers’ technologies interesting. Furthermore, the proportion of incomprehensible
technologies is fairly high considering that respondents were only asked to rate firms they had a
basic knowledge of. Clearly, these are very distressing indications of the health of the cluster,
and represent important challenge that must be overcome in future CIs. It also suggests that the
existing functional boundaries are not as appropriate as we first assessed based on the knowledge
of organizations in the cluster.
To identify the technological core of the cluster, we will now turn our attention to the
identification of firms with understandable technologies. To this end, we see that there is a high
correlation between the size of an organization and its rated technological prominence (see
appendix 6.4.3). This tell us that the largest companies are those that have the most
understandable and interesting technologies. Our earlier analysis showed that the large firms are
also well-known in the cluster, which is presumably because they are successful businesses, and
also more prominent in the media. We expect this is also the reason why actors’ understand and
are interested in their technologies, even though they probably have very advanced and complex
technologies. This strongly suggests that knowledge of organizations is important, not only as a
first step in building relations, which we discuss later, but also in terms of raising the
comprehensibility and interest in other firms’ technologies.
We also see a very strong pattern in terms of the industry groupings, which we have worked with
so far. More specifically, we see that NACE code 31 contains by far the most firms with
interesting technologies to all the other industries in the cluster (see appendix 6.4.4). This is a
very strong indication of the technological focus and direction of the cluster, and is also in line
with our earlier finding that manufacturers of electrical machinery and equipment (31) take on

76
central positions in the cluster. Firms in NACE code 72 are also found interesting by many
although only by firms from NACE codes 31, 32, and 33 (and 72). Furthermore, respondents
from NACE code 72 are also interested in other firms’ technology, which indicates that these
actors are open to insights from other industries. Unfortunately, the same is not entirely true for
respondents’ in NACE code 31, who are mainly interested in technology in their own industry.
Finally, we can identify the individual firms that have the most interesting technologies.
However, in this analysis, the technological prominence is calculated as nominations divided by
respondents, who know the actor in question (i.e. X respondents are interested in actor j divided
by X respondents who know actor j). Thereby the direct effect of basic knowledge (and thus size)
of organizations is taken out (see below graph). We see that the only firms that have technologies
that are interesting to more than 40% of the respondents who know them are Danfoss (29.18) and
Cabinplant (29.11). Furthermore, Eegholm (00.3) along with four manufacturers of electrical
machinery have interesting technologies to more than 30% of the respondents who know them.
Clearly, the three actors that are not central in the cluster as it is now, but have interesting
technologies should be actively targeted in a CI. It seems that the reason why these firms do not
occupy central positions in the cluster is mainly that many firms do not know them (only 6 actors
know 31.3, and 9 actors know 29.11). To this end, all of the firms with interesting technologies
could be used as case studies to attract outside firms to the region, but also to make cluster
members aware of the interesting technologies that are accessible if they open up to each other.
Colors
Above 40% of the respondents are interested in the actor’s technology
30-40% of the respondents
20-30% of the respondents
10-20% of the respondents
Below 10% of the respondents or institutions
Respondents with outdegree above 30%
Outdegree 20-30%

77
Finally, we note that the four actors in the graph that are interested in between 20-30% of the
other cluster members’ technologies, also have interesting technologies to between 20-30% of
respondents, who know them. This suggests that these actors should both be able and willing to
engage in an open environment of knowledge sharing. This is also true for the two respondents
with a technological interest in above 30% of the cluster members, but there is a lack of interest
in their technologies.
In this section, we first found that the historical roots of the cluster lies with Danfoss and other
manufacturers of machinery and equipment (NACE code 29). However, this has since changed,
as the cluster has moved away from this relatively ‘low-tech’ industry into especially
manufacturing of electrical machinery and equipment (31). Actors within this industry grouping
dominates the core of the cluster today and furthermore have technologies that are found more
interesting than any other industry grouping in the cluster. There is also evidence of firms within
computer and related activities (NACE code 72) to be both interested in others’ technologies and
have technologies that are interesting to many. This is seen as an important trade as this indicates
that they are ready to engage in an open environment of knowledge sharing.
However, industry groupings cannot tell the whole story, and when identifying the individual
firms that have interesting technologies, it became clearer, which actors in particular had
interesting technologies. Three actors with interesting technologies are at present not central
players in the cluster and therefore these and others could be used as case studies to raise the
interest in the cluster externally as well as internally in the cluster. The need to raise interest and
knowledge of organizations in the cluster is in line with the fact that a major threat to the future
growth of the social network in the cluster is the low interest in peers’ technologies.
Finally, we found that most firms in NACE code 29 have technologies that are incomprehensible
and distant to many of the firms in the core of the cluster. We hypothesized that these firms may
form a cohesive sub group, which could be connected to the core of the cluster through Danfoss,
which is also in this industry grouping. For now, however, we conclude that the
technological/functional scope of the cluster does not include many of the firms in NACE code
29. Furthermore, we found in the last section that firms in NACE code 28 are generally unknown
to many, and as they are also fairly distant from a technological perspective this industry
grouping seems outside the scope of the cluster, as well.

78
In the next chapter, we investigate the purpose and use of the ties in the cluster, which will
substantiate our knowledge on the breadth (and depth) of the cluster as found in this section.
6.4 Geographical scope of the cluster
At this point, we have a good understanding of who the central actors are and of the functional
breadth of the cluster. We can therefore turn to an investigation of its geographical boundaries.
One of the main concerns of any CI is how to grow the cluster and to this end a clarification of
the geographical scope of the cluster will indicate where to target firms that meet the relevant
functional breadth. Furthermore, the analysis of the geographical scope of the cluster will enable
us to better evaluate whether the cluster is dense or sparse in terms of the number of
organizations in the geographical area. Finally, we will also consider the density of relations,
which enables us to determine the cluster’s location in the ‘density model’ (p. 24).
Already prior to our investigation, there was general agreement that Sønderborg and Nordborg
made up the core of the cluster, which was also reflected in the geographical location of our total
population and the sample (p. 57). At this point, we can compare actors’ geographical location
with their centrality, and thereby further identify the geographical scope of the cluster. To this
end, we note that app. 74% of the central actors in the cluster are located either in Sønderborg (24
out of 39) or in Nordborg (5 out of 39) (see appendix 6.5.4). The remaining 10 actors in the core
of the cluster are from different cities near Sønderborg such as Gråsten and Sydals, but four
actors are situated on Funen, more specifically, Odense, Faaborg and Søndersø, which suggests
that Funen could be seen as part of the clusters’ geographical scope as well.
Central actors
Peripheral actors
Geographical distribution
SøSønderborg
NordborgNordborg
SydalsSydals
ÅÅabenraaRødekroRødekro
OdenseOdense
Gråsten
Faaborg
Søndersø
Central actors
Peripheral actors
Geographical distribution
SøSønderborg
NordborgNordborg
SydalsSydals
ÅÅabenraaRødekroRødekro
OdenseOdense
Gråsten
Faaborg
Søndersø
0001
0000111
0222
5
1110
1111
111
2122
0924
0 5 10 15 20 25 30
BillundBroagerEsbjergFaaborgHøjbjergHaarby
PadborgRandbølGråstenSydals
SøndersøTønder
OdenseRødekro
AabenraaNordborg
Sønderborg

79
From the above distribution of central actors in the mechatronics cluster, we see that many of the
actors that are around 45 minutes drive from Sønderborg (those situated in Rødekro and
Aabenraa) are split between central and peripheral actors (see appendix 6.5.5). Further exploring
this 45 minute boundary, we see that those situated more than 45 minutes away; in Tønder (00.2
and 28.2), and all those from Mid- and Northern Jutland; 28.4 (Billund), 00.1 and 29.11
(Esbjerg), 29.3 (Højbjerg), and 29.17 (Randbøl) are peripheral actors. This is a clear indication
that these areas are outside the geographical scope of the cluster; more generally, we note that the
geographical location of actors clearly has a very large influence on their centrality in the
network of formal and informal ties between firms. Therefore, we do not support an active
targeting of firms so far from the epicenter of the cluster as Funen, although the existing relations
should of course be maintained. On the other hand, it is also not sufficient to just locate within
close distance to Sønderborg, as we identify 12 actors situated in this region, which are peripheral
actors in the cluster. As could be expected, more than half of these are manufacturers of
machinery and equipment (NACE code 29).
Whether this is a sparse or dense cluster is hard to estimate due to the lack of benchmarks57, but
from prior studies we know that there is a larger than national average of mechatronics firms in
the Southern Jutland. However, only 38 organizations in Southern Jutland are central actors in
the cluster, which tells us that it is not a large cluster in absolute terms, and we also know that
labour- and real estate costs are low, which according to theory would be driven up by centripetal
forces if there was a large concentration of firms in a small geographical area. Therefore, we
characterize the mechatronics cluster in and around Sønderborg and Nordborg as a modestly
dense cluster.
With regards to the density of relations between cluster members, we note that the aggregated
network, which we have worked with in this chapter, has a density of only 27%. This means that
there are only 556 formal or informal ties out of 2,080 possible ties58. We note, however, that we
do not have information regarding the mutual ties between non-respondents. If we assume the
same density for these relations, the density is as shown in the below diagram instead 35% (see
57 Comparison with other clusters is possible, but the range of different clusters both geographically and in terms of number of firms (and size of firms) is very wide. Therefore, similar clusters such as the mechatronics clusters in Helsinki, Stuttgart, or Stockholm would make better comparisons. However, a similar analysis is needed to appropriately define the boundaries of the clusters and the observed density, which is outside the scope of this thesis. 58 65 actors can have direct ties to 64 other actors (65*64 = 4160), and as we treat contact as being symmetrical, this translates into 2080 possible ties (4160/2)

80
also appendix 6.1.3). Considering only the 39 central actors in the cluster and their mutual ties,
we see a density of 56% or the equivalent of 61% if all data was there. Finally, considering only
the 29 very central actors, we observe a density of 62% or the equivalent of 68%59. This means
that we have a relatively dense network of formal and informal ties between the 29 core actors in
the cluster. Coupled with the physical proximity between these actors this should allow for
frequent face-to-face contacts, which fosters trust. Also, it should increase the ability to monitor
and learn from others’ mistakes, paving the way for knowledge spillovers (Maskell 2001).
0% 10% 20% 30% 40% 50% 60% 70% 80% 90% 100%
29 very central organizations
39 central organizations
65 organizations
Formal or informal ties Knowledge of organizations Unused potential
As earlier mentioned, knowledge of organizations in the cluster is an important first step in
building up relations. To this end, we see that the density of knowledge of organizations in the
cluster is observed to be 30% or the equivalent of 45.5% (see appendix 6.2.1). Considering, only
the 39 central actors in the cluster, we see a density of 53%, or the equivalent of 70%, and the
network between the 29 very central actors has a density of 58% or the equivalent of 76% if we
had all data. Again, the latter two corrected densities are presumably closer to the ‘real’ densities.
Of course, knowledge of organizations is higher than the contact between cluster members, but it
should be much higher; especially the fact that central actors do not know all of each other is
very unfortunate. The above graph reflects well the large unused potential for building up
relations between the 65 organizations in the cluster, and even between the 29 most central
actors.
We conclude that the cluster is rather latent terms of the density of relations, as two-thirds of the
actors are not directly connected. In the next chapter, we will substantiate this finding, as we
59 The latter two corrected densities are presumably very close to the actual densities if we had all data, as the assumption that as many mutual ties exist between core non-respondents as between other actors in the core is fair. On the other hand, the corrected density of the entire network is presumably an overvaluation of the ties between peripheral actors.

81
investigate the ‘strength’ of the contact between persons and organizations, which ranges from
‘seldom’ to ‘very often’. Furthermore, an absolute size of 65 organizations means that the cluster
is relatively small, and some of the 65 actors are even very doubtful members of the cluster.
Therefore, the below density model communicates a need to include more firms in the cluster
(absolute size) and to expand the cohesiveness of the social network (relations).
In terms of the concentration of firms, we see that 29 central actors in the cluster are situated in
Sønderborg or Nordborg, which is a fairly dense concentration. However, there are only 35
central actors in Southern Jutland, and 39 central actors when including Funen. As such, the
concentration of firms does raise some concern (see model), and we do see a need to increase the
concentration of firms. However, because of the large physical distance between Funen and the
centre of the cluster in Sønderborg, we do not support and active targeting of Funen in future CIs.
At this point, we have a good understanding of the functional and geographical breadth of the
cluster, and we have established that there is a need to grow the cluster both in terms of firms and
in relations between those firms. Accordingly, we in the following discuss these issues, and also
discuss the important role of the institutions in the cluster.
6.5 Cluster growth
In this section, we analyze organizations’ age and genealogy to identify any problem areas in
terms of growing the cluster and hypothesize on the source of future growth.
Already, we know from the prior studies that the region at present is not sufficiently attractive to
exert a pull on firms from outside the cluster. Therefore, we will here mainly focus on sources of
growth from inside the cluster. A good starting point for this analysis is to investigate the amount
of new firm creation in recent years. To this end, we note that one-third of the organizations in

82
the cluster have been established within the last 10 years, and more than one-sixth (18.5%) within
the last 5 years (see appendix 6.6.1). Unfortunately, this is slightly misleading in terms of new
firm creation as 3 of the 12 organizations established within the last 5 years are institutions, and
three of the firms are spin-offs from Danfoss. Furthermore Delfi Electronics, although listed in
this group, is really a much older company, but was acquired in 2001 and subsequently changed
its name. As such, there are actually only 5 firms (8.5%) in the cluster aged less than 5 years.
Given the poor frame conditions in the area, earlier studies established that growth in the cluster
should come predominantly from internal growth. Therefore, the lack of new firm creation is a
concern and suggests that entrepreneurial conditions should be improved in order for the cluster
to grow (at least in terms of new firm creation).
We can also identify those industry groupings, which from a cluster growth perspective seem
most promising. Based on the figure on page 75, we see that firms in “computer and related
activities” as a group represents the youngest population of firms with an average age of 12
years. Many of the firms in this group are aged between 6 and 10 years, which means that most
were established in the IT hay-days in the late 1990s, while no new companies have been
spawned since. In contrast, firms in NACE code 33 are mainly between 26-50 years old, but
recently there has been a surge of new firm creation. The two largest groups of companies in our
study; firms in NACE code 29 and 31 are those with the oldest average populations, 34 and 30
years respectively, however, both groups display a large variance with respect to firm age.
Therefore, based also on the general position of the industry groupings in the cluster, we expect
especially firm creation in NACE codes 31, 33 and 72 to dominate the cluster in the future. On
the other hand, firms in NACE code 28, besides being mostly peripheral actors are also more
than 25 years old and firms in NACE code 32 are all more than 10 years old, which suggests that
these industries are not a source of growth in the cluster in terms of new firm creation (this is
supported by Monitor’s (2004) findings, see appendix 4.1.3).
In terms of growing the cluster through new firm creation, it is also possible to trace the
genealogical structure of the cluster. To the extent that the future replicates the past, we can
therefore identify the source of new firm creation. As the following figure shows, none of the
respondents pointed to technology developed at a university or in another company as the reason
for their start-up. In line with this, COWI (2006) and URS (2005) also concluded that the
relationship between companies and universities in the region is poor and that universities are
hardly ever used for innovation purposes. Instead, it seems that the cluster firms’ initial business
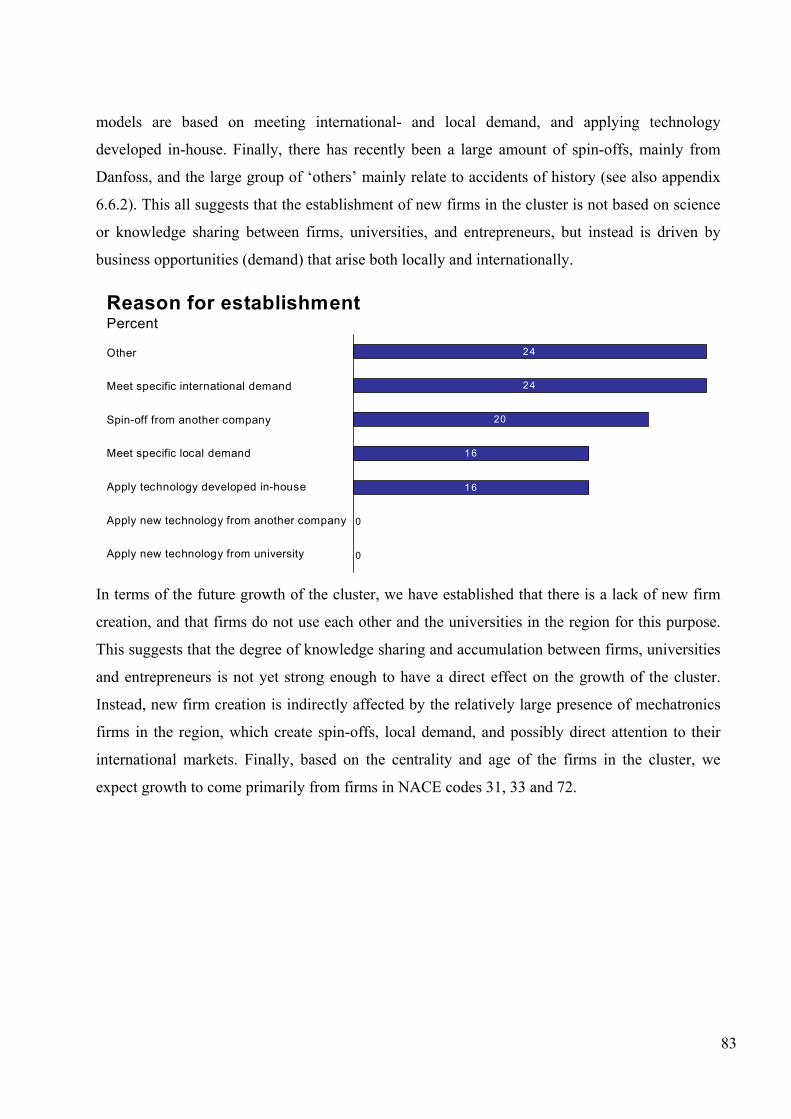
83
models are based on meeting international- and local demand, and applying technology
developed in-house. Finally, there has recently been a large amount of spin-offs, mainly from
Danfoss, and the large group of ‘others’ mainly relate to accidents of history (see also appendix
6.6.2). This all suggests that the establishment of new firms in the cluster is not based on science
or knowledge sharing between firms, universities, and entrepreneurs, but instead is driven by
business opportunities (demand) that arise both locally and internationally.
1 6
1 6
20
24
24
0
0
Reason for establishmentPercent
Other
Meet specific international demand
Spin-off from another company
Meet specific local demand
Apply technology developed in-house
Apply new technology from another company
Apply new technology from university
In terms of the future growth of the cluster, we have established that there is a lack of new firm
creation, and that firms do not use each other and the universities in the region for this purpose.
This suggests that the degree of knowledge sharing and accumulation between firms, universities
and entrepreneurs is not yet strong enough to have a direct effect on the growth of the cluster.
Instead, new firm creation is indirectly affected by the relatively large presence of mechatronics
firms in the region, which create spin-offs, local demand, and possibly direct attention to their
international markets. Finally, based on the centrality and age of the firms in the cluster, we
expect growth to come primarily from firms in NACE codes 31, 33 and 72.

84
6.6 The labor pool in the cluster
The purpose of this section is to investigate the mobility of the workforce in the cluster, which
will help in assessing the degree of knowledge transfers as well as any problem areas with
regards to the availability of labor. Finally, we will also touch upon the effect of workforce
movement on actors’ position in the cluster. We mainly deal with the respondents in our study,
but also discuss issues concerning the entire work force60.
First, we look at the respondents’ affiliation to the region, which tells us that among these highly
skilled people, there is a strong tendency to go elsewhere for education and job, which is in
accordance with Monitor Group’s (2004) findings (see appendix 6.7.1). We also note that no one
has come to the region for educational purposes, which is unfortunate with respect to growing the
work force by attracting or just keeping young talent in the region. In response to this, the cluster
members and the Mads Clausen Institute at the University of Southern Denmark are putting a lot
of effort into improving the educational environment in the region.
In terms of the work mobility of the respondents, we note that more than two-thirds had their
education and first job outside the region, and more than half have worked outside South
Denmark in at least one of their last three jobs (see appendix 6.7.1). This suggests that the
respondents are highly mobile. At this point, we wish to further clarify whether respondents have
also had work experience within the cluster region and to what degree this affects their ties
within the cluster. First off, we note that ten respondents have had their first job in the region and
as expected Danfoss seems to be the main employer in the region as it accounts for 60% of
nomination (see appendix 6.7.2). Furthermore, half of the respondents have worked for at least
one of the 65 organizations in one of their last three jobs61. This is a rather high percentage and
points in the direction that worker movement might on a personal level provide valuable ties
between firms. This is also evident when considering the centrality of the actors in the cluster,
where we see that none of the peripheral respondents have worked for one of the other 65
organizations prior to his/her current position, while 25% of the respondents that are central, and
65% of those that are very central has (see graph 3 in appendix 6.1.4). Thus, these findings are a
testament to the power of worker movement in establishing contacts between organizations,
60 Our findings and our ability to draw conclusions are affected by the size of our sample (32 respondents out of 12.521 employees in the cluster), as well as the fact that the sample is dominated by high ranking officers. 61 In comparison 10 of the respondents have worked for other mechatronics firms in Southern Denmark (recall that 1,267 mechatronic firm have been identified in Southern Denmark).

85
which is in line with Breschi and Lissoni’s (2000) finding that worker movement is a very
important mean of knowledge transfer. Looking at the sources of these knowledge transfers, in
terms of the respondents’ three latest jobs, shows that Danfoss is again overrepresented, which
supports our earlier findings that Danfoss is a very important player in the cluster.
Finally, we asked the respondents whether their employees mainly had work experience in- or
outside the region62. As opposed to the respondents, the total workforce displays a more
significant degree of labor immobility; 74% of the employees have not worked outside the
region, 15% have had one or two jobs outside the region, while 11% have had many jobs outside
the region63 (see appendix 6.7.3). The lack of workers from outside the region thus reflects the
difficulties the region has experienced in attracting people. Together with the migration of young
people away from the region, this highlights one of the main challenges for the CI, which is to
attract and uphold a workforce of sufficient size and talent64.
6.7 Conclusion on the composition of actors in the cluster
At this point, we know that the cluster’s roots are with Danfoss and other manufacturers of
machinery and equipment, but that the cluster (and Danfoss) has since moved away from this
low-tech industry. In particular, we conclude that the functional scope of the cluster does not
include many of the firms in NACE code 29, as they with a few notable exceptions, such as
Danfoss and Sauer-Danfoss, generally have technologies that are incomprehensible and distant to
many of the firms in the core of the cluster. However, we hypothesize that there may be a large
subgroup of manufacturers of machinery and equipment (29) that could have ties to Danfoss.
Finally, we also conclude that firms in NACE code 28 are unknown to many as their
geographical and functional area seems to be outside the scope of the cluster.
In contrast, firms in NACE code 31 are very central in the cluster. Firms within this industry
grouping dominate the core of the cluster today and furthermore have technologies that are found
62 The reliability of the data is more uncertain as it is only a qualified estimate of the workforce labour mobility on behalf of the respondent. Furthermore, there is a slight tendency that respondents’ without affiliation to the region perceive the workforce in his/her organization as immobile (which is true compared to his/her ‘norm’). 63 This is in accordance with theory, which predicts that no significant worker mobility is expected across regions (outside the cluster). At the same time it is also in line with Malmberg et al’s (1996) finding that high ranking officers (the respondents) exhibit higher mobility compared to lower ranking employees. 64 Other than officers’ rank, worker mobility may vary with profession or industry, but as the underlying data does not deal with worker mobility on an individual level, we cannot identify any problem areas in particular. However, COWI (2006) finds that firms lack access to a sufficient number of engineers and IT specialists
86
more interesting than any other industry grouping in the cluster. Firms within computer and
related activities (NACE code 72) also have technologies that are interesting to many and are
interested in others’ technologies as well. This suggests that they should benefit from an open
environment of knowledge sharing. Finally, we note that the remaining industry groupings in the
cluster are also among the central actors, but do not take on very prominent positions.
However, industry groupings cannot tell the whole story, and therefore we identified individual
firms that have interesting technologies, and could be used to drive the cluster forward, for
instance by acting as role models. This could help to raise the low interest in peers’ technologies
in the cluster, which is seen as a major threat to the future growth of the social network.
Furthermore, knowledge of organizations in the cluster should be higher, as it is the first step in
building up relations; especially, the fact that even the most central actors do not know all of each
other is very unfortunate. A few large firms, along with the universities and membership
organizations are the most well-known actors in the cluster, while several small- and medium-
sized firms are unknown to many and may not benefit from being members of the cluster
There is a relatively dense network of ties between the core actors in the cluster, but the cluster as
a whole is not very dense, and it is also relatively small. Therefore, there is a need to include
more firms in the cluster and to expand the cohesiveness of the social network of relations. In
terms of growing the cluster, we note that there is a limited capacity for internal growth due to a
lack of entrepreneurship, and the universities, which have the potential to play an important role,
are not exploited. To the extent that new firm creation should occur, however, we expect it to be
mainly within NACE codes 31, 33, and 72. Furthermore, the cluster cannot attract outside firms,
as the workforce can most likely not accommodate such inorganic and rapid growth. Already,
there are problems in attracting and upholding a sufficiently sized workforce, and there is a large
dependence on a few firms, mainly those owned by Danfoss.
Finally, we note that the geographical scope of the cluster is especially centered on Southern
Jutland, and therefore future CIs should be focused on this region.

87
7 The network positions of cluster members In chapter 5, we established the proper context of the ties within the cluster and in the last chapter
we gained an understanding of the composition of the cluster members. In this chapter we apply
social network analysis to the cluster to an even greater extent and investigate, in more depth, the
dynamics within the cluster. In this chapter, we analyze the network positions of cluster members,
in terms of their organizational and personal ties in the cluster, the purpose and use of these ties,
and any structural patterns within the cluster. The purpose is to verify the earlier dichotomy of
the network into central and peripheral actors, but beyond that our analysis here will focus on the
network positions of central actors. As such, this chapter will both draw on and substantiate the
insights from the last chapter.
In the following, we explain the basis of one of the main tools we use when analyzing the
positions of central actors in the networks. Afterwards, we analyze the network of organizational
contact and the network of personal contact. In both of these sections, we will start by
introducing the visualization of the network, which is based on the data foundation and
manipulation, which was introduced in section 6.1. Next, we investigate the structural properties
of the networks, and interpret these structural properties on the basis of the attributes of actors.
7.1 The strength of strong ties
Before introducing the visualizations of the two networks and commencing on the analysis of
their structural properties, we will examine an important assumption, which will be used to
improve the ’local’ properties of the visualizations. As we noted in section 3.3.1, MDS are very
good at visualizing the ‘global’ properties of the networks, but when there is stress, the ‘local’
properties are less certain. The visualizations of the organizational and personal network, which
we work with in this section, have a stress level of 0.100 and 0.113, respectively. Although, this
is within an acceptable range and therefore adequately portrays the global properties of the
networks, it means that there is some uncertainty regarding the exact ‘local’ positions of actors.
Therefore, we further investigate the structural properties of the networks by filtering it with
increasing force so that only the stronger relations between actors are displayed.
The assumption is that stronger relationships between actors raise the certainty of a relation. This
is because the strength of ties depends on individuals’ perception of frequency, and it is uncertain
how often ‘weak’ (seldom/sometimes) personal or organizational contact is. Also, stronger ties
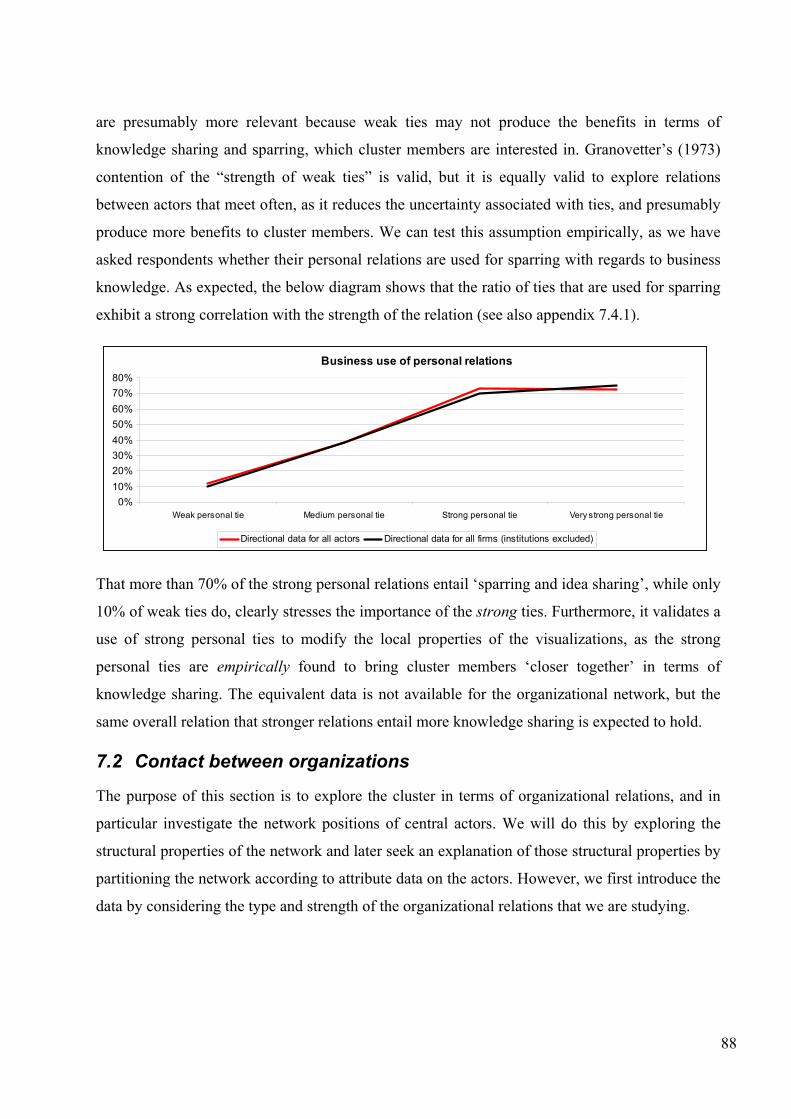
88
are presumably more relevant because weak ties may not produce the benefits in terms of
knowledge sharing and sparring, which cluster members are interested in. Granovetter’s (1973)
contention of the “strength of weak ties” is valid, but it is equally valid to explore relations
between actors that meet often, as it reduces the uncertainty associated with ties, and presumably
produce more benefits to cluster members. We can test this assumption empirically, as we have
asked respondents whether their personal relations are used for sparring with regards to business
knowledge. As expected, the below diagram shows that the ratio of ties that are used for sparring
exhibit a strong correlation with the strength of the relation (see also appendix 7.4.1).
Business use of personal relations
0%10%20%30%40%50%60%70%80%
Weak personal tie Medium personal tie Strong personal tie Very strong personal tie
Directional data for all actors Directional data for all firms (institutions excluded)
That more than 70% of the strong personal relations entail ‘sparring and idea sharing’, while only
10% of weak ties do, clearly stresses the importance of the strong ties. Furthermore, it validates a
use of strong personal ties to modify the local properties of the visualizations, as the strong
personal ties are empirically found to bring cluster members ‘closer together’ in terms of
knowledge sharing. The equivalent data is not available for the organizational network, but the
same overall relation that stronger relations entail more knowledge sharing is expected to hold.
7.2 Contact between organizations
The purpose of this section is to explore the cluster in terms of organizational relations, and in
particular investigate the network positions of central actors. We will do this by exploring the
structural properties of the network and later seek an explanation of those structural properties by
partitioning the network according to attribute data on the actors. However, we first introduce the
data by considering the type and strength of the organizational relations that we are studying.

89
7.2.1 The purpose and strength of the organizational ties in the cluster
In this subsection, we provide the reader with an overview of the purpose and strength of the
organizational ties connecting the different actors in the cluster. We focus our analysis here on
the data in line with the industry groupings and distinguish between firms and institutions. This
will especially give important insights as to the depth and breadth of the cluster.
The purpose of the ties has been reported for 80% (357) of the 446 organizational ties and for
88% (114) of the 129 strong organizational ties between the central actors (see appendix 7.2.1).
This gives us a very accurate picture of the type of relations that exist between cluster members.
The purpose of organizational ties, although very diverse answers were given, have been ordered
into 4 groups; customer-, supplier-, and cooperative relations, and a more diverse group of
relations, which we denote ‘acquaintances’. The first three groupings are self-explanatory, while
the last grouping covers a wide range of respondents’ answers, such as ‘visits’, ‘acquainted
through “Industrigruppen” or “ERFA-gruppen”’ or ‘participation in various arrangements’.
As the diagram shows, cooperative relations account for 54% of the ties within the cluster.
However, the institutions are involved in almost 60% of all cooperative relations although they
only make up app. 9% of the 65 organizations studied. This is a significant share of the ties, and
is a testament to the institutions’ role in the cluster as catalysts for cooperation and mediation.
Purpose of relations
0 20 40 60 80 100 120 140 160 180 200
Acquaintances
Vertical relations
Cooperation
Organizational ties
Firms
Institutions
We earlier found that a very small part of the firms’ “most important” suppliers, and customers
are within the cluster region, but in the diagram we see that a significant portion of the ties
between cluster members are vertical relations. In particular, 115 (32.5%) of the reported ties are
customer/supplier relations, and naturally almost all of these are between firms. Finally,
acquaintances account for 14% of the reported ties, which are almost all between firms in the

90
cluster. This suggests that these relations are either cooperative relations or acquaintances to
competitors65. Given the nature of these ties, they are presumably mostly informal relations.
We already know from the above that most of the cooperative relations are between firms and
institutions. Furthermore, from an analysis of the cooperative relations grouped by industries, we
see that very few relations to firms in NACE code 28 exist, which supports our earlier findings
that this industry grouping is outside the functional scope of the cluster (see appendix 7.2.2). A
similar analysis of the vertical relations between industry groups in the cluster gives insights into
the depth of the cluster (please refer to appendix 7.2.3). First, we note that most firms do not have
vertical relations with firms in their own industry grouping. However, three industry groupings
stand out; 29, 31, and 00, where the firms in NACE code 29 by far have the highest level of intra-
industry trade. This finding supports our earlier contention that there might be a separate
subgroup in the cluster containing many of the manufacturers of machinery and equipment (29).
Turning to an identification of the most important customers and suppliers in the cluster, we see
that firms in NACE code 31 are the major suppliers in the cluster and supply to all the other
industries except NACE code 28. More specifically, when discounting the number of firms and
the amount of respondents in the industry groupings, we see that a firm in NACE code 31 is 4.4
times more likely to be a supplier to one of the cluster members than an average firm in the
cluster. Firms in NACE code 00 also appear to be relatively important suppliers in the cluster, but
it is to fewer different industry groupings and some is accounted for by intra-industry trade as
well. The major customers in the cluster are firms in NACE code 33, but firms in NACE codes
31 are also relatively active as customers to the other cluster members. Finally, we note that firms
in NACE code 28 and 72 are neither very active as customers nor as suppliers. We conclude that
there is a relatively high degree of vertical relations especially to firms in NACE code 31 and 33,
and internally in NACE code 29. Although, this suggests that the cluster has some depth, we note
that 115 reported ties between 59 firms is less than 9% of all possible ties66, which is clearly not a
very dense network of vertical relations.
We can also dichotomize the purpose of relations according to the frequency of contact involved
in the relation, i.e. its strength. To this end, we see that the purpose of the strong organizational
65 We note that the reason why no competitive relations have been identified is because we have asked respondents to state the purpose of their organizational and personal relations. Therefore, although our analysis in chapter 5 showed that there are competitive relations inside the cluster, they are not identified in this analysis. 66 (115 reported ties / 0.8) / ((59 firms x 58 firms) / 2) = 0.084. (The purpose of ties was reported for 80% of all ties).

91
ties is almost the same as for the whole network (see appendix 7.2.4). However, ties between
institutions and firms account for 51% of the strong organizational relations, which means that
only 56 strong ties are present between the 44 most central firms in the network of organizational
ties; 59% are vertical relations, 23% are cooperative ties, and 18% are acquaintances (see
appendix 7.2.1). 56 ties between 44 firms is not a dense network, and therefore support our
earlier finding that the ‘most important’ business relations are not contained within the cluster67.
This finding also further stresses the need to raise the density of relations in the cluster. Finally,
by considering again the 115 vertical relations in the cluster, we must note that less than one-third
(28.7%) are strong ties; those 33 strong vertical ties should, however, due to the frequent contact
and the physical proximity between actors, enable knowledge sharing, and the same is true for
the 58 strong cooperative relations (see appendix 7.2.1).
At this point, we know that the institutions have a very large role as catalysts for cooperation and
mediation as they are involved in approximately one-third of the existing relations in the cluster,
and in more than half of the cooperative relations. There is also a large proportion of vertical
relations in the cluster, which transcends industry groupings, and especially firms in NACE code
31 are very active as suppliers in the cluster, while firms in NACE code 28 and 72 are neither
active as customer nor as suppliers. Finally, firms in NACE code 29 have a high degree of intra-
industry trade, which supports our earlier contention that they might make up a distinct subgroup.
Few organizational ties entail frequent contact, and this supports our earlier finding that the most
important business relations are with actors outside the cluster. This is unfortunate in terms of the
amount of knowledge sharing that can be expected between cluster members. Finally, we note
that the analysis tells us that firms do trade with each other, although not enough to be promoted
based on such vertical interdependencies. Instead, the many cooperative ties support the
promotion of a knowledge network based on cooperation.
7.2.2 Visualization
At this point, we have a good understanding of the organizational ties between the actors in the
cluster. As mentioned earlier, the sociomatrix of organizational ties has a density of 21.4%,
which means that 446 ties between 64 actors exist (32.4, is an isolate). 128 of the relations are
between organizations that have contact often or very often (strong ties). Due to the data
67 We remember that almost all the ‘most important’ relations entailed contact daily or weekly, which must be seen as a ‘strong relation’ in our terminology (contact often or very often)..

92
manipulation in section 6.1.1, we have a valued, symmetric sociomatrix, which captures the
original data well, and we can visualize this in a MDS, which produces a stress of 0.100. We note
that the network is well-connected, although several actors on the left hand side are only
connected to the rest through one or two ties. The core of the network is dense and is composed
mainly of the respondents, although several non-respondents are also well-positioned.
7.2.3 Structural properties
As we now have a visualization of the network of organizational ties, the purpose of this section
is to understand its structural properties and in particular identify the central actors in it. This will
allow us to critically evaluate the network positions of actors.
The graph, on the next page summarizes the following analysis of the structural properties of the
network. Most importantly, we identify the ‘core of the network’ and see that it consists of 21
respondents and 5 non-respondents, while 8 of the respondents and 3 ‘participants’ (who did not
respond to this particular question) are peripheral to the network of organizational ties. The
inclusion of actors into the ‘core of the network’ (the contours in the graph) is based on actors’
centrality and betweenness, and on the cohesiveness of the network (clique and 2-plex), which
we will account for in the following. 72.5’s position apart from the rest of the core is due to its
role as a bridge; but it is connected directly to 10 of the actors in the centre of the network and is
considered as a central actor.
Respondent
Participant (This refers to a participant in the study, but no answer was given to this particular question)
Non-respondent & Non-participant

93
To get an overview of the structural properties of the network of organizational ties, we first
consider the degree centrality measure, which shows us that the two membership organizations;
CfE (91.1) and CSI (91.2) have by far the most and the strongest direct connections to others.
They are connected directly to app. 80% and 69% of the network, respectively (appendix 7.1.2).
There are also many very central manufacturers of electrical machinery and apparatus (31.6,
31.12, 31.4, 31.11 and 31.10), along with 72.2, 72.5, and 91.3. These actors are all directly
connected to 35% or more of the cluster members. 00.6 and Danfoss (29.18) are ranked third and
sixth in the valued graph, respectively, but their high ranking is due to a very high proportion of
very strong connections, and they are therefore directly connected to less than 35% of the
network. Also, Sauer-Danfoss (29.14), Eegholm (00.3), and both universities, although outside
top 10, are worth noting due to their high indegrees (see appendix 7.1.1). Finally, we note that the
group-level centrality measure is relatively high, which reflects the two membership
organizations' relatively high connectivity.
91.1 and 91.2 are also ranked highest in terms of betweenness, they act as intermediaries between
17.6% and 13.9% of the actors in the cluster, respectively. Given their high degree centrality, this
is relatively low and suggests that actors are fairly well connected, which is also indicated by the
low group-level index of 16.49%. Due to its role as a bridge to three otherwise unconnected
actors, 72.5 has a relatively high betweenness as well and connects 12.8% of the network.
Although Danfoss (29.18) is a prominent actor in terms of degree centrality, it mediates
connections between only 1.1% of the actors in the network. However, if our earlier hypothesis
Contour Core of network Size N. Degree Centr. Shapes Triangle; Clique and 2-plex Square; Top 21 in Degree Circle; All others Colors
Respondent
Participant
Non-respondent / Non-participant

94
that Danfoss connects firms in NACE code 29 to the rest of the cluster, this would raise Danfoss
role as a hub drastically.
There is a high correlation between degree and closeness centrality in this network. This means
that the most central actors in terms of direct connections to others (degree) are also those that are
best suited to communicate effectively with all actors in the network. However, we note that
many more actors score high in terms of closeness, which suggests that several other actors,
especially around the centre of the graph, are almost as well-positioned to monitor and
communicate in the network. This can be explained by the existence of a rather large clique of 11
actors in the centre of the graph. As we noted earlier, a clique implies that all actors are
connected to all other actors, although, we must note that their ties to each other vary in strength.
Most actors in the clique have high degree centralities and all are in the top 21. Furthermore, 91.2
and 31.5 are included in this exclusive group if weakening the notion of cohesiveness to that of a
2-plex. The existence of a large clique in the centre of the graph indicates that the organizational
network is structurally robust meaning that even if some firms or institutions go away, the
network will not break down.
The above graph adequately portrays the global properties of the network, but as we noted in
section 7.1, the local properties of the network can be optimized by considering less active
visualizations of the network, in particular by filtering it with increasing force so that in the end
only ties between actors that have contact very often are displayed. The GLA images in graph 5
and 6 appendix 7.1.5 show only the strong ties between actors. In these graphs, many actors are
isolates as they have no strong relations. However, we note that the actors comprising the ‘core
of the network’ are those that have the most ‘strong’ relations to others, which supports the view
that these actors are in fact very central in the cluster.
From the analysis of the GLA images we see that there is a beginning fragmentation of the
network of actors that meet ‘very often’. Two large subgroups emerge; one subgroup consists of
three manufacturers of machinery and equipment (29) including Danfoss (29.18) and Sauer-
Danfoss (29.14), along with four manufacturers of electrical machinery (31). The other subgroup
is dominated by the two membership organizations (91.1, 91.2), but also include a variety of
other organizations. It is interesting to note that all the membership organizations are contained in
this subgroup, together with SDU Sønderborg (80.1) and SDU Odense (80.2). When also
examining the network of those that meet ‘often and very often’, the same pattern emerges, but

95
we see that SDU Odense (80.2) has strong connections to many in the first subgroup. Through
further analysis we have been able to dichotomize the network into three distinct groups, and as a
part of this analysis we have created the following MDS based on the strong relations only68.
As is evident from this graph, the core of the network can be partitioned into three distinct
groups, which we denote ‘institutional’, ‘commercial’ and ‘bridges’ due to their composition and
structural properties69. We will go into a further investigation of this dichotomy of the network
later, but for now we note that both the GLA images and this MDS (due to its very low stress
level) are more reliable representations of the core of the network than the original MDS. The
structural differences within the core of the network are important to note and is shown in the
MDS below, where the local properties of the graph have been corrected according to the
investigation of the ‘strong’ ties (see also graph 8 in appendix 7.1.5).
Based solely on the structural properties of the network, we have at this point established that the
cluster members are well-connected as the network is fairly dense, and especially the core of the
network is very robust. However, based on the overall position of cluster members in the original
MDS, together with the lack of strong ties especially between cluster members in different parts
68 The MDS has a stress of only 0.046 and is therefore a very reliable representation of the network. It is based on a moderation of the symmetrised sociomatrix only considering the strong ties in the network. 69 Actors in the subgroup ‘bridges’ are not bridges in the strictest sense of the word, as there are obviously many weaker ties connecting all the actors. Instead these actors are denoted bridges as they have ties to both institutional and commercial actors.
Colors
Core of commercial subgroup
Periphery of commercial subgroup
Core of institutional subgroup
Periphery of institutional subgroup
Bridges
Periphery

96
of the network, the actors have been divided into three distinct subgroups. Finally, we note that
the most central actors in the network are 91.1, 91.2, a handful of ‘manufacturers of electrical
machinery and equipment’ (31), 72.2, 72.5, 00.6 and Danfoss (29.18).
This dichotomy of the network is based entirely on the structural properties of the network.
However, to further substantiate and validate the dichotomy, we will investigate the type of
organizational ties connecting the actors in the different subgroups.
In total, 245 relations were reported between 56 firms, and if producing a visualization of just
these ties, we see that especially the actors in the commercial subgroup become central players
(see graph 1 in appendix 7.2.6). We also note that only 2 more firms are isolated from the
network of organizational ties if removing the institutions, and therefore, the network of
organizational ties between firms is fairly robust. On the other hand, if only considering the
cooperative ties in the cluster, the institutional subgroup (and especially 91.1 and 91.2) dominates
the cluster. Finally, if we instead focus on the vertical relations in the cluster, many of the actors
that were denoted ‘bridges’ take on central positions (see graph 3 in appendix 7.2.5). This
suggests that these actors do in fact work as ‘bridges’ as they in the absence of cooperative
relations, take on central positions (and thus bind the cluster together) due to their many vertical
relations to both commercial and institutional firms. This pattern is also evident when
considering only the strong ties between firms; if removing the ‘bridges’ from the cluster, 39% of
the remaining firms are isolated from the core of the network through strong relations, and the
Size & shapes Largest; Core actors Large triangles; Other central actors Small; Others Colors
Commercial subgroup
Institutional subgroup
Peripheral institutional actors
‘Bridges’
Peripheral yet strong ties to core
Periphery

97
three institutional actors 31.4, 32.1 and 72.2 are only connected to the commercial subgroup
through one actor (see graph 4 and 5 in appendix 7.2.5).
7.2.4 Interpretation of structural properties based on attribute data
At this point, having a deep understanding of the structural properties of the network, we will
explore possible explanations for them by partitioning the MDS according to the attributes of the
actors. In this regard it is of course important to note that most of the attribute data is only
available on the respondents; 22 of the 30 central actors are respondents, while there are 10
participants/respondents in the study that are peripheral to the network (see graph 9 in appendix
7.1.5). This should give us an adequate insight into any significant patterns in the graph.
A natural starting point is to validate the ‘commercial’ and ‘institutional’ dichotomy of the
network. Besides 80.2, the left half of the network is absent of institutions and this both validates
our dichotomy of the network and also suggests that the organizations in the commercial
subgroup are mainly driven by contacts between companies (see graph 10). Also, we see that
smaller organizations are much more prevalent on the right hand side of the network (see graph
11), while organizations with more than 200 employees are either in the ‘commercial’ subgroup
or peripheral to the network. With regards to the smaller organizations, we see that 29.10 and
72.1 are the only small firms on the left hand side of the network, while there are four small firms
on the right hand side, besides the four membership organizations. This could suggest that
membership organizations’ primarily work to include small firms in the cluster. We also see from
graph 12 in the appendix, which is partitioned according to the organizations’ industry groupings
that the ‘commercial’ subgroup is made up almost exclusively of manufacturers of electrical
machinery and apparatus (31) and manufacturers of machinery and equipment (29). On the other
hand, the institutional subgroup is more diverse and we see that most companies in computer and
related activities (72) are on the institutional side of the graph. It thus seems that the size of the
organization correlates to some degree with these lines of businesses, which is also apparent from
the diagram on the next page. Firms in NACE code 29, and 28 are on average the largest, while
firms in NACE code 31 are third with 180 employees on average. Firms in ‘computer and related
activities’ (72), and in ‘various’ (00) are the smallest.

98
Size of firms per industry group
0 1000 2000 3000 4000 5000 6000 7000 8000
*00*
*28*
*29*
*31*
*32*
*33*
*72*
NA
CE
code
s
Number of employees
Average size
Total size of group
These findings support an initial concern, which was conveyed to us by Hans Martens, the
director of the mechatronics workgroup, and Hans Henrik Fischer, vice-president at Danfoss. The
concern was that there is not a ‘shared language’ in terms of understanding business terminology
and thinking about the strategic direction and the vision of the cluster as many of the firms in the
cluster do not have a keen business perspective. This could explain why the large firms and firms
in similar business lines are concentrated on the ‘commercial’ side, as bigger organizations tend
to have a more formalized strategic outlook and understanding of business processes. On the
other hand, the institutional subgroup with its overweight of membership organizations is better
equipped to communicate with and include especially the smaller organizations. To this end, we
note that most institutions in the cluster are very dedicated to developing the commercial life in
Southern Jutland and the mechatronics cluster, and 91.1 and 91.2 are especially successful at
mediating connections (see graph 4 in appendix 6.1.4). Further, this suggests that the membership
organizations see it as part of their role to try to mediate connections between the large and small
organizations due to their lack of ‘shared language’. The lack of ‘shared language’ may be
further substantiated by the breadth of the cluster, as we found that firms in NACE code 28 and
29 are less interesting to central actors. In our investigation of the organizational ties across
industry groupings we also noted that firms in NACE code 72 had very few vertical relations
with other cluster members, and this may be the reason why so many of them are mainly
connected to the institutions in the cluster.
It is also evident from the above diagram and our prior knowledge on the average age of
organizations from section 6.3 that the size of an organization correlates with the age. This is also
evident from graph 13 in the appendix, where we see that most firms founded less than 11 years
ago are small in size. Furthermore, the few young organizations that are large are either spin-offs

99
(29.14, 31.5, 31.8) or they have changed ownership recently but are actually founded much
earlier (28.2, 29.19). As such, no organizations that have been established less than 11 years ago
have more than 50 employees and organizations more than 20 years old are generally much
larger as more than 60% have above 50 employees. As such there is a strong correlation between
age and size, and it is fair to generalize that large organizations are also well-established (/old).
In graph 14, we see that the largest firms (more than 200 employees) are either in the
‘commercial subgroup’, or they are peripheral to the network. It is fair to assume that these large
and well-established firms have large knowledge bases and probably also hold many ‘pipelines’,
which make them vital for the generation of knowledge in the cluster. According to Giuliani’s
(2005) findings on the knowledge flows in a cluster, we can expect that the large firms within the
commercial subgroup both absorb and help diffuse a lot of knowledge, while the knowledge
bases and pipelines of the large peripheral actors do not benefit the cluster members, exactly due
to their peripheral positions and lack of ties to the rest of the cluster. Furthermore, Giuliani’s
(2005) findings that the knowledge flows will be especially large within “cohesive subgroups of
firms” and firms with similarly strong knowledge bases suggest that it is especially within the
‘commercial subgroup’ that there is a ‘knowledge network’. Our earlier analysis of the
technological interest in firms’ technologies support this contention, as we in the below graph see
that most of the actors with interesting technologies (presumably those that are closer to the
technological frontier) are in the commercial subgroup.
Colors
Above 40% of the respondents are interested in the actor’s technology
30-40% of the respondents
20-30% of the respondents
Below 20% of the respondents or institutions
Respondents with outdegree above 30%
Outdegree 20-30% Indegree 20-30%

100
Therefore, there would be a lot to gain from tapping into this knowledge network for the rest of
the cluster. However, the knowledge network within the commercial subgroup may also suffer
from the exclusion of the rest of the cluster as we have just established that there is a low
functional diversity within the commercial subgroup. Thus, the ‘institutional’ subgroup and
generally the right hand side of the network can offer some novelty and diversity to the
knowledge network, as they have different knowledge bases, different pipelines, and generally
different absorptive capacities in the form of more specialized expertise as there are many
smaller firms and institutions. Thus, it seems that both sides would gain from input from the
other group, and the fact that the core of the network is fairly well connected when considering
their weak ties means that there is a good foundation for uniting the cluster.
In the following we will investigate further why the cluster is split up, which might give us
insights that will help improve the unity of the cluster.
When discussing the genealogy of the cluster earlier (in section 6.5), we found that the cluster is
mainly driven by the opportunities generated by businesses. Partitioning the network according to
the organizations’ reasons for establishment, we see that the respondents in the ‘commercial’
subgroup are mainly spin-offs and in fact all spin-offs are contained in this group (graph 15). As
most are spin-offs from Danfoss, which is very central in the commercial subgroup, this clearly
tells us that there are still strong relations between the parent and the spun-off company. Apart
from any formal ties, there may also be relations between the employees in each company, as
most worked together before. This supports our earlier analysis of worker movement inside the
cluster and is in line with Breschi and Lissoni’s (2000) study of knowledge networks, which
pointed towards worker movement as a very important means of knowledge transfer. They also
found that active participation was needed in order to gain from a knowledge network, and it is
clear from the graph on the previous page that firms that are highly interested in other firms'
technologies (and thus more involved in the cluster) are generally closer to the ‘knowledge
network’ in the commercial subgroup.
Another interesting proxy for cluster members’ active participation is the mechatronics
workgroup meetings. Already in our analysis in the last chapter, we found that many of the
central actors in the cluster have participated in mechatronics workgroup meetings. In the
network of organizational ties, we see that 3 members of the mechatronics workgroup are
peripheral actors, while 56% (18/32) of the actors in the core of the network have participated in

101
mechatronics workgroup meetings (graph 16). Furthermore, almost 70% (15/22) of the actors in
the commercial and institutional subgroups have participated. As such, the meetings do work to
include actors in the core of the network; however it is questionable whether this translates into
any benefits for the firms in terms of idea-sharing and collaboration. According to our earlier
discussion on the strength of ties, this would (among other things) depend on their frequency of
contact. To this end, we cannot say whether a tie between two workgroup members is only due to
their acquaintance through the workgroup meetings, or whether an (additional) formal or
informal relation exists. However, even when only considering the interaction between those
actors that have participated in more than 70% of the meetings, and therefore should meet
relatively often, they do not have many strong ties with each other. Therefore, the strong ties that
are reported must be due to contact outside the meetings (see calculations below graph 16 in the
appendix). Thus, the meetings are a first step in building up relations in the cluster, but the
meetings on their own are not sufficient in promoting a knowledge network.
Another promising approach, which could raise cluster members’ mutual understanding and
strengthen their relations, can be found when examining the functional scope of the cluster. We
note that the functional scope of the cluster is centred on electrical machinery and equipment
(both in terms of interest and vertical relations). This insight should be used actively to better
define the focus of the cluster and thereby strengthen cluster members identification with the
cluster. We also found that there is a handful of role-models in terms of technological interest.
These should be used actively to involve cluster members (raise their interest and participation in
the cluster), and also to recruit new members.
7.2.5 Summary of findings
We have found several indices of the existence of two subgroups in the network. The institutional
subgroup, which is characterized by smaller and younger institutions and firms, and the
commercial subgroup characterized by larger and more well-established companies (especially
NACE-codes 29 and 31), which hold vital pipelines to the outside and have interesting
technologies to many cluster members. The differences between the two subgroups indicate that
collaboration and knowledge sharing between the two subgroups is hindered by a lack of a
‘shared language’, and further exacerbated by the breadth of the cluster. The third subgroup of
central actors in the network work as ‘bridges’, as they include actors into the core of the network
and bring the commercial and institutional firms closer through vertical and strong relations.

102
We have observed a relatively dense network of weak ties between the cluster members, and
therefore it seems that the cluster as a whole and in particular the two distinct subgroups should
be able to gain from intensifying their relationships. Especially, there would be a lot to gain from
tapping into the commercial subgroups’ knowledge network for the rest of the cluster, and the
commercial subgroup might in turn also benefit by including more firms as this would raise the
diversity of the collective knowledge base.
Through our analysis we have investigated possible initiatives. First, we found that worker
movement (in terms of spin-offs) is a strong mean of establishing strong ties between
organizations, and probably an initiative such as employee sharing would have a similar effect.
The mechatronics workgroup meetings were seen as a good way of establishing contact between
organizations, but unless the attending organizations are truly dedicated to the CI it will not
translate into benefits for the cluster members. To this end, we also see that the institutions’ role
is mainly to include the smaller firms and close the ‘language gap’, which exists between the two
main subgroups. How successful they have been in this endeavor can only be established through
a longitudinal analysis, which is outside the scope of this thesis. However, we note that although
there is a divide in the cluster, it may have been more severe were it not for the CI, and the
institutions’ dedication and central roles in the cluster.
We also saw that the actors that are interested in peers’ technologies and therefore participate
actively in the cluster are generally closer to the commercial subgroup. Therefore, a better
definition of the cluster based on its functional scope and an active use of role-models could be
used to raise interest both within the cluster and outside.
Finally, the fact that the ‘most important’ business relations are generally not contained within
the cluster, although unfortunate in terms of benchmarking and creating pressure to compete, it
does mean that firms should have little to loose from sharing locally and thus it should be
possible to create a strong knowledge network based on cooperation.

103
7.3 Contact between individuals
We now have a good overview of the network of organizational ties, and will in the following
investigate whether the personal ties of the respondents exhibit the same pattern. Further, we will
review the business use of personal ties, as this will clarify to what degree the cluster works to
promote business on an informal basis. As in the last section, we will first introduce the personal
relations in the cluster by considering the strength of the ties and their distribution across industry
groupings. Afterwards, we explore the structural properties of the network and later partition it,
and thereby compare with our earlier findings.
7.3.1 The distribution and strength of the personal ties in the cluster
We have recorded 389 personal ties between cluster members, which is slightly less than in the
organizational network. Furthermore, there are 9 isolates in this network, while there was only
one in the organizational network (see appendix 6.1.2). Finally, we also see that there are much
fewer strong personal ties (67) than strong organizational ties (129). Either these differences are
because respondents are more careful when nominating personal relations than they are in
nominating organizational relations, or there are simply fewer personal ties between individuals
in the cluster organizations. We later investigate possible explanations for the observed density
and also consider the structural properties of the network in more depth. In the following,
however, we work with the network data in terms of industry groupings.
In the organizational network, we saw that the affiliation to certain industry groupings did not
matter. This is also the case when investigating only the weak personal relations, where mainly
individuals in universities and membership organizations, and individuals in firms in NACE
codes 31 and 33 are nominated (see appendix 7.3.4). However, there is a tendency to have many
strong personal relations to individuals in organizations within own NACE code. Furthermore,
the strong personal ties outside own NACE code are especially to the membership organizations
(91) and to individuals in closely related NACE codes. We also note that no one has reported to
have strong personal ties to individuals within NACE code 28, and few strong personal ties exist
to individuals in NACE code 72 and 80.
Finally, in line with our earlier finding on the correlation between strength and business use of
ties, we see that it is mainly those NACE codes entailing many strong relations, which are used
for business purposes; 31 and 91 (see appendix 7.4.4). However, we also see that especially
personal relations to individuals in universities are used for business purposes, and as there are

104
not many strong personal relations to the universities, many of these are based on weak personal
ties. This also makes sense in that both universities and firms benefit from using each other
proactively, and there is little risk involved for the firms in terms of sharing their knowledge.
This means that a strong personal relation is not needed to gain trust.
We further note that a total of 29% of the personal ties between cluster members’ are used for
sparring (see appendix 7.4.2). This is a significant share, but on the other hand also implies that
more than two-thirds of the personal relations are not used for business purposes, and therefore
may not directly benefit cluster members (although they are seen as a vital part of the social
capital in the cluster). This finding highlights the use of the strong personal ties to optimize the
‘local’ properties of the MDS of the network, which is the purpose of the following analysis.
7.3.2 Visualization
In section 6.1.2, we noted that the data manipulation (symmetry procedure) distorted the data
slightly as respondents were generally ranked higher in terms of centrality. However, the
symmetrical graph still represents the original data fairly well, as can be seen in the following
MDS, showing also the original indegrees of actors. The graph, where the 9 isolates have been
removed, is a MDS with a stress of 0.113. Although this is within the generally accepted levels it
does again create uncertainty especially regarding the ‘local’ properties of the visualization.
Node size;Original indegree
Respondent
Participant
Non-participant

105
7.3.3 Structural properties
The most central actors in terms of mutual personal ties (manipulated data) are 91.1, 31.6, 31.4
and the non-respondent 29.18 (see appendix 7.3.2). With regards to the betweenness of actors,
31.4 is by far the most central as it connects 13.1% of the network. 31.12 connects 6.8% of the
network, while 91.1, 72.4, and 31.5 connect from 4-5%. Still none of these actors can be said to
really be ‘connectors’ in the network. Similar to the organizational network, most actors have
relatively high closeness centrality and the core of the network is relatively well connected in that
13 of the most central actors in terms of degree centrality are members of the same 2-plex (see
graph 4 in appendix 7.3.5). 3 more actors are included in this cohesive group of actors when
examining the clique formation in the network (see also appendix 7.3.2). Comparing the 13
actors in the largest 2-plex in the personal network with the actors in the largest clique and 2-plex
in the organizational network, we see that 11 of the 13 actors are the same, which means that
these actors are tied together both formally and informally (see appendix 7.5.1).
Another similarity between the personal and organizational network is that they are almost
equally cohesive, which is evident from the fact that the average distance between reachable pairs
in the personal network is through 1.82 paths, while it was 1.88 in the org. network. However,
this statistic is calculated only between reachable pairs and as noted earlier the personal network
has nine isolates while the organizational network only has one. As could be expected the isolates
in the personal network only have few organizational ties as well. Especially, 32.4 (isolate) and
00.1, 29.3 and 29.17, which all have only 1 organizational tie are therefore very peripheral to the
cluster, which was also depicted in the aggregated network in chapter 6. The remaining 5 isolates
in the personal network have between 2 and 4 organizational ties, and all hold peripheral
positions in the cluster as well (see appendix 7.5.2).
When only considering the strong ties between actors (see graph 10 in appendix 7.3.5) there are
some important insights to be drawn. First of all, we note that only 2 out of the 44 personal ties of
central actor 31.4 entail frequent or very frequent contact. Therefore, 31.4 has a much less
prominent position in the network of strong relations. In contrast, Danfoss (29.18), Danfoss
Drives (31.6) and CfE (91.1) are clearly the most central actors when only considering strong
ties. When further analyzing the network positions of actors considering only the strong personal
ties, we see that 91.1 (CfE) and 29.18 (Danfoss) both seem to have a group of actors in each their
separate hinterland (see graph 11), and when partitioning the whole network accordingly, we see

106
that the patterning also holds when including weak ties (see graph 12). The following graph has
been slightly modified to better represent the above structural considerations (see appendix 13);
Many of the central actors in the above graph are connected directly to each other, which is
apparent from their cohesiveness (see 2-plex and cliques in graph) and all rank in the top 30 in
degree centrality. However, in terms of strong personal ties the actors are divided.
The dichotomy of the personal network is similar to the one found in the organizational network,
and 25 of the 29 central actors (86%) are also present in the core of the organizational network
(see appendix 7.5.3). The ‘Danfoss’ group in the personal network is seen as the equivalent to the
commercial group in the organizational network and CfE is equivalent to the institutional group.
However, only 15 of the 25 central actors in the personal network that are also central in the
organizational network are in the same/equivalent subgroup. There is a great degree of overlap
between the actors comprising the commercial subgroup in the two networks and there are many
strong personal relations between the commercial actors. This is in line with our earlier finding
that this subgroup is a well-established knowledge network. There is also some overlap with
respect to the institutional actors, but only 1 of the actors is a bridge in both networks. However,
almost all ‘bridges’ are central in both networks, only they are then part of one of the two
subgroups, which is also clearly evident in that there were 9 bridges in the organizational
network, while there are only 3 here. Given that the dichotomies of both networks are correct,
actors positioned in different subgroups in the organizational and personal network should be in a
Size Big; central actors Shapes Down triangle; Largest 2-plex Up triangle; Members of cliques of size 10 Square; Top 20 in Degree Circle; All others Colors
Danfoss’ group
CfE’s base
Bridges
Periphery

107
good position to work as boundary spanners in the cluster. However, we note that the
identification of bridges seems more uncertain as there is so little overlap.
7.3.4 Interpretation of structural properties based on attribute data
The above considerations strongly indicate that we should see the same patterns as in the
organizational network, and this is also the case. We again see that most of the institutions are
situated in CfE’s base (see graph 15 in appendix 7.3.5) and almost all small organizations are
located here as well, while all the very large and well-established firms are contained in Danfoss’
base (see graph 16 and 17). In terms of NACE codes we see the same pattern in the two networks
as well, only in the personal network the divide is even more extreme; all manufacturers of
machinery and equipment (29) are concentrated on Danfoss’ side of the network, and by far the
most manufacturers of electrical machinery and apparatus (31) are concentrated here as well (see
graph 18). On the other side of the network most institutions (universities and membership
organizations), and firms in computer and related activities (72) are concentrated. All of the
above findings again support the gap in ‘language’ between the two subgroups.
7.3.5 Summary of findings
The personal relations in the cluster are more exclusive presumably because they in many cases
develop over time on the basis of a shared culture and frequent interactions (Wolfe and Gertler,
2004). In line with this, we see that it is especially firms in the well-established commercial
subgroup, which have strong personal ties to each other, which are more often used for sparring.
In situations, where there is not a fear of a co-ordination failure, however, even weak ties can be
used for sparring, which we saw was especially the case with the universities.
The network of personal ties resembles the organizational one in all important aspects; although
the personal network has more isolates and fewer strong ties between actors, most of the actors
that are central in the network overlap, and the dichotomy of the cluster holds fairly well.
Danfoss and Danfoss Drives are the most prominent actors in one subgroup and CfE is the most
prominent actor in another and the two subgroups are characterized by the same attributes as in
the organizational network; The CfE group is composed of small firms and institutions, which
cooperate locally and are mainly based on local demand, while the Danfoss group is composed of
large firms mainly in NACE codes 29 and 31, based mainly on international demand and
cooperating both locally and with partners outside the cluster.

108
7.4 The aggregate network of formal and informal ties revisited
The dichotomy of the network, which we have discussed in this chapter, also applies to the
aggregated network, although there are some discrepancies between the dichotomies in the
personal and organizational network. Especially, the bridges are inconsistent, as they in 10 out of
11 instances only act as ‘bridges’ in one of the networks. They have been removed from the
dichotomy of the cluster, and we therefore note that actors may have strong ties across the
subgroups. However, as is evident from the following graph, the dichotomy is still very clear
(please see the simplification procedure (below graph 3) in appendix 7.5.4).
This visualization of the cluster shows that the commercial subgroup, and in particular Danfoss
(29.18) and Danfoss Drives (31.6), are central players in the cluster. In contrast, the institutional
actors are generally more peripheral in the cluster, although, 5 of the 17 institutional actors are
very central players and all of these have some strong ties to commercial actors as well. These
actors may therefore have an active role in bringing the cluster together, which we already knew
was the case for 91.1 and 91.2. Finally, we see that a large group of actors are peripheral to the
network on the commercial side of the network. From our analysis, we know that many of these
are either geographically or functionally distant to the actors in the core of the cluster.
In section 6.2.4 we accounted for the concentration of firms and the density of relations in the
cluster. At this point, we can also summarize our findings with regards to the breadth and depth
of the cluster. The model on the next page communicates a need to focus the functional scope of
Colors
Commercial subgroup
Institutional subgroup
Peripheral actors
Shapes
(Circle) Very central actors
(Diamond) Central actors
(Triangle) Peripheral actors

109
the cluster; knowledge of organizations generally transcend industry groupings, but such low-
tech industries as NACE codes 28 and 29 are distant to the core actors in the cluster and further
seems outside the scope of mechatronics in general. Also, the general lack of comprehension and
interest in peers’ technologies is seen as a strong indication that the cluster is too broad (or at
least not well-defined). In terms of the vertical relations in the cluster, we have seen that only
approximately 9% of all firms in the cluster trade with each other, and firms’ ‘most important’
suppliers and customers are generally situated outside the cluster. Therefore, more vertical
relations would raise the ability to collaborate with respect to process- and product innovations.
However, we note that vertical relations are not a necessity in order to have a functioning cluster,
and the cluster is clearly based more on shared competencies than on trade.
Clusters have different characteristics, and we can at this point characterize the mechatronics
cluster in accordance with Markusen’s (1996) typology. To this end, the mechatronics cluster
clearly resembles a hub-and-spoke district, which is starting to move towards a more nucleated
form. The characterization of the mechatronics cluster as a hub-and-spoke district is further
supported by the region's commercial foundation with Danfoss and the hypothesis that many
relations exist between peripheral actors and Danfoss, which would raise its role as a hub.
However, we must acknowledge that Danfoss has several divisions and there are also spin-offs
from Danfoss, and a few other actors, which together form a strong network. These firms
comprise the commercial subgroup, which is seen as a more correct definition of the ‘hub’ in the
cluster today. Furthermore, it seems that we are only in the process of moving towards a
nucleated form of the hub-and-spoke district, where firms enjoy the externalities created by the
hub, such as specialized factors in the form of skilled labor, infrastructure, research institutions,
etc. In line with the definition of a hub-and-spoke district there is also a great deal of cooperation,
which has been initiated to a great extent by Danfoss’ active role in developing the cluster and
raising awareness of the CI. However, this typology of the cluster also underlines certain areas of

110
concern, which are inherent to the hub-and-spoke district such as a lacking cooperation among
competitor firms, and that alliances on behalf of the hub occur mainly with partners outside the
district. Generally, the culture also tends to develop around hub activities and employees are
mainly loyal to the hub. Finally, it is apparent from our analysis that the cluster due to its recent
CI has included many younger and smaller firms in the social network and a few institutions are
taking central roles in the cluster. This is seen as a very positive step in the process of moving
away from a dependence on the commercial hub, but it is apparent that there are still obstacles to
overcome before there is a functioning knowledge network throughout the cluster.

111
8 Cluster initiatives The purpose of this chapter is, in accordance with our problem statement, to use the extensive
understanding, which we have gained on the mechatronics cluster, to develop CIs that can drive
the cluster forward. We will briefly revisit the mission statement of the mechatronics cluster,
followed by a short summary of the most important strengths, weaknesses, opportunities and
threats, which we have uncovered. On this background, we will discuss CIs that can augment the
cluster’s strengths and opportunities and deal appropriately with any weaknesses or threats.
Already in the motivation to this thesis, we noted that the mission statement for the cluster is
”…to strengthen the competitiveness and the profile of the Danish mechatronics cluster by
identifying the strategic challenges and opportunities the cluster is facing and subsequently take
action on this background” (www.cfe.dk). There are two separate objectives in this mission
statement, one being to strengthen the competitiveness of the cluster (provided our view on
clusters, this is primarily seen as a function of knowledge sharing within the cluster), and the
other being to promote the cluster. However, the two objectives are interrelated; as the cluster
strengthens its competitiveness promotion of the cluster is easier, and promotion of the cluster
helps to attract factor conditions and firms, which strengthens cluster members’ competitiveness.
8.1 SWOT analysis
First, the most important strengths and opportunities, which we have uncovered, are presented.
In prioritized order, they are;
• The strongest asset of the cluster is the well-established commercial subgroup, where actors
have a dense network of both formal and informal ties. It is seen as the core of the cluster due
to their large knowledge base and status as role-models in terms of technological content.
• The cluster as a whole also has a large and diverse base of global pipelines and the fairly dense
network of weak formal and informal ties between the 42 most central organizations should
ensure that at least explicit knowledge is diffused throughout the core of the cluster. As such,
cluster members have a large knowledge base and are up-to-date in the field of mechatronics.
• The existence of an institutional subgroup is a testament to the active role taken by the
institutions in the cluster in including younger and smaller mechatronics firms into the social
network. To this end, especially Danfoss related companies along with the two membership

112
organizations CfE and CSI take on central roles in the cluster, and these organizations’
dedication to the development of the cluster and the region is a strong asset to the cluster.
• Finally, the large proportion of cooperative and vertical relations between cluster members
supports the establishment of a strong knowledge network.
Although, the cluster does have strengths, there are also several weaknesses and challenges that
need attention. In prioritized order, they are;
• Overall, there is a low degree of interest in peers’ technologies inside the cluster, which is seen
as a very large hindrance for the development of knowledge sharing relations between actors.
Furthermore, even the most central actors do not all have knowledge of each other, which is the
first step in building up relations.
• Tacit knowledge is expected to circulate especially inside the commercial subgroup, but not
diffuse to other parts of the cluster. This is both due to the lack of frequent contact with actors
across the cluster, but also due to the breadth of the cluster and the different sizes of firms in
the two subgroups, which suggests that there might be a communication barrier.
• The cluster as a whole also has a relatively low density of relations between actors, which
means that especially many of the peripheral actors have very little benefit from the CI.
• The cluster is small and the concentration of firms in the geographical area is low. Therefore, to
create awareness of the cluster and to increase the knowledge base in the cluster growth is
needed. Prior studies have found that the frame conditions in the area are negatively influenced
by the region’s peripheral location, and this makes the task of growing the cluster harder.
• In accordance with prior studies, we find that the cluster members’ ‘most important’ business
ties are with actors outside the cluster. The absence of important competitors negatively
influences the competitive pressures and actors’ ability to benchmark within the cluster, while
the absence of important buyers and suppliers may negatively influence the extent to which
processes and products can be optimized through collaboration within the cluster.
• Finally, the poor frame conditions in the area and especially the difficulties in attracting skilled
labour are major threats to the cluster.
At present, we observe more critical weaknesses and threats in the cluster than there are strengths
and opportunities. However, there is a good foundation from which the cluster can prosper, if the
appropriate action is taken and the many serious challenges are addressed. To this end, we note

113
that the two last-mentioned ‘weaknesses’ although prioritized lower than the others are very
substantial. As we will explain in the next section, however, the fact that the ‘most important’
relations are to actors outside the cluster, and that there are poor frame conditions in the area, are
challenges, which cannot be addressed without dealing appropriately with the other challenges.
8.2 Cluster initiatives
At this point, we have a deep understanding of the strengths and weaknesses of the network of
firms and institutions, which make up the mechatronics cluster in Southern Jutland. We have
especially identified inefficiencies inside the cluster, but also note that there is a need to expand
the cluster. This naturally leads us to consider if and how these identified inefficiencies should be
addressed, and how the strengths and opportunities can best be exploited.
We believe that it will always be beneficial to augment a cluster’s competitiveness by creating a
stronger network and facilitating knowledge sharing, while promotion of a cluster, which is not
competitive, may not lead to any benefits. CfE hopes that the cluster is, at this point, strong
enough to promote it and thereby attract firms to the region and improve the factor conditions
(Møller 2006). Especially, the presence of an institutional subgroup, which includes many of the
younger firms, suggests that the cluster has developed positively in the last few years, but there is
still much room for improvement. Therefore, we in the following prioritize CIs targeted at
improving the social network in the cluster higher than initiatives to promote the cluster.
In line with the above findings, we see a strong need to improve the cohesiveness of actors in
the cluster and create a stronger identity of the mechatronics cluster;
o Better define boundaries of the cluster in order to create a sense of belonging
Despite many efforts to communicate the advantages of active participation in the cluster there
are still many firms who do not feel as if they belong to the cluster. Our research has showed
that a vital first step in improving the functioning of the cluster is to create a sense of belonging
among the relevant members of the cluster. One way of doing this is to better define the
geographical and functional profile of the cluster; this will enhance firms’ ability to identify
with the cluster and hopefully also reduce the cognitive distance between members as the
breadth of the cluster is narrowed. Based on the geographical location of the organizations that
are central in the cluster, the geographical centre of the cluster is identified as the greater
Sønderborg and Nordborg area. Therefore CIs should mainly be targeted at this area.

114
Furthermore, the cluster has, and will continue to, move away from such ‘low technology’
industries as machinery and equipment (29) and fabricated metal products (28). Therefore CIs
should generally not be actively targeted at firms in these industries. Instead, the functional
centre of the cluster is especially within electrical machinery and equipment (31), which is also
the largest group of respondents. Irrespective of their participation rate, however, these firms
generally have the most interesting technology to all the firms in the cluster and they are also
very active as suppliers to many of the other industries. Firms in computer and related activites
(72) also have interesting technologies to many. The reason why Danfoss and Sauer-Danfoss
are core players in the mechatronics cluster although classified as manufacturers of machinery
and equipment (29) is because they are to a large extent manufacturing electrical machinery on
a mechanical platform. As such, firms should not be excluded merely on the basis of industry
groupings and as firms move in the direction of mechatronics and therefore exhibit interest in
the CI they should be actively targeted.
o Improve the knowledge of organizations
When a common sense of belonging to the cluster has been established a natural next step is to
improve the individual member organizations' knowledge of the other cluster participants and
their technology. This is important as knowledge of the other cluster members is a precondition
for making relations to other firms. To this end, we note that the mechatronics workgroup
meetings are a good way of raising the knowledge of organizations and establishing contact.
However, we propose a more active role taken on by the mechatronics workgroup in inviting
more firms to the meetings. Interesting candidates could be a point of discussion at meetings,
and cluster members should in any case not be hesitant to invite more firms as the work group
meetings at present are mainly a forum that can open up for further idea sharing outside
meetings.
Another initiative could be to establish a presence on the Internet, where the cluster, and its
scope and focus are introduced. Similar clusters in Helsinki and Stuttgart already have web
pages introducing their cluster. It would also be beneficial to go beyond that and create online
facilities for cluster members, which could complement knowledge sharing meetings with
forums on the net; a mechatronics job index could be created online; and several other tools
could work to bring people from all levels of the organizations closer and thus also improve the
knowledge of each others’ organizations. Of course, more generally; media coverage,

115
newsletters etc. also have an impact on the knowledge of organizations and the following CIs
also implicitly work to improve the knowledge of organizations in the cluster.
o Increase cluster members’ interest in peers’ technologies
The lack of interest in peers’ technologies is a serious problem that needs to be addressed. We
propose that it is a function of the breadth of the cluster and the lack of knowledge of other
organizations. The breadth of the cluster should be improved through the above clarification of
the functional scope of the cluster, which also facilitates a stronger sense of membership for
cluster members. In addition the above suggestions work to improve the knowledge of other
organizations. However, this will not automatically raise interest and therefore further
initiatives are proposed. In particular, we propose that the firms, which have interesting
technologies to many of the central actors, should be used proactively as role models in
magazines and newsletters to both raise interest within and outside the cluster70. In line with
this, a mentoring arrangement, where newly established firms can make use of some of these
role models’ knowledge and expertise is seen as a good initiative. More generally, cluster
members should become more involved in their peers’ technologies and very importantly also
open up towards other cluster members in terms of knowledge sharing. This is seen as a long
term change as it targets firms’ “general habits of actions and thought within the cluster”
(Sorrn-Friese 2003). Some firms already have a high degree of interest in their peers’
technologies and also have interesting technologies to others. Therefore these actors should be
in a position to advocate knowledge sharing. Also, such practical measures as discussing ways
to complement, integrate or link each others’ products would increase interest as well as being
directly beneficial for firms in the cluster.
o Remedy communication barrier between subgroups and improve density of relations
In our social network analysis, we saw that the actors that are interested in peers’ technologies
and therefore participate actively in the cluster are generally closer to the commercial subgroup.
Therefore, the above initiatives work to make a more cohesive cluster as well. However, we
also suggest other initiatives directly focused at unifying the cluster;
70 Danfoss, Danfoss Drives, Powerlynx, Eegholm, Cabinplant and Automatic Syd have the most interesting technologies. Although outside the scope of our project, further investigation of the exact technological content of these firms could be beneficial in identifying the direction of the cluster and in developing its image.

116
Our research shows that strong personal relations are used for knowledge sharing and sparring,
but we see that strong personal relations tend to be with people in same or closely related
industries. Therefore, we propose that actors’ should find ways to diminish the importance of
the functional scope of their organizations (the breadth of the cluster) and instead focus on the
personal competencies. One proposal could be to make knowledge sharing groups between
people with similar job descriptions in different companies; e.g. looking for synergy effects and
developing new products in a development/engineer group, looking for ways to reduce
transportation and purchasing costs in a group consisting of purchasing and logistics people,
looking for ways to create awareness of the cluster and its firms in a group consisting of
marketing people. Besides the direct outcome of these meetings in terms of solutions to
different challenges, they should work to establish ‘first contact’, in the same way as the
mechatronics workgroup meetings have done. At the mechatronics workgroup meetings CEOs
and owners should still meet and their discussions would possibly be enriched by proposals
from the other groups.
Another interesting finding in our thesis, which is supported by other cluster studies, is that
worker movement in terms of spin-offs or just individual worker movement is an efficient way
of establishing strong ties between organizations. Therefore, an initiative such as employee
sharing has a similar effect (although less drastic), and it also makes better use of the labor at
hand if the labor cannot be put to optimal use all the time in one firm. The functional distance
and the international outlook of most cluster members allows for collaboration in exports,
procurement, and marketing in international markets, besides the sharing of technical
engineers, which is already in place.
The above proposals emphasize a strengthening of the internal functioning of the cluster.
However, they also promote the cluster towards external parties; for instance the use of role
models, a better and clearer definition of the cluster and its members, and establishing a web
page also work to create a better image of the cluster towards external parties. At this point, we
will consider some initiatives, which are directly focused on promoting the cluster externally;
o Market the region towards smaller firms and entrepreneurs
The relatively poor frame conditions of the cluster, which cannot sustain a large immediate
pressure on the work force in the region, together with the institutions’ work to include newly
established firms into the cluster opens up for the possibility of promoting the region on this

117
basis. That is, in addition to the organic growth of the existing firms, the cluster is in a position,
where it can actively target new firms and entrepreneurs. Furthermore, many of the above
mentioned CIs, such as the mentoring scheme and knowledge sharing forums can provide
smaller firms with guidance and support, which is often sought for in a new firm.
A related issue is the earlier mentioned challenge that the cluster members ‘most important’
business partners are located outside the cluster. As it is unlikely that the cluster will be able to
attract these prominent outside actors to the region due to the poor frame conditions, the cluster
should rather focus on developing the social network between existing cluster members. This
will both attract other firms, and give cluster members benefits, which translate into
competitive advantages. Gradually, as firms inside the cluster grow and their mutual ties
intensify, cluster members’ ‘most important’ business ties will be inside the cluster.
o Improve entrepreneurial linkages to academia
In connection with the above, the entrepreneurial business environment in Sønderborg needs a
stronger connection with academia. Personal relations to people in universities are used for
business purposes, due to the lower fear of hold-up between firms and universities as compared
to inter firm relations. However, there is a lack of entrepreneurial linkages between business
life and universities, although the universities should be in a good position to help develop
business models and products71. The openness towards individuals within academia should be
exploited by actively helping to initiate linkages. Already there exist forums on the Internet
(e.g. www.videntilvaekst.dk), where firms and academia offer assignments and work
respectively. Such initiatives should be strengthened and also include a greater focus on
entrepreneurship. Furthermore, universities could host business plan competitions, or otherwise
create awareness and prestige around entrepreneurship and the commercialization of ideas.
o Cultivating and growing the workforce
Finally, there is a need to constantly attract labour with skills that are relevant to the
mechatronics firms. As the cluster is situated in an outer region it is especially hard to attract
and keep young and newly educated people to the region. One way to remedy this is by
growing and promoting the cluster and lobbying for better infrastructure and more offers that
71 Furthermore, universities invest vast sums of money into research, and this knowledge should, if possibly, be exploited to the common good of both universities and firms by commercializing it.

118
can help make the region a more desirable place to live. However, the cluster members also
have the opportunity to take direct action by providing potential workers with a great offer; the
idea is to create an internship or rotation programme, where the intern is offered the possibility
of working at different mechatronics firms (both small and large), and could even go abroad for
a period, when working for one of the larger mechatronics firms. This would give especially
newly educated people a very strong offer as they can try out many different things and find the
niche where they belong. Furthermore, this would also promote stronger knowledge sharing
relations between cluster members, as the interns would become well-acquainted with people in
different firms and would be better able to see synergistic opportunities.
Of course, there are also obstacles in the way of such an internship programme, as firms would
have to commit to taking on an intern some time into the future, which could be problematic for
smaller firms, and there are also some legal obstacles in terms of whether the employment
should be with one central agency for the whole period or the intern would have different
contracts at each place. Most importantly though, it requires that the firms in the cluster agree
that such an openness in worker movement is for their common good, and that they therefore
are dedicated to embrace these interns in their organizations.
The above initiatives are especially targeted at the membership organizations and the workgroup
members. This is naturally a cause of the focus of this thesis, but we also believe that these
central players in the cluster are those that are most optimally suited for driving the cluster
forward. With regards to the execution and timeframe of the above CIs, we refer the reader to
appendix 8, where an overview of the initiatives and their impact on the identified challenges is
given. Here, we note that the primary goal of our CI is to create a stronger social network in the
cluster. The most efficient way of doing this is to first redefine the boundaries of the cluster,
which creates a sense of belonging and also allows for a more targeted communication to
relevant firms. The purpose of this communication is first to create knowledge of organizations in
the cluster and secondly to raise interest in peers’ technologies, as these are both preconditions
for building knowledge sharing relations. Finally, we note that most of the CIs targeted at the
social network in the cluster also has an impact on the frame conditions in the region and some of
the ideas mentioned in the CIs, which promote the cluster to external parties also focus on
building relations. However, in general CIs targeted at promoting the cluster to external parties
and improving the frame conditions in the region are seen as derivative or secondary objectives.

119
9 Retrospect and Prospects In this thesis we have married social network analysis and cluster theory with the purpose of
empirically studying the mechatronics cluster in Southern Jutland. This has enabled us to go
beyond prior studies in achieving an understanding of the dynamics within the cluster; we have
clarified the importance of the cluster to its members; we have analyzed the composition of
actors in the cluster and its functional and geographical boundaries; and we have further
investigated the breadth and depth of the cluster, but also identified sub groupings in the cluster
and the existence of a strong commercial ‘hub’. Finally, the many insights gained throughout our
thesis have enabled us to identify strengths and opportunities, and various types of inefficiencies
in the cluster. In the last chapter, we finally addressed these issues, and have thus answered the
problem statement and all research questions.
At this point, we consider the study in a greater perspective, and discuss whether the results and
methods are applicable in other studies. First of all, we have accumulated interesting insights,
which we think are applicable in other studies; most importantly, the combined insights from
SNA and cluster theory has allowed us to develop more tangible and operational tools than
purely quantitative or qualitative tools. We believe that through further work, this type of
marriage of quantitative and qualitative techniques will enable more meaningful benchmarking
across clusters. Secondly, the significance of frequency of contact in the use of personal ties for
sparring was an important empirical finding. We do not dispute the importance of weak ties in
connecting otherwise unconnected actors and weak ties' ability to be sources of knowledge,
however, in an empirical investigation, which by definition is more uncertain, stronger ties are
more definite representations of knowledge sharing in clusters. Finally, we also found evidence
of the importance of geography in actors’ centrality in clusters, and especially the methodology
applied also seems very strong, as it enables a clear distinction between geographical areas.
Most of the findings throughout the project, however, are only applicable to the mechatronics
cluster. For instance, the degree of ties across industry groupings, although methodologically
applicable to other studies, the findings themselves are obviously only applicable to this cluster.
The same is true for the correlation measures between size, age and prominence of organizations
and actors’ knowledge and interest of organizations in the cluster.

120
Future studies of the mechatronics cluster can introduce a dynamic dimension to our findings.
This will make our findings more comparable to other clusters, as the exact stage of development
is uncertain, at present. Also, such studies would show the effect of the CIs proposed and as such
are in fact recommended for performance measurement purposes. Future studies will also have
an even better basis for identifying the ‘true’ boundaries of the cluster and it would be interesting
to see whether the nomination of the ‘most important’ ties are changing, as this is seen as one of
the indirect (and long term) effects of many of the proposed CIs. In general, future studies of the
cluster can build on and verify our findings and proposals, while similar studies of other clusters
will enable benchmarking across clusters, although this should always be done with caution, due
to the unique nature of clusters.
Finally, we must also note that besides the static nature of the thesis, there are also other aspects,
which would be interesting to clarify in future studies; we have not identified the exact amount of
competitive relations inside the cluster, which should be a point of concern in future studies; we
are interested in knowing the importance of monetary value in nominating the ‘most important’
actors, as this would give a better understanding of the motivations behind the nominations;
further investigation of technologies interesting to the cluster members would give further
understanding of the direction of the cluster and it would be helpful in properly defining and
promoting the mechatronics cluster; and finally, further investigation into the existence of a
subgroup of lower-tech firms especially manufacturers of machinery and equipment is needed,
together with a discussion of the relevancy of such a sub grouping for the rest of the cluster.

ii
10 References Sources marked with an asterix in the end of the reference are available on the enclosed CD.
10.1 Primary sources
Meetings/mails
Fischer, Hans Henrik, Corporate Vice President, Danfoss A/S
Martens, Hans, Director at Center for Erhvervsudvikling, Sønderborg and chairman of the
mechatronics workgroup
Møller, Søren Sloth, Cluster and network consultant at Center for Erhvervsudvikling, Sønderborg
Søndergaard, Sune S., Senior Advisor, Danfoss A/S
Questionnaires
32 participants in our study (see appendix 1.1, acknowledgments and enclosed CD) (*).
10.2 Secondary sources
AEEMA (2004) “Enhancing National Economic Benefits Through a New Cluster Paradigm”,
prepared under the Innovation Access Program
Andersson, Thomas; Serger, Sylvia Schwaag; Sörvig, Jens and Hansson, Emily Wise (2004)
“The Cluster Policies Whitebook”, prepared for IKED and The Competitiveness Institute (*)
Audretsch, David B. and Feldman, Maryann P. (1996a) “Innovative Clusters and the Industry
Life Cycle”, Review of Industrial Organization 11, pp. 253-273 (*)
Audretsch, David B. and Feldman, Maryann P. (1996b) “R&D Spillovers and the Geography of
Innovation and Production”, The American Economic Review 86(3), pp.630-640 (*)
Baptista, Rui (2000) “Do innovations diffuse faster within geographical clusters?”, International
Journal of Industrial Organization 18, pp. 515-535 (*)
Bathelt, Harald; Malmberg, Anders and Maskell, Peter (2002) “Clusters and Knowledge: Local
Buzz, Global Pipelines, and The Process of Knowledge Creation”, DRUID Working Paper No.
02-12 (*)

iii
Bekele, Gashawbeza W. and Jackson, Randall W. (2006) “Theoretical Perspectives on Industry
Clusters”, Research Paper 2006-5 (*)
Bergman, Edward M. and Feser, Edward J. (1998) “Industrial and Regional Clusters: Concepts
and Comparative Applications”, web-book available at the West Virginia University homepage
Borgatti, S.P., Everett, M.G. and Freeman, L.C. (2002) Ucinet for Windows: Software for Social
Network Analysis. Harvard, MA: Analytic Technologies.
Borgatti, Stephen P. (1997) “Multidimensional Scaling”, the article can be found at
http://www.analytictech.com/borgatti/mds.htm.
Breschi, Stefano and Lissoni, Francesco (2000) “Knowledge Spillovers and Local Innovation
Systems: A Critical Survey”, presented at the 40th European Regional Science Association
Conference in Barcelona, 29-2 September (*)
Brown, Ross (2000) “Cluster Dynamics in Theory and Practice with Application to Scotland”,
Regional and Industrial Policy Paper Number 38 (*)
Buendia, Fernando (2005) “Towards a System Dynamics-Based Theory of Industrial Clusters”
Chapter 4 Karlsson, Charlie; Johansson, Börje and Stough, Roger R. (2005) “Industrial Clusters
and Inter-Firm Networks” Corwall: Edwar Elgar Publishing
Buja, A., Swayne, D.F., Littman, M.L., Dean, L., Hofmann, H., (2004) “Interactive Data
Visualization with Multidimensional scaling” Journal of Computational and Graphical Statistics,
to appear. (*)
Canavos, George and Miller, Don (1999) “An Introduction to Modern Business Statistics”,
Brooks/Cole Publishing Company, California
Cohen, Wesley M. and Levinthal, Daniel A. (1990) “Absorptive Capacity: A New Perspective on
Learning and Innovation”, Administrative Science Quarterly 35(1), Special Issue: Technology,
Organizations, and Innovation, pp. 128-152 (*)
Copenhagen Economics and Inside Consulting (2005) “Udgangspunkt for vækst i Region
Syddanmark – De første skridt til et faktabaseret grundlag”, report ordered by Erhvervs- og
Byggestyrelsen for the temporary Vækstforum in Southern Denmark (*)

iv
COWI (2006) “Undersøgelse af potentielle mekatronik klynge deltagere”, study carried out by
COWI on demand from the URS Mekatronik Arbejdsgruppe (*)
Danfoss (2005) “Info kit 2005 DK”, available for download at www.danfoss.com
DeJordy, R., Borgatti, S., Roussin, C., and Halgin, D., (2006) “Visualizing Proximity Data”,
Field Methods. In Press. (*)
Den Hertog, Pim; Leyten, Jos; Limpens, Imke and Whalley, Jason (1999) ”Approaches to cluster
analysis and its rationale as a basis for policy”, Chapter 5 in literature review for the RISE project
(*)
Ecotec Research and Consulting “A Practical Guide to Cluster Development” A report to the
Department of Trade and Industry and the English RDAs (*)
Enright, Michael J. (1998) “The Globalization of Competition and the Localization of
Competitive Advantage: Policies toward Regional Clustering”, paper presented at Workshop on
the Globalization of Multinational Enterprise Activity and Economic Development May 15-18
1998 (*)
Everton, Sean F., (2004) “A guide for the visually perplexed: visually representing social
networks”, Stanford University (*)
Fallah, M. Hosein and Ibrahim, Sherwat (2004) “Knowledge Spillover and Innovation in
Technological Clusters”, prepared for the IAMOT conference in Washington D.C. 2004
Feldman Maryann; Francis, Johanna and Bercowitz, Janet (2003) “Creating a Cluster While
Building a Firm: Entrepreneurs and the Formation of Industrial Clusters”, Regional Studies
39(1), pp. 129-141 (*)
Feldman, Maryann and Martin, Roger (2004) “Constructing Jurisdictional Advantage”, prepared
for the NBER Innovation and the Economy Conference in Washington D.C. April 13th 2004 (*)
Feser, E.J. “Old and New Theories of Industry Clusters” Chapter 2 in Steiner, M (1998) “Clusters
and Regional Specialisation”, Lodon: Pion Limited
Fischer, H.H., (2006) “Klynger i Sønderjylland – Monitor Projekt”, presentation by Hans Henrik
Fischer, Corporate Vice President at Danfoss from March 2006

v
Forsman, Maria and Solitander, Nikodemus (2003) “Knowledge Transfers in Clusters and
Networks – An interdisciplinary conceptual analysis”, Journal of International Business Studies
2003 (*)
Freeman, L. C., (2004) “Graphical techniques for exploring social network data”, In Carrington,
P. J., Scott, J., and Wasserman, S. (eds.), Models and Methods in Social Network Analysis, pages
248-269. Cambridge: Cambridge University Press.
Giuliani, Elisa, (2003) “Social Network Analysis: An application in the analysis of knowledge
flows in clusters of firms”, presented at DRUID conference 2003 (*)
Giuliani, Elisa, (2005) “The structure of cluster knowledge networks: uneven and selective, not
pervasive and collective”, presented at the DRUID Conference 2005 (*)
Gordon, Ian R. and McCann, Philip (2005) “Clusters, Innovation and Regional Development: An
Analysis of Current Theories and Evidence” Chapter 2 in Karlsson, Charlie; Johansson, Börje
and Stough, Roger R. (2005) “Industrial Clusters and Inter-Firm Networks” Corwall: Edwar
Elgar Publishing
Granovetter, Mark S., (1973) “The Strength of Weak Ties”, The American Journal of Sociology,
Vol. 78, No. 6. (May, 1973), pp. 1360-1380. (*)
Hanneman, Robert A. and Mark Riddle, (2005) “Introduction to social network methods”,
Riverside, CA: University of California, Riverside ( published in digital form at
http://faculty.ucr.edu/~hanneman/ )
IBM (2003) “Benchmarking of the ICT industry in West Denmark”, study carried out by IBM
Business Consulting Services for Invest in Denmark (*)
Johansson, Börje (2005) “Parsing the Menagerie of Agglomeration and Network Externalities”
Chapter 5 in Karlsson, Charlie; Johansson, Börje and Stough, Roger R. (2005) “Industrial
Clusters and Inter-Firm Networks” Corwall: Edwar Elgar Publishing
Jones, E., Conway, S., Steward, F., (eds), (2001) “Social Interaction and organisational change –
Aston Perspectives on innovation networks”, Series on technology management, vol. 6.
Krebs, Valdis, (2006) “Orgnet.com” at http://www.orgnet.com/sna.html

vi
Krugman, Paul (1991) “Increasing Returns and Economic Geography”, The Journal of Political
Economy 99(3), pp. 483-499 (*)
Kruskal, J. B. and Wish, M., (1978) “Multidimensional Scaling”, Newbury Park: Sage
Publications.
Laumann, E.O., Marsden, P.V., and Prensky, D. (1989) “The boundary specification problem in
network analysis”. Due to inaccessibility to the original version here only based on Wasserman
and Faust (1994) review of the paper.
Lublinski, Alf Erko (2002) “Geographical Business Clusters – Concepts for Cluster-
Identification with an Application to an Alleged Aeronautics Cluster in Northern Germany”,
doctor dissertation at Hamburg University (*)
Malmberg, Anders and Maskell, Peter (2001) “The elusive concept of localization economies:
towards a knowledge-based theory of spatial clutering”, Environment and Planning 34, pp. 429-
449
Malmberg, Anders; Solvell, Orjan and Zander, Ivo (1996) “Spatial Clustering, Local
Accumulation of Knowledge and Firm Competitiveness”, Geografiska Annaler. Series B, Human
Geography 78(2), pp. 85-97 (*)
Markusen, Ann (1996) “Sticky Places in Slippery Space: A Typology of Industrial Districts”,
Economic Geography 72(3), pp. 293-313 (*)
Martin, Ron and Sunley, Peter (2003) ”Deconstructing Clusters: Chaotic Concept or Policy
Panacea?”, Journal of Economic Geography 3, pp. 5-35 (*)
Martinez, Cristina (1998) “Industry Clusters: Competitive Advantage Through Innovation”,
Industry Cluster Studies Number 1 by the Hunter Regional Development Organisation (*)
Maskell, Peter (2001) “Towards a Knowledge-based Theory of the Geographical Cluster”,
Industrial and Corporate Change 10(4), pp. 921-943 (*)
Maskell, Peter and Kebir, Leila (2005) “What Qualifies as a Cluster Theory?”, DRUID Working
Paper No. 05-09
Monitor Group (2004) “Recommendations for the Sønderjylland Regional Development
Project”, Presented at Danfoss on August 27th 2004. The document is confidential. (*)

vii
Pallesen, Kristian, Martens, Hans and Møller, Lisbet Holm (2006) “Sønderborg, Sønderjylland –
det vil vi!” Newsletter printed by Als Offset and issued by Sønderborg Kommune. (*)
Porter, Michael E. (1998) “The Adam Smith Address: Location, Clusters, and the “New”
Microeconomics of Competition”, Business Economics 33(1), pp. 7-15 (*)
Porter, Michael E. (2000a) “Clusters and Competition; New Agendas for Companies,
Governments and Institutions” (*)
Porter, Michael E. (2000b) “Location, Competition, and Economic Development: Local Clusters
in a Global Economy”, Economic Development Quarterly 14(1), pp. 15-34 (*)
Quimet, M., Landry, R. and Amara, N., (2004) “Network positions and radical innovation: a
social network analysis of the Quebec optics and photonics cluster”, DRUID Summer
Conference 2004 on Industrial Dynamics, Innovation and Development (*)
Rosenfeld, Stuart A. (1996) “Bringing Business Clusters into the Mainstream of Economic
Development”, European Planning Studies 5(1) (*)
Rosenfeld, Stuart A. (2001) “Backing into Clusters: Retrofitting Public Policies”, presented at the
JFK School Symposium, Harvard University March 29-30
Rosenfeld, Stuart A. (2002) “Creating Smart Systems – A guide to cluster strategies in less
favoured regions”, for European Union-Regional Innovation Strategies (*)
Scott, John (2000) “Social Network Analysis: A handbook” 2nd edition, London: Sage
Publications Ltd.
Seidman, S.B., and Foster, B.L. (1978) “A graph-theoretic generalization of the clique concept”
Journal of Mathematical Sociology. 6, 139-154.
Sirianni, Carmen and Friedland, Lewis (1995) “Social Capital”; a definition of the term in the
Civic Dictionary on the Civic Practices Network at http://www.cpn.org/tools/dictionary/
capital.html
Sölvell, Örjan, Lindqvist, Göran and Ketels, Christian (2003) “The Cluster Initiative
Greenbook”, Ivory Tower AB (*)
Sornn-Friese, Henrik (2003) “Navigating Blue Denmark – The Structural Dynamics and
Evolution of the Danish Maritime Cluster”, prepared for Søfartsstyrelsen (*)

viii
Steiner, M “The Discreet Charm of Clusters: An Introduction” Chapter 1 in Steiner, M (1998)
“Clusters and Regional Specialisation”, Lodon: Pion Limited
Talbot, David (2003) “Mechatronics: Rolf Isermann. (10 Emerging Technologies)”, Technology
Review February 2003
URS (2005) “Fra Vision til Handling – Forretningsplaner der kan løfte Sønderjylland,” available
at www.soenderjylland.dk (*)
Wasserman, S. and Faust, K., (1994) “Social Network Analysis – Methods and Applications”,
Cambridge U.K., Cambridge University Press (*)
Wolfe, David A. and Gertler, Meric S. (2004) “Clusters from the Inside and Out: Local
Dynamics and Global Linkages”, Special Issue of Urban Studies May 2004 (*)
Xu, Stephen Xingang and McNaughton, Rod B., August 18, 2003,”High Technology Cluster
Evolution: a Network Analysis of Canada’s Technology Triangle” Working Paper Series,
Institute for Innovation Research at University of Waterloo, Canada (*)