kone's interim report for january–march 2016
TRANSCRIPT
KONE Result presentation 2016JANUARY 26, 2017
HENRIK EHRNROOTH, PRESIDENT & CEO
ILKKA HARA, CFO
January 26, 2017 Results presentation 2016 | © KONE Corporation2
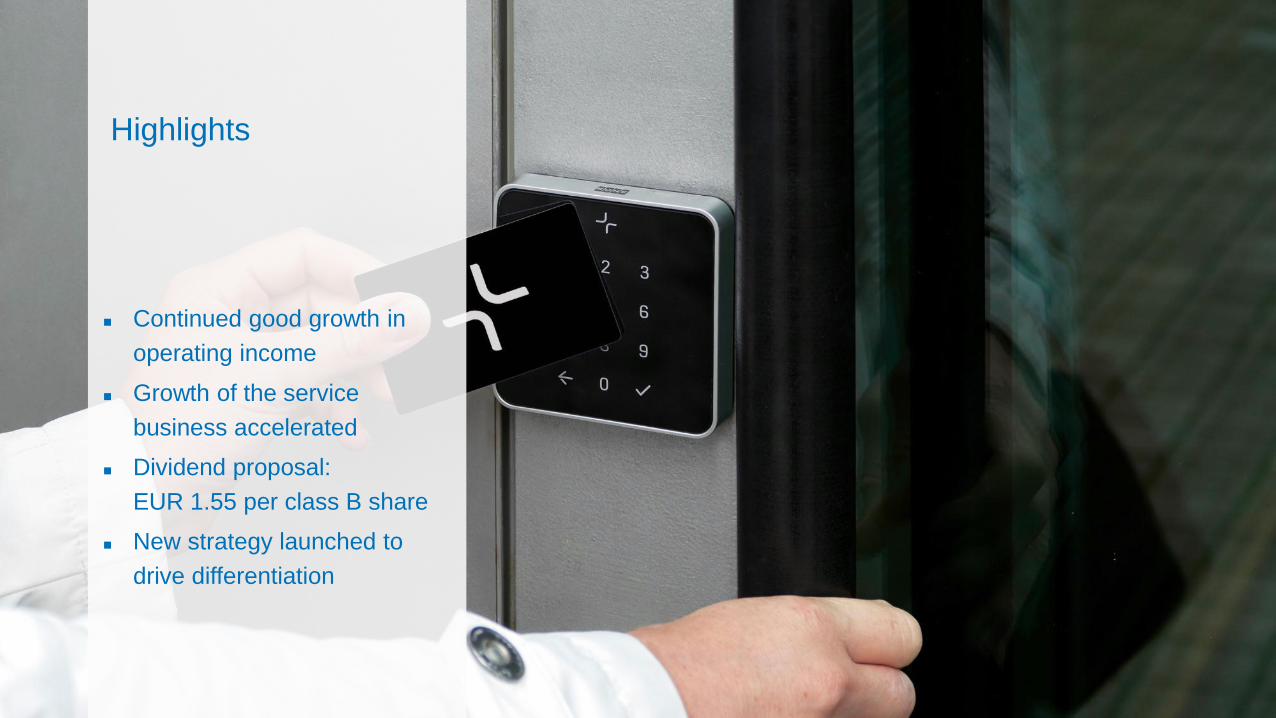
Highlights
Continued good growth in
operating income
Growth of the service
business accelerated
Dividend proposal:
EUR 1.55 per class B share
New strategy launched to
drive differentiation

Q4 2016 Key figures
January 26, 2017 Results presentation 2016 | © KONE Corporation3
Q4/2016 Q4/2015Historical
changeComparable
change
Orders received MEUR 1,839.2 1,947.2 -5.5% -2.9%
Order book MEUR 8,591.9 8,209.5 4.7% 5.4%
Sales MEUR 2,593.2 2,561.8 1.2% 3.6%
Operating income (EBIT) MEUR 392.2 378.5 3.6%
Operating income margin (EBIT %) % 15.1 14.8
Cash flow from operations
(before financing items and taxes)MEUR 409.8 403.5
Basic earnings per share EUR 0.58 0.71
Basic earnings per share, adjusted* EUR - 0.49
SOLID PROFIT DEVELOPMENT CONTINUED
* Excluding extraordinary dividend of MEUR 118 from TELC in 2015

1–12/2016 Key figures
January 26, 2017 Results presentation 2016 | © KONE Corporation4
ALL BUSINESSES CONTRIBUTED TO THE GROWTH IN OPERATING INCOME
1–12/2016 1–12/2015Historical
changeComparable
change
Orders received MEUR 7,621.0 7,958.9 -4.2% -1.6%
Order book MEUR 8,591.9 8,209.5 4.7% 5.4%
Sales MEUR 8,784.3 8,647.3 1.6% 3.9%
Operating income (EBIT) MEUR 1,293.3 1,241.5 4.2%
Operating income margin (EBIT %) % 14.7 14.4
Cash flow from operations
(before financing items and taxes)MEUR 1,509.5 1,473.7
Basic earnings per share EUR 2.00 2.01
Basic earnings per share, adjusted* EUR - 1.79
* Excluding extraordinary dividend of MEUR 118 from TELC in 2015

January 26, 2017 Results presentation 2016 | © KONE Corporation5
14%
(12%)
31%
(31%)
55%
(57%)
ModernizationMaintenanceNew equipment
19%
(17%)
40%
(39%)
41%
(44%)
EMEA (Europe, Middle East and Africa) AmericasAsia-Pacific
BY BUSINESS BY AREA
1–12/2016 Sales splitSHARE OF MODERNIZATION AND THE AMERICAS CONTINUED TO GROW
1–12/2015 figures in brackets.
Figures in charts are rounded and at historical exchange rates.
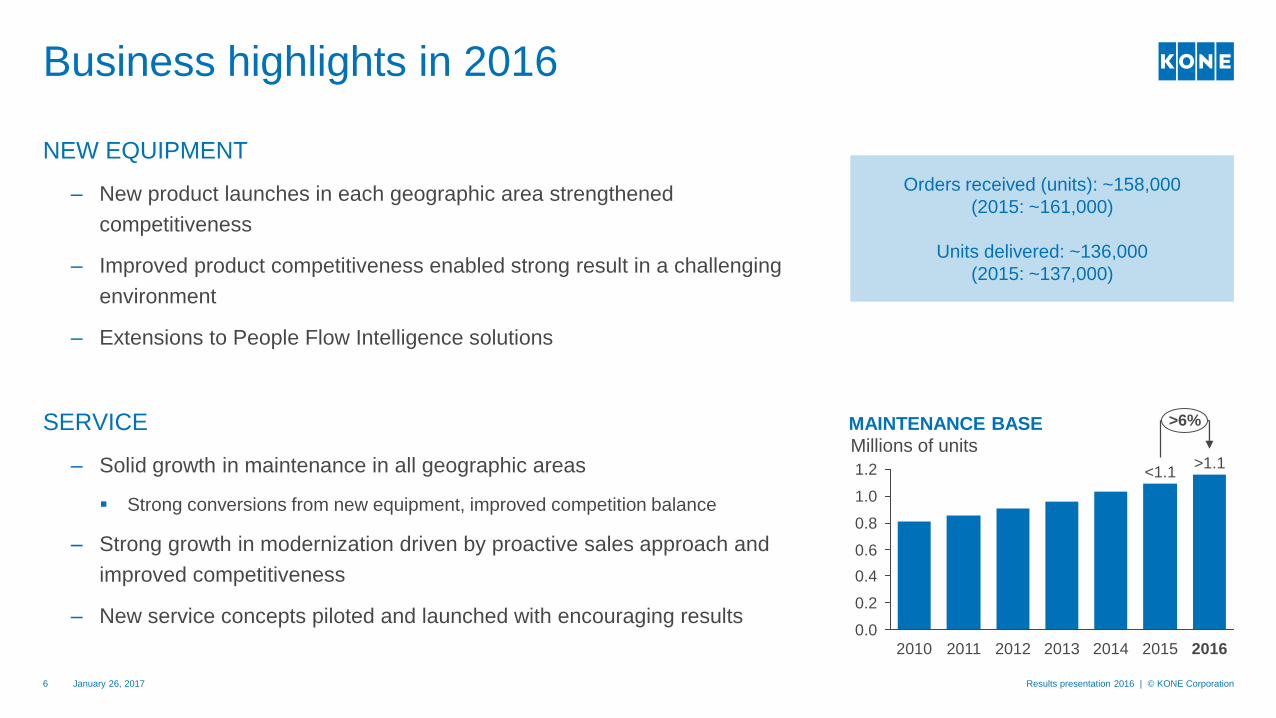
Business highlights in 2016
NEW EQUIPMENT
– New product launches in each geographic area strengthened
competitiveness
– Improved product competitiveness enabled strong result in a challenging
environment
– Extensions to People Flow Intelligence solutions
SERVICE
– Solid growth in maintenance in all geographic areas
Strong conversions from new equipment, improved competition balance
– Strong growth in modernization driven by proactive sales approach and
improved competitiveness
– New service concepts piloted and launched with encouraging results
January 26, 2017 Results presentation 2016 | © KONE Corporation6
1.2
1.0
0.8
0.6
0.4
0.2
0.0
>6%
2016
>1.1
2015
<1.1
20142013201220112010
MAINTENANCE BASEMillions of units
Orders received (units): ~158,000
(2015: ~161,000)
Units delivered: ~136,000
(2015: ~137,000)
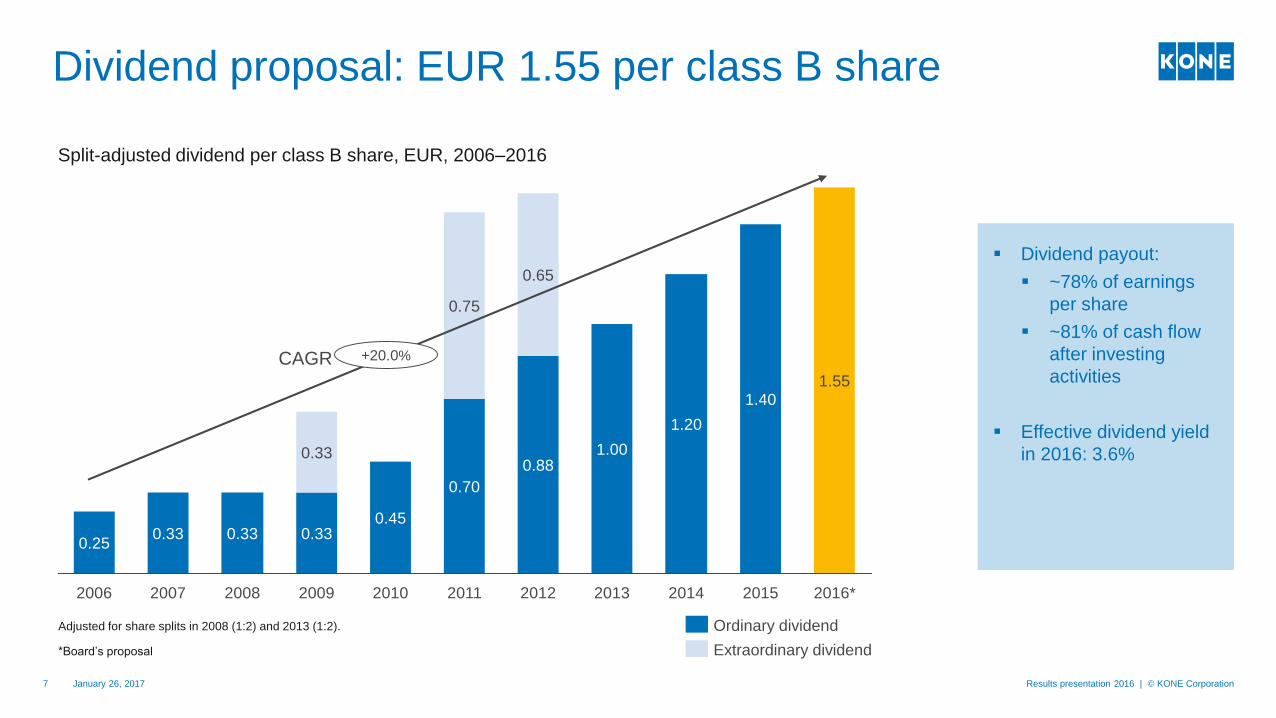
Split-adjusted dividend per class B share, EUR, 2006–2016
Adjusted for share splits in 2008 (1:2) and 2013 (1:2).
*Board’s proposal
Dividend proposal: EUR 1.55 per class B share
January 26, 20177
Dividend payout:
~78% of earnings
per share
~81% of cash flow
after investing
activities
Effective dividend yield
in 2016: 3.6%
1.40
2014
1.20
2016*2015
1.55
2012
1.00
2013
0.65
0.25
2006
0.33
2008
0.33
2007 2009
0.33
0.33
0.70
2010
0.45
0.88
2011
0.75
Results presentation 2016 | © KONE Corporation
Extraordinary dividend
Ordinary dividend
CAGR +20.0%

January 26, 2017 Results presentation 2016 | © KONE Corporation8
Market development

January 26, 2017 Results presentation 2016 | © KONE Corporation9
New equipment market development in Q4
EMEA market North American market Asia-Pacific market
Q4 development
(in units) +/- + -
Share of global
market (in units)
• Decline in Central and North
Europe from a high comparison
level
• Slight growth in South Europe
• Continued market uncertainty in
the Middle East
• Slight growth in the United
States with positive
development in residential and
commercial segments
• Pricing environment continued
to develop positively
• Market in China declined
slightly in units and clearly in
monetary value. Pricing
environment remained tough
• Decline in India due to market
uncertainty. Also Australian
market declined
• Southeast Asian market grew
but situation varied from country
to country
>2/3<5%~20%
GLOBAL MARKET VOLUMES REMAINED RATHER STABLE

January 26, 2017 Results presentation 2016 | © KONE Corporation10
MARKET CONDITIONS IN CHINA CONTINUED TO BE CHALLENGING IN Q4
Chinese property market
Inventories Housing prices E&E market
• Inventories of unsold apartments low in
higher-tier cities but still somewhat
elevated in lower-tier cities
• Authorities have taken actions to curb the
steep rise in housing prices in several
higher-tier cities
• Real estate investment recovered in 2016
following stimulation and rising land prices
• Slight decline in E&E units ordered in Q4
with continued price pressure (same
magnitude as during the previous
quarters)
18.7
0.9
-10
0
10
20
30
Q3
2016
Q1
2016
Q3
2015
Q1
2015
Q3
2014
Q1
2014
M-o-MHousing prices, Y-o-Y
10.0
-10
0
10
20
30
Slight
decline
Q3
2016
Q1
2016
Q3
2015
Q1
2015
Q3
2014
Q1
2014
E&E market Y-o-Y in units
REI Y-o-Y
Sources: China NBS, E-house, CREIS, KONE estimates
12/2016: Q4 2016:
7.98.9
24.4
0
10
20
30
40
50
Q3
2016
Q1
2016
Q3
2015
Q1
2015
Q3
2014
Q1
2014
sample of lower tier citiesTier-2Tier-1
11/2016:
Newly built area for sale / monthly sales 3-m MVA

Service market development in Q4
EMEA market North American market Asia-Pacific market
Maintenance+ + ++
Q4 development
Share of global
market (in units)
• Pricing environment remained
tough especially in South
Europe
• Price competition remained
rather intense
• Continued good growth across
the region
Modernization+ ++ ++
Q4 development
Share of global
market
(in monetary value)
• Significant market growth in
Central and North Europe;
slight decline in South Europe
• Pricing environment continued
to develop favorably
• Strong market growth
~35%<10%<50%
CONTINUED GROWTH ACROSS REGIONS
~15%~25%~1/3
January 26, 2017 Results presentation 2016 | © KONE Corporation11

January 26, 2017 Results presentation 2016 | © KONE Corporation12
Q4 and 2016 financials

1,500
1,000
500
0
2,500
2,000
+0.4%-5.5%
-5.7%
Q4
1,839
Q3
1,772
Q2
2,068
Q1
1,942
-5.4%
54
Q4 2015
1,947
Growth at
comp. FX
FX
1,839
Q4 2016
January 26, 2017 Results presentation 2016 | © KONE Corporation13
Orders receivedORDERS RECEIVED GREW IN ALL REGIONS OUTSIDE CHINA BOTH IN Q4 AND FULL YEAR 2016
MEUR
2009 2016
At historical exchange rates
The relative margin of orders
received declined slightly in
H2/2016 but remained at a good
level
+ Modernization
+ New equipment in
all regions outside
China
- New equipment in
China
-2.9%

2,1702,273
1,748
2,593
0
500
1,000
1,500
2,000
2,500
3,000
Q1 Q2 Q3
+1.2%
Q4
-0.6%+2.8%
+3.4%60
FX Q4
2016
Mo
de
rniz
atio
n
2,593
Ma
inte
nan
ce
Ne
w e
qu
ipm
en
t
Q4
2015
2,562
January 26, 2017 Results presentation 2016 | © KONE Corporation14
SalesSALES GROWTH DRIVEN BY SERVICE BOTH IN Q4 AND FULL YEAR 2016
MEUR
2009 2016
At historical exchange rates
EMEA: +9.4%
Americas: +14.3%
Asia-Pacific: -6.9%
+3.6%
At comparable exchange rates:
-0.3%
+7.2%
+12.4%

331349
221
392
0
250
500
+3.6%
+1.6%+7.2%
+4.5%
Q4Q3Q2Q1
14
Growth FX Q4 2016
379
ProfitabilityQ4 2015
392
January 26, 2017 Results presentation 2016 | © KONE Corporation15
Operating incomeALL BUSINESSES CONTRIBUTED TO EBIT GROWTH IN Q4 AND FULL YEAR 2016
MEUR
2009 2016
At historical exchange rates
+ Productivity
improvements
especially in new
equipment
January 26, 2017 Results presentation 2016 | © KONE Corporation16
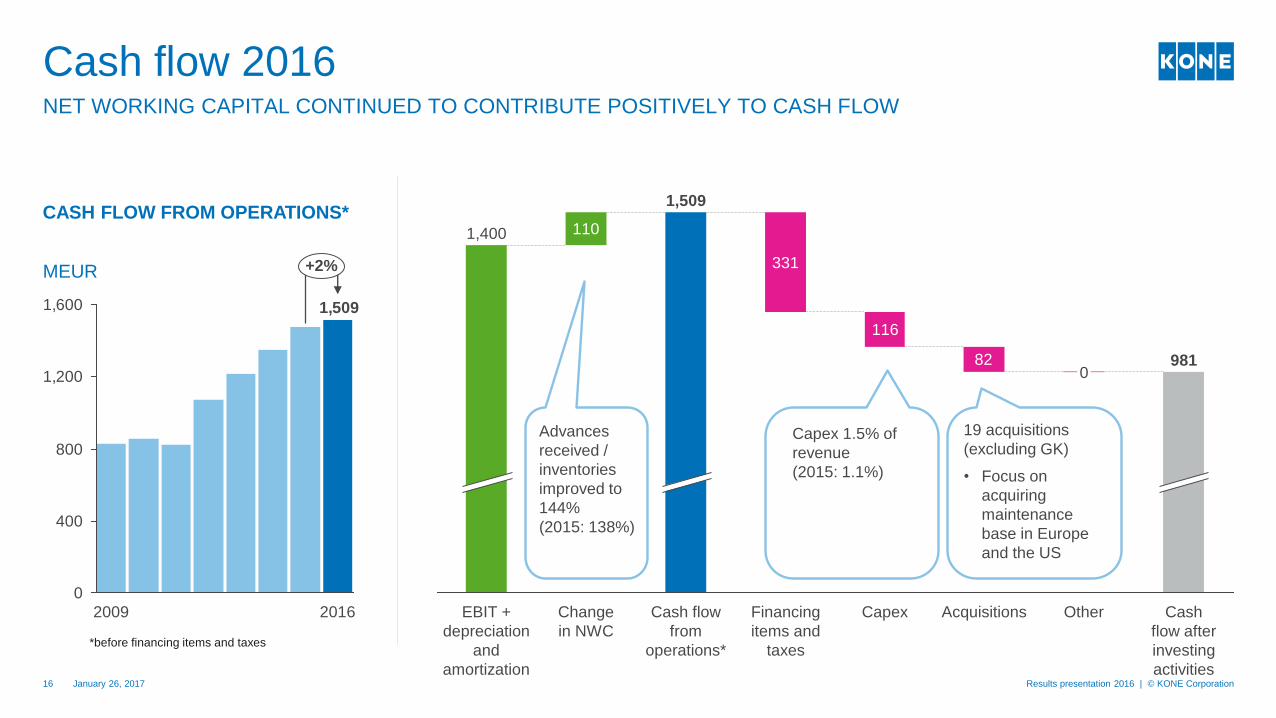
NET WORKING CAPITAL CONTINUED TO CONTRIBUTE POSITIVELY TO CASH FLOW
Cash flow 2016
110
331
116
82
Other
1,509
Change
in NWC
Cash flow
from
operations*
Financing
items and
taxes
Capex
0
Acquisitions Cash
flow after
investing
activities
981
1,400
EBIT +
depreciation
and
amortization
Capex 1.5% of
revenue
(2015: 1.1%)
19 acquisitions
(excluding GK)
• Focus on
acquiring
maintenance
base in Europe
and the US
Advances
received /
inventories
improved to
144%
(2015: 138%)
*before financing items and taxes
1,509
0
400
800
1,200
1,600
2009
+2%
2016
MEUR
CASH FLOW FROM OPERATIONS*

January 26, 2017 Results presentation 2016 | © KONE Corporation17
Market and business outlook for 2017

Market outlook for 2017
January 26, 2017 Results presentation 2016 | © KONE Corporation18
Asia-Pacific: The market in China is expected to decline by 0–5% in units ordered,
intense competition to continue. In the rest of Asia-Pacific, the market is expected to
grow.
Europe, Middle East and Africa: the market is expected to grow slightly.
North America: the market is expected to grow slightly.
The maintenance markets are expected to see the strongest growth rate in Asia-Pacific
and to grow slightly also in other regions.
NEW EQUIPMENT MARKETS
MAINTENANCE MARKETS
The modernization market is expected to grow slightly in Europe and in North America,
and to develop strongly in Asia-Pacific.
MODERNIZATION MARKETS
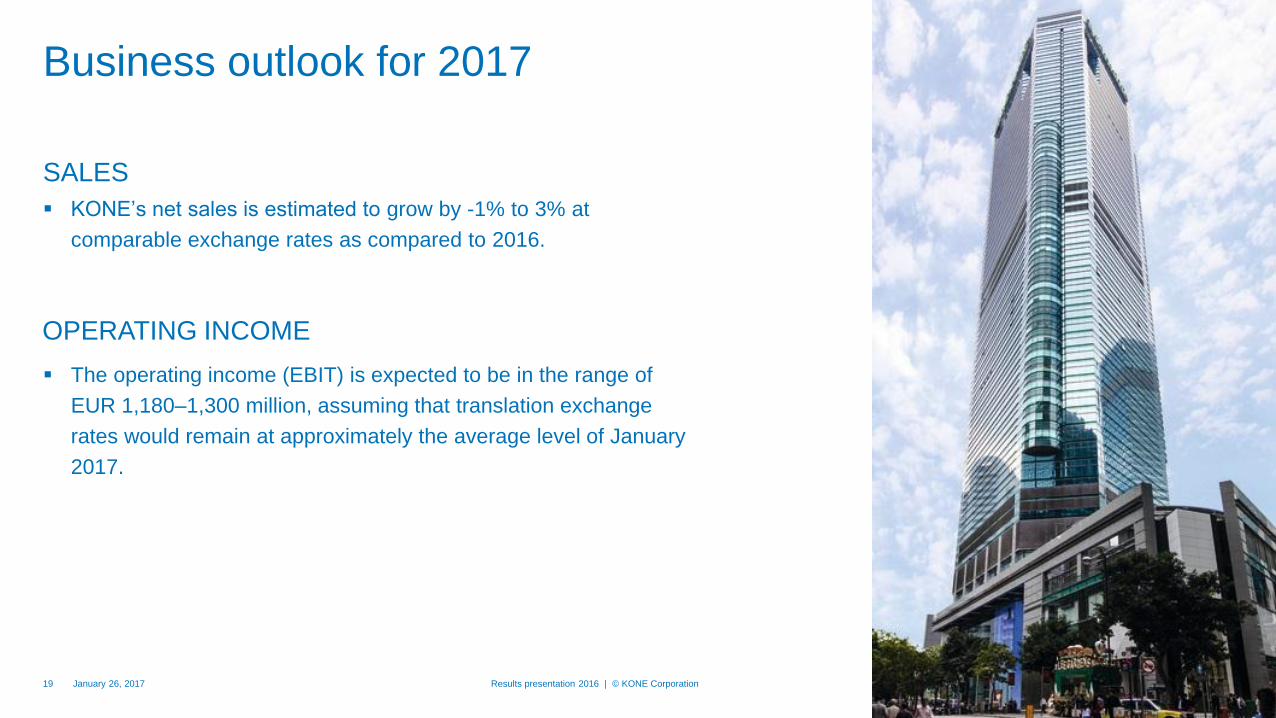
Business outlook for 2017
KONE’s net sales is estimated to grow by -1% to 3% at
comparable exchange rates as compared to 2016.
January 26, 2017 Results presentation 2016 | © KONE Corporation19
The operating income (EBIT) is expected to be in the range of
EUR 1,180–1,300 million, assuming that translation exchange
rates would remain at approximately the average level of January
2017.
SALES
OPERATING INCOME

January 26, 2017 Results presentation 2016 | © KONE Corporation20
A new phase in KONE’s strategy

3%
14%
11%
9%
8%
8%
Sales and operating income 2013–2016
January 26, 201721
2014
7,335
2013
6,933
2016
8,784
2015
8,647
+8%
Asia-PacificAmericasEMEA
Results presentation 2016 | © KONE Corporation
8,647
2013
8,784
7,3346,933
2014 2015 2016
New equipment Modernization Maintenance
SALES BY AREA
MEUR
SALES BY BUSINESS
MEUR
1,241
1,036953
1,293
2014 2015 2016
+11%
2013
OPERATING INCOME
MEUR
CAGR CAGR
CAGRCAGR
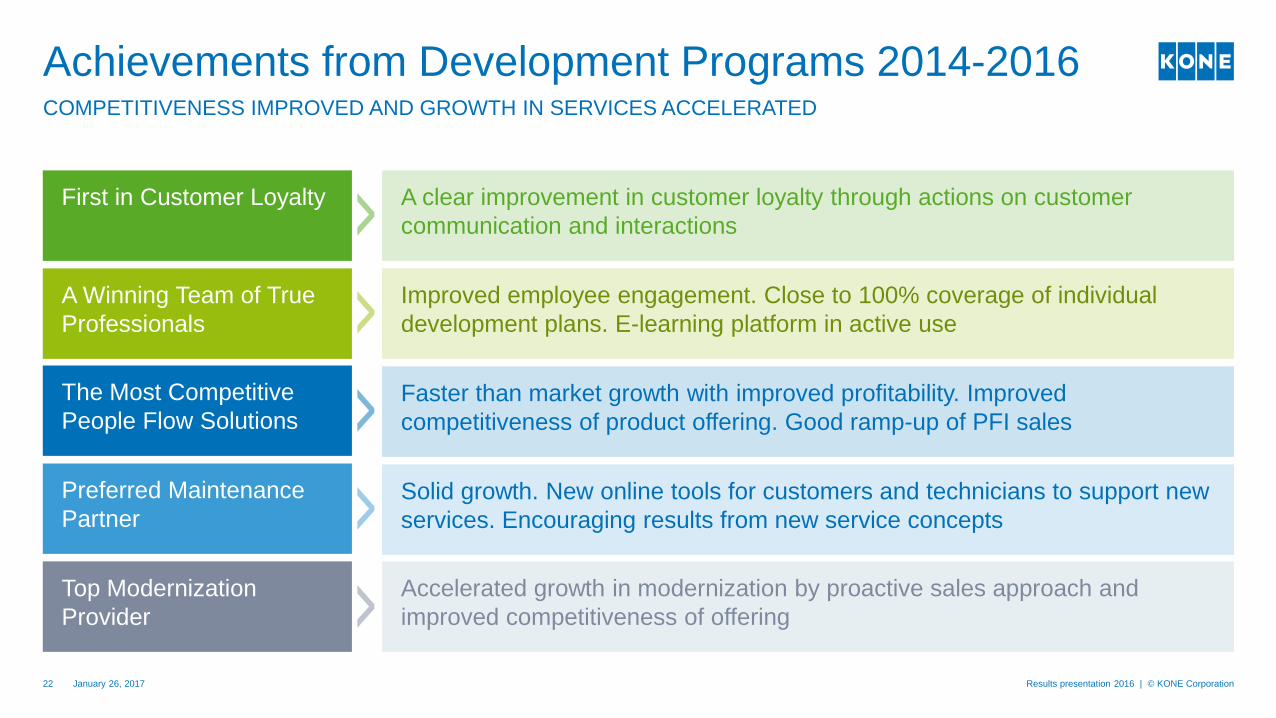
Achievements from Development Programs 2014-2016
January 26, 2017 Results presentation 2016 | © KONE Corporation22
COMPETITIVENESS IMPROVED AND GROWTH IN SERVICES ACCELERATED
First in Customer Loyalty
A Winning Team of True
Professionals
Improved employee engagement. Close to 100% coverage of individual
development plans. E-learning platform in active use
A clear improvement in customer loyalty through actions on customer
communication and interactions
Solid growth. New online tools for customers and technicians to support new
services. Encouraging results from new service concepts
Faster than market growth with improved profitability. Improved
competitiveness of product offering. Good ramp-up of PFI sales
The Most Competitive
People Flow Solutions
Preferred Maintenance
Partner
Top Modernization
Provider
Accelerated growth in modernization by proactive sales approach and
improved competitiveness of offering

We are entering a new phase in our strategy
Increased differentiation
Higher speed of bringing new services and
solutions to market
Capitalize on new
technologies to add value
for customers in new ways
Cater to changing
customer expectations
Drive smart and
sustainable urbanization

Winning with Customers

25
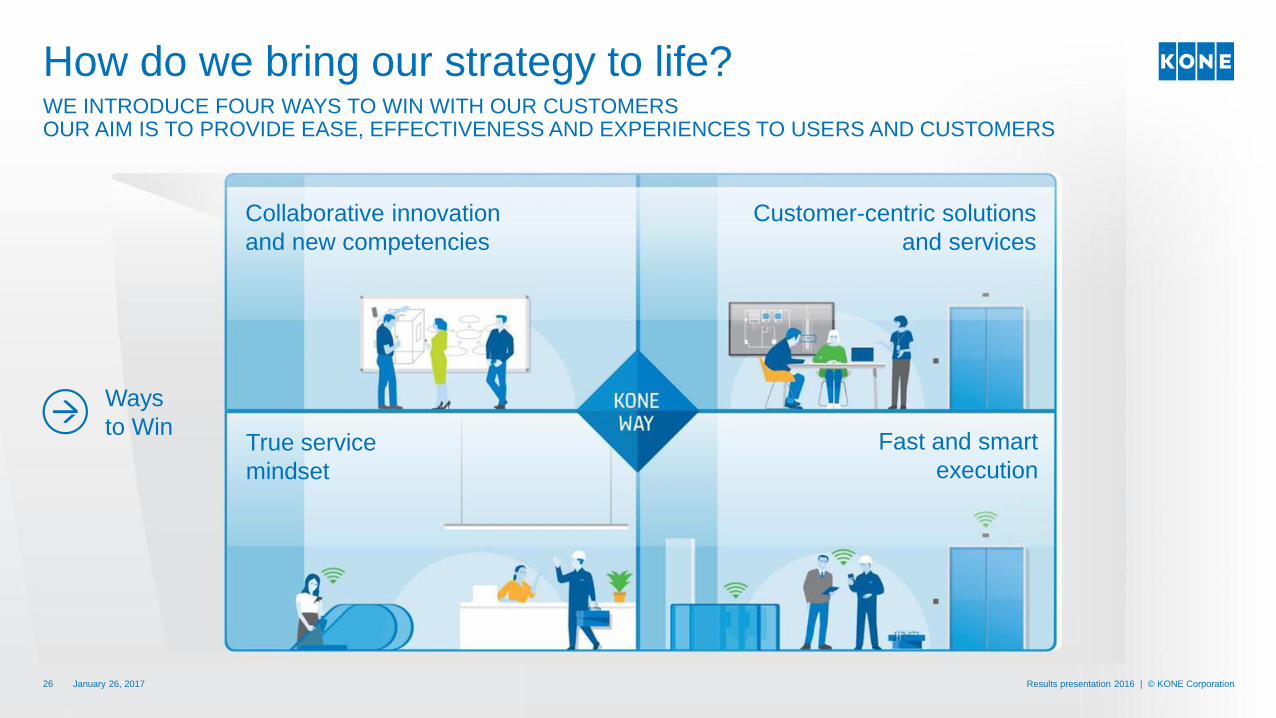
January 26, 2017 Results presentation 2016 | © KONE Corporation26
WE INTRODUCE FOUR WAYS TO WIN WITH OUR CUSTOMERSOUR AIM IS TO PROVIDE EASE, EFFECTIVENESS AND EXPERIENCES TO USERS AND CUSTOMERS
How do we bring our strategy to life?
Collaborative innovation
and new competencies
Customer-centric solutions
and services
Fast and smart
executionTrue service
mindset
Ways
to Win

Results presentation 2016 | © KONE Corporation
We are improving the flow of urban life
2016 another strong year for KONE
New strategic phase: increased differentiation and
stronger customer-centricity
Technological disruption and connectivity bring
opportunities to create value to our customers in new
ways
We are in a strong position to drive the change with a
challenger mindset
January 26, 201727

APPENDIX
January 26, 201729
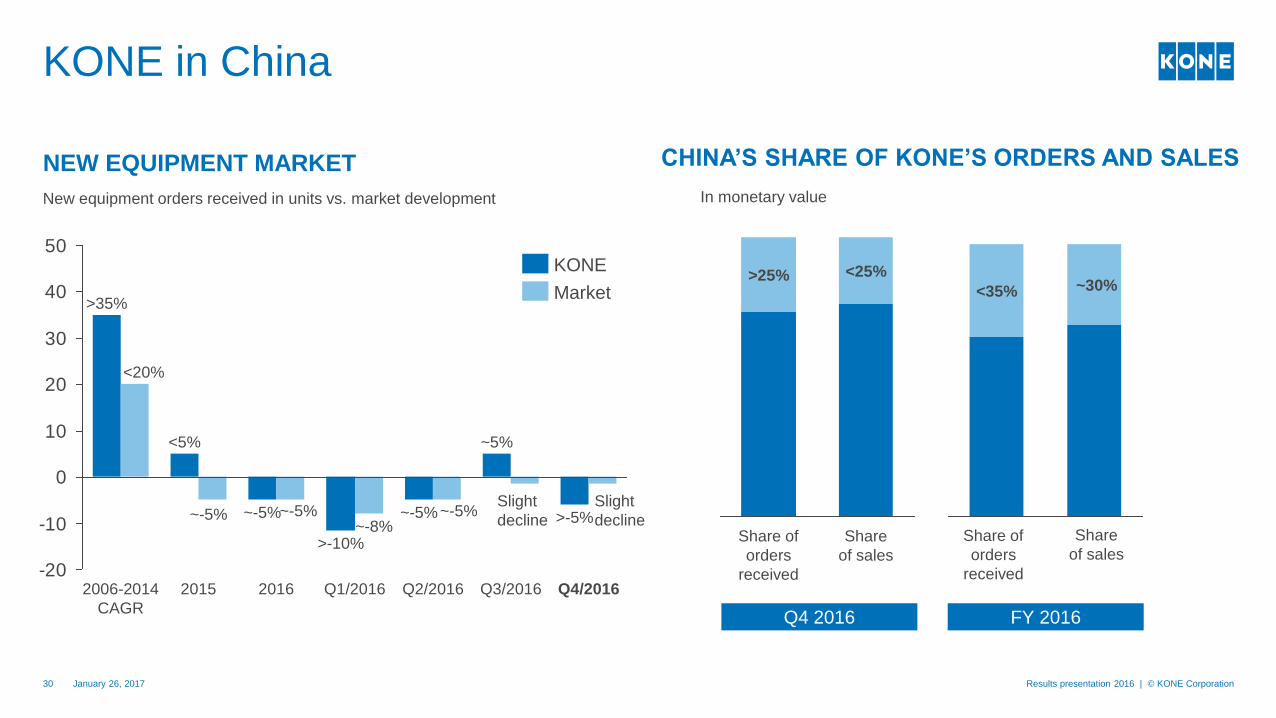
KONE in China
January 26, 2017 Results presentation 2016 | © KONE Corporation30
<25%
Share of
orders
received
>25%
Share
of sales
~30%<35%
FY 2016
Share
of salesShare of
orders
received
NEW EQUIPMENT MARKET
New equipment orders received in units vs. market development
CHINA’S SHARE OF KONE’S ORDERS AND SALES
In monetary value
-20
-10
0
10
20
30
40
50
Q4/20162006-2014
CAGR
<5%
>-5%~-5%
Q1/2016
>-10%
2015 2016 Q3/2016
~5%
Q2/2016
~-5%
<20%
>35%Market
KONE
~-5%~-8%
Q4 2016
Slight
decline~-5% ~-5%
Slight
decline

Currencies
January 26, 2017 Results presentation 2016 | © KONE Corporation31
SALES BY CURRENCY 1–12/2016
(MEUR) Q4 2016
Sales -60 -195
EBIT -14 -44
Orders
received
-54 -211
Others
USD
RMB
EUR
MAIN CURRENCIES, AVERAGE RATESCURRENCY IMPACT
9
8
7
1
0
25.1.2017201620152014
EUR-AUD
EUR-GBP
EUR-USD
EUR-RMB
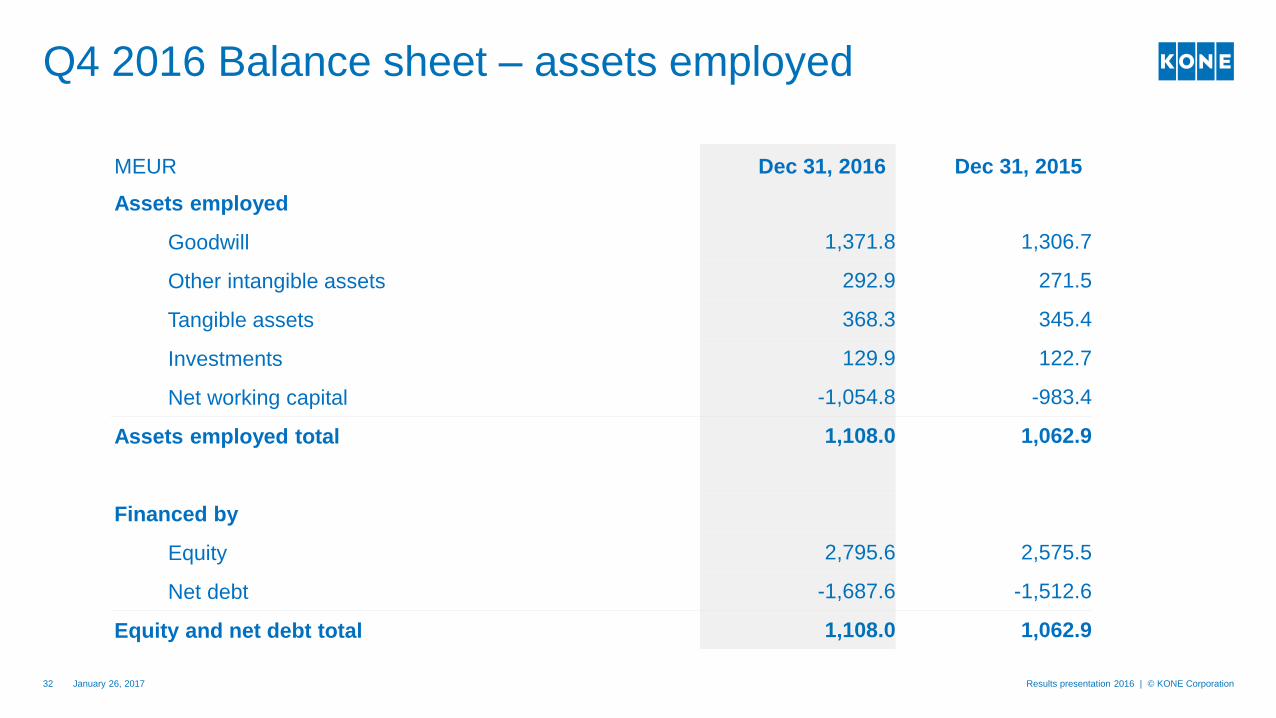
Q4 2016 Balance sheet – assets employed
January 26, 2017 Results presentation 2016 | © KONE Corporation32
MEUR Dec 31, 2016 Dec 31, 2015
Assets employed
Goodwill 1,371.8 1,306.7
Other intangible assets 292.9 271.5
Tangible assets 368.3 345.4
Investments 129.9 122.7
Net working capital -1,054.8 -983.4
Assets employed total 1,108.0 1,062.9
Financed by
Equity 2,795.6 2,575.5
Net debt -1,687.6 -1,512.6
Equity and net debt total 1,108.0 1,062.9
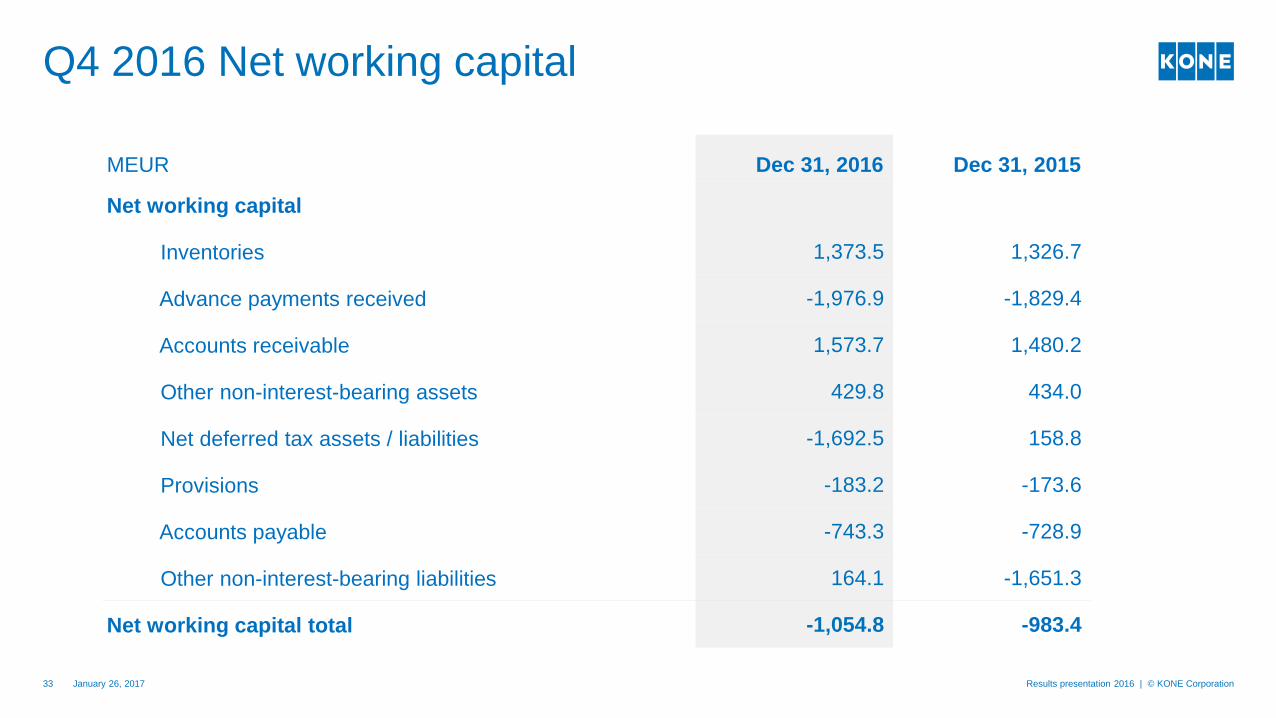
Q4 2016 Net working capital
January 26, 2017 Results presentation 2016 | © KONE Corporation33
MEUR Dec 31, 2016 Dec 31, 2015
Net working capital
Inventories 1,373.5 1,326.7
Advance payments received -1,976.9 -1,829.4
Accounts receivable 1,573.7 1,480.2
Other non-interest-bearing assets 429.8 434.0
Net deferred tax assets / liabilities -1,692.5 158.8
Provisions -183.2 -173.6
Accounts payable -743.3 -728.9
Other non-interest-bearing liabilities 164.1 -1,651.3
Net working capital total -1,054.8 -983.4

Q4 2016 Consolidated cash flow
January 26, 2017 Results presentation 2016 | © KONE Corporation34
MEUR 10–12/2016 10–12/2015 1–12/2016 1–12/2015
Operating income 392.2 378.5 1,293.3 1,241.5
Change in working capital before financing items and
taxes-10.9 -0.6 109.7 132.3
Depreciation and amortization 28.6 25.6 106.5 100.0
Cash flow from operations before financing items
and taxes409.8 403.5 1,509.5 1,473.7
Financing items and taxes -92.7 32.2 -331.0 -27.0
Cash flow from operating activities 317.1 435.7 1,178.4 1,446.7
Investing activities -37.5 -41.3 -197.6 -155.0
Purchase of own shares 0.0 - -39.3 -71.2
Increase in equity (option rights) 6.9 0.2 18.4 13.5
Profit distribution 0.0 - -718.2 -616.3
Changes in non-controlling interest -0.2 - -26.7 -18.4
Free cash flow 286.3 394.6 214.9 599.5