knowing when you do not know
TRANSCRIPT
8/3/2019 Knowing When You Do Not Know
http://slidepdf.com/reader/full/knowing-when-you-do-not-know 1/76
A W O R L D B A N K S T U D Y
Ambar Narayan and
Carolina Sánchez-Páramo
Editors
S I MU L ATI N G TH E PO V E R TY AN D
D I S T R I B U T I O N A L I M P A C T S O F
A N E C O N O M I C C R I S I S
Knowing, When
You Do Not Know

8/3/2019 Knowing When You Do Not Know
http://slidepdf.com/reader/full/knowing-when-you-do-not-know 2/76
8/3/2019 Knowing When You Do Not Know
http://slidepdf.com/reader/full/knowing-when-you-do-not-know 3/76
W O R L D B A N K S T U D Y
Knowing, WhenYou Do Not Know
Simulating the Poverty and DistributionalImpacts of an Economic Crisis
Edited by Ambar Narayan and
Carolina Sánchez-Páramo
8/3/2019 Knowing When You Do Not Know
http://slidepdf.com/reader/full/knowing-when-you-do-not-know 4/76
© 2012 International Bank for Reconstruction and Development / International Development Association orThe World Bank1818 H Street, NWWashington, DC 20433Telephone: 202-473-1000
Internet: www.worldbank.org
1 2 3 4 14 13 12 11
World Bank Studies are published to communicate the results of the Bank’s work to the developmentcommunity with the least possible delay. The manuscript of this paper therefore has not been preparedin accordance with the procedures appropriate to formally-edited texts.
This volume is a product of the staff of The World Bank with external contributions. The findings,interpretations, and conclusions expressed in this volume do not necessarily reflect the views of TheWorld Bank, its Board of Executive Directors, or the governments they represent.
The World Bank does not guarantee the accuracy of the data included in this work. The boundaries,colors, denominations, and other information shown on any map in this work do not imply any judg-ment on the part of The World Bank concerning the legal status of any territory or the endorsement or
acceptance of such boundaries.
Rights and PermissionsThe material in this work is subject to copyright. Because The World Bank encourages dissemina-
tion of its knowledge, this work may be reproduced, in whole or in part, for noncommercial purposes aslong as full aribution to the work is given.
For permission to reproduce any part of this work for commercial purposes, please send a requestwith complete information to the Copyright Clearance Center Inc., 222 Rosewood Drive, Danvers, MA01923, USA; telephone: 978-750-8400; fax: 978-750-4470; Internet: www.copyright.com.
All other queries on rights and licenses, including subsidiary rights, should be addressed to theOffi ce of the Publisher, The World Bank, 1818 H Street NW, Washington, DC 20433, USA; fax: 202-522-2422; e-mail: [email protected].
ISBN (print): 978-0-8213-8981-2ISBN (electronic): 978-0-8213-8954-6DOI: 10.1596/978-0-8213-8981-2
Library of Congress Cataloging-in-Publication Data
Knowing, when you do not know : simulating the poverty and distributional impacts of an economiccrisis / edited by Ambar Narayan, Carolina Sánchez-Páramo. p. cm. Includes bibliographical references. ISBN 978-0-8213-8981-2 (alk. paper) -- ISBN 978-0-8213-8954-6 1. Poverty--Mathematical models. 2. Income distribution--Mathematical models. 3. Global FinancialCrisis, 2008-2009. I. Narayan, Ambar. II. Sánchez-Páramo, Carolina.HC79.P6K66 2011
339.4’6015195--dc23 2011048299
Cover photo: Job seekers visit a job fair for graduating university students at the Qujiang InternationalConvention and Exhibition Center in Xian of Shaanxi Province, China. © Gey Images
8/3/2019 Knowing When You Do Not Know
http://slidepdf.com/reader/full/knowing-when-you-do-not-know 5/76
iii
Contents
List of Contributors ................................................................................................................ vii
Acknowledgments ................................................................................................................viii
Foreword ....................................................................................................................................ix
1. Assessing the Poverty and Distributional Impacts of the Financial Crisiswith Microsimulations: An Overview of Country Studies ........................................ 1
Financial Crisis and Its Impact on Poverty ...................................................................... 2
Evaluating the Impact of the Crisis ................................................................................... 3
The Methodology to Estimate Impacts Ex Ante ............................................................. 4
How the Approach Works ................................................................................................ 5
Defining the “Impact”: Two Types of Countries ............................................................6
Simulating the Impact of Policy Changes ........................................................................ 8
Caveats to the Approach .................................................................................................... 8
Results from Micro-Macro Simulations for Four Countries ......................................... 9
Results for Type I Countries ............................................................................................ 12
Results for Type II Countries ........................................................................................... 19
Simulating the Impact of Policy Responses ................................................................... 25
Conclusion .......................................................................................................................... 26
2. On Economy-Wide Shocks, Models and Politics ....................................................... 30
When Are Second-Round and Systemic Eff ects a First-Order Concern? .................. 32
Implications ........................................................................................................................ 37
When Can Information Aff ect Government Behavior? ............................................... 38
Conclusion and a Note on the World Bank ................................................................... 40
3. The Distributional Consequences of the Economic and Financial Crisis of2008–09: A Comment ........................................................................................................ 42
Backdrop to the Issue of Distributional Consequences .............................................. 42
Thinking about the Problem ............................................................................................ 42
The Guts of the U.S. Story ................................................................................................ 43
Some Basic Generalizations ............................................................................................. 45
The Current Crisis in Perspective.................................................................................... 45
Results of Quick Post Crisis Surveys .............................................................................. 46
Takeaway Observations of Relevance for Policy .......................................................... 48
4. Stress Testing for the Poverty Impacts of the Next Crisis ........................................ 50
Introduction ........................................................................................................................ 50
The Need for a Social Protection Assessment Program (SPAP) ................................. 50
8/3/2019 Knowing When You Do Not Know
http://slidepdf.com/reader/full/knowing-when-you-do-not-know 6/76
iv Contents
An Overview of the Workshop Papers and Presentations .......................................... 51
An Assessment, and What’s Missing.............................................................................. 52
Conclusion .......................................................................................................................... 55
References.................................................................................................................................. 56
Figures
Figure 1.1: Scheme of the modeling process ..........................................................................5
Figure 1.2: Impacts in Type I and Type II countries ..............................................................7
Figure 1.3: Percent change in sectoral employment between benchmark and crisis(2010) ...................................................................................................................................13
Figure 1.4: Percent change in household income between benchmark and crisisscenarios (2010) ..................................................................................................................13
Figure 1.5: Percent change in poverty/inequality indicators between crisis and benchmark ..........................................................................................................................14
Figure 1.6: Percent losses in income for the general population (left) and thecrisis-vulnerable (right) ....................................................................................................15
Figure 1.7: Percentage of poor and crisis-vulnerable households in rural areas .............15
Figure 1.8: Percentage of households with low-skilled heads ............................................ 16
Figure 1.9: Growth incidence curves: percent change in income (relative to the benchmark) due to crisis .................................................................................................. 17
Figure 1.10: Transitions across deciles of per capita income (percent ofhouseholds in each decile) ............................................................................................... 18
Figure 1.11: Macroeconomic projections for Mexico (2008–09 are actualobservations; 2010–11 are forecasts) ...............................................................................19
Figure 1.12: Growth incidence curve for Mexico (2008–09) ................................................22
Figure 1.13: Transitions across deciles in Mexico .................................................................22
Figure 1.14: Growth incidence curves for Mexico (2010–11) ..............................................24
Figure 1.15: Transitions across deciles for the period 2010–11 ...........................................24
Figure 2.1: The welfare impact of food price changes in the 1997 Indonesian crisisacross households ..............................................................................................................33
Figure 2.2: The paern of change in deposits, by size and ownership of deposits,
in the lead up to the Argentinefi
nancial crisis .............................................................. 36Figure 3.1: The top percentile (1%) of U.S. income (incomes above US$368,000 in
2008) .....................................................................................................................................43
Figure 3.2: U.S. Lorenz curves for total family income and net worth ............................. 44
Figure 3.3: Household coping strategies in Turkey (survey responses) ...........................46
Figure 3.4a: Coping strategies in Armenia by asset quintile ..............................................47
Figure 3.4b: Coping strategy survey responses ....................................................................47
8/3/2019 Knowing When You Do Not Know
http://slidepdf.com/reader/full/knowing-when-you-do-not-know 7/76
vContents
Tables
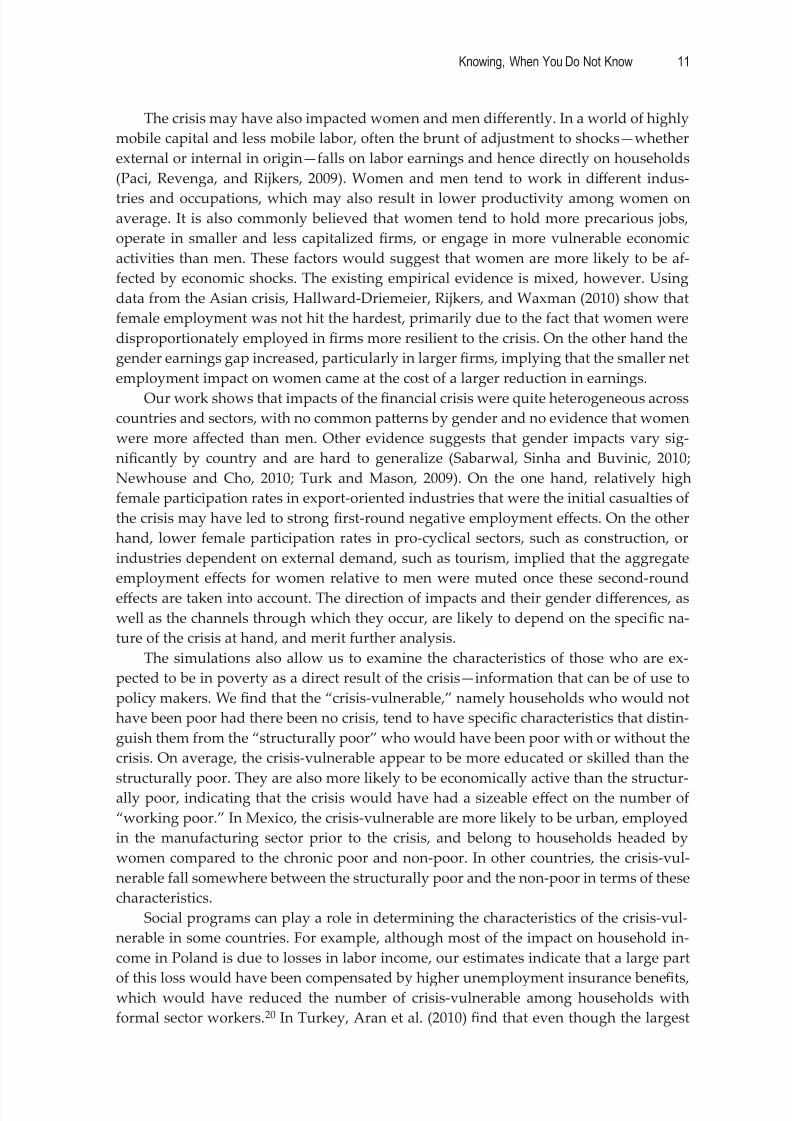
Table 1.1: Macroeconomic impacts for Type I countries .....................................................12
Table 1.2: Employment projections (population of age 15+ yrs) ........................................20
Table 1.3: Projected household income and its sources .......................................................20
Table 1.4: Poverty and inequality with and without crisis (constant poverty line) ........21

8/3/2019 Knowing When You Do Not Know
http://slidepdf.com/reader/full/knowing-when-you-do-not-know 8/76

8/3/2019 Knowing When You Do Not Know
http://slidepdf.com/reader/full/knowing-when-you-do-not-know 9/76
vii
List of Contributors
This volume includes contributions by Bilal Habib (World Bank), Ravi Kanbur (Cor-
nell University), Danny Leipziger (George Washington University), Ambar Narayan
(World Bank), Sergio Olivieri (World Bank), Carolina Sánchez-Páramo (World Bank)
and Michael Walton (Harvard Kennedy School).
8/3/2019 Knowing When You Do Not Know
http://slidepdf.com/reader/full/knowing-when-you-do-not-know 10/76
viii
Acknowledgments
This book has been edited by Ambar Narayan and Carolina Sánchez-Páramo and in-
cludes contributions by Bilal Habib and Sergio Olivieri, together with the editors
(Chapter 1), Michael Walton (Chapter 2), Danny Leipziger (Chapter 3), and Ravi Kanbur
(Chapter 4). All chapters are based on the presentations and commentaries at the World
Bank PREM Network Conference “Distributional Impacts of Macroeconomic Shocks:
An International Overview,” organized in May 2011 in Washington, DC.
The editors would like to thank conference participants for helpful comments and
suggestions. They are also grateful to Ihsan Ajwad, Tamar Atinc, Otaviano Canuto, Lou-
ise Cord, Francisco Ferreira, Anna Fruero, Alan Gelb, Indermit Gill, Jesko Hentschel,
Carlos Felipe Jaramillo, Emmanuel Jimenez, Daniela Maro
a, David Newhouse, Ricar-do Paes de Barros, Pierella Paci, Martin Ravallion, Ana Revenga, Jaime Saavedra, Sudhir
Shey, Emmanuel Skoufias, Carolyn Turk, and Ruslan Yemtsov for valuable comments
on the microsimulation exercises presented in Chapter 1. Francisco Ferreira and J. Hum-
berto Lopez provided valuable comments as peer reviewers when the microsimulation
project was launched. The editors are also deeply grateful to Ana Pacheco, Diego Bat-
tistón, and Raúl Oscar Sánchez for capable research assistance during the empirical work
conducted for multiple countries; Bilal Habib for his assistance in puing this volume
together; and Christopher Humphrey for helping edit the volume. This work would not
have been possible without the advice and support of colleagues in diff erent country
teams, including Zahid Hussain, Sanjay Kathuria, Lalita Moorty, Nobuo Yoshida, andSanjana Zaman for Bangladesh; Jehan Arulpragasam, Rashiel Besana Velarde, Ulrich
Lachler, Eric Le Borgne, Andrew Mason, Sheryll Namingit, Laura Pabón, and Mano-
har Sharma for the Philippines; Irene Clavijo and Samuel Freije for Mexico; and Benu
Bidani, Kaspar Richter, and Victor Sulla for Poland. Finally, the editors are grateful to
Stephen Pazdan for coordinating the production of this publication; to Debra Cubi ,
Lanto Ramanankasina, Nelly Obias, and Jae Shin Yang for their assistance at all stages of
the work; and to Paula Suarez Buitron for her support on website and communications.
The microsimulation work and this publication received financial support from the
Trust Fund for Environmentally and Socially Sustainable Development and the Multi-
Donor Trust Fund for the Gender Action Plan.
8/3/2019 Knowing When You Do Not Know
http://slidepdf.com/reader/full/knowing-when-you-do-not-know 11/76
ix
Foreword
Economists have long sought to predict how macroeconomic shocks will aff ect in-
dividual welfare. Macroeconomic data and forecasts are easily available when cri-
ses strike. But policy action requires not only understanding the magnitude of a macro
shock, but also identifying which households or individuals are being hurt by (or ben-
efit from) the crisis. Moreover, in many cases, impacts on the ground might be already
occurring as macro developments become known, while micro level evidence is still
unavailable because of paucity of data. Because of these reasons, a comprehensive real-
time understanding of how the aggregate changes will translate to impacts at the micro
level remains elusive. This problem is particularly acute when dealing with developing
countries where household data is sporadic or out of date.A popular solution is to extrapolate the welfare impact of a shock from the histori-
cal response of income or consumption poverty to changes in output, by estimating an
“elasticity” of poverty to growth. Although this method provides an estimate for the
aggregate poverty impact of a macro shock, it has limited value for analysts and policy
makers alike. Aggregate numbers are useful to capture the aention of policy makers
and the international community, but in the absence of any information on who is aff ect-
ed and to what extent, provide lile guidance on what actions need to be taken. To take
one example, most targeted anti-poverty programs focus on the existing poor. But when
a crisis occurs, any eff orts to expand or retool existing programs would require find-
ing out who is likely to become poor and how much more deprivation is likely to occuramong the existing poor as a result of the shock. Moreover, the specific characteristics of
an output shock, whether it is caused, for example, by a natural disaster, a reduction of
external demand, or internal macroeconomic mismanagement, may lead to very diff er-
ent impacts along the income scale that demand diff erent policy responses.
This volume outlines a more comprehensive approach to the problem, showcasing a
microsimulation model, developed in response to demand from World Bank staff work-
ing in countries and country governments in the wake of the global financial crisis of
2008-09. During the growing catastrophe in a few industrialized countries, there was ris-
ing concern about how the crisis would aff ect the developing world and how to respond
to it through public policies. World Bank staff s were scrambling to help countries designsuch policies; this in turn required information on which groups of the population, sec-
tors and regions the crisis would likely aff ect and to what extent.
The problem was exacerbated by the fact that the 2008–09 crisis was somewhat
unique. Unlike many other recent episodes of economic crisis, it did not originate in
the developing world and did not involve high levels of inflation. There was also no
consensus on who would be aff ected, partly because the anatomy of the crisis in each
country would have depended on the nature of the economy, the extent of “exposure”
to the global turmoil and the extent of integration with the developed world. Would the
middle class bear the brunt of the downturn? How much would the impacts diff er across
countries, in terms of who are aff ected? Without good high-frequency micro-level data,as is the case in most developing countries, the answers to these questions had to rely
on simulations that link macro projections with pre-crisis household data. Using simple
8/3/2019 Knowing When You Do Not Know
http://slidepdf.com/reader/full/knowing-when-you-do-not-know 12/76
x Foreword
extrapolations from a historical series of income and poverty was not enough. On the
other hand, devising a comprehensive macro-micro simulation model, linking pre-crisis
household data with Computable General Equilibrium (CGE) models was impractical
for most countries given that such models are hard to find and calibrate within the lim-
ited time available to analysts. Rather, filling this void required finding the fine balance between two competing needs: capturing the complexities that influence how macro
impacts are transmied to the households and feasibility in terms of time, cost, and data
requirements.
The void was at least partially filled by the approach developed by staff from the
Poverty Reduction & Equity Department of the World Bank, modifying some of the
well-known microsimulation models from the economic literature. Starting with the
idea of using simple macroeconomic projections as the “macro linkages” to a microbe-
havioral model built from household data, the model was conceptualized, refined and
tested in a diverse mix of countries: Bangladesh, the Philippines, Mexico, Poland, and
Mongolia. The results fed into country policy dialogue and lending operations of Bank
teams as well as various reports, research papers and briefs.
Although conceived with the financial crisis in mind, the model can be applied to
diff erent kinds of macroeconomic shocks—essentially any macro event that leads to a
change in real output at the national, sectoral and (subject to data availability) sub-na-
tional level for a country. The model has already been used to determine the impacts of
typhoons in the Philippines and Dzud (harsh winter) in Mongolia. It can also be a plat-
form to build extensions to simulate the distributional impacts of other types of macro
shocks, as long as they share certain common characteristics. For one, since this model
was developed in the context of a crisis that manifested primarily in the form of output
shocks, it focuses on the labor market as the main transmission channel, which is ideal
for analyzing the impacts of certain types of crises but not for others (such as commodity
price shocks).
While microsimulation models are powerful analytical tools to assess the impact
of macroeconomic shocks, they have important limitations and economists will have to
continue to strive to make them more effi cient and flexible. At the heart of the problem is
the need to strike a delicate balance between expediency and sophistication, while creat-
ing a model that is still workable for developing countries with sparse or outdated data,
in a context were information is needed in order to take time sensitive policy decisions:
Should a safety net program be expanded quickly to urban areas? Should employmentsubsidies be provided to firms for hiring young workers? Are farmers in need of tempo-
rary support through cheaper credit?
An important concern is that of second order impacts. The method hinges on ex-
trapolating the future from structural relationships between demographics, income, and
employment, estimated from historical data. As a result, it is unable to account for what
could happen as people change their behavior in response to (and cope with) a crisis.
This may be less serious a problem than it seems—one can argue that these responses
are in fact irrelevant, since the simulations are intended to help institute policies that
minimize the need for people to change their behavior in the first place. Even so, it is an
issue that merits careful thought.In order to find solutions to methodological and policy debates, economists need
to take advantage of periods of relative calm, rather than having to deal with them in
8/3/2019 Knowing When You Do Not Know
http://slidepdf.com/reader/full/knowing-when-you-do-not-know 13/76
xiForeword
the midst of a crisis. Ideally, when a macro shock occurs, economists should be ready to
respond with adequate analysis of impacts to inform policy measures by governments.
The true measure of “success” of these eff orts would be whether the predictions influ-
ence the governments to put in place the right kind of policies that minimize the suff er-
ing of people.In building such capacity, it is relevant to look ahead to what lies ahead in the im-
mediate future for us at the Bank and the development community in general. Building
on the experience gained from employing the model to multiple countries and seings,
a user-friendly simulation software is currently being developed by staff from the Pov-
erty Reduction & Equity Group and the Development Research Group, as a new module
of the ADePT platform developed by the Bank. Probably the first ever of its kind, this
software would greatly enhance the usability of microsimulation to predict the distribu-
tional impact of future shocks. At the same time, we see this to be not an end in itself, but
rather a foundation to build on for the future. As the model is used more frequently, we
expect to see further improvements, refinements, and applications emerging organically
from interactions with users, which will continue to improve the quality of analysis the
Bank can provide to countries during future crises.
The volume is organized as follows. Chapter 1 summarizes the methodology un-
derlying the microsimulation model to predict distributional impacts of the crisis, along
with several case studies that highlight how the model can be used in diff erent country
contexts. Chapters 2 to 4 are wrien by experts external to the Bank, two of whom par-
ticipated as discussants at a workshop on the microsimulation work organized in May,
2010 at the World Bank headquarters. Chapter 2 comments on the broader implications
and shortcomings of applying the technique described in Chapter 1 and the ability or
willingness of governments to respond adequately to its results. Chapter 3 draws par-
allels between the United States and developing countries to discuss the lessons that
can be learned for mitigating the impacts of future crises. Chapter 4 discusses how the
microsimulation approach can be sharpened to make it a beer tool for distributional
analysis moving forward.
Jaime Saavedra-Chanduvi
Director, Poverty Reduction & Equity
Poverty Reduction & Economic Management Network
The World Bank

8/3/2019 Knowing When You Do Not Know
http://slidepdf.com/reader/full/knowing-when-you-do-not-know 14/76
8/3/2019 Knowing When You Do Not Know
http://slidepdf.com/reader/full/knowing-when-you-do-not-know 15/76
1
C H A P T E R 1
Assessing the Poverty andDistributional Impacts ofthe Financial Crisis with
Microsimulations: An Overview
of Country StudiesBilal Habib
Ambar Narayan
Sergio Olivieri
Carolina Sánchez-Páramo
Thefi
nancial crisis started in a few industrialized countries in 2008, but soon led tocontractions in growth, employment and household income in both developed and
developing countries. In many countries in the developing world, the growth contrac-
tion led to increased poverty and lower income and non-income welfare. Global esti-
mates by the World Bank suggest that by 2010, the crisis could have resulted in 89 mil-
lion more people living below US$1.25 a day and 120 million more below US$2 a day,
compared to a scenario of uninterrupted economic expansion without the crisis (Chen
and Ravallion, 2009). Along with the impact on poverty, the crisis could have also had
significant impacts on the distribution of income and consumption within countries.
This chapter summarizes the results and insights from simulation exercises to esti-
mate the poverty and distributional impact of the financial crisis in selected developingcountries.1 These simulations are based on approaches suggested in economic literature,
notably Bourguignon et al. (2008) and Ferreira et al. (2008). The four countries studied
here—Bangladesh, Mexico, the Philippines, and Poland—belong to diff erent regions of
the world, and they are also characterized by vast diff erences in terms of per capita income
and other development characteristics, economic conditions prior to the crisis, and the ex-
tent and nature of impact of the crisis.2 These countries all lack real-time data to measure
the welfare impacts of the crisis, which necessitated simulations to estimate these impacts.
The report has two distinct objectives. The first is to illustrate the kind of welfare im-
pact that the crisis is likely to have had, depending on a range of country-specific factors
including the size of the aggregate shock and the channels through which impacts aretransmied. While four disparate case studies cannot represent the developing world,
the insights they provide can serve as guides to the potential impacts of future macro-
8/3/2019 Knowing When You Do Not Know
http://slidepdf.com/reader/full/knowing-when-you-do-not-know 16/76
World Bank Study2
economic shocks. The second objective is to highlight the methodological techniques
and innovations needed for a simulation approach that can provide analytically sound
and policy-relevant insights for a developing country in the absence of real-time micro-
level data or complex general equilibrium models. We hope that this report and its sup-
porting country case studies will provide a methodological road map, with its potentialuses and caveats clearly spelled out, for those analyzing countries aff ected by similar
shocks in the future, especially when they are confronted with data and time constraints
similar to those faced here.
The report also draws upon results obtained from other simulation exercises con-
ducted by Bank teams in the context of the financial crisis (see Aran et al., 2010). These
simulations were undertaken by Bank teams that needed to come up with the best ana-
lytical findings possible, facing data constraints similar to ours. The report does not dis-
cuss the results of these exercises in detail, but compares the methodologies adopted and
insights obtained with those from our simulations.3
Financial Crisis and Its Impact on Poverty
Estimating the welfare impacts of the financial crisis within developing countries has
proved diffi cult for a number of reasons. The nature of the crisis has shifted rapidly, both
across countries through trade, financing (credit and FDI) and remiances, and within
them through fiscal policies and adjustments in domestic credit and labor markets. As
the contagion spread, it took a diff erent shape within each country, based on the relative
importance of each of these factors. Moreover, evidence from previous crises suggests
that extrapolations based on historical experience can be imperfect guides to estimating
the potential impact of a macroeconomic shock. For example, there is evidence to sug-gest that the output elasticity of wages tends to be larger during downturns than dur-
ing booms, and that relative inequality falls about as often as it rises during aggregate
contractions (Paci et al., 2008). There is also evidence that the type of macroeconomic
shock maers for welfare impacts and the pace of recovery: shocks that originate in the
financial markets, for example, are often believed to result in a slower recovery of em-
ployment and household incomes.4
That said, there is some consensus on how the impact of the crisis is likely to have
spread among diff erent groups in developing countries. The initial impact is thought to
have been felt mostly by the emerging middle class in these countries, since they were
more likely to be employed in export-oriented industries and salaried jobs in the servicessector—parts of the economy that appear to have borne the brunt of the impacts initial-
ly.5 Labor markets in the formal sector were aff ected by declining demand for domestic
goods and exports, falling commodity prices and reduced availability of credit for firms.
Approximately 90 percent of households entering the middle class during 1990–2005
joined the lower tier of consumption (Ravallion, 2009), and thus risked falling back into
poverty as a result of large employment or earnings shocks. On the other hand, the im-
pact on the poor in developing countries is likely to have been limited initially, due to
the very isolation from the global markets (and the formal sector) that had prevented
them from exiting poverty in the past. But as the contagion spread from the formal to
the informal sector through the backward and forward linkages between diff erent partsof the economy, the poor are likely to have been aff ected as well.
8/3/2019 Knowing When You Do Not Know
http://slidepdf.com/reader/full/knowing-when-you-do-not-know 17/76
Knowing, When You Do Not Know 3
The poor in developing countries could have been impacted by the crisis through a
number of channels. Shocks to employment and wages in the formal sector are likely to
have pushed more people into the informal sector, which in turn would have depressed
earnings and crowded out employment. Shocks to urban manufacturing and services
may also have led to reverse migration from urban to rural areas, increasing the burdenon poor rural households and drying up remiances from workers previously employed
in the formal sector. Given that these dynamics would have occurred in country contexts
where governments were in fiscal stress due to falling revenues—and therefore had lile
room to react with appropriate policy measures—the eff ects could have been deep and
long lasting.6
Evaluating the Impact of the Crisis
As the discussion so far highlights, the impact of the crisis on income distribution and
poverty within each country is likely to have been complex and dynamic. Given thesecomplexities, an analysis of the impacts must, at a minimum, address the following is-
sues: (i) which sectors, areas and/or regions are most likely to be impacted and in what
way; (ii) how sectoral and regional impacts translate into impacts across the income or
consumption distribution; (iii) what are the characteristics of those who will become
poor as a result of the crisis; and (iv) what are the implications of how these impacts are
distributed for the design of policy responses, particularly those that seek to provide
safety nets to the aff ected.
Moreover, in order to usefully inform policy responses to the crisis, the above ques-
tions would have to be analyzed ex ante , without the benefit of micro data that capture
actual impacts. In developing countries, real-time data from the crisis period is rarelyavailable. Thus in most cases impacts must be estimated based on data that predate
the crisis, rather than delaying the analysis until post- or during-crisis data becomes
available—usually too late to inform policy measures that governments need to respond
with during a crisis. Even in countries where some real-time data is available from crisis-
aff ected sectors or regions, an ex ante approach using historical data can be useful to
simulate future impacts for hypothetical scenarios that are not available from real-time
data—for example, to compare diff erent alternative scenarios that may unfold in the fu-
ture. This is especially true for countries where the situation is changing rapidly, as was
the case for many countries when the financial crisis almost overlapped with the food
and fuel price crisis of 2008.Finally, the method for assessing poverty and distributional impacts of a crisis must
be able to account for multiple channels through which the impacts can be transmied
to households and individuals, and identify the relative importance of these channels in
a given country context. It must do so at the individual and household levels over the
entire income/consumption distribution.
A number of diff erent approaches have been used in the economic literature and
by development institutions, including the World Bank, to estimate ex ante the impact
of a crisis on household incomes and poverty. A commonly used approach involves
estimating an output elasticity of poverty , in which historical trends of output and poverty
are used to determine the responsiveness of poverty rates to growth in output, which isthen combined with macroeconomic projections to estimate the impacts of reduction in
8/3/2019 Knowing When You Do Not Know
http://slidepdf.com/reader/full/knowing-when-you-do-not-know 18/76
World Bank Study4
future growth on poverty. Although this method is easy to apply, it only provides ag-
gregate poverty (or at most, sectoral or regional) impacts and very lile information on
how the impacts are likely to be distributed among diff erent groups or sub-populations,
which is critical for policy design. Other approaches, used in a few middle-income coun-
tries, involve using microsimulation methods that combine computable general equilib-rium (CGE) models with the predictions from behavioral regressions built on pre-crisis
household data to simulate household-level impacts across the entire income/consump-
tion distribution.7
The approach adopted here is best seen as a compromise between “aggregate” ap-
proaches that rely on growth-poverty elasticities and complex macro-micro simulation
approaches that harness the power of general equilibrium models and household data.
The compromise involves combining the behavioral estimations from pre-crisis house-
hold data with aggregated macroeconomic projections. This leads to a model that is
leaner than the typical macro-micro simulation models, takes less time to compute, and
above all is applicable in countries where CGE models are either unavailable, outdated
or of poor quality. In contrast to CGE models, aggregate macroeconomic projections—
such as those for national, sectoral, or regional GDP and remiance flows—are available
for most countries with which the Bank and/or the International Monetary Fund (IMF)
has an ongoing dialogue. Compared to the simple elasticity-based approach outlined
above, this approach has the main advantage of being able to generate estimates for
individuals and households all along the distribution with and without the crisis, which
can be used for detailed poverty and distributional impact analyses. Aran et al. (2010)
use an approach that is broadly similar with ours, in terms of combining simulations
with household data and macro projections, while diff ering in how household behavior
is modeled and linked to macro projections.
The Methodology to Estimate Impacts Ex Ante8
The approach adopted here involves superimposing macroeconomic projections on be-
havioral models built on pre-crisis micro data. The model is based on the approaches
described in Bourguignon et al. (2008) and Ferreira et al. (2008)—with the important
simplification of omiing the CGE component. Instead, the behavioral models are linked
to aggregate and sector-level macroeconomic projections for a specific country and year,
and the micro-level (individual and household) snapshot of future impacts is extrapo-
lated from these projections.The model focuses on labor markets and (international) remiances as the main
channels through which the macro-level shocks impact individuals and households.
It allows for shocks (negative or positive) to labor income—modeled as employment
shock, earnings shock or a combination of both—and shocks to non-labor income from
changes in remiance flows. Most of the changes in total income are captured, since
labor income and remiances account for a significant proportion of household income
in most developing countries. Reasonable assumptions are made about impacts on other
sources of income, such as capital income, domestic remiances, rents, or public trans-
fers. These assumptions can reflect specific information about impacts on these sources
of household income, depending on what information is available for a certain country.
8/3/2019 Knowing When You Do Not Know
http://slidepdf.com/reader/full/knowing-when-you-do-not-know 19/76
Knowing, When You Do Not Know 5
How the Approach Works
Using pre-crisis micro data and macro projections for the crisis period, income distribu-
tions can be predicted at the individual and household levels for each year for which
macroeconomic projections are available. The data requirements are fairly straight-forward. At the macro level, projections are needed on: (i) output and employment by
sector and remiances, (ii) population growth, and (iii) predicted price changes. At the
micro level, a household survey is essential, with information on: (i) household income
and consumption, (ii) household and individual characteristics, and (iii) individual-level
labor force and employment status and earnings.
Macroeconomic projections for outputs (sectoral and national) are almost always
available, while employment projections are usually unavailable. Thus an important ini-
tial step in the simulation exercise is to translate output growth estimates into employ-
ment changes at the sector level, for a specific crisis year and macroeconomic scenario.
This is typically done using sectoral output-employment elasticities (estimated fromhistorical data), which can then be applied to the output growth projections to generate
changes in employment by sector. In Mexico, for example, the elasticities for 2010–11 are
estimated using information on sectoral GDP and employment changes during 2003–09
and applying a simple correlation model between both series.
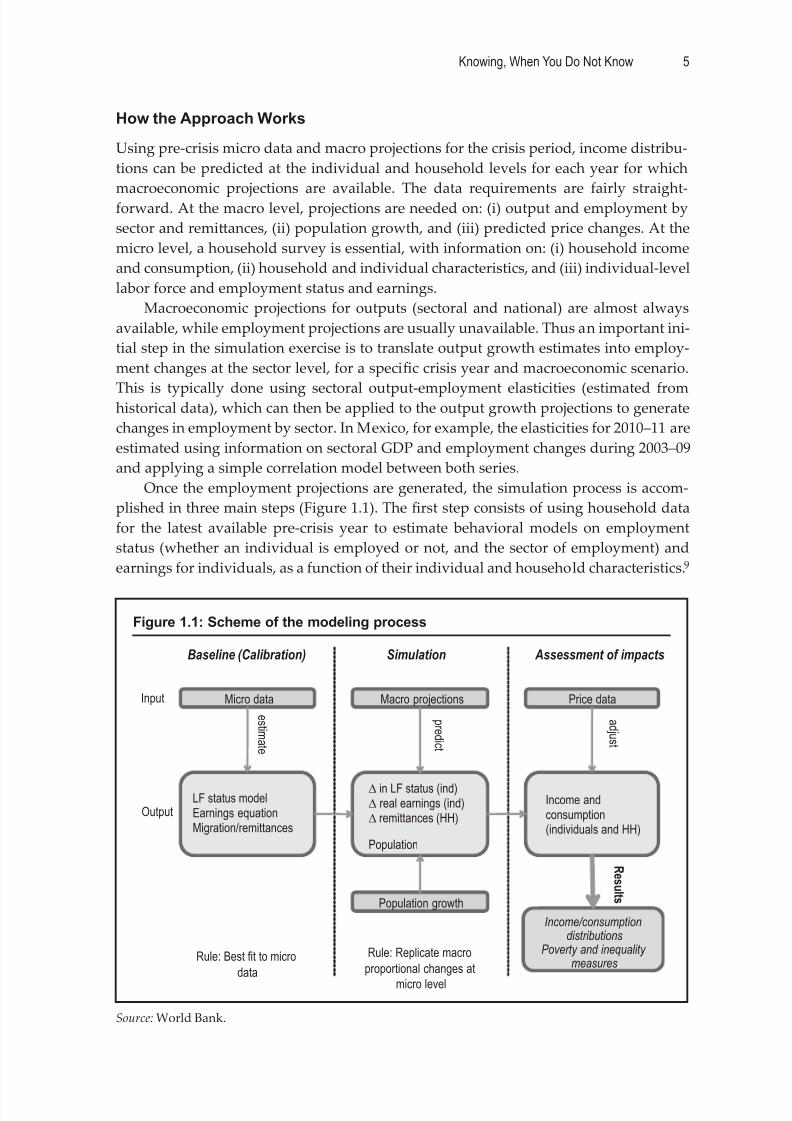
Once the employment projections are generated, the simulation process is accom-
plished in three main steps (Figure 1.1). The first step consists of using household data
for the latest available pre-crisis year to estimate behavioral models on employment
status (whether an individual is employed or not, and the sector of employment) and
earnings for individuals, as a function of their individual and household characteristics.9
Figure 1.1: Scheme of the modeling process
Source: World Bank.
Baseline (Calibration)
Micro data
LF status modelEarnings equationMigration/remittances
Rule: Best fit to micro
data
e s t i m a t e
Population growth
Simulation
Macro projections
∆ in LF status (ind)∆ real earnings (ind)∆ remittances (HH)
Population
p r e d i c t
Rule: Replicate macro
proportional changes at
micro level
Assessment of impacts
Price data
Income andconsumption(individuals and HH)
a d j u s t
Input
Output
Income/consumptiondistributions
Poverty and inequalitymeasures
R e s u l t s
8/3/2019 Knowing When You Do Not Know
http://slidepdf.com/reader/full/knowing-when-you-do-not-know 20/76
World Bank Study6
The second step consists of replicating the macro-level changes in output and em-
ployment (actual or projected) between baseline and crisis years on the household data
of the baseline year. This process uses predictions of behavioral models estimated on the
pre-crisis household data (as in step 1 above) and generates household and individual-
level predictions for employment, earnings and remiances for specific crisis years andmacroeconomic scenarios. Since an individual’s labor income depends on his/her em-
ployment status and labor earnings, how the output shock in a particular sector is ap-
portioned between employment shocks, earnings shocks, and adjustments across sectors
depends on how responsive (elastic) employment in that sector is to output changes. It
also implies that at the household level, the extent of the impact depends on the size
of the aggregate shocks at the sector level and the demographics and characteristics of
household members, which influence the labor force status and earnings of household
members after the shock.
The simulations are also adjusted for population growth, using offi cial population
projections (disaggregated by gender and age groups) to fully account for demographic
changes that would aff ect the size and composition of the labor force and, through that,
the estimates of per capita household income. This is done by re-weighting households in
the baseline data to replicate demographic changes predicted by population projections.
To simulate changes in non-labor income, projections of aggregate changes in remit-
tances are linked to pre-crisis remiance information from household data using a simple
assignment rule to ensure that the total change in remiances received by households is
equal to the projected change in remiances from the macro data.10 Some components of
non-labor income are assumed to grow at the rate of aggregate GDP for the relevant pe-
riod (profits, rents and domestic remiances), while others are kept constant in real terms at
the baseline year level or changed in accordance with specific information received for each
country (social benefits, pensions or other transfers, depending on the country).
The steps outlined above yield a projected income distribution corresponding to a
specific crisis year and macroeconomic scenario. In the case of Bangladesh, where pov-
erty is defined in terms of consumption, household incomes are transformed into pre-
dicted consumption levels using the average propensity to consume for each household
from the baseline year. The final step consists in using price projections to adjust the
poverty line to reflect the diff erence in food and non-food inflation rates between base-
line and crisis years. Since the poverty line is typically anchored to a food basket that en-
sures a minimum calorie intake, for countries where food infl
ation is expected to be sig-nificantly diff erent from general inflation between baseline and crisis years, the baseline
poverty line would not be enough for a household to meet the basic food requirements
in the crisis year.11 For the countries where food prices are a concern of policy makers
(Bangladesh, the Philippines, and Mexico), a small upward adjustment is made to the
poverty line to ensure that the same food basket remains aff ordable.12 These poverty
lines are then compared with predicted household incomes/consumption to generate
poverty estimates for each crisis year and scenario.
Defining the “Impact”: Two Types of Countries
The impact of the crisis on poverty indices and income distribution can be measuredin two ways: a “before-after” comparison of the change in welfare status in a country
between pre-crisis and crisis years, and a “with-without” comparison of the diff erence
8/3/2019 Knowing When You Do Not Know
http://slidepdf.com/reader/full/knowing-when-you-do-not-know 21/76
Knowing, When You Do Not Know 7
between with-crisis and without-crisis scenarios for the same year. It turns out that a cer-
tain type of comparison is more meaningful for each country, depending on the nature
of macroeconomic impact the country is likely to suff er from the crisis and the interests
of counterparts in Bank teams working in the country and the government.
The countries we study are divided into two groups. The first, referred to as Type Icountries , comprises Bangladesh, the Philippines, and Poland. In these countries, aggre-
gate GDP is expected to grow during the crisis, but with a lower trajectory than in the
absence of the crisis. As a result, employment and household income are also expected
to grow, and the simulation identifies the “losses” incurred by households from lower
output growth due to the crisis. In order to determine the impact of the crisis in Type I
countries, macroeconomic projections for two scenarios (“non-crisis” and “crisis”) are
used to generate two income distributions for the same crisis year. For a given crisis year,
the income distribution and poverty estimates of the crisis scenario is compared with
those for the counterfactual “benchmark” scenario to determine the impact of the crisis.
Type II countries are defined as those that are expected to experience negative GDP
growth as a result of the crisis. In general, this description applies to countries—usually
middle-income—with close market links to developed countries that have entered into
a recession due to the crisis. For a country like Mexico, which has experienced a contrac-
tion in GDP, policy makers and the wider development community are more interested
in comparing poverty and income distribution before and after the crisis, rather than
comparing the crisis scenario with the counterfactual (for the same year) of what would
have happened without the crisis. Therefore, for Mexico we compare the projected in-
come distributions for 2010 and 2011 with the actual income distribution of 2008.
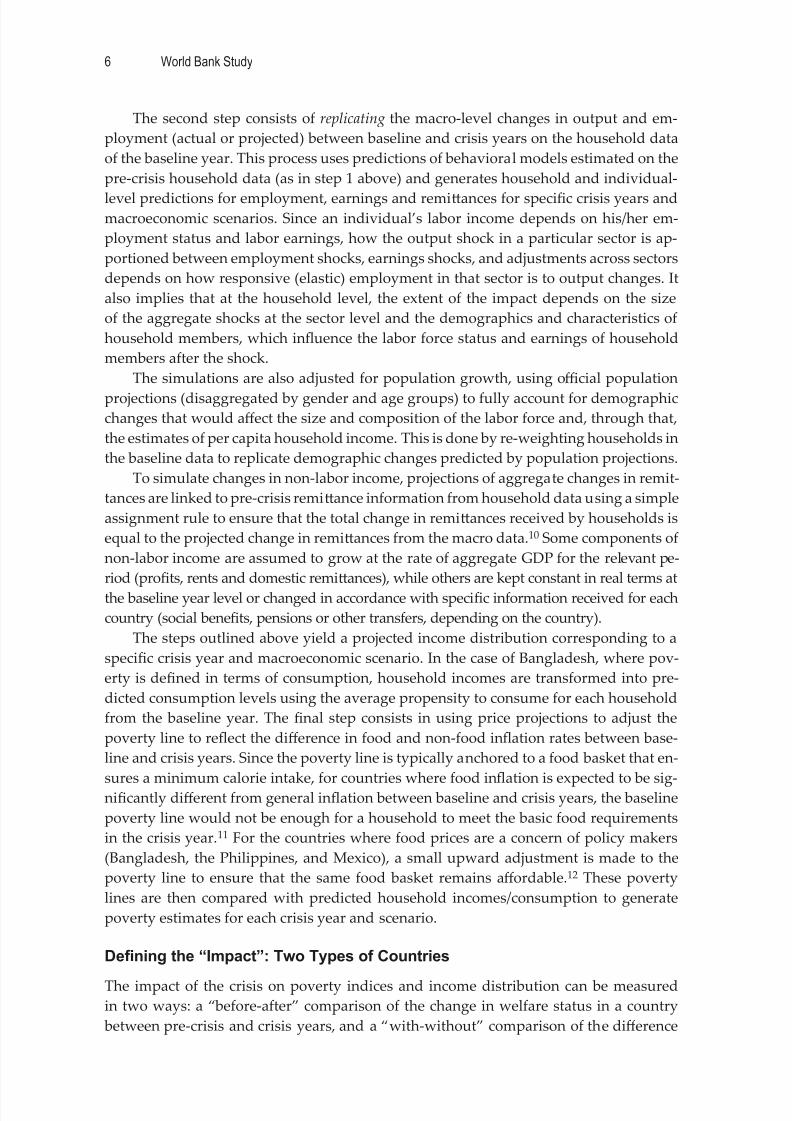
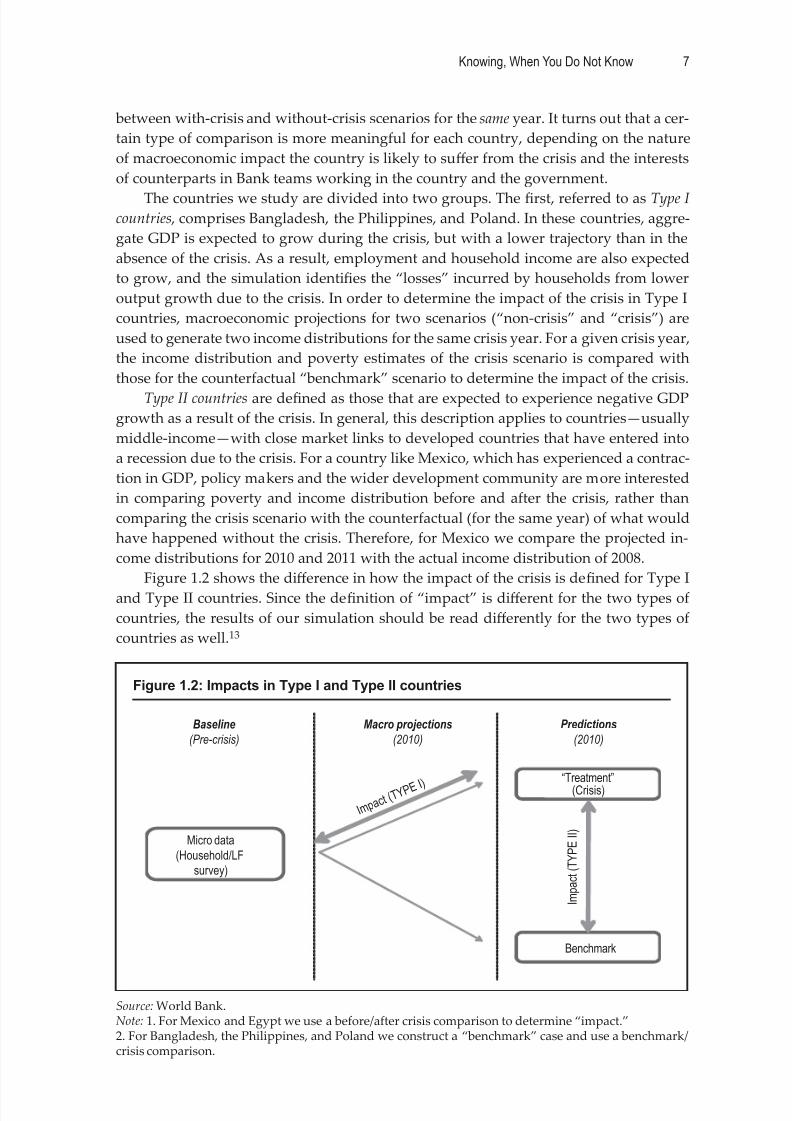
Figure 1.2 shows the diff erence in how the impact of the crisis is defined for Type I
and Type II countries. Since the definition of “impact” is diff erent for the two types of
countries, the results of our simulation should be read diff erently for the two types of
countries as well.13
Figure 1.2: Impacts in Type I and Type II countries
Source: World Bank.Note: 1. For Mexico and Egypt we use a before/after crisis comparison to determine “impact.”2. For Bangladesh, the Philippines, and Poland we construct a “benchmark” case and use a benchmark/crisis comparison.
Micro data(Household/LF
survey)
Baseline
(Pre-crisis)
“Treatment”(Crisis)
Benchmark
Predictions
(2010)
I m p a c t ( T Y P E I I )
I m p a c t (
T Y P E I )
Macro projections
(2010)
8/3/2019 Knowing When You Do Not Know
http://slidepdf.com/reader/full/knowing-when-you-do-not-know 22/76
World Bank Study8
Simulating the Impact of Policy Changes
For Poland and Mexico, the simulations also examine the potential impact of policy
changes, specifically expanding existing safety net programs. While social transfers were
held constant in real terms (at the baseline year level) for all countries in conducting thesimulations, additional scenarios incorporating expansion of specific social programs
were considered for Poland and Mexico, since these countries were either implement-
ing (Poland) or considering (Mexico) changes in safety net programs. The results of the
policy analyses, summarized in the next section, illustrate the use of microsimulations in
projecting the impacts of social policy changes.
In the case of Poland, our analysis also provides insights into the relative roles
played by two diff erent types of social programs in mitigating poverty and distribution-
al eff ects of the crisis. An unemployment insurance program has acted as an “automatic
stabilizer” in Poland that (by design) expands automatically as unemployment increases
due to the crisis. Given that it operates in a counter-cyclical manner without any deliber-ate policy shift, the projected impact of the crisis on household incomes and poverty in
Poland takes into account the mitigating impact of unemployment insurance. This adds
a useful dimension to the simulation results: one can estimate the role that a commonly
used stabilizer like unemployment insurance can play in mitigating the crisis impacts,
and compare these projections against the simulated eff ects of the expansion of a target-
ed social transfer program. While these findings apply to Poland, they off er insights that
may be relevant for other countries, especially those with comparable economic charac-
teristics and a similar menu of potential policy responses to macroeconomic shocks.14
Caveats to the ApproachThe caveats to this methodology relate to issues relevant for microsimulation approach-
es in general, as well as those that arise from the modifications we adopt. Below we note
some of the most significant caveats.
First , the quality of projections from the model depends on the nature and accuracy
of the data underpinning the exercise. While applicable to all simulation approaches,
this caveat is particularly important here given our reliance on aggregate macroeconom-
ic projections. Moreover, while macroeconomic projections are available for aggregated
sectors like industry, services, and agriculture for all four countries, the lack of more
disaggregated projections constrains our ability to account for heterogeneity within each
sector. A distinction between formal and informal sectors or tradeable and nontradeable
sectors within industry or services, for example, is not possible because the projections
are not disaggregated in that form.15
Second , the approach relies on behavioral models built on past data that reflect the
pre-crisis structure of labor markets, household incomes and their relationships with
household and individual characteristics. These structural relationships are assumed to
remain constant over the period for which the projections are made, without allowing
for any changes over time or between crisis and non-crisis scenarios. The more distant
the baseline year is, the more questionable this assumption is likely to be.16 This ca-
veat, which applies to microsimulation approaches in general, also links back to theconstraints imposed by data availability (see above).
8/3/2019 Knowing When You Do Not Know
http://slidepdf.com/reader/full/knowing-when-you-do-not-know 23/76
Knowing, When You Do Not Know 9
Third , our approach assumes that changes in labor market conditions are propor-
tional to the projected change in outputs, based on the estimated past relationship be-
tween output and employment. This implicitly assumes stable relationships between
output, demand for labor, and labor earnings, which may not hold due to distortions
(such as segmentation and downward stickiness of nominal wages) that typically existin the labor market and are likely to aff ect adjustments during a crisis.17
Fourth , the model does not allow for geographic factor mobility (labor or capital)
across time or scenarios, even as workers experience a change in sector or status of em-
ployment. While this assumption is an abstraction from truth, it is likely to maer only
when the results are disaggregated spatially or across rural and urban areas. The model
does incorporate changes in domestic remiances from urban to rural areas, so that the
lack of factor mobility does not necessarily imply constant income flows across space.
Fifth , our approach is limited in its ability to account for shifts in relative prices be-
tween diff erent sectors of the economy as a result of the shock. While the poverty impact
of shifts in the price of food relative to other prices is taken into account, other potential
sources of price impacts are ignored, such as the general equilibrium eff ect of a change in
the terms of trade between agriculture and other sectors. In the absence of a CGE model,
it is nearly impossible to explicitly model for such changes.
Sixth , in taking into account the channels through which output shocks are trans-
mied to households, our approach must predict individual and household-level in-
comes. But to provide poverty projections for a country that defines poverty in terms
of consumption (for example, Bangladesh), household incomes must be converted into
consumption, using the (questionable) assumption that a household’s propensity to con-
sume is constant over time and across crisis and non-crisis scenarios. In the absence of
more information, however, this assumption has at least the advantage of being simple
and transparent.18
The final limitation is related to the validity of the results of the simulations when
compared against the actual changes when they occur, and applies to all ex-ante ap-
proaches. The only true validation would be to combine ex-ante and ex-post analysis (see
Bourguignon and Ferreira, 2003). Since ex post data for crisis years will not be available
in most countries for some time, some uncertainty about the validity of the simulations
is bound to remain.19 As we await the availability of such data, a limited validation exer-
cise undertaken for one country (Bangladesh) using historical data suggest that with the
benefi
t of reliable macroeconomic data and output-employment elasticities, the modelyields results close to what is observed from actual household data.
Results from Micro-Macro Simulations for Four Countries
Some common paerns are visible in all four countries studied in this report. However,
the manner in which the crisis is transmied to each country diff ers, which means that
the size of the impact is diff erent in each context, as are the profiles of those who bear the
brunt of the contraction.
In Bangladesh, the Philippines, and Poland, lower GDP growth is expected to result
in the percentage of the population in poverty being 1.2, 1.5, and 0.4 percentage points
higher in 2010, respectively, compared to a no-crisis scenario. In Mexico, GDP contracted
8/3/2019 Knowing When You Do Not Know
http://slidepdf.com/reader/full/knowing-when-you-do-not-know 24/76
World Bank Study10
by nearly 7 percent in 2009 and is projected to return to pre-crisis levels only by 2011.
Mexico’s poverty rate is projected to rise by more than 3 percentage points between 2008
and 2009, and even as growth resumes, the recovery in poverty is expected to be slow. As
a result, more Mexicans are projected to be poor in 2011 than in 2008. The poverty impact
in Mexico for 2009 is comparable to what was projected by Aran et al. (2010) for Latvia,where GDP was expected to contract by 18 percent between 2008 and 2009, increasing
the poverty headcount rate from around 14 percent in 2008 to 20 percent in 2009.
There is lile or no impact on aggregate measures of inequality in any of the coun-
tries. The aggregate numbers, however, do not tell the complete story of how impacts
are distributed. More detailed analysis, using a number of analytical devices, shows that
some regions and groups within each country are expected to suff er more losses than
others, depending on which sectors and income sources are more aff ected.
While the impacts on income and consumption are relatively large among middle-
income households, the poor in some of the most aff ected countries are severely im-
pacted as well. Ravallion (2009) has argued that middle-income groups in developing
countries are more exposed to a macroeconomic crisis than the rest of the population.
Simulations for individual countries partly confirm this view: between 15 and 20 percent
of households in the 40th–80th percentiles of the income distribution in Mexico and the
Philippines suff er per capita income losses that push them to a lower income decile,
which suggests that households in the middle of the distribution suff ered a sizeable im-
pact in absolute terms. At the same time, significant impacts are also estimated among
poor households relative to their income levels, particularly so in countries where the
crisis has been more severe. The poorest 20 percent of Mexican households are projected
to suff er an average loss in per capita income of about 8 percent between 2008 and 2009,
compared with a 5 percent income loss for the entire population. Similarly, the simulations
by Aran et al. (2010) suggest that in Latvia, the boom 40 percent of the income distribu-
tion are hardest hit by the crisis—although the very poorest households in rural areas ap-
pear to have been spared somewhat, likely due to their isolation from the formal economy.
The impacts on the middle of the distribution can be aributed primarily to signifi-
cant employment shocks to manufacturing and service sectors that employ a large num-
ber of workers from middle-income households. Urban households suff er more losses,
on average, than do rural households in all countries because the manufacturing sector
that bears the brunt of the losses in employment and labor earnings is concentrated in
urban areas. In the Philippines, for example, per capita income of urban households isprojected to decline by 6 percent, compared to a fall of 3 percent for rural households.
Beyond these common paerns, there is considerable variation among countries in
how impacts are distributed within countries because of the diff erences in transmission
channels and the structure of economic sectors. Approximately 90 percent of the aver-
age loss in per capita household income in Mexico and the Philippines are aributable
to a fall in labor income, compared with 50 percent of the average loss in Bangladesh,
where an expected slowdown in remiance growth is also important. Losses resulting
from lower remiances tend to be more concentrated among beer-off households than
losses in labor income, mainly because the initial (pre-crisis) distribution of remiances
was skewed towards beer-off households. This is an important reason why projectedincome losses in the Philippines are more evenly distributed across the income distribu-
tion than in Bangladesh.
8/3/2019 Knowing When You Do Not Know
http://slidepdf.com/reader/full/knowing-when-you-do-not-know 25/76
Knowing, When You Do Not Know 11
The crisis may have also impacted women and men diff erently. In a world of highly
mobile capital and less mobile labor, often the brunt of adjustment to shocks—whether
external or internal in origin—falls on labor earnings and hence directly on households
(Paci, Revenga, and Rijkers, 2009). Women and men tend to work in diff erent indus-
tries and occupations, which may also result in lower productivity among women onaverage. It is also commonly believed that women tend to hold more precarious jobs,
operate in smaller and less capitalized firms, or engage in more vulnerable economic
activities than men. These factors would suggest that women are more likely to be af-
fected by economic shocks. The existing empirical evidence is mixed, however. Using
data from the Asian crisis, Hallward-Driemeier, Rijkers, and Waxman (2010) show that
female employment was not hit the hardest, primarily due to the fact that women were
disproportionately employed in firms more resilient to the crisis. On the other hand the
gender earnings gap increased, particularly in largerfirms, implying that the smaller net
employment impact on women came at the cost of a larger reduction in earnings.
Our work shows that impacts of the financial crisis were quite heterogeneous across
countries and sectors, with no common paerns by gender and no evidence that women
were more aff ected than men. Other evidence suggests that gender impacts vary sig-
nificantly by country and are hard to generalize (Sabarwal, Sinha and Buvinic, 2010;
Newhouse and Cho, 2010; Turk and Mason, 2009). On the one hand, relatively high
female participation rates in export-oriented industries that were the initial casualties of
the crisis may have led to strong first-round negative employment eff ects. On the other
hand, lower female participation rates in pro-cyclical sectors, such as construction, or
industries dependent on external demand, such as tourism, implied that the aggregate
employment eff ects for women relative to men were muted once these second-round
eff ects are taken into account. The direction of impacts and their gender diff erences, as
well as the channels through which they occur, are likely to depend on the specific na-
ture of the crisis at hand, and merit further analysis.
The simulations also allow us to examine the characteristics of those who are ex-
pected to be in poverty as a direct result of the crisis—information that can be of use to
policy makers. We find that the “crisis-vulnerable,” namely households who would not
have been poor had there been no crisis, tend to have specific characteristics that distin-
guish them from the “structurally poor” who would have been poor with or without the
crisis. On average, the crisis-vulnerable appear to be more educated or skilled than the
structurally poor. They are also more likely to be economically active than the structur-ally poor, indicating that the crisis would have had a sizeable eff ect on the number of
“working poor.” In Mexico, the crisis-vulnerable are more likely to be urban, employed
in the manufacturing sector prior to the crisis, and belong to households headed by
women compared to the chronic poor and non-poor. In other countries, the crisis-vul-
nerable fall somewhere between the structurally poor and the non-poor in terms of these
characteristics.
Social programs can play a role in determining the characteristics of the crisis-vul-
nerable in some countries. For example, although most of the impact on household in-
come in Poland is due to losses in labor income, our estimates indicate that a large part
of this loss would have been compensated by higher unemployment insurance benefits,which would have reduced the number of crisis-vulnerable among households with
formal sector workers.20 In Turkey, Aran et al. (2010) find that even though the largest
8/3/2019 Knowing When You Do Not Know
http://slidepdf.com/reader/full/knowing-when-you-do-not-know 26/76
World Bank Study12
employment impacts are in the middle of the income distribution, most of the welfare
losses come from the informal sector where poorer workers are more likely to be em-
ployed. Formal sector workers, by contrast, are protected to some extent by unemploy-
ment benefits. The simulations also suggest that expansion in targeted social transfers
can mitigate some of the impacts on the poorest, depending on the size of the expansionand the size and characteristics of the target population of the program. In Mexico and
Poland, for example, expansion of targeted social transfer programs is likely to have
benefited a sizeable number of the poorest, in spite of the small impact of the expansion
on national poverty rates.
Below we discuss the results of the simulation in more detail, diff erentiating be-
tween Type I and II countries, as defined earlier.
Results for Type I Countries
The Philippines, Bangladesh, and Poland show signifi
cant heterogeneity in terms of thepredicted impact of the crisis both at the aggregate level and by sector (Table 1.1). Total
GDP in 2010 is predicted to be 4.9 percent lower under the crisis scenario in the Philip-
pines, 2.2 percent lower in Bangladesh, and 5.3 percent lower in Poland than what it
would have been without the crisis—according to projections made by World Bank coun-
try economists in early 2010.21 The manufacturing sector is projected to be the most af-
fected in terms of output losses in all three countries, followed by services. International
remiance flows are projected to be 1.5 percent lower under the crisis scenario in Philip-
pines, 3.7 percent lower in Poland, and 10.1 percent lower in Bangladesh than what they
would have been without the crisis.
Table 1.1: Macroeconomic impacts for Type I countries
Philippines Bangladesh Poland
Total GDP −4.9 −2.2 −5.3
Agriculture −2.6 0.3 5.2
Manufacturing −6.7 −3.9 −10.1
Services −4.6 −2.1 −3.4
Remittances −1.5 −10.1 −3.7
Source: World Bank.Note: 1. Impact calculated as % diff erence between 2010 projected crisis GDP (or remiances) and 2010 pro- jected benchmark GDP (or remiances). A negative number indicates lower GDP (or remiance) due to crisis.2. These figures are based on projections (not actual estimates) of GDP, as of early 2010 by World Bankcountry economists.
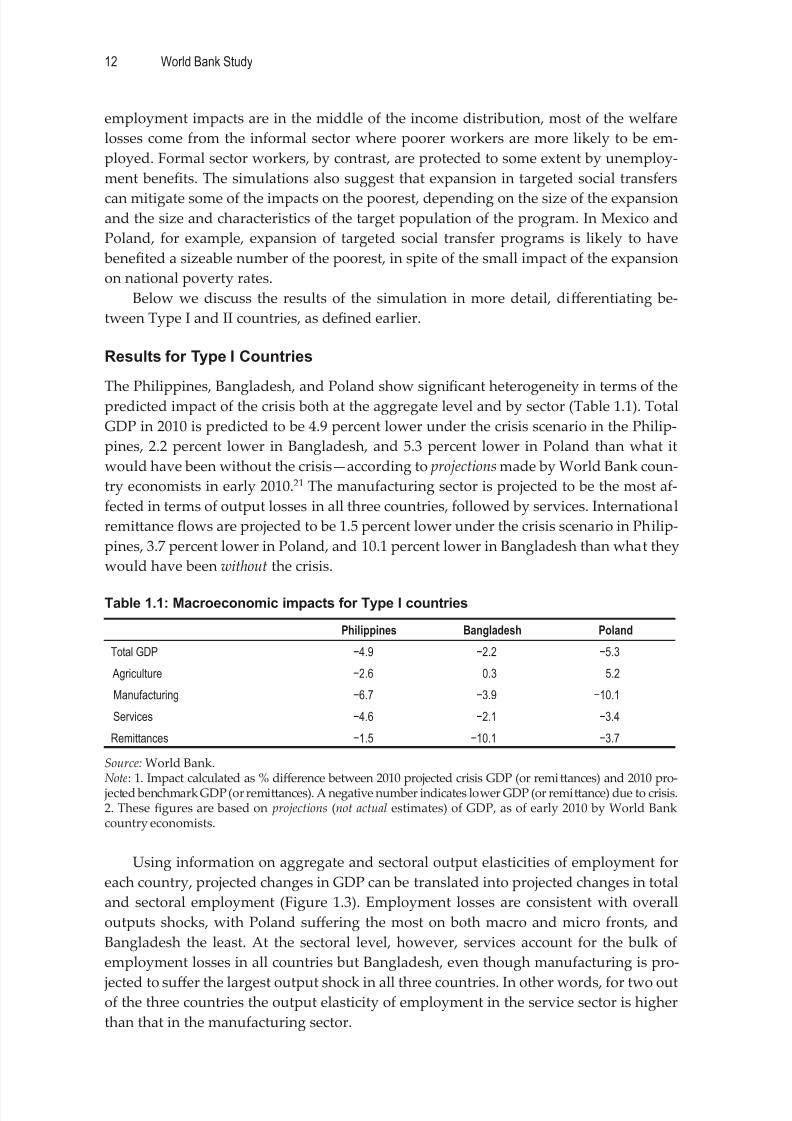
Using information on aggregate and sectoral output elasticities of employment for
each country, projected changes in GDP can be translated into projected changes in total
and sectoral employment (Figure 1.3). Employment losses are consistent with overall
outputs shocks, with Poland suff ering the most on both macro and micro fronts, and
Bangladesh the least. At the sectoral level, however, services account for the bulk of
employment losses in all countries but Bangladesh, even though manufacturing is pro-
jected to suff er the largest output shock in all three countries. In other words, for two outof the three countries the output elasticity of employment in the service sector is higher
than that in the manufacturing sector.
8/3/2019 Knowing When You Do Not Know
http://slidepdf.com/reader/full/knowing-when-you-do-not-know 27/76
Knowing, When You Do Not Know 13
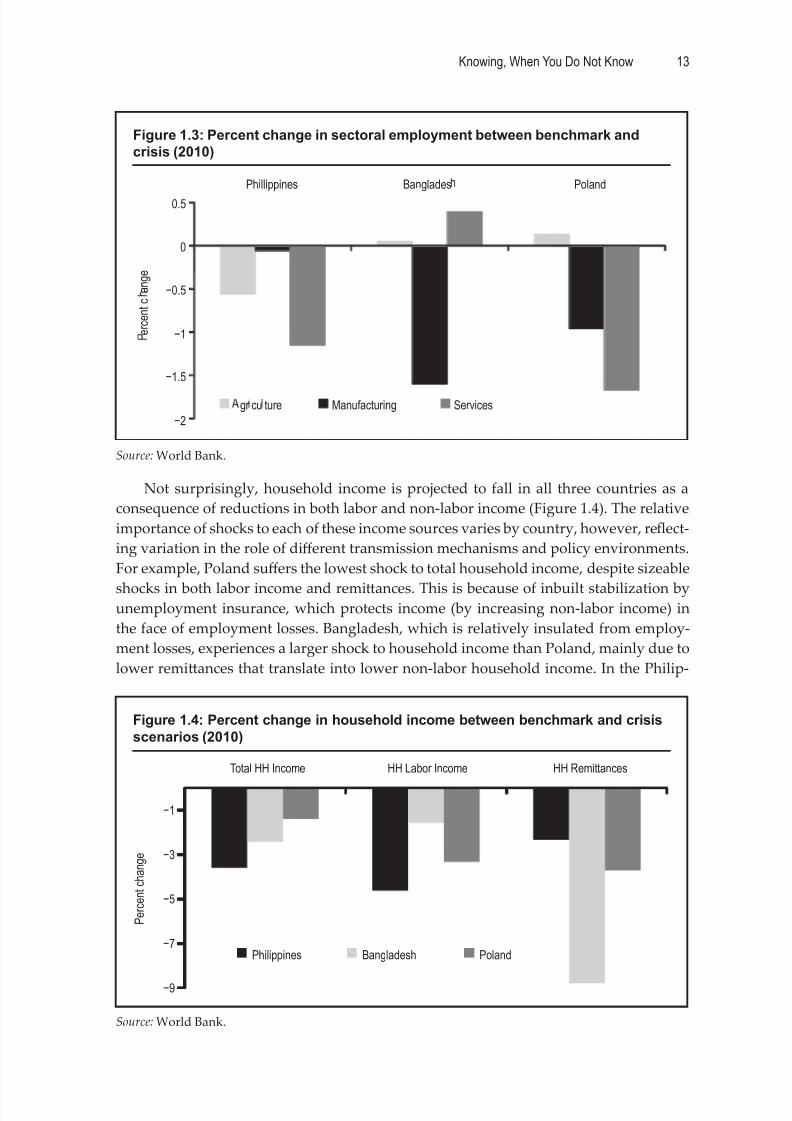
Not surprisingly, household income is projected to fall in all three countries as a
consequence of reductions in both labor and non-labor income (Figure 1.4). The relative
importance of shocks to each of these income sources varies by country, however, reflect-
ing variation in the role of diff erent transmission mechanisms and policy environments.
For example, Poland suff ers the lowest shock to total household income, despite sizeable
shocks in both labor income and remiances. This is because of inbuilt stabilization byunemployment insurance, which protects income (by increasing non-labor income) in
the face of employment losses. Bangladesh, which is relatively insulated from employ-
ment losses, experiences a larger shock to household income than Poland, mainly due to
lower remiances that translate into lower non-labor household income. In the Philip-
Figure 1.3: Percent change in sectoral employment between benchmark andcrisis (2010)
Source: World Bank.
−2
−1
−0.5
0
0.5
Phillippines Banglades Poland
gr cu ture Manufacturing Services
−1.5
e r c e n t c
a n g e
Figure 1.4: Percent change in household income between benchmark and crisisscenarios (2010)
Source: World Bank.
−9
−7
−5
−3
−1
Total HH Income HH Labor Income HH Remittances
Philippines Bangladesh Poland
P e r c e n t c h a n g e
8/3/2019 Knowing When You Do Not Know
http://slidepdf.com/reader/full/knowing-when-you-do-not-know 28/76
World Bank Study14
pines both labor and non-labor household income are projected to fall as a consequence
of the crisis.22 Both Bangladesh and the Philippines lack a large unemployment insur-
ance scheme that could act as a stabilizer against loss in labor income.
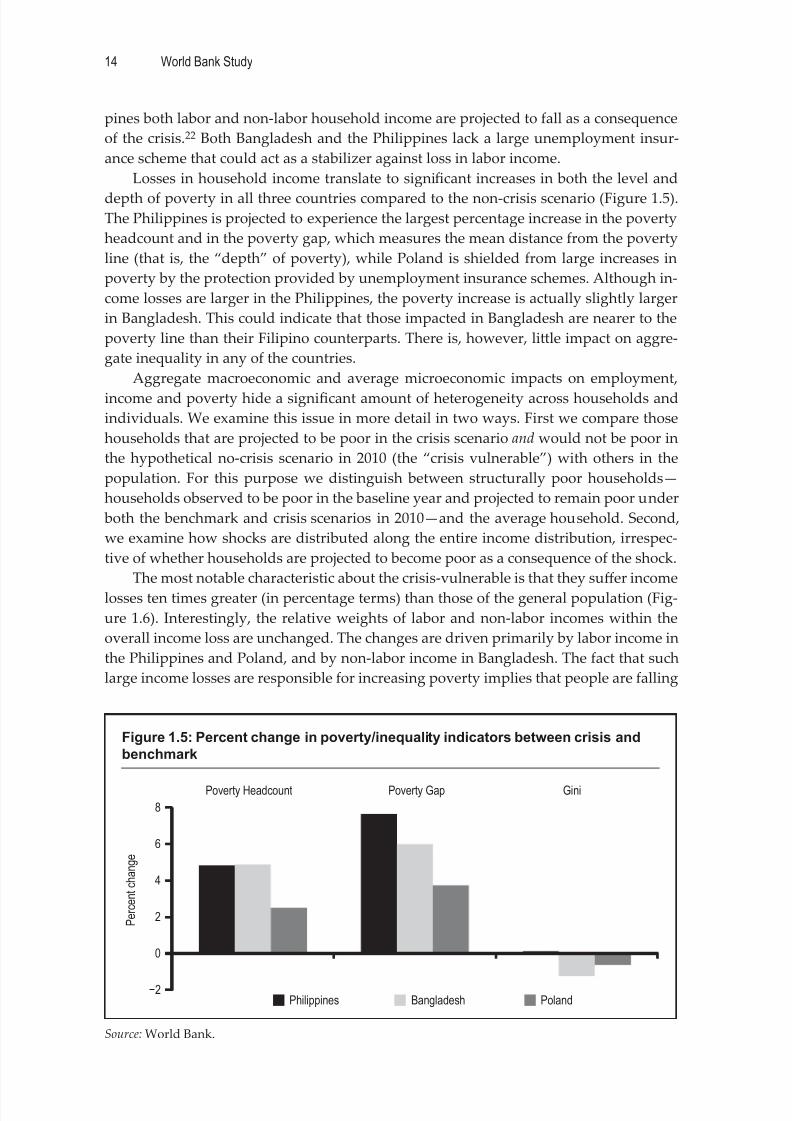
Losses in household income translate to significant increases in both the level and
depth of poverty in all three countries compared to the non-crisis scenario (Figure 1.5).The Philippines is projected to experience the largest percentage increase in the poverty
headcount and in the poverty gap, which measures the mean distance from the poverty
line (that is, the “depth” of poverty), while Poland is shielded from large increases in
poverty by the protection provided by unemployment insurance schemes. Although in-
come losses are larger in the Philippines, the poverty increase is actually slightly larger
in Bangladesh. This could indicate that those impacted in Bangladesh are nearer to the
poverty line than their Filipino counterparts. There is, however, lile impact on aggre-
gate inequality in any of the countries.
Aggregate macroeconomic and average microeconomic impacts on employment,
income and poverty hide a significant amount of heterogeneity across households and
individuals. We examine this issue in more detail in two ways. First we compare those
households that are projected to be poor in the crisis scenario and would not be poor in
the hypothetical no-crisis scenario in 2010 (the “crisis vulnerable”) with others in the
population. For this purpose we distinguish between structurally poor households—
households observed to be poor in the baseline year and projected to remain poor under
both the benchmark and crisis scenarios in 2010—and the average household. Second,
we examine how shocks are distributed along the entire income distribution, irrespec-
tive of whether households are projected to become poor as a consequence of the shock.
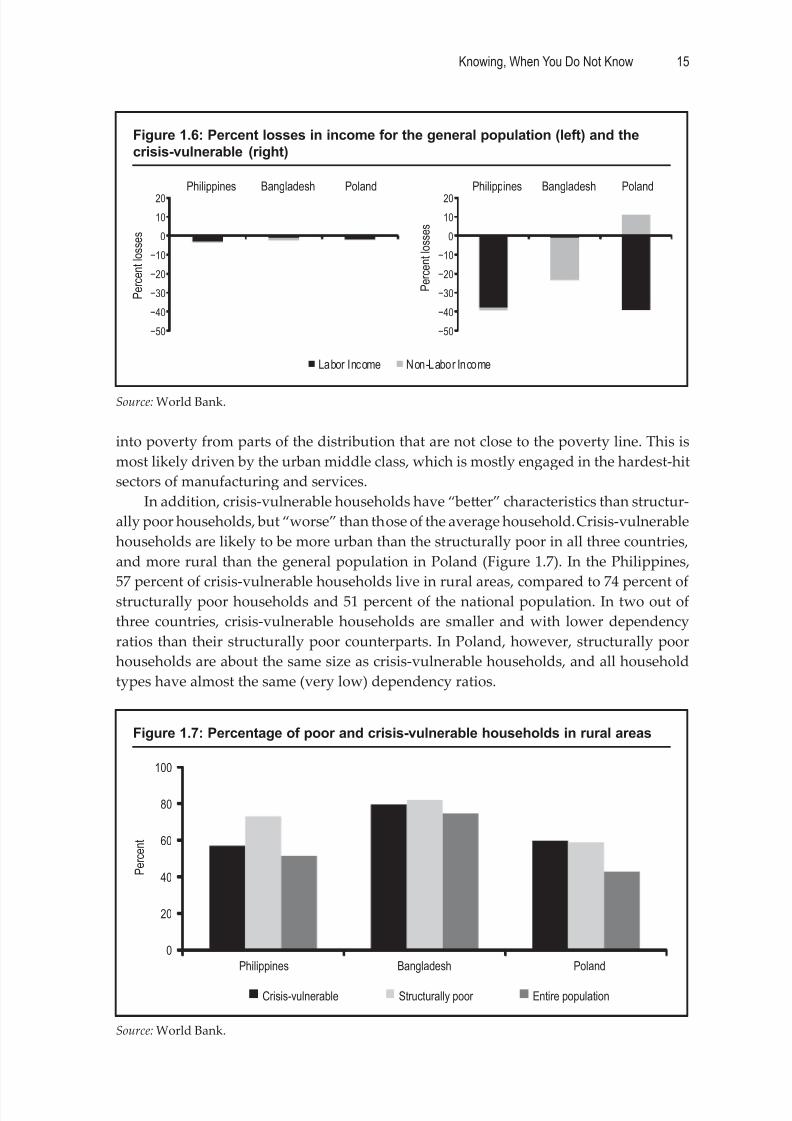
The most notable characteristic about the crisis-vulnerable is that they suff er income
losses ten times greater (in percentage terms) than those of the general population (Fig-
ure 1.6). Interestingly, the relative weights of labor and non-labor incomes within the
overall income loss are unchanged. The changes are driven primarily by labor income in
the Philippines and Poland, and by non-labor income in Bangladesh. The fact that such
large income losses are responsible for increasing poverty implies that people are falling
Figure 1.5: Percent change in poverty/inequality indicators between crisis andbenchmark
Source: World Bank.
−2
0
2
4
6
8
Poverty Headcount Poverty Gap Gini
Philippines Bangladesh Poland
P e r c e n t c h a n g e
8/3/2019 Knowing When You Do Not Know
http://slidepdf.com/reader/full/knowing-when-you-do-not-know 29/76
Knowing, When You Do Not Know 15
into poverty from parts of the distribution that are not close to the poverty line. This is
most likely driven by the urban middle class, which is mostly engaged in the hardest-hit
sectors of manufacturing and services.
In addition, crisis-vulnerable households have “beer” characteristics than structur-
ally poor households, but “worse” than those of the average household. Crisis-vulnerable
households are likely to be more urban than the structurally poor in all three countries,
and more rural than the general population in Poland (Figure 1.7). In the Philippines,
57 percent of crisis-vulnerable households live in rural areas, compared to 74 percent ofstructurally poor households and 51 percent of the national population. In two out of
three countries, crisis-vulnerable households are smaller and with lower dependency
ratios than their structurally poor counterparts. In Poland, however, structurally poor
households are about the same size as crisis-vulnerable households, and all household
types have almost the same (very low) dependency ratios.
Figure 1.6: Percent losses in income for the general population (left) and thecrisis-vulnerable (right)
Source: World Bank.
P e r c e n t l o s s e s
P e r c e n t l o s s e s
−50
−40
−30
−20
−10
0
10
20
Philippines Bangladesh Poland
Labor Income Non-Labor Income
−50
−40
−30
−20
−10
0
10
20
Philippines Bangladesh Poland
Figure 1.7: Percentage of poor and crisis-vulnerable households in rural areas
Source: World Bank.
P e r c e n t
0
20
40
60
80
100
Philippines Bangladesh Poland
Crisis-vulnerable Structurally poor Entire population
8/3/2019 Knowing When You Do Not Know
http://slidepdf.com/reader/full/knowing-when-you-do-not-know 30/76
World Bank Study16
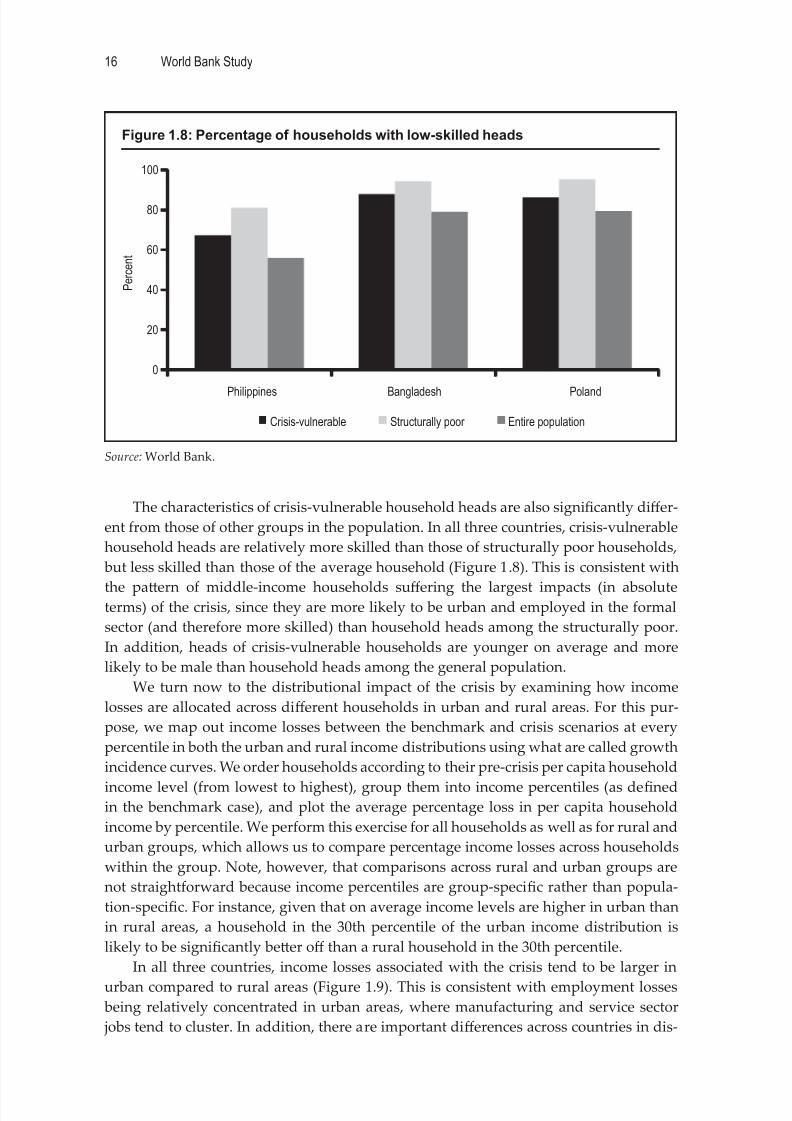
The characteristics of crisis-vulnerable household heads are also significantly diff er-
ent from those of other groups in the population. In all three countries, crisis-vulnerable
household heads are relatively more skilled than those of structurally poor households,
but less skilled than those of the average household (Figure 1.8). This is consistent with
the paern of middle-income households suff ering the largest impacts (in absoluteterms) of the crisis, since they are more likely to be urban and employed in the formal
sector (and therefore more skilled) than household heads among the structurally poor.
In addition, heads of crisis-vulnerable households are younger on average and more
likely to be male than household heads among the general population.
We turn now to the distributional impact of the crisis by examining how income
losses are allocated across diff erent households in urban and rural areas. For this pur-
pose, we map out income losses between the benchmark and crisis scenarios at every
percentile in both the urban and rural income distributions using what are called growth
incidence curves. We order households according to their pre-crisis per capita household
income level (from lowest to highest), group them into income percentiles (as definedin the benchmark case), and plot the average percentage loss in per capita household
income by percentile. We perform this exercise for all households as well as for rural and
urban groups, which allows us to compare percentage income losses across households
within the group. Note, however, that comparisons across rural and urban groups are
not straightforward because income percentiles are group-specific rather than popula-
tion-specific. For instance, given that on average income levels are higher in urban than
in rural areas, a household in the 30th percentile of the urban income distribution is
likely to be significantly beer off than a rural household in the 30th percentile.
In all three countries, income losses associated with the crisis tend to be larger in
urban compared to rural areas (Figure 1.9). This is consistent with employment losses being relatively concentrated in urban areas, where manufacturing and service sector
jobs tend to cluster. In addition, there are important diff erences across countries in dis-
Figure 1.8: Percentage of households with low-skilled heads
Source: World Bank.
P e r c e n t
0
20
40
60
80
100
Philippines Bangladesh Poland
Crisis-vulnerable Structurally poor Entire population
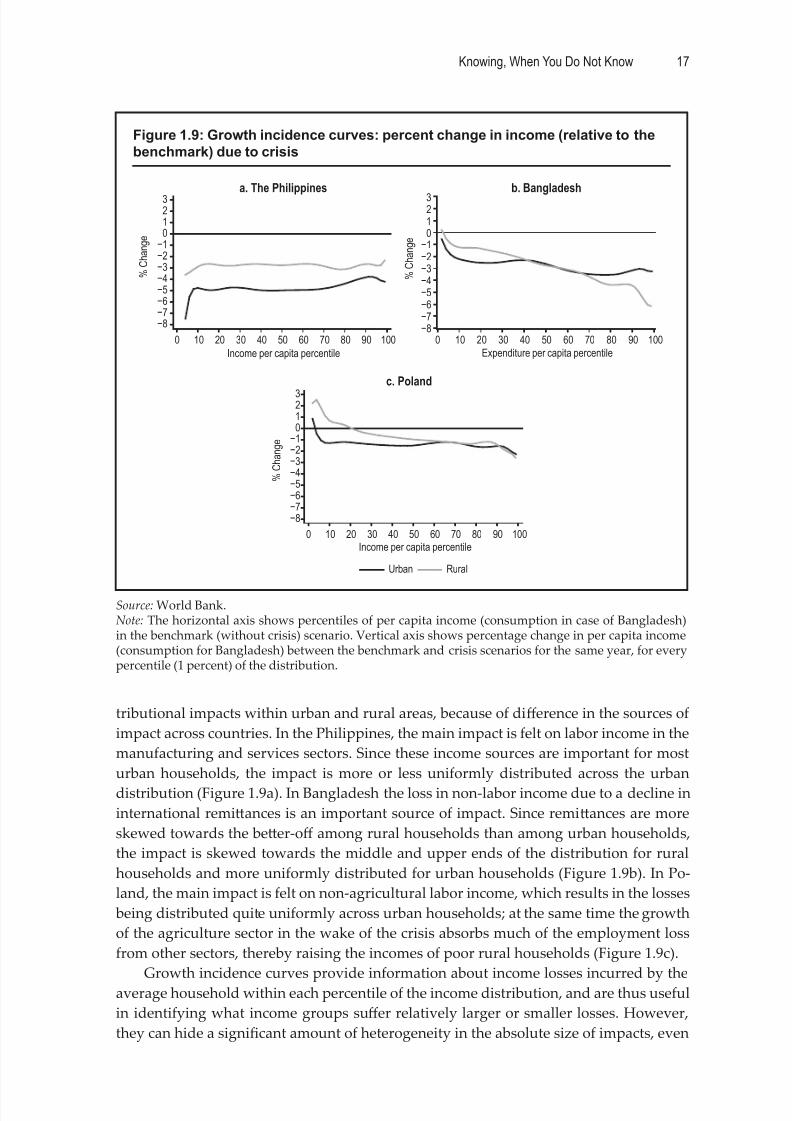
8/3/2019 Knowing When You Do Not Know
http://slidepdf.com/reader/full/knowing-when-you-do-not-know 31/76
Knowing, When You Do Not Know 17
tributional impacts within urban and rural areas, because of diff erence in the sources of
impact across countries. In the Philippines, the main impact is felt on labor income in the
manufacturing and services sectors. Since these income sources are important for most
urban households, the impact is more or less uniformly distributed across the urban
distribution (Figure 1.9a). In Bangladesh the loss in non-labor income due to a decline in
international remiances is an important source of impact. Since remiances are more
skewed towards the beer-off among rural households than among urban households,
the impact is skewed towards the middle and upper ends of the distribution for rural
households and more uniformly distributed for urban households (Figure 1.9b). In Po-
land, the main impact is felt on non-agricultural labor income, which results in the losses
being distributed quite uniformly across urban households; at the same time the growth
of the agriculture sector in the wake of the crisis absorbs much of the employment loss
from other sectors, thereby raising the incomes of poor rural households (Figure 1.9c).
Growth incidence curves provide information about income losses incurred by the
average household within each percentile of the income distribution, and are thus useful
in identifying what income groups suff er relatively larger or smaller losses. However,
they can hide a significant amount of heterogeneity in the absolute size of impacts, even
Figure 1.9: Growth incidence curves: percent change in income (relative to thebenchmark) due to crisis
Source: World Bank.Note: The horizontal axis shows percentiles of per capita income (consumption in case of Bangladesh)in the benchmark (without crisis) scenario. Vertical axis shows percentage change in per capita income(consumption for Bangladesh) between the benchmark and crisis scenarios for the same year, for everypercentile (1 percent) of the distribution.
a. The Philippines b. Bangladesh
c. Poland
−8−7−6−5−4−3−2−1
0123
% C
h a n g e
0 10 20 30 40 50 60 70 80 90 100Income per capita percentile
−8−7−6−5−4−3−2−1
0123
% C
h a n g e
0 10 20 30 40 50 60 70 80 90 100Expenditure per capita percentile
−8−7−6−5−4−3−2−1
0123
% C
h a n g e
0 10 20 30 40 50 60 70 80 90 100Income per capita percentile
Urban Rural
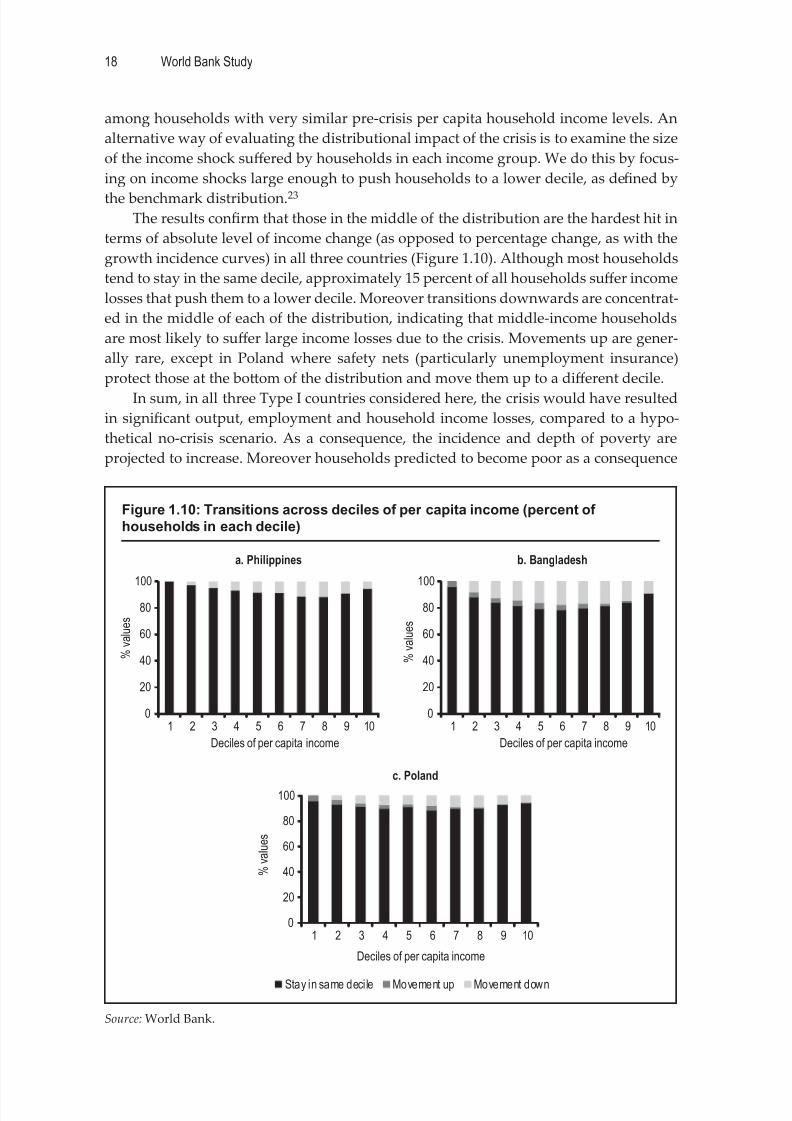
8/3/2019 Knowing When You Do Not Know
http://slidepdf.com/reader/full/knowing-when-you-do-not-know 32/76
World Bank Study18
among households with very similar pre-crisis per capita household income levels. An
alternative way of evaluating the distributional impact of the crisis is to examine the size
of the income shock suff ered by households in each income group. We do this by focus-
ing on income shocks large enough to push households to a lower decile, as defined by
the benchmark distribution.23
The results confirm that those in the middle of the distribution are the hardest hit in
terms of absolute level of income change (as opposed to percentage change, as with the
growth incidence curves) in all three countries (Figure 1.10). Although most households
tend to stay in the same decile, approximately 15 percent of all households suff er income
losses that push them to a lower decile. Moreover transitions downwards are concentrat-
ed in the middle of each of the distribution, indicating that middle-income households
are most likely to suff er large income losses due to the crisis. Movements up are gener-
ally rare, except in Poland where safety nets (particularly unemployment insurance)
protect those at the boom of the distribution and move them up to a diff erent decile.
In sum, in all three Type I countries considered here, the crisis would have resulted
in significant output, employment and household income losses, compared to a hypo-
thetical no-crisis scenario. As a consequence, the incidence and depth of poverty are
projected to increase. Moreover households predicted to become poor as a consequence
Figure 1.10: Transitions across deciles of per capita income (percent ofhouseholds in each decile)
Source: World Bank.
a. Philippines b. Bangladesh
c. Poland
0
20
40
60
80
100
1 2 3 4 5 6 7 8 9 10
% v
a l u e s
Deciles of per capita income
0
20
40
60
80
100
1 2 3 4 5 6 7 8 9 10
% v
a l u e s
Deciles of per capita income
0
20
40
60
80
100
1 2 3 4 5 6 7 8 9 10
% v
a l u e s
Deciles of per capita income
Stay in same decile Movement up Movement down
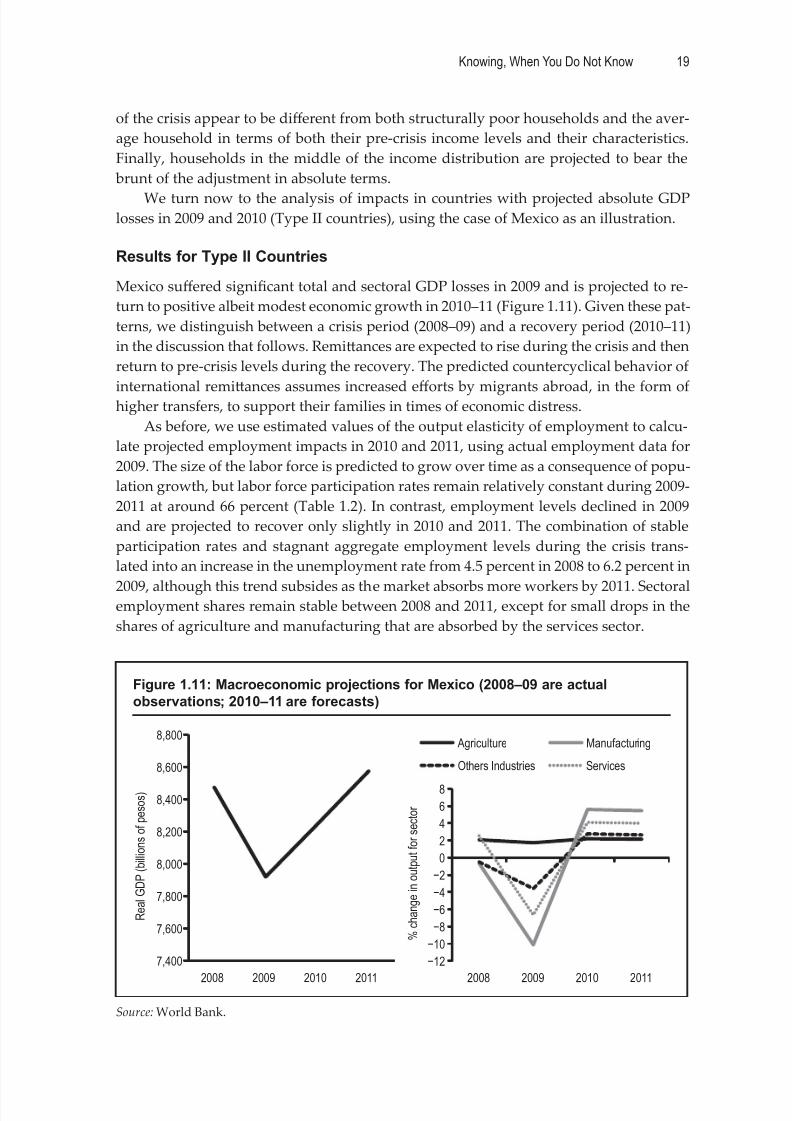
8/3/2019 Knowing When You Do Not Know
http://slidepdf.com/reader/full/knowing-when-you-do-not-know 33/76
Knowing, When You Do Not Know 19
of the crisis appear to be diff erent from both structurally poor households and the aver-
age household in terms of both their pre-crisis income levels and their characteristics.
Finally, households in the middle of the income distribution are projected to bear the
brunt of the adjustment in absolute terms.
We turn now to the analysis of impacts in countries with projected absolute GDPlosses in 2009 and 2010 (Type II countries), using the case of Mexico as an illustration.
Results for Type II Countries
Mexico suff ered significant total and sectoral GDP losses in 2009 and is projected to re-
turn to positive albeit modest economic growth in 2010–11 (Figure 1.11). Given these pat-
terns, we distinguish between a crisis period (2008–09) and a recovery period (2010–11)
in the discussion that follows. Remiances are expected to rise during the crisis and then
return to pre-crisis levels during the recovery. The predicted countercyclical behavior of
international remi
ances assumes increased eff
orts by migrants abroad, in the form ofhigher transfers, to support their families in times of economic distress.
As before, we use estimated values of the output elasticity of employment to calcu-
late projected employment impacts in 2010 and 2011, using actual employment data for
2009. The size of the labor force is predicted to grow over time as a consequence of popu-
lation growth, but labor force participation rates remain relatively constant during 2009-
2011 at around 66 percent (Table 1.2). In contrast, employment levels declined in 2009
and are projected to recover only slightly in 2010 and 2011. The combination of stable
participation rates and stagnant aggregate employment levels during the crisis trans-
lated into an increase in the unemployment rate from 4.5 percent in 2008 to 6.2 percent in
2009, although this trend subsides as the market absorbs more workers by 2011. Sectoralemployment shares remain stable between 2008 and 2011, except for small drops in the
shares of agriculture and manufacturing that are absorbed by the services sector.
Figure 1.11: Macroeconomic projections for Mexico (2008–09 are actualobservations; 2010–11 are forecasts)
Source: World Bank.
7,400
7,600
7,800
8,000
8,200
8,400
8,600
8,800
2008 2009 2010 2011
R e a l G D P ( b i l l i o n s o f p e s o s )
−12
−10
−8
−6
−4
−2
0
2
4
68
2008 2009 2010 2011
% c
h a n g e i n o u t p u t f o r s e c t o r
Agriculture Manufacturing
Others Industries Services
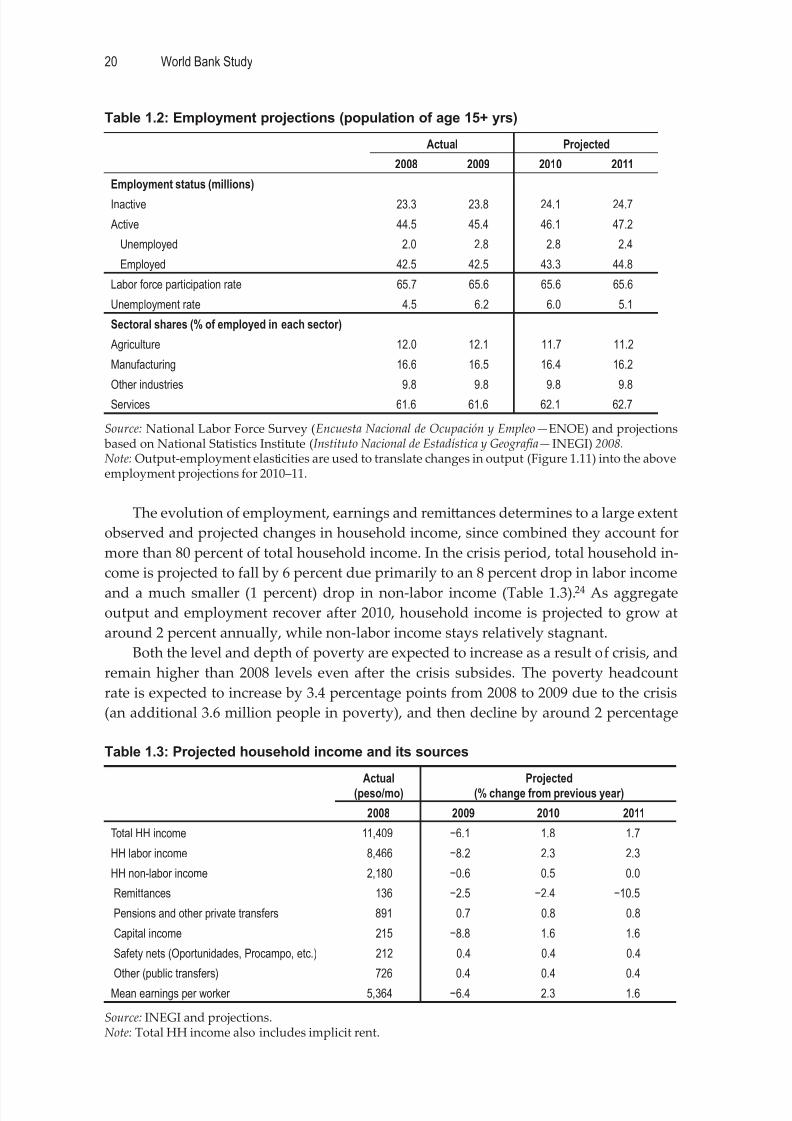
8/3/2019 Knowing When You Do Not Know
http://slidepdf.com/reader/full/knowing-when-you-do-not-know 34/76
World Bank Study20
Table 1.2: Employment projections (population of age 15+ yrs)
Actual Projected
2008 2009 2010 2011
Employment status (millions)
Inactive 23.3 23.8 24.1 24.7
Active 44.5 45.4 46.1 47.2
Unemployed 2.0 2.8 2.8 2.4
Employed 42.5 42.5 43.3 44.8
Labor force participation rate 65.7 65.6 65.6 65.6
Unemployment rate 4.5 6.2 6.0 5.1
Sectoral shares (% of employed in each sector)
Agriculture 12.0 12.1 11.7 11.2
Manufacturing 16.6 16.5 16.4 16.2
Other industries 9.8 9.8 9.8 9.8
Services 61.6 61.6 62.1 62.7
Source: National Labor Force Survey (Encuesta Nacional de Ocupación y Empleo—ENOE) and projections based on National Statistics Institute (Instituto Nacional de Estadística y Geografía—INEGI) 2008.Note: Output-employment elasticities are used to translate changes in output (Figure 1.11) into the aboveemployment projections for 2010–11.
The evolution of employment, earnings and remiances determines to a large extent
observed and projected changes in household income, since combined they account for
more than 80 percent of total household income. In the crisis period, total household in-
come is projected to fall by 6 percent due primarily to an 8 percent drop in labor income
and a much smaller (1 percent) drop in non-labor income (Table 1.3).24 As aggregateoutput and employment recover after 2010, household income is projected to grow at
around 2 percent annually, while non-labor income stays relatively stagnant.
Both the level and depth of poverty are expected to increase as a result of crisis, and
remain higher than 2008 levels even after the crisis subsides. The poverty headcount
rate is expected to increase by 3.4 percentage points from 2008 to 2009 due to the crisis
(an additional 3.6 million people in poverty), and then decline by around 2 percentage
Table 1.3: Projected household income and its sources
Actual
(peso/mo)
Projected
(% change from previous year)
2008 2009 2010 2011
Total HH income 11,409 −6.1 1.8 1.7
HH labor income 8,466 −8.2 2.3 2.3
HH non-labor income 2,180 −0.6 0.5 0.0
Remittances 136 −2.5 −2.4 −10.5
Pensions and other private transfers 891 0.7 0.8 0.8
Capital income 215 −8.8 1.6 1.6
Safety nets (Oportunidades, Procampo, etc.) 212 0.4 0.4 0.4
Other (public transfers) 726 0.4 0.4 0.4
Mean earnings per worker 5,364 −6.4 2.3 1.6
Source: INEGI and projections. Note: Total HH income also includes implicit rent.
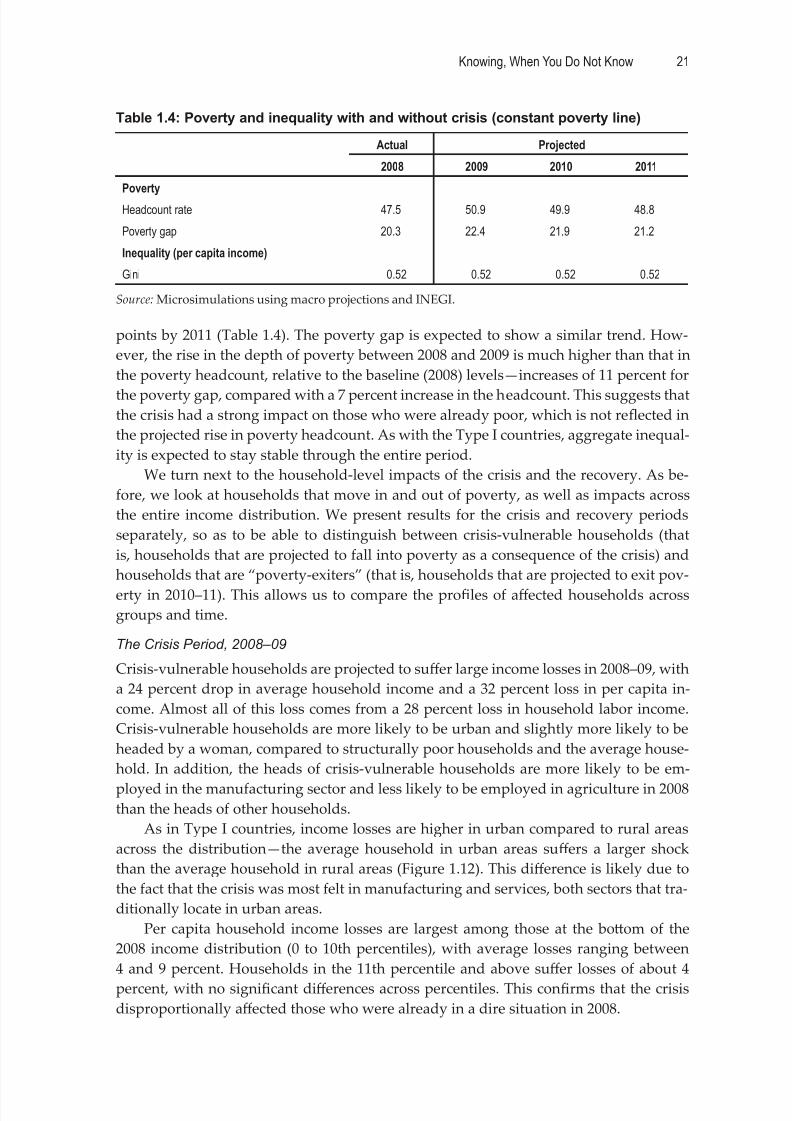
8/3/2019 Knowing When You Do Not Know
http://slidepdf.com/reader/full/knowing-when-you-do-not-know 35/76
Knowing, When You Do Not Know 21
points by 2011 (Table 1.4). The poverty gap is expected to show a similar trend. How-
ever, the rise in the depth of poverty between 2008 and 2009 is much higher than that in
the poverty headcount, relative to the baseline (2008) levels—increases of 11 percent for
the poverty gap, compared with a 7 percent increase in the headcount. This suggests thatthe crisis had a strong impact on those who were already poor, which is not reflected in
the projected rise in poverty headcount. As with the Type I countries, aggregate inequal-
ity is expected to stay stable through the entire period.
We turn next to the household-level impacts of the crisis and the recovery. As be-
fore, we look at households that move in and out of poverty, as well as impacts across
the entire income distribution. We present results for the crisis and recovery periods
separately, so as to be able to distinguish between crisis-vulnerable households (that
is, households that are projected to fall into poverty as a consequence of the crisis) and
households that are “poverty-exiters” (that is, households that are projected to exit pov-
erty in 2010–11). This allows us to compare the profiles of aff ected households across
groups and time.
The Crisis Period, 2008–09
Crisis-vulnerable households are projected to suff er large income losses in 2008–09, with
a 24 percent drop in average household income and a 32 percent loss in per capita in-
come. Almost all of this loss comes from a 28 percent loss in household labor income.
Crisis-vulnerable households are more likely to be urban and slightly more likely to be
headed by a woman, compared to structurally poor households and the average house-
hold. In addition, the heads of crisis-vulnerable households are more likely to be em-
ployed in the manufacturing sector and less likely to be employed in agriculture in 2008than the heads of other households.
As in Type I countries, income losses are higher in urban compared to rural areas
across the distribution—the average household in urban areas suff ers a larger shock
than the average household in rural areas (Figure 1.12). This diff erence is likely due to
the fact that the crisis was most felt in manufacturing and services, both sectors that tra-
ditionally locate in urban areas.
Per capita household income losses are largest among those at the boom of the
2008 income distribution (0 to 10th percentiles), with average losses ranging between
4 and 9 percent. Households in the 11th percentile and above suff er losses of about 4
percent, with no significant diff erences across percentiles. This confirms that the crisis
disproportionally aff ected those who were already in a dire situation in 2008.
Table 1.4: Poverty and inequality with and without crisis (constant poverty line)
Actual Projected
2008 2009 2010 2011
Poverty
Headcount rate 47.5 50.9 49.9 48.8
Poverty gap 20.3 22.4 21.9 21.2
Inequality (per capita income)
Gini 0.52 0.52 0.52 0.52
Source: Microsimulations using macro projections and INEGI.
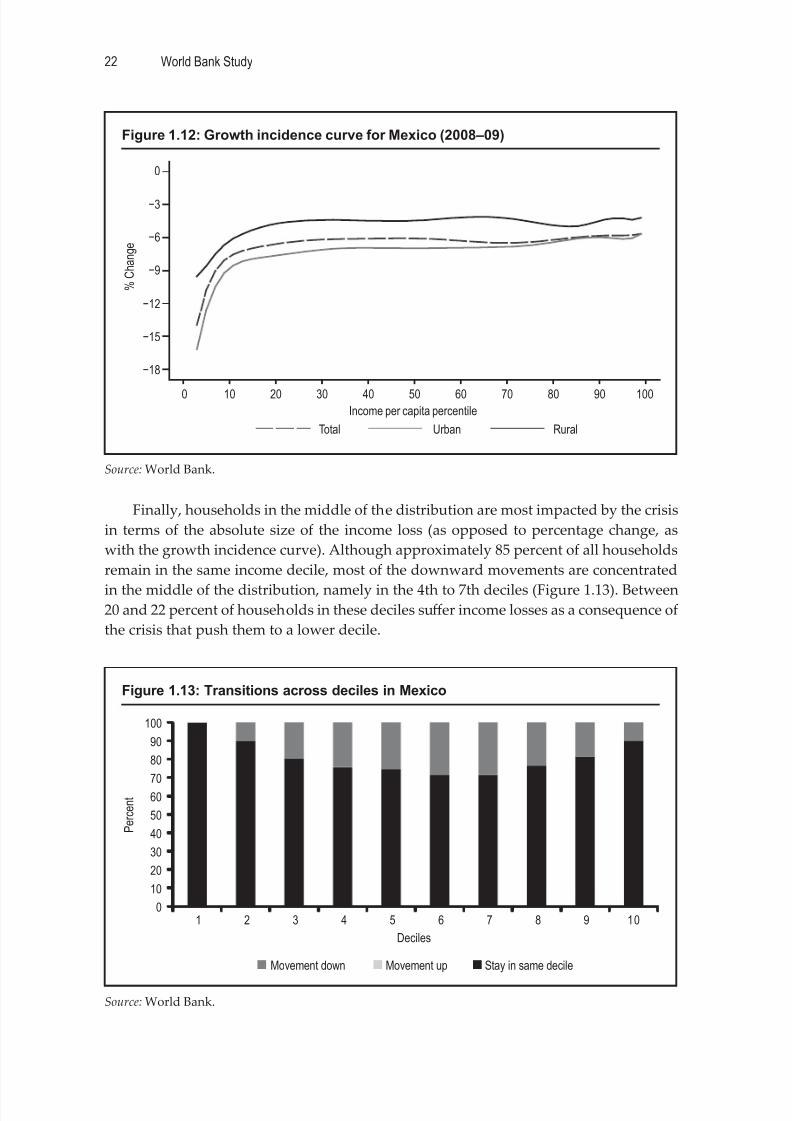
8/3/2019 Knowing When You Do Not Know
http://slidepdf.com/reader/full/knowing-when-you-do-not-know 36/76
World Bank Study22
Finally, households in the middle of the distribution are most impacted by the crisis
in terms of the absolute size of the income loss (as opposed to percentage change, as
with the growth incidence curve). Although approximately 85 percent of all households
remain in the same income decile, most of the downward movements are concentrated
in the middle of the distribution, namely in the 4th to 7th deciles (Figure 1.13). Between20 and 22 percent of households in these deciles suff er income losses as a consequence of
the crisis that push them to a lower decile.
Figure 1.12: Growth incidence curve for Mexico (2008–09)
Source: World Bank.
−18
−15
−12
−9
−6
−3
0
% C
h a n g e
0 10 20 30 40 50 60 70 80 90 100Income per capita percentile
Total Urban Rural
Figure 1.13: Transitions across deciles in Mexico
Source: World Bank.
0
10
20
30
40
50
60
70
80
90
100
1 2 3 4 5 6 7 8 9 10
Deciles
Movement down Movement up Stay in same decile
P e r c e n t
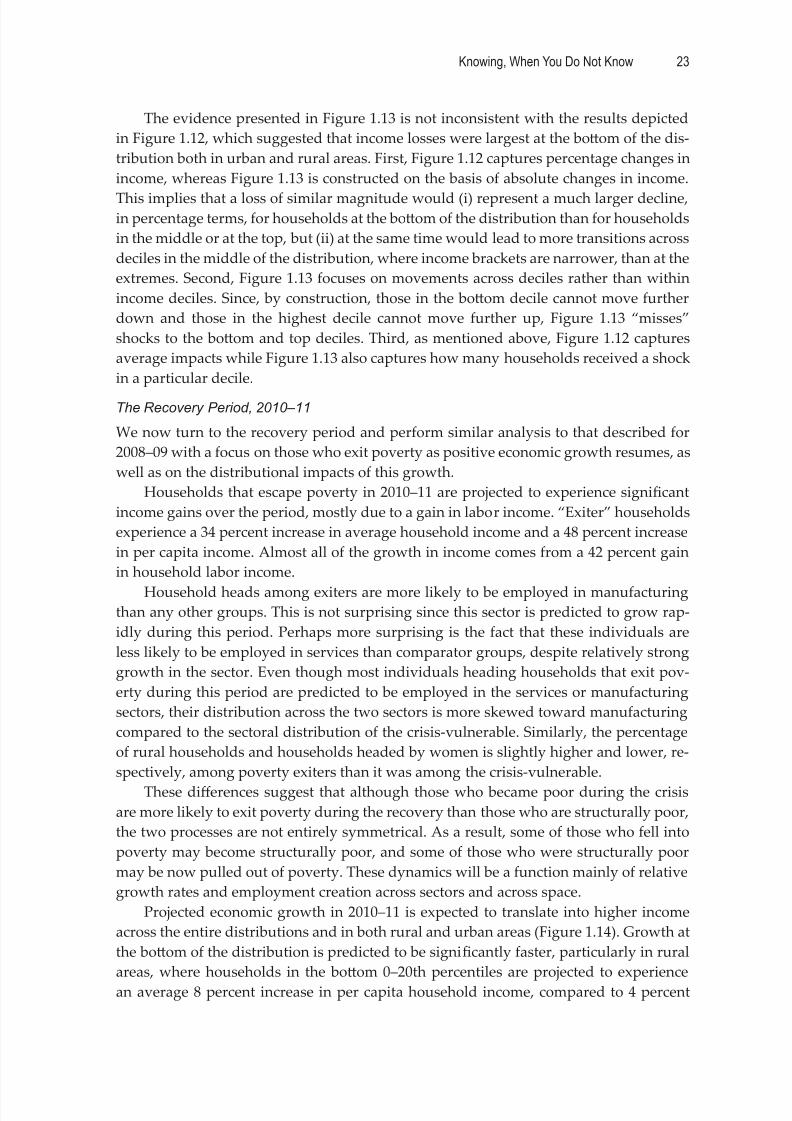
8/3/2019 Knowing When You Do Not Know
http://slidepdf.com/reader/full/knowing-when-you-do-not-know 37/76
Knowing, When You Do Not Know 23
The evidence presented in Figure 1.13 is not inconsistent with the results depicted
in Figure 1.12, which suggested that income losses were largest at the boom of the dis-
tribution both in urban and rural areas. First, Figure 1.12 captures percentage changes in
income, whereas Figure 1.13 is constructed on the basis of absolute changes in income.
This implies that a loss of similar magnitude would (i) represent a much larger decline,in percentage terms, for households at the boom of the distribution than for households
in the middle or at the top, but (ii) at the same time would lead to more transitions across
deciles in the middle of the distribution, where income brackets are narrower, than at the
extremes. Second, Figure 1.13 focuses on movements across deciles rather than within
income deciles. Since, by construction, those in the boom decile cannot move further
down and those in the highest decile cannot move further up, Figure 1.13 “misses”
shocks to the boom and top deciles. Third, as mentioned above, Figure 1.12 captures
average impacts while Figure 1.13 also captures how many households received a shock
in a particular decile.
The Recovery Period, 2010–11
We now turn to the recovery period and perform similar analysis to that described for
2008–09 with a focus on those who exit poverty as positive economic growth resumes, as
well as on the distributional impacts of this growth.
Households that escape poverty in 2010–11 are projected to experience significant
income gains over the period, mostly due to a gain in labor income. “Exiter” households
experience a 34 percent increase in average household income and a 48 percent increase
in per capita income. Almost all of the growth in income comes from a 42 percent gain
in household labor income.
Household heads among exiters are more likely to be employed in manufacturingthan any other groups. This is not surprising since this sector is predicted to grow rap-
idly during this period. Perhaps more surprising is the fact that these individuals are
less likely to be employed in services than comparator groups, despite relatively strong
growth in the sector. Even though most individuals heading households that exit pov-
erty during this period are predicted to be employed in the services or manufacturing
sectors, their distribution across the two sectors is more skewed toward manufacturing
compared to the sectoral distribution of the crisis-vulnerable. Similarly, the percentage
of rural households and households headed by women is slightly higher and lower, re-
spectively, among poverty exiters than it was among the crisis-vulnerable.
These diff erences suggest that although those who became poor during the crisis
are more likely to exit poverty during the recovery than those who are structurally poor,
the two processes are not entirely symmetrical. As a result, some of those who fell into
poverty may become structurally poor, and some of those who were structurally poor
may be now pulled out of poverty. These dynamics will be a function mainly of relative
growth rates and employment creation across sectors and across space.
Projected economic growth in 2010–11 is expected to translate into higher income
across the entire distributions and in both rural and urban areas (Figure 1.14). Growth at
the boom of the distribution is predicted to be significantly faster, particularly in rural
areas, where households in the boom 0–20th percentiles are projected to experience
an average 8 percent increase in per capita household income, compared to 4 percent
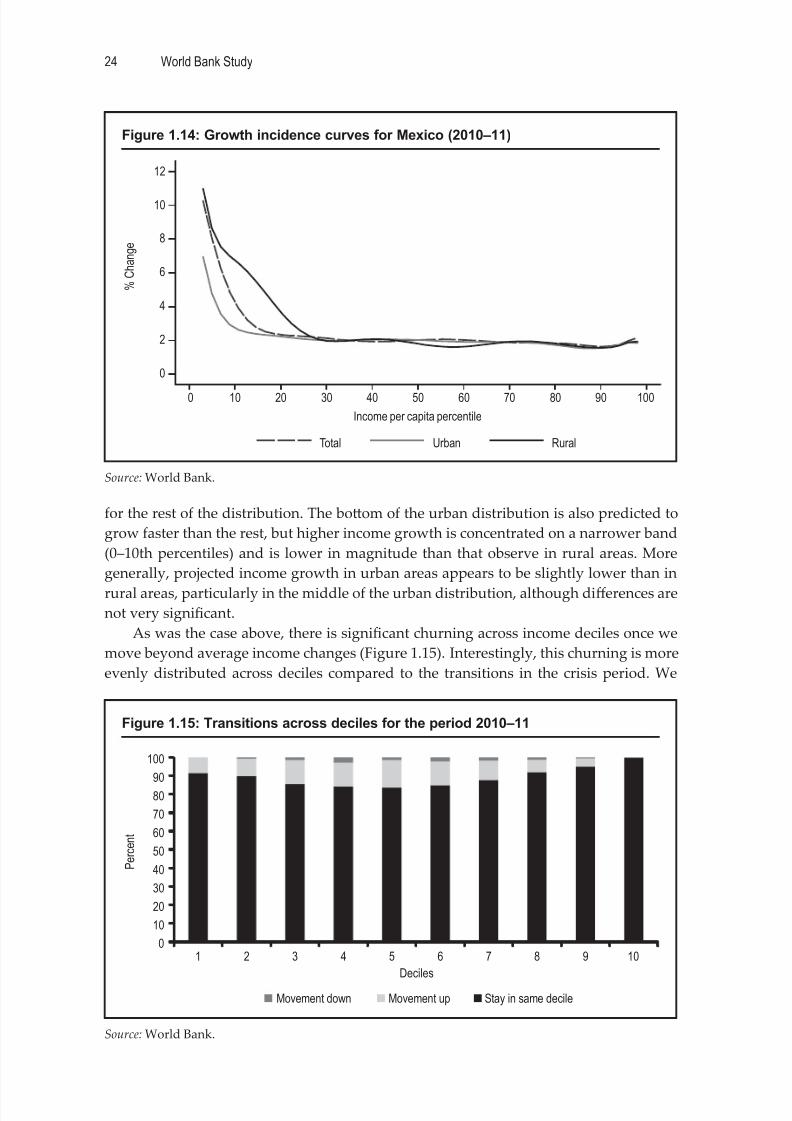
8/3/2019 Knowing When You Do Not Know
http://slidepdf.com/reader/full/knowing-when-you-do-not-know 38/76
World Bank Study24
for the rest of the distribution. The boom of the urban distribution is also predicted to
grow faster than the rest, but higher income growth is concentrated on a narrower band
(0–10th percentiles) and is lower in magnitude than that observe in rural areas. More
generally, projected income growth in urban areas appears to be slightly lower than in
rural areas, particularly in the middle of the urban distribution, although diff erences arenot very significant.
As was the case above, there is significant churning across income deciles once we
move beyond average income changes (Figure 1.15). Interestingly, this churning is more
evenly distributed across deciles compared to the transitions in the crisis period. We
Figure 1.14: Growth incidence curves for Mexico (2010–11)
Source: World Bank.
0
2
4
6
8
10
12
% C
h a n g e
0 10 20 30 40 50 60 70 80 90 100
Income per capita percentile
Total Urban Rural
Figure 1.15: Transitions across deciles for the period 2010–11
Source: World Bank.
0
10
20
30
40
50
60
70
80
90
100
1 2 3 4 5 6 7 8 9 10
Deciles
Movement down Movement up Stay in same decile
P e r c e n t
8/3/2019 Knowing When You Do Not Know
http://slidepdf.com/reader/full/knowing-when-you-do-not-know 39/76
Knowing, When You Do Not Know 25
now observe a significant percentage of households in the boom deciles experiencing
income gains that are large enough to place them in a higher decile, and the highest
proportion of upward movers is now concentrated in the low-middle section of the dis-
tribution (3–6th deciles as opposed to 4–7th deciles in 2008–09). Labor income seems once
more to be the main force behind the observed dynamics.
Simulating the Impact of Policy Responses
The model presented here can be used to predict the potential impact of policy respons-
es, particularly the type of policy measures that are intended to directly compensate
aff ected workers and households for their losses, or protect the poorest against depriva-
tion as a result of the crisis. To illustrate the potential use of the model in such scenarios,
we highlight examples of simulations conducted for two countries, Poland and Mexico,
focusing in both cases on the impact of an increase in social assistance on poverty and
income distribution.The results for Poland in the previous section show that unemployment insurance,
if administered according to pre-crisis rules, would have had a significant stabilizing ef-
fect on household incomes. The combination of lower employment levels and earnings
translates into household labor income being 3 and 5 percent lower in 2010 and 2011,
respectively, as a result of the crisis, while non-labor income is 3 and 2 percent higher,
mainly due to unemployment insurance benefits. Since non-labor income accounts for
about 30 percent of the average household’s income, its increase off sets some of the
losses in labor income. As a result, the poverty headcount rate is projected to be higher
by just 0.4 and 0.7 percentage points in 2010 and 2011, respectively, due to crisis. A
stabilizing influence of unemployment insurance is also found by Aran et al. (2010) forLatvia, where the poverty rate is simulated to be around 20 percent with unemployment
insurance as opposed to 23 percent in its absence.
To simulate the impact of increase in family allowance or social transfers in Po-
land, two scenarios for non-labor income were computed for each year (2010 and 2011).
While both these scenarios included a projected increase in unemployment insurance
payments, one of them also included a 20 percent increase in family allowance trans-
fers that was a part of the government’s crisis response package. The increase in social
transfers is projected to have reduced the poverty headcount rate by a further 0.3 and 0.2
percentage points in 2010 and 2011, respectively. This is due to an increase of 0.1 percent
in average household income, which includes larger increases of 0.7 and 0.3 percent forthe structurally poor and the crisis-vulnerable, respectively. After accounting for the im-
pact of the increase in social transfers, the impact of the crisis on poverty headcount rate
amounts to just 0.1 and 0.5 percentage points in 2010 and 2011, respectively.
In the case of Mexico, the model is used to simulate the impact of the introduction a
broad policy package to protect poor households in the wake of the crisis. The package
includes an expansion of existing safety net programs—Oportunidades and the Nutri-
tion Assistance Program (Programa de Apoyo Alimentario—PAL)—to increase the number
of beneficiaries by a total of 1 million. The simulations considered two diff erent hypo-
thetical targeting scenarios based on existing targeting methods in the country. Both
scenarios are projected to reduce the incidence and/or depth of poverty as compared tothe status quo, although the size and nature of the impact would vary with the choice
of targeting method. Scenario 1 assumes perfect targeting of the poorest, namely that
new beneficiary households would be those with the lowest welfare scores nationally
8/3/2019 Knowing When You Do Not Know
http://slidepdf.com/reader/full/knowing-when-you-do-not-know 40/76
World Bank Study26
(among non-beneficiary households), using the proxy means test (PMT) formula used
by the program. Scenario 2 assumes that new beneficiary households are chosen among
poor households that are closest to the poverty line nationally, again using the welfare
score computed by the PMT used by the program. While neither of these extreme sce-
narios would reflect the actual targeting strategy employed by the government, they areuseful in providing an upper and a lower bound on the poverty impact of the potential
program expansion. Scenario 2 provides an upper bound on the potential change in the
poverty headcount that could be generated with the proposed expansion in coverage,
while scenario 1 provides a lower bound. The converse is true about changes in the pov-
erty gap and the severity of poverty.
For the first scenario, the chronic poor are projected to benefit the most from the
proposed expansion, particularly in urban areas. The poverty headcount rate is not pro-
jected to decline in 2010 and 2011 as a result of the program expansion, which is not
surprising. Firstly, 1 million additional beneficiaries represent a large expansion with re-
spect to the existing coverage of the both programs, but only about 2 percent of the pro-
jected number of moderate poor in Mexico in 2010. Secondly, since households with the
lowest welfare score are selected, new beneficiaries are likely to be so far away from the
moderate and even the extreme poverty lines that the transfers would not be suffi cient to
take them out of poverty.25 The impact is however larger on the depth (poverty gap) and
severity (squared poverty gap) of poverty, since the transfers reduce their distance from
the moderate and extreme poverty lines. The second scenario would result in higher
impact on poverty headcount—1.8 and 1.7 percentage point reduction in 2010 and 2011
respectively—than for scenario 1, but a lower impact on depth and severity of poverty.
Regardless of whether the actual expansion was closer to scenario 1 or 2, new ben-
eficiary households are much more likely to have been chosen among the chronic poor
than among other groups (the new poor and the non-poor).26 This is consistent with the
offi cial program goal of serving the extreme and chronic poor.
Conclusion
Using the example of four countries facing the recent financial crisis, the approach de-
scribed here intends to provide analysts with a tool to project the welfare impacts of mac-
roeconomic shocks in the absence of real-time micro data on employment, earnings, or
income. The examples also show that focusing only on aggregate poverty and inequality
indices, as typically allowed by methods often used by analysts responding to demandsfor quick simulations, would provide a narrow and partial view of the distributional
impact of the crisis in a country. In the Philippines and Bangladesh, for example, even
though the impact on aggregate poverty and inequality is low, some groups are esti-
mated to suff er a disproportionately high impact. Urban households are projected to
suff er relatively larger losses than rural households in the Philippines, and within-urban
area losses are higher for the poor and the middle class. In Bangladesh, the estimated im-
pact is particularly significant for the top half of the distribution, with the urban middle
class being one of the most aff ected groups. How the impacts of shocks are distributed
in a country and what that implies about the characteristics of vulnerable groups can be
valuable information for policy makers in a number of diff erent ways.Firstly, the simulation results provide information on the people likely to suff er the
most losses, and can therefore inform the design of policy responses. The fact that the
8/3/2019 Knowing When You Do Not Know
http://slidepdf.com/reader/full/knowing-when-you-do-not-know 41/76
Knowing, When You Do Not Know 27
crisis-vulnerable and the structurally poor diff er significantly in their characteristics
in all countries suggests that expanding existing safety net programs intended for the
structurally poor to mitigate the losses of the crisis-vulnerable may not be eff ective or
practical. Instead, interventions that address increased levels of vulnerability and pro-
tect households against risk may be required. In some cases, the distributional impactscan also have political economy implications that in turn maer for policy responses. For
example, the substantial losses suff ered by the urban middle-income and poor house-
holds are important factors to take into account because of the disproportionate influ-
ence these groups can have on public perceptions and the political debate in a country.
Secondly, as the section above, “Simulating the Impact of Policy Responses,” il-
lustrates, the model can also be used to simulate the impact of particular policy inter-
ventions, especially those that directly aff ect household income. While the results of
such simulations vary significantly by country, certain lessons can be generalized. In
countries where losses in labor income dominate, automatic stabilizers like unemploy-
ment insurance (as in Poland and Latvia) can mitigate the poverty impact to a significant
degree. While losses in non-labor income due to fall in remiances cannot be compen-
sated by automatic stabilizers, social assistance programs can potentially play a role in
mitigating some of these losses. Even in the context of labor income losses, which part of
the market is aff ected by the crisis can be an important consideration for policy makers,
since automatic stabilizers would typically apply to workers in the formal sector only.
In a country like Mexico, where automatic stabilizers are nonexistent or limited in their
coverage of aff ected workers, expansion in social assistance can be eff ective in mitigating
some of the impacts of the crisis on the poor. Expanding the coverage of the Oportuni-
dades and PAL programs in Mexico by a total of 1 million households in 2010 could have
reduced the depth of poverty by up to 2 percent or the poverty headcount rate by up to
1.8 percentage points, depending on what targeting strategy was employed to select the
new beneficiaries.
Thirdly, the simulation exercise can help identify a list of possible “leading indica-
tors” that can be monitored rapidly to gauge the likely welfare impacts of a crisis, in
the absence of real-time information on household income/consumption. Although the
appropriate choice of indicators would depend on the main transmission channels in
a specific country, manufacturing employment, wages, remiance flows, and relative
food prices emerge as potential candidates for monitoring in all four countries.
Information on the simulated impact of both shocks and potential policy interven-tions proved to be a valuable input into the policy discussion during the crisis, and will
continue to be relevant for policy makers and analysts when real-time data is not avail-
able. The methodology discussed here, as well as possible refinements and improve-
ments to this approach, is therefore likely to remain relevant. Clearly, the model is ap-
plicable to a number of country contexts and for addressing a range of questions related
to distributional impacts of an economic shock. Minimum data requirements include
up-to-date macroeconomic projections by sector, with and without crisis, and a fairly
recent household survey with income data that can be classified by sector.
Looking ahead, the analytical tool would benefit from future eff orts to extend or
nuance the approach used here, as long as such eff orts are tailored to the availability ofdata and the specific country context. For example, the availability of more disaggregat-
ed macroeconomic projections would allow for a more detailed distributional analysis,
to capture movements within sectors and across types of employment. Availability of
8/3/2019 Knowing When You Do Not Know
http://slidepdf.com/reader/full/knowing-when-you-do-not-know 42/76
World Bank Study28
beer migration data in household surveys could allow for explicit modeling of migra-
tion decisions for countries where remiances are an important source of household
income, as opposed to the somewhat arbitrary rules applied in the simulations here.
And availability of surveys conducted during a crisis (such as quarterly labor force or
rapid monitoring surveys), which hint at some of the impacts in real time, can be usefulin fine-tuning the model to take into account unanticipated changes in relative prices or
in the labor market. Exploring such extensions to the model, along with improving the
availability of data that make such extensions possible, would be a worthwhile future
area for international institutions like the World Bank to invest in, to inform the advisory
and financial support they often provide to countries aff ected by macroeconomic shocks.
Notes
1. The full studies for Bangladesh and the Philippines are available as World Bank Policy Research
Working Papers (Habib et al. 2010a and 2010b). Some of the early results are also summarized in an
Economic Premise published by PREM Network, World Bank (Habib et al. 2010c). Full results for
Mexico are presented as a chapter in World Bank (2010, draft); the Poland results are summarized
in an annex to a World Bank loan document.
2. In addition to these four countries, simulations have also been conducted for Mongolia (draft pa-
per under review) and for the impact of natural disasters (cyclones) in the Philippines. The results
of these exercises are not discussed in this chapter.
3. While a number of other simulation exercises are likely to have been conducted at the Bank to
simulate welfare impacts of the crisis from pre-crisis data, this report refers primarily to Aran et
al. (2010), since their methodology and approach are the closest to ours. Unlike most of the other
exercises, their methodology and results are also readily available in the form of a comprehensive,
citable source.
4. See Kannan (2009) and Kannan et al. (2009). They cite research done at the IMF on paerns ofrecovery from financial crises in advanced economies, which shows that recessions associated with
financial crises tend to be severe and recoveries from such recessions are typically slow. It takes
almost three years to return to the pre-recession output level—twice the time it takes to recover
from other recessions.
5. There is lile consensus in the development literature about how to define the “middle class”. A
number of diff erent definitions have been used, such us Blackburn and Bloom (1987), Beach (1989),
Levy and Murnane (1992), Jenkins (1995) and Burkhauser et al. (1999). For our purpose, we define
the middle class broadly as those above the poverty line but below the richest decile (10%) of the
population. In Bangladesh, this is the group between the 40th and 90th percentiles of per capita
expenditure or income.
6. See World Bank (2011) for a discussion of channels through which the poor in Europe and Cen-
tral Asia were impacted during the financial crisis.
7. See Bussolo (2008), Bourguignon et al. (2005), Ganuza et al. (2002) and Ganuza et al. (2006). An-
other common approach is PovStat, an Excel-based World Bank simulation package, which uses
household survey data and macroeconomic projections as inputs and estimates changes in poverty
and inequality indicators. Although it allows for impacts to occur through multiple channels, it
focuses exclusively on household heads and therefore does not allow for a full accounting of labor
market impacts. Also, it does not off er an easy way to examine changes in non-labor income (such
as remiances), which has important implications for crisis impacts in some countries.
8. For a more detailed description than what is provided here, see Habib et al. (2010a, 2010b).
9. The estimations of employment status (though a multinomial model) are done separately for
urban and rural areas, and those of earnings (an OLS model) are done separately for each sector.
10. For some countries the assignment rule is also such that the regional distribution of remiancesin the crisis year remains identical to that in the baseline year.
11. Note that by construction, the projected income/consumption distribution for a crisis year is
expressed in terms of prices in the baseline year. This would imply that in order to obtain poverty
8/3/2019 Knowing When You Do Not Know
http://slidepdf.com/reader/full/knowing-when-you-do-not-know 43/76
Knowing, When You Do Not Know 29
estimates that are comparable with the baseline estimates, the baseline poverty line should be kept
unchanged in real terms.
12. See Habib et al. (2010a, 2010b) for more details on how the adjustment for food price inflation
is applied to the poverty line.
13. To state an obvious point: either type of comparison, Type I or Type II, is possible for any
country. The diff erentiation between the countries is therefore purely driven by what type of com-
parison was found to be most useful by the Bank country team and the government of that country.
14. Note that the policy being simulated should ideally have a large enough macroeconomic im-
pact to carry through to the micro level. This is usually achieved by countrywide policies, for
example, unemployment insurance.
15. Aran et al. (2010), on the other hand, are able to use macro data from Turkey to disaggregate
their microeconomic outputs into formal and informal sectors.
16. In the case of Bangladesh, for example, the baseline year is 2005, which is a full four to five years
away from the prediction years (2009 and 2010).
17. Sectoral movements of labor are modeled as depending only on individual/household char-
acteristics (through the multinomial logit model) and population growth. This cannot take into
account the kind of structural shifts that have apparently been observed in some countries due tothe crisis, such as a reduction in the relative demand for skilled labor.
18. The use of this assumption for Bangladesh would not have aff ected the results significantly,
given the high correlation between household per capita income and consumption in the baseline
Bangladesh data. The validation exercise also suggests that the simulation results are reasonable in
spite of this naïve assumption.
19. Importantly, even when household data capturing the impact of the crisis becomes available, a
true validation of the simulation results will be diffi cult in case of Type I countries, since the actual
household data cannot be used to generate the counterfactual scenario of what household incomes
and employment would have been in the absence of the crisis. Even in the case of Type II countries,
a before-after ex post comparison may not constitute a validation of the ex ante simulation if the
actual policy responses are diff
erent from what was included in the simulation.20. Aran et al. find that in Latvia, unemployment insurance would have reduced the crisis poverty
rate by as much as 3 percentage points.
21. Note that actual GDP figures for 2010, which are available by now, may be diff erent from these
projections.
22. It is important to note that within a given country, those receiving most of their total household
incomes from one or other of the two sources tend to have diff erent characteristics. As a result, these
diff erential impacts in labor and non-labor income have significant distributional implications.
23. We plot the share of households in each decile who: (i) suff er an income loss large enough to
shift them to a lower income decile (that is, had the income distribution at benchmark been equal
to that in the crisis scenario, these households would have fallen to a lower income decile); (ii) suf-
fer a relatively small income loss and therefore their position does not change much (that is, had
the income distributions been equal in the two scenarios, these households would have remainedin the same income decile); and (iii) suff er a positive shock and therefore are beer off in the crisis
scenario (that is, had the income distribution in the crisis been equal to that at benchmark, these
households would have climbed to a higher income decile).
24. While macroeconomic data on output and employment for 2009 was available at the time the
report was prepared, no post-crisis household-level information existed. The last National House-
hold Income and Expenditure Survey (Encuesta Nacional de Ingresos y Gastos de los Hogares—ENIGH)
was collected in 2008 and data from the next round scheduled in 2010 has become available as this
study is being completed. None of the analysis here is based on actual data during or after the
crisis; all results on the impacts of the crisis and the subsequent recovery are from the microsimula-
tions using pre-crisis household survey data.
25. The average simulated Oportunidades (PAL) transfer is equal to 76 percent (28 percent) and 17percent (10 percent) of the extreme and the moderate poverty gaps, respectively.
26. The chronic poor can be understood as either those who were poor before the crisis and remained
so or those who were poor after the crisis and have a low probability of exiting poverty by 2011.
8/3/2019 Knowing When You Do Not Know
http://slidepdf.com/reader/full/knowing-when-you-do-not-know 44/76
30
C H A P T E R 2
On Economy-Wide Shocks,Models and Politics
Michael Walton
When a society suff ers a big economic shock, what should be done? How does what
should be done relate to what is typically actually done in practice? And wherethere is a diff erence, how can technical analysis serve to understand and reduce this gap?
Atfirst sight, the question of what should be done looks simple. Big adverse shocks
are surely less subtle in their policy demands than solving questions of long-run growth,
industrial policy, or service delivery. The problems are clear, there is political pressure to
do something, and the motivation to act is much higher, amongst government agencies
and civil society. Or at least the problem should be clear, since the classic shocks—com-
modity price changes, sudden stops in financial flows, international slowdowns, harvest
failures, floods and so on—are, unfortunately, repeated again and again. There should
be substantial experience of the consequences of the shocks, and of alternative responses.
Then the task of government, and of supporting external agencies, is to adjust policy toprovide greatest relief to those hardest hit, and those most likely to be permanently hurt.
Both interpretation and policy design is, however, a lot murkier and more compli-
cated than this account would suggest. As the 2010 debates in the post-financial crisis
industrialized world illustrate, there is even substantial professional and political dis-
agreement over the basic intertemporal decisions over optimal deficit and debt man-
agement for the whole economy. Beyond aggregate choices the questions are deeply
distributional, with respect to short and long-run eff ects across households, individu-
als, and groups. This substantially complicates maers. Transmission mechanisms from
shocks to diff erent groups and their behavioral responses are often ill-understood, and
only weakly integrated into a coherent overall account. Working out what is optimal isnot trivial.
When we turn to what is typically done in practice, further complications arise.
There are two kinds of reason why actual responses can diverge from what is optimal.
First, as just indicated, optimal policy may itself be unclear, especially where short-run
information on actual eff ects is unavailable. Systematic information collection in devel-
oping countries almost always comes with a lag, sometimes of years (for example, for
national household surveys in poorer countries). Second, when many individuals,firms,
or groups are taking a hit, the natural tendency is to act to protect your assets, consump-
tion, or other dimension of (household or firm) well-being. Yet the capacity to act, in
terms of information, resources, political influence, or other connections, is likely to be
highly heterogeneous, and much more likely to be positively correlated with wealth, sta-
8/3/2019 Knowing When You Do Not Know
http://slidepdf.com/reader/full/knowing-when-you-do-not-know 45/76
Knowing, When You Do Not Know 31
tus, and power. And this will often be exactly the opposite of the simple view on optimal
policy suggested above.
All this underlies the potential desirability of an approach to analysis and policy
interpretation that combines:
■ Practicality and timeliness
■ Enough sophistication to capture the heterogeneity of transmission mechanisms
and behavioral responses
■ Political salience.
This is a tall order. But it is an important challenge for development practitioners,
with precisely the kind of technical and political economy mix that should lie at the heart
of development work.
The point of departure of this essay is a reaction to a set of practical models for
analyzing the poverty and distributional impacts of crises. These lie precisely in this
domain. These are described in other contributions to this volume. They were sponsored by, and in many cases undertaken within, the World Bank. However, most of the issues
at stake actually have nothing to do with the World Bank itself—since both the questions
and the modeling approach are of general concern and practice. The bulk of this essay
will assess the approach in this broader context. At the end I briefly discuss the specific
question of the World Bank’s role.
The technical work was inspired by the series of economy-wide shocks that have
hit developing countries in the last few years—from big increases in food and oil prices,
to the more complex shocks associated with the international financial crisis, which af-
fected both external demand for goods and international financial markets. The concern
is with systemic shocks experienced by a country, as opposed to the individual shocks
that households suff er owing to idiosyncratic influences, for example from ill-health, job
loss, or a business failure in normal economic times.
There are two features of the general approach that cut across the particularities of
the models. First, they are concerned with mapping economy-wide developments on to
the conditions of individuals and households. Second, they seek to be practically, and
politically, relevant—that is to provide information to policy makers and interest groups
in time to shape policies.
These two considerations drive the main design choice of developing models that
link macroeconomic or sectoral developments to the characteristics of individuals and
households, via existing labor market or household surveys, and then develop a capac-
ity to simulate alternative scenarios. This is often called a microsimulation approach.
Linking economy-wide developments to households (and firms) is an obvious require-
ment. The use of simulations flows from the typical absence of up-to-date information
on outcomes. And the link to households and firms is essential to assess impacts and
responses, and also, if less obviously, to the interpretation of political economy.
This approach is in contrast to one that relies primarily on gathering real informa-
tion on actual impacts and responses. While the two approaches are obviously comple-
mentary, the whole point of undertaking a structured, microsimulation approach is to
provide information that is both suffi
ciently timely to be of practical relevance and hope-fully to be politically salient.
8/3/2019 Knowing When You Do Not Know
http://slidepdf.com/reader/full/knowing-when-you-do-not-know 46/76
World Bank Study32
The approach has one enormous strength: it allows systematic, illustrative explora-
tion of alternative policy choices—or indeed alternative views on the behavior of dif-
ferent actors. These can be developed for policy makers as they assess what to do. This
work can be undertaken by a ministry’s technical staff or by an external actor, such as a
domestic think tank or the World Bank.But the approach also has a potentially large weakness: it may get responses wrong,
and deliver misleading results. We are dealing with highly complex systems. As noted
above, it is hard enough to model responses to shocks in the macroeconomy. When the
task is to include the behavioral responses of the large, heterogeneous range of house-
hold and firm actors in a society, the systemic eff ects may be of bewildering complexity.
The main response to the systemic challenge is to choose to analyze partial equilib-
rium eff ects on part of the system—for example, on household consumption or unem-
ployment, and often limit this to first-round impact eff ects. This is good for tractability
and transparency: it is relatively easy to understand what is going on, and this is surely
beer than a modeling approach that adds more complexity but becomes a black box,
obfuscating rather than improving the informational basis of policy and public debate.
But the nature of second-round and systemic eff ects cannot be ignored. This includes the
potential behavioral response of one of the most important actors—the government—
and so inevitably gets into political economy.
The remainder of this comment has two themes. First, that second-round and sys-
temic eff ects can be of major, and sometimes first-order, significance to technical and
political economy analysis. And second, that it is important to have an explicit view on
what might be termed the practical political economy of information—that is on how in-
formation, in this case from analysis and modeling, can lead to changes in public action.
When Are Second-Round and Systemic Effects a First-Order Concern?
An ex ante, first-round, empirically informed impact analysis of the eff ects of shocks
on part of the households and firm system clearly contributes to the interpretation of
the consequences of crises. As several studies (including those described in Chapter 1)
illustrate, this type of analysis suggests distribution maers (in the sense that impacts
vary across households), that eff ects can diff er from initial intuitions (so the complexity
of the modeling adds something), and that these potentially make a diff erence for policy
choice (see Ajwad et al., 2010, Ferreira et al., 2010, Habib et al., 2010)
So far, so good. But are there conditions in which a first-round impact analysis issuffi ciently incomplete or misleading to make a large diff erence to both interpretation
and policy? There are a number of reasons for thinking this could often be the case. To
fully work through this would require a careful comparison between an ex ante model-
ing analysis and ex post experiences. That is not done here—though it would surely be
valuable to do so in the future. So the argument is suggestive.
It is useful to distinguish two kinds of reasons: second-round eff ects; and things
happening in response to a shock outside the part of the system being analyzed.
Second-Round Effects
Here I give illustrations of three areas associated with household responses in responseto changes in market conditions after a shock.
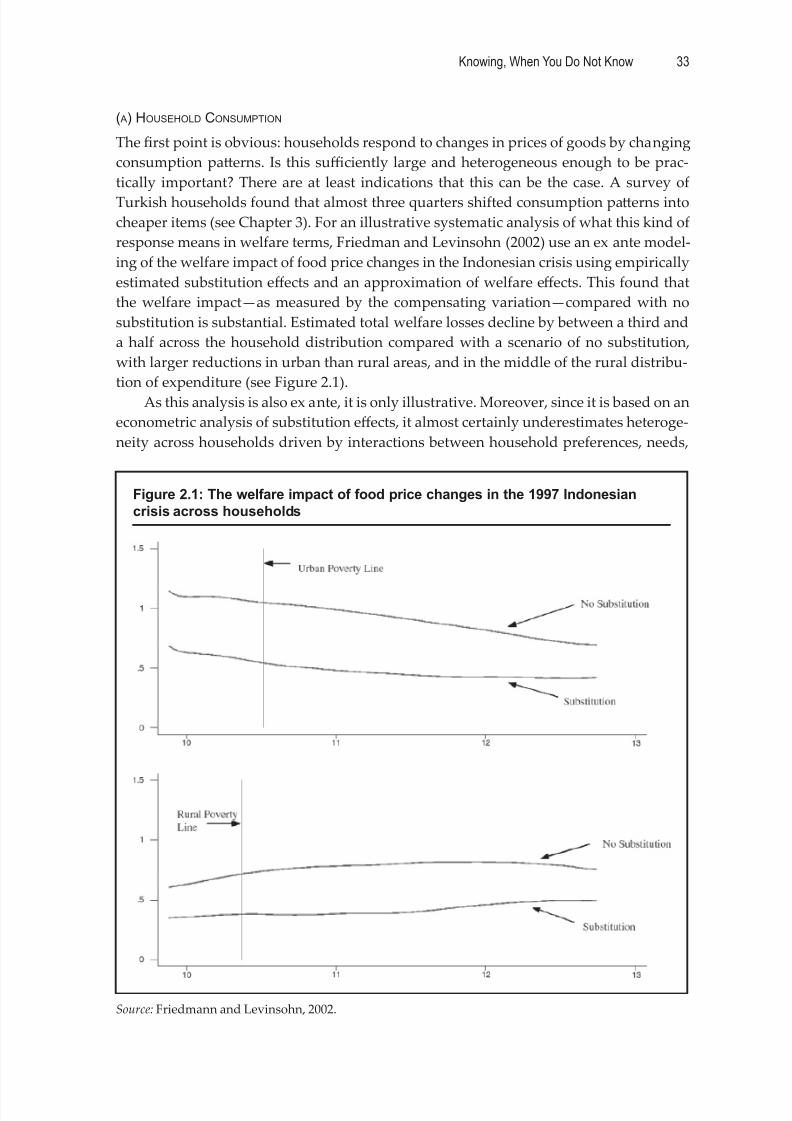
8/3/2019 Knowing When You Do Not Know
http://slidepdf.com/reader/full/knowing-when-you-do-not-know 47/76
Knowing, When You Do Not Know 33
( A) HOUSEHOLD CONSUMPTION
The first point is obvious: households respond to changes in prices of goods by changing
consumption paerns. Is this suffi ciently large and heterogeneous enough to be prac-
tically important? There are at least indications that this can be the case. A survey of
Turkish households found that almost three quarters shifted consumption paerns into
cheaper items (see Chapter 3). For an illustrative systematic analysis of what this kind of
response means in welfare terms, Friedman and Levinsohn (2002) use an ex ante model-
ing of the welfare impact of food price changes in the Indonesian crisis using empirically
estimated substitution eff ects and an approximation of welfare eff ects. This found that
the welfare impact—as measured by the compensating variation—compared with no
substitution is substantial. Estimated total welfare losses decline by between a third and
a half across the household distribution compared with a scenario of no substitution,
with larger reductions in urban than rural areas, and in the middle of the rural distribu-
tion of expenditure (see Figure 2.1).
As this analysis is also ex ante, it is only illustrative. Moreover, since it is based on an
econometric analysis of substitution eff ects, it almost certainly underestimates heteroge-
neity across households driven by interactions between household preferences, needs,
Figure 2.1: The welfare impact of food price changes in the 1997 Indonesiancrisis across households
Source: Friedmann and Levinsohn, 2002.
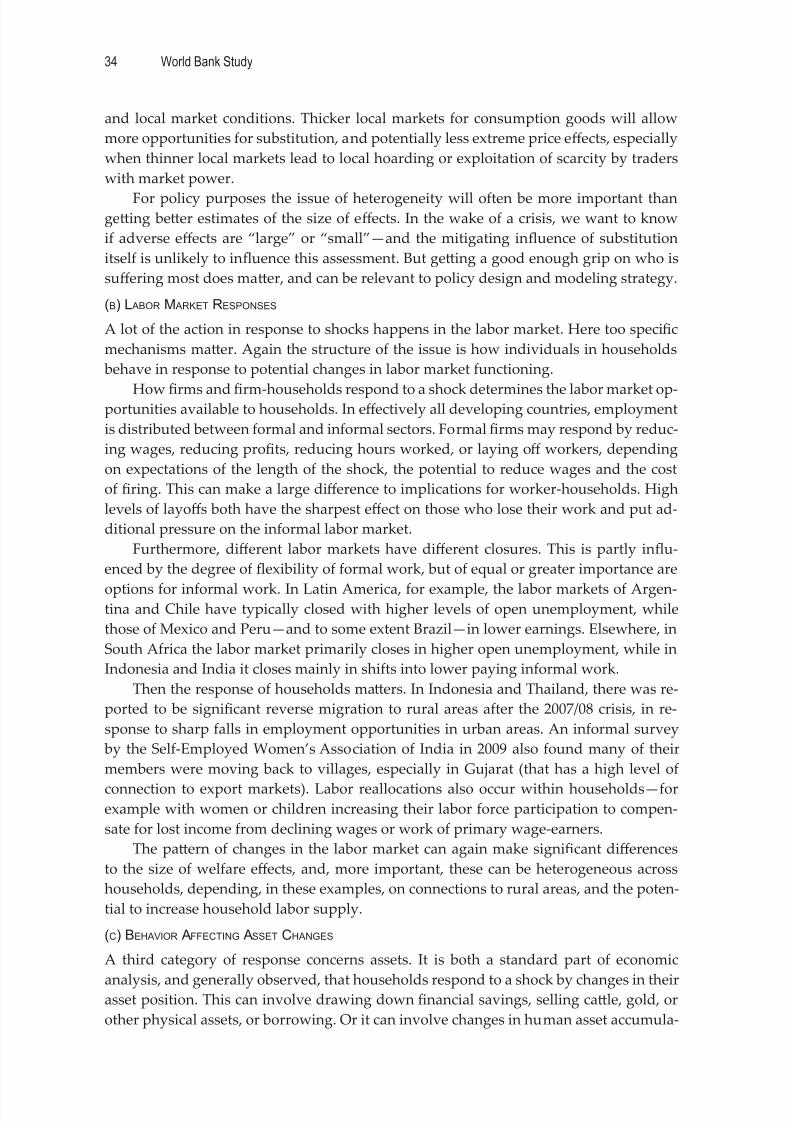
8/3/2019 Knowing When You Do Not Know
http://slidepdf.com/reader/full/knowing-when-you-do-not-know 48/76
World Bank Study34
and local market conditions. Thicker local markets for consumption goods will allow
more opportunities for substitution, and potentially less extreme price eff ects, especially
when thinner local markets lead to local hoarding or exploitation of scarcity by traders
with market power.
For policy purposes the issue of heterogeneity will often be more important thangeing beer estimates of the size of eff ects. In the wake of a crisis, we want to know
if adverse eff ects are “large” or “small”—and the mitigating influence of substitution
itself is unlikely to influence this assessment. But geing a good enough grip on who is
suff ering most does maer, and can be relevant to policy design and modeling strategy.
(B) L ABOR M ARKET RESPONSES
A lot of the action in response to shocks happens in the labor market. Here too specific
mechanisms maer. Again the structure of the issue is how individuals in households
behave in response to potential changes in labor market functioning.
How firms and firm-households respond to a shock determines the labor market op-portunities available to households. In eff ectively all developing countries, employment
is distributed between formal and informal sectors. Formalfirms may respond by reduc-
ing wages, reducing profits, reducing hours worked, or laying off workers, depending
on expectations of the length of the shock, the potential to reduce wages and the cost
of firing. This can make a large diff erence to implications for worker-households. High
levels of layoff s both have the sharpest eff ect on those who lose their work and put ad-
ditional pressure on the informal labor market.
Furthermore, diff erent labor markets have diff erent closures. This is partly influ-
enced by the degree of flexibility of formal work, but of equal or greater importance are
options for informal work. In Latin America, for example, the labor markets of Argen-tina and Chile have typically closed with higher levels of open unemployment, while
those of Mexico and Peru—and to some extent Brazil—in lower earnings. Elsewhere, in
South Africa the labor market primarily closes in higher open unemployment, while in
Indonesia and India it closes mainly in shifts into lower paying informal work.
Then the response of households maers. In Indonesia and Thailand, there was re-
ported to be significant reverse migration to rural areas after the 2007/08 crisis, in re-
sponse to sharp falls in employment opportunities in urban areas. An informal survey
by the Self-Employed Women’s Association of India in 2009 also found many of their
members were moving back to villages, especially in Gujarat (that has a high level of
connection to export markets). Labor reallocations also occur within households—forexample with women or children increasing their labor force participation to compen-
sate for lost income from declining wages or work of primary wage-earners.
The paern of changes in the labor market can again make significant diff erences
to the size of welfare eff ects, and, more important, these can be heterogeneous across
households, depending, in these examples, on connections to rural areas, and the poten-
tial to increase household labor supply.
(C) BEHAVIOR AFFECTING ASSET CHANGES
A third category of response concerns assets. It is both a standard part of economic
analysis, and generally observed, that households respond to a shock by changes in theirasset position. This can involve drawing down financial savings, selling cale, gold, or
other physical assets, or borrowing. Or it can involve changes in human asset accumula-
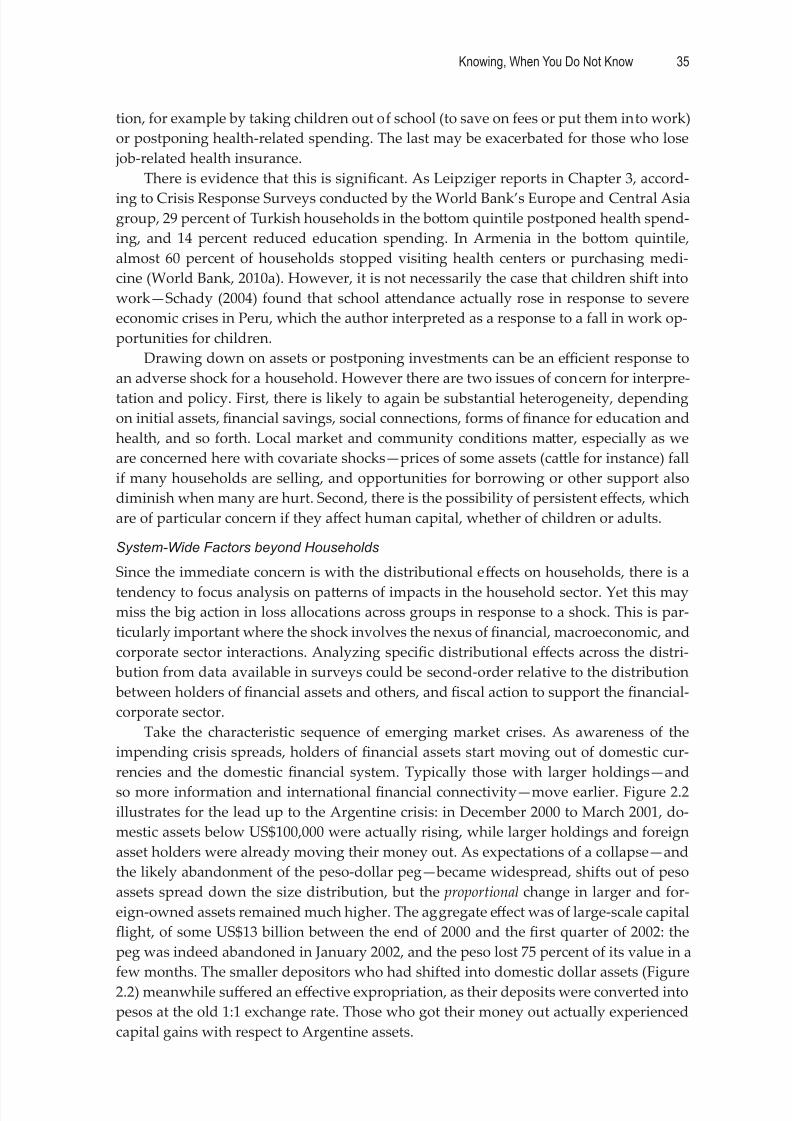
8/3/2019 Knowing When You Do Not Know
http://slidepdf.com/reader/full/knowing-when-you-do-not-know 49/76
Knowing, When You Do Not Know 35
tion, for example by taking children out of school (to save on fees or put them into work)
or postponing health-related spending. The last may be exacerbated for those who lose
job-related health insurance.
There is evidence that this is significant. As Leipziger reports in Chapter 3, accord-
ing to Crisis Response Surveys conducted by the World Bank’s Europe and Central Asiagroup, 29 percent of Turkish households in the boom quintile postponed health spend-
ing, and 14 percent reduced education spending. In Armenia in the boom quintile,
almost 60 percent of households stopped visiting health centers or purchasing medi-
cine (World Bank, 2010a). However, it is not necessarily the case that children shift into
work—Schady (2004) found that school aendance actually rose in response to severe
economic crises in Peru, which the author interpreted as a response to a fall in work op-
portunities for children.
Drawing down on assets or postponing investments can be an effi cient response to
an adverse shock for a household. However there are two issues of concern for interpre-
tation and policy. First, there is likely to again be substantial heterogeneity, depending
on initial assets, financial savings, social connections, forms of finance for education and
health, and so forth. Local market and community conditions maer, especially as we
are concerned here with covariate shocks—prices of some assets (cale for instance) fall
if many households are selling, and opportunities for borrowing or other support also
diminish when many are hurt. Second, there is the possibility of persistent eff ects, which
are of particular concern if they aff ect human capital, whether of children or adults.
System-Wide Factors beyond Households
Since the immediate concern is with the distributional eff ects on households, there is a
tendency to focus analysis on paerns of impacts in the household sector. Yet this maymiss the big action in loss allocations across groups in response to a shock. This is par-
ticularly important where the shock involves the nexus of financial, macroeconomic, and
corporate sector interactions. Analyzing specific distributional eff ects across the distri-
bution from data available in surveys could be second-order relative to the distribution
between holders of financial assets and others, and fiscal action to support the financial-
corporate sector.
Take the characteristic sequence of emerging market crises. As awareness of the
impending crisis spreads, holders of financial assets start moving out of domestic cur-
rencies and the domestic financial system. Typically those with larger holdings—and
so more information and international financial connectivity—move earlier. Figure 2.2
illustrates for the lead up to the Argentine crisis: in December 2000 to March 2001, do-
mestic assets below US$100,000 were actually rising, while larger holdings and foreign
asset holders were already moving their money out. As expectations of a collapse—and
the likely abandonment of the peso-dollar peg—became widespread, shifts out of peso
assets spread down the size distribution, but the proportional change in larger and for-
eign-owned assets remained much higher. The aggregate eff ect was of large-scale capital
flight, of some US$13 billion between the end of 2000 and the first quarter of 2002: the
peg was indeed abandoned in January 2002, and the peso lost 75 percent of its value in a
few months. The smaller depositors who had shifted into domestic dollar assets (Figure
2.2) meanwhile suff ered an eff ective expropriation, as their deposits were converted into
pesos at the old 1:1 exchange rate. Those who got their money out actually experienced
capital gains with respect to Argentine assets.
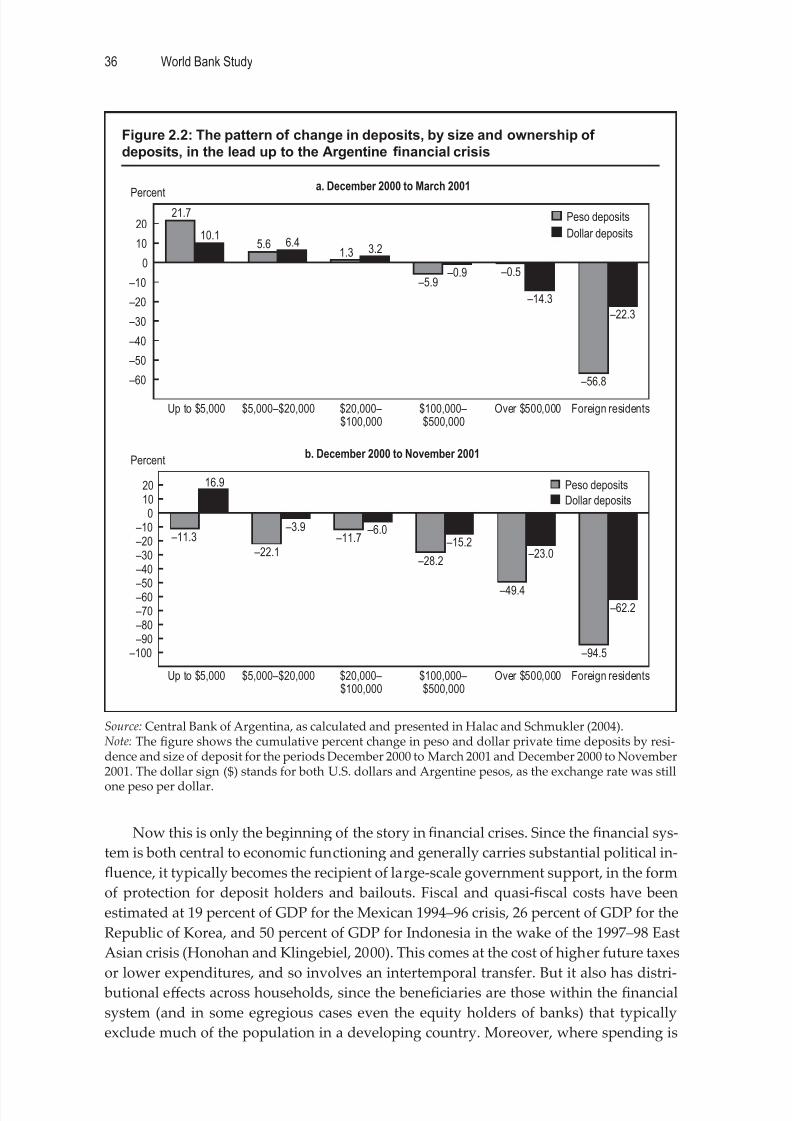
8/3/2019 Knowing When You Do Not Know
http://slidepdf.com/reader/full/knowing-when-you-do-not-know 50/76
World Bank Study36
Now this is only the beginning of the story in financial crises. Since the financial sys-
tem is both central to economic functioning and generally carries substantial political in-
fluence, it typically becomes the recipient of large-scale government support, in the form
of protection for deposit holders and bailouts. Fiscal and quasi-fiscal costs have been
estimated at 19 percent of GDP for the Mexican 1994–96 crisis, 26 percent of GDP for the
Republic of Korea, and 50 percent of GDP for Indonesia in the wake of the 1997–98 East
Asian crisis (Honohan and Klingebiel, 2000). This comes at the cost of higher future taxes
or lower expenditures, and so involves an intertemporal transfer. But it also has distri-
butional eff ects across households, since the beneficiaries are those within the financial
system (and in some egregious cases even the equity holders of banks) that typically
exclude much of the population in a developing country. Moreover, where spending is
Figure 2.2: The pattern of change in deposits, by size and ownership ofdeposits, in the lead up to the Argentine financial crisis
Source: Central Bank of Argentina, as calculated and presented in Halac and Schmukler (2004).Note: The figure shows the cumulative percent change in peso and dollar private time deposits by resi-dence and size of deposit for the periods December 2000 to March 2001 and December 2000 to November2001. The dollar sign ($) stands for both U.S. dollars and Argentine pesos, as the exchange rate was still
one peso per dollar.
Up to $5,000 $5,000–$20,000 $20,000–$100,000
$100,000–$500,000
Over $500,000 Foreign residents
Up to $5,000 $5,000–$20,000 $20,000–$100,000
$100,000–$500,000
Over $500,000 Foreign residents
Peso deposits
Dollar deposits
Peso deposits
Dollar deposits
–11.3 –22.1
–11.7
–28.2
–49.4
–94.5
16.9
–3.9 –6.0 –15.2
–23.0
–62.2
–60
–50
–40
–30
–20
–10
0
10
20
–60 –70 –80 –90
–100
–50
–40 –30 –20 –10
01020
21.7
5.61.3
10.16.4
3.2
–5.9 –0.5
–56.8
–0.9
–14.3
–22.3
a. December 2000 to March 2001
b. December 2000 to November 2001
Percent
Percent
8/3/2019 Knowing When You Do Not Know
http://slidepdf.com/reader/full/knowing-when-you-do-not-know 51/76
Knowing, When You Do Not Know 37
on an increasingly progressive path, as it was in Latin America in the 1990s and 2000s,
the foregone spending has an additional regressive impact.
A final issue concerns wage and profit shares. There is some evidence that crises are
associated with reductions in wage shares (Diwan, 2001). Indeed, Diwan suggests that
crises work as a mechanism for resolution of distributional fights when mechanisms innormal economic times prove inadequate. A crisis forces a loss allocation process that of-
ten hurts labor incomes disproportionately. Most household surveys only capture labor
incomes—or the consumption of households whose dominant source of income is from
labor or the returns from self-employed activities—and so misses this action.
Implications
What do these comments imply? Of course the world is more complex than can be cap-
tured in any modeling approach. The point is not to seek an ever-more complicated
model—that comes at the cost of tractability and, even more important, transparency.However, I think there are three implications for the design and use of models, all of
which go in the direction of pragmatic completeness.
i. It will often be important to place specific modeling of part of the socio-economic
system in the broader context of both system functioning and responses. This
will frequently have to be somewhat ad hoc, in the sense of linking household
impacts of a change in price or employment conditions to what is happening in
the overall drivers and responses of the crisis—as illustrated for the financial-
fiscal responses to emerging market financial cries. This assumes the goal is to
assess overall distributional eff ects of a crisis, as I believe should be part of any
technical input to crisis analysis. Sometimes, of course, the goal may be nar-
rower; for example, comparing alternative instruments to reach a more specific
objective, such as introducing price subsidies versus public works, or calculat-
ing the likely impact of specific policy interventions.
ii. In modeling strategy there may be opportunities to explore particular aspects
of heterogeneity and market context through imposition of alternative closures
or potential responses. I have not worked through this in detail, but here are
here a couple of intuitive examples. Alternative labor market closures could
be explored both with respect to the extent to which firms lay off workers, as
opposed to cuing hours and wages, and in terms of whether laid off workers
lead to higher open unemployment or reduced labor incomes in the informal
sector. And second-round household responses could be explored, in terms of
consumption, household labor allocation, and asset responses.
iii. The issue of the actual heterogeneity in impacts and responses should clearly
also be explored empirically. In particular this suggests high priority for look-
ing at historical episodes, in addition to new quick surveys (see World Bank,
2010a and 2010b). In either case the question is more about exploring any varia-
tion around an estimated paern, and seeing if this is related to any observ-
ables, or not.
These considerations maer because they have a bearing on the interpretation of ef-fects of shocks, with potentially large implications for policy. Each of the areas reviewed
has potential consequences for policy. Where there is unknown heterogeneity in house-
8/3/2019 Knowing When You Do Not Know
http://slidepdf.com/reader/full/knowing-when-you-do-not-know 52/76
World Bank Study38
hold impacts, there is a stronger case for self-targeting instruments—low-wage public
works or subsidies to inferior goods for example. If asset drawdowns are expected to be
significant, this can imply diff erent instruments, such as school-related grants (as used
in the response to the Indonesian 2008 financial crisis) or increased subsidies for use of
health services. Understanding the nature of labor market closure will also influence theinstrument mix, from supporting negotiations to reduce layoff s, to the mix of unemploy-
ment support and public works. And heterogeneity in conditions will generally support
the need for use of a family of instruments and associated monitoring. For example,
temporary increases in conditional cash transfers helps existing recipients, but not those
falling into poverty as a consequence of the crisis.
When Can Information Affect Government Behavior?
When can the results of modeling—or indeed any analysis—aff ect government behav-
ior? This is central to the approach under discussion here, since it is fundamentally mo-tivated by the goal of achieving beer outcomes for society in the wake of shocks. It is
not an academic exercise. So we are deeply within the domain of the role of information
in real decision-making, as it interacts with “technocratic” and political economy pro-
cesses. Practical technical analysis often has an implicit theory of change, and of how
information influences this. I think it is important to make this explicit.
Consider two kinds of case: where analysis can play a role under conditions of tech-
nocratic space, and where interests determine policy but information may influence po-
litical economy outcomes.
Technocratic Space
The implicit, or explicit, theory in much of the work here is of the political salience of
well-intentioned technocrats—a view that has pervaded much development policy
advice for decades. A strong version of this assumes the social welfare function of the
government is aligned with the analyst, but policy makers lack information on how to
achieve this. Suppose a government genuinely wants to provide support to those hurt
most by a crisis. This will be some function of the interaction between the size of house-
hold-specific shocks and their initial level of deprivation. Then an empirically informed
modeling approach—and even more one that embeds specific model-driven analysis
with a pragmatic treatment of systemic and second-round eff ects—can both provide
critical information on who should be targeted and on the likely effi
cacy of diff
erentpolicy instruments.
This view of the world may seem far from the reality of real government objectives,
influences, and political constraints. However, a weaker requirement is that some seg-
ment of policy making has these technocratic characteristics. Perhaps a government is
going to bail out rich bankers in any case, but still wants to allocate some resources to
compensate middle and poor households, and has a technocratic group with the man-
date to design an implementable approach.
Even in this technocratic case, I believe the analysis should go beyond the purely
technical. In particular it is valuable to make explicit the information-based theory of
change, and assess its realism. Here are three aspects of this.
i. Speci fic goals. What specific goals underpin the technocratic space? If they are
really to support a particular support base (laid-off formal workers, existing
8/3/2019 Knowing When You Do Not Know
http://slidepdf.com/reader/full/knowing-when-you-do-not-know 53/76
Knowing, When You Do Not Know 39
patronage networks in poor areas) that may diff er from a more general, dis-
tributionally weighted, social welfare function. At a more technical level, the
above phrase that weights will be “some function of the interaction between the
size of household-specific shocks and their initial level of deprivation” requires
resolution in the context of local social and political priorities.ii. Administrative feasibility. The feasibility, leakage, scope for corruption and likeli-
hood of local capture will both vary substantially across programs, and be quite
context-specific.
iii. Political constraints. Even a technical analysis needs to take account of political
constraints—indeed, the more these are incorporated, the more useful will the
technical analysis be.
Technical analysis, and exploration of optimal responses, can feed directly into
policy design in cases of technocratic space, but even here supposedly “non-technical”
considerations also intrude.Information and the Political Economy of Interests
A second category concerns the (more realistic) case in which political and economic in-
terests are salient, and diff er in the structure of influence from the social welfare function
of the analyst. Here the role of information, and modeling or other analysis, is diff erent:
it is about changing the political dynamic. And this requires a diff erent theory on the
role of information.
Two things are likely to be useful here.
First, to be relevant, analysis needs to map on to politically relevant interest groups.
Doing this systematically can itself be a useful exercise. In rich and poor societies alike,narratives over the beneficiaries of policy choices often have a weak relationship to real-
ity. In the United States there seems to be some obfuscation over who benefited from tax
cuts in the early 2000s: the discourse of “middle class” tax cuts hides the fact that the pri-
mary beneficiaries were the truly rich. In developing countries formal industrial workers
and public school teachers—in Mexico and India for example—are often characterized
as being amongst the relatively deprived. That may be true relative to the rich, but not to
the bulk of the population. As a final example, and as the discussion above illustrates, it
is important to bring in analysis of impacts on profits and holders of financial assets into
an integrated analysis.
Second, it is useful to have an explicit account, or theory, of how new informationmay influence political dynamics. This could work, for example, via the accountability
of politicians in a democracy: politicians depend, if via multiple and murky routes, on
support from the electorate. Beer information on the likely eff ects of policies could
provide incentives for diff erent behavior—for example, to provide more support for
budgets and designs that favor more deprived groups hurt by a crisis. Now this also
requires a strategy for making the new information salient, for example via civil society,
parliament, and media.
The theory and empirics of such channels of influence are an ongoing area of re-
search: for example Besley and Burgess (2002) provide an example of an empirical study
that finds that local newspaper density increases the responsiveness of local govern-ments to shocks. The point here is to explore hypotheses on how information can make
a diff erence and explicitly introduce this into practical designs and experiments. Where
8/3/2019 Knowing When You Do Not Know
http://slidepdf.com/reader/full/knowing-when-you-do-not-know 54/76
World Bank Study40
we are dealing with economy-wide shock this will typically not be via experiments us-
ing randomized controls trials (see Banerjee et al., 2009, for an example of the impact of
information on voting). But making explicit the hypothesized channels and influence,
and systematically tracking changes is still feasible.
Conclusion and a Note on the World Bank
The systematic analysis of the eff ects of shocks across households is of huge interest and
importance. An ex ante modeling approach, linking historical household information to
macroeconomic and sectoral analyses of the structure and dynamics the shock makes
a lot of sense, precisely because information on actual impacts typically comes with a
lag—and too late for timely policy responses. The methodology outlined in Chapter 1
is a valuable addition to this approach. This note has off ered two kinds of comments on
the approach.
First, I have highlighted the potential importance of both second-round eff
ects andchanges in parts of the socioeconomic system that fall outside the domain of the mod-
el. These may be large enough to substantially change the interpretation of aggregate
loss allocations and the distributional paern of vulnerability. How to deal with this
will vary from case to case, and can range from incorporation of second-round eff ects
into a model estimated from historical information, exploration of how alternative as-
sumptions on firm behavior or labor market closure aff ect simulations, or ensuring any
analysis takes at least ad hoc account of responses elsewhere—especially in thefinancial-
corporate-fiscal nexus. This can all make a diff erence to policy—either in choices over
specific sectoral designs (for example, in labor market, education or financial bailout
designs), or in shifting the emphasis to self-targeting mechanisms and an array of instru-ments to reach heterogeneous households.
Second, I have argued that technical analysis of the impact of shocks would benefit
from an explicit theory of how new information can make a diff erence in the specific
political economy of the case at hand. Sometimes a modeling approach will seamlessly
feed into a situation of technocratic space. Even here considerations of administrative
feasibility of alternative policy designs, and indeed political constraints, would be of
value. More generally, the approach could be useful structured into hypotheses on the
political economy of information, hypotheses that can be then assessed against the use
of modeling results—even when the intrinsically economy-wide features of aggregate
shocks preclude rigorous causal testing.A final question concerns the role of the World Bank—since this work was spon-
sored by the World Bank. Does this make sense? The general answer is absolutely yes:
the World Bank has technical expertise, and can in particular support the internalization
of externalities inherent in the development of technical approaches that are applicable
to many country seings, as well as facilitating cross-country learning. These issues form
part of the overall question of the political economy of information, and the comment on
making implicit theories of how information aff ects change applies with force to World
Bank analysis. Over time, the goal should be to both ensure useful technical approaches
are adopted in countries, in governments, think tanks and universities, and to support
direct communication across countries.There is, however, one apparent puzzle. The standard advice on the management
of shocks is to prepare for them in normal times. Analysis and action after a shock hits
8/3/2019 Knowing When You Do Not Know
http://slidepdf.com/reader/full/knowing-when-you-do-not-know 55/76
Knowing, When You Do Not Know 41
is likely to be late, fuzzy and (for policy) particularly susceptible to immediate political
influences. Yet the World Bank has been deeply engaged with the kinds of issues thrown
up the recent shocks in many previous episodes of shocks. Furthermore, the technique
of linking economy-wide changes to micro distributional analysis has been around for
many years, with World Bank research an important contributor to the approach (seeBourguignon et al., 2004). So why didn’t the World Bank itself invest in this kind of
approach in normal times, so that analyses could be quickly run out when new shocks
arrive? I think the answer lies with internal incentives and pressures. Countries find it
hard to develop policy instruments in “normal” times that can swiftly, or endogenously,
kick in when shocks occur. Similarly, World Bank policy analysis concentrates on non-
shock issues outside crisis periods. Of course real choices have to be made in relation
to pressing priorities. A potential solution involves exploring technical approaches that
are of value both in interpretation and policy design in “normal” times and in response
to major shocks. The question of the distributional eff ects of economy-wide or sectoral
developments have particular urgency when there are large, adverse shocks, but are
just as important for the analysis of slower-moving developments or the assessment of
idiosyncratic shocks.
8/3/2019 Knowing When You Do Not Know
http://slidepdf.com/reader/full/knowing-when-you-do-not-know 56/76
42
C H A P T E R 3
The Distributional Consequencesof the Economic and FinancialCrisis of 2008–09: A Comment
Danny Leipziger
Backdrop to the Issue of Distributional Consequences
In examining the impact of the recent economic and financial crisis on diff erent seg-
ments of the population, it is useful to start off with what we think we know, which is
that the distributional impacts of crises are generally regressive. Why? Because poor
people tend to have less savings. In the crisis of 2008–10, we can easily overlook distribu-
tional or microeconomic issues because the macroeconomic dilemmas are so stark and
outlook generally so worrisome. But this would be a mistake, since the impacts felt by
diff
erent parts of society are highly uneven and the measures governments have in placeto deal with distress are so imperfect.
The overall drop in national income and wealth in many parts of the developed
world has been acute. Joblessness has dramatically increased and is slow to recover. The
confluence of collapses in the markets for housing and the rest of the real economy com-
bined with shocks to equity markets and accompanying banking problems are events
not witnessed since the Great Depression. As a result, policy makers have been scram-
bling to find solutions and to rebuild confidence. This has put the spotlight on the big
picture, perhaps to the detriment of impacts on individual households and firms.
Thinking about the ProblemGovernment policies can be either progressive or regressive, based on who pays and
who benefits. Some examples of progressive policies are unemployment insurance or
targeted social programs; programs that we may think of as regressive include bank
bailouts and otherfinancial sector interventions that are of a systemic nature. The notion
of an entity “too big to fail” being saved by taxpayers sounds somewhat regressive in
nature.
My main point is that the impact on income distribution of a financial crisis depends
largely on the preexisting distribution. Everybody loses, but some lose more than others.
I am going to focus in the first instance on the United States. The reader may legitimately
wonder why we should worry about the United States, and what we have to learn from
the U.S. experience. I argue that, first of all, the United States still constitutes 25 percent
of global GDP, and what happens in the United States in terms of consumption, imports
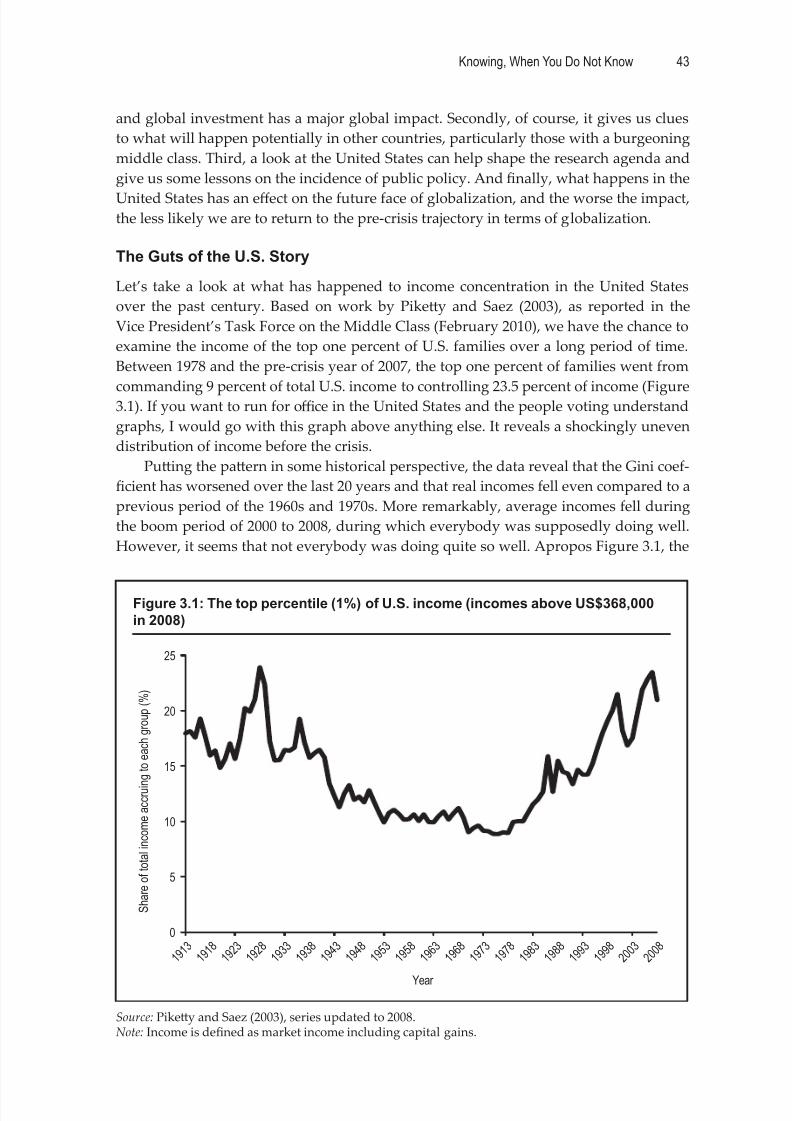
8/3/2019 Knowing When You Do Not Know
http://slidepdf.com/reader/full/knowing-when-you-do-not-know 57/76
Knowing, When You Do Not Know 43
and global investment has a major global impact. Secondly, of course, it gives us clues
to what will happen potentially in other countries, particularly those with a burgeoning
middle class. Third, a look at the United States can help shape the research agenda and
give us some lessons on the incidence of public policy. And finally, what happens in the
United States has an eff ect on the future face of globalization, and the worse the impact,the less likely we are to return to the pre-crisis trajectory in terms of globalization.
The Guts of the U.S. Story
Let’s take a look at what has happened to income concentration in the United States
over the past century. Based on work by Pikey and Saez (2003), as reported in the
Vice President’s Task Force on the Middle Class (February 2010), we have the chance to
examine the income of the top one percent of U.S. families over a long period of time.
Between 1978 and the pre-crisis year of 2007, the top one percent of families went from
commanding 9 percent of total U.S. income to controlling 23.5 percent of income (Figure3.1). If you want to run for offi ce in the United States and the people voting understand
graphs, I would go with this graph above anything else. It reveals a shockingly uneven
distribution of income before the crisis.
Puing the paern in some historical perspective, the data reveal that the Gini coef-
ficient has worsened over the last 20 years and that real incomes fell even compared to a
previous period of the 1960s and 1970s. More remarkably, average incomes fell during
the boom period of 2000 to 2008, during which everybody was supposedly doing well.
However, it seems that not everybody was doing quite so well. Apropos Figure 3.1, the
Figure 3.1: The top percentile (1%) of U.S. income (incomes above US$368,000in 2008)
Source: Pikey and Saez (2003), series updated to 2008.Note: Income is defined as market income including capital gains.
0
5
10
15
20
25
1 9 1 3
1 9 1 8
1 9 2 3
1 9 2 8
1 9 3 3
1 9 3 8
1 9 4 3
1 9 4 8
1 9 5 3
1 9 5 8
1 9 6 3
1 9 6 8
1 9 7 3
1 9 7 8
1 9 8 3
1 9 8 8
1 9 9 3
1 9 9 8
2 0 0 3
2 0 0 8
S h a r e o f t o t a l i n c o m e a c c r u i n g t o e a c h g r o u p ( % )
Year
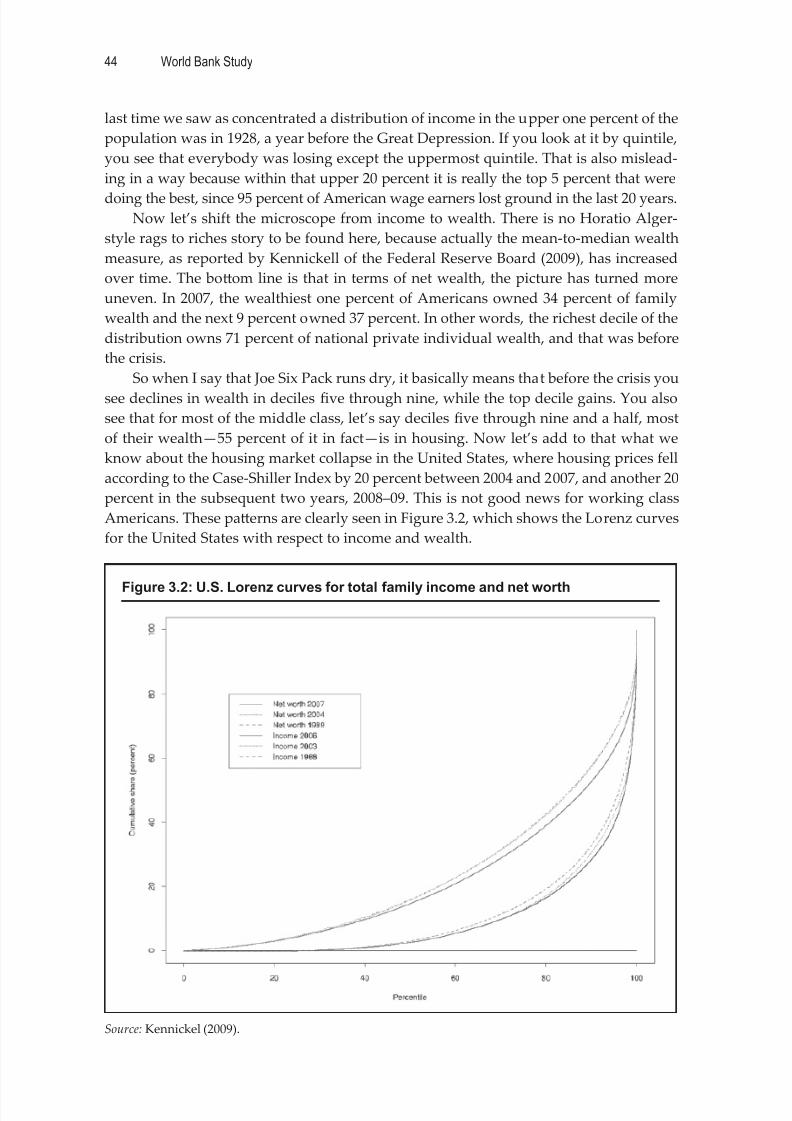
8/3/2019 Knowing When You Do Not Know
http://slidepdf.com/reader/full/knowing-when-you-do-not-know 58/76
World Bank Study44
last time we saw as concentrated a distribution of income in the upper one percent of the
population was in 1928, a year before the Great Depression. If you look at it by quintile,
you see that everybody was losing except the uppermost quintile. That is also mislead-
ing in a way because within that upper 20 percent it is really the top 5 percent that were
doing the best, since 95 percent of American wage earners lost ground in the last 20 years.Now let’s shift the microscope from income to wealth. There is no Horatio Alger-
style rags to riches story to be found here, because actually the mean-to-median wealth
measure, as reported by Kennickell of the Federal Reserve Board (2009), has increased
over time. The boom line is that in terms of net wealth, the picture has turned more
uneven. In 2007, the wealthiest one percent of Americans owned 34 percent of family
wealth and the next 9 percent owned 37 percent. In other words, the richest decile of the
distribution owns 71 percent of national private individual wealth, and that was before
the crisis.
So when I say that Joe Six Pack runs dry, it basically means that before the crisis you
see declines in wealth in deciles five through nine, while the top decile gains. You also
see that for most of the middle class, let’s say deciles five through nine and a half, most
of their wealth—55 percent of it in fact—is in housing. Now let’s add to that what we
know about the housing market collapse in the United States, where housing prices fell
according to the Case-Shiller Index by 20 percent between 2004 and 2007, and another 20
percent in the subsequent two years, 2008–09. This is not good news for working class
Americans. These paerns are clearly seen in Figure 3.2, which shows the Lorenz curves
for the United States with respect to income and wealth.
Figure 3.2: U.S. Lorenz curves for total family income and net worth
Source: Kennickel (2009).
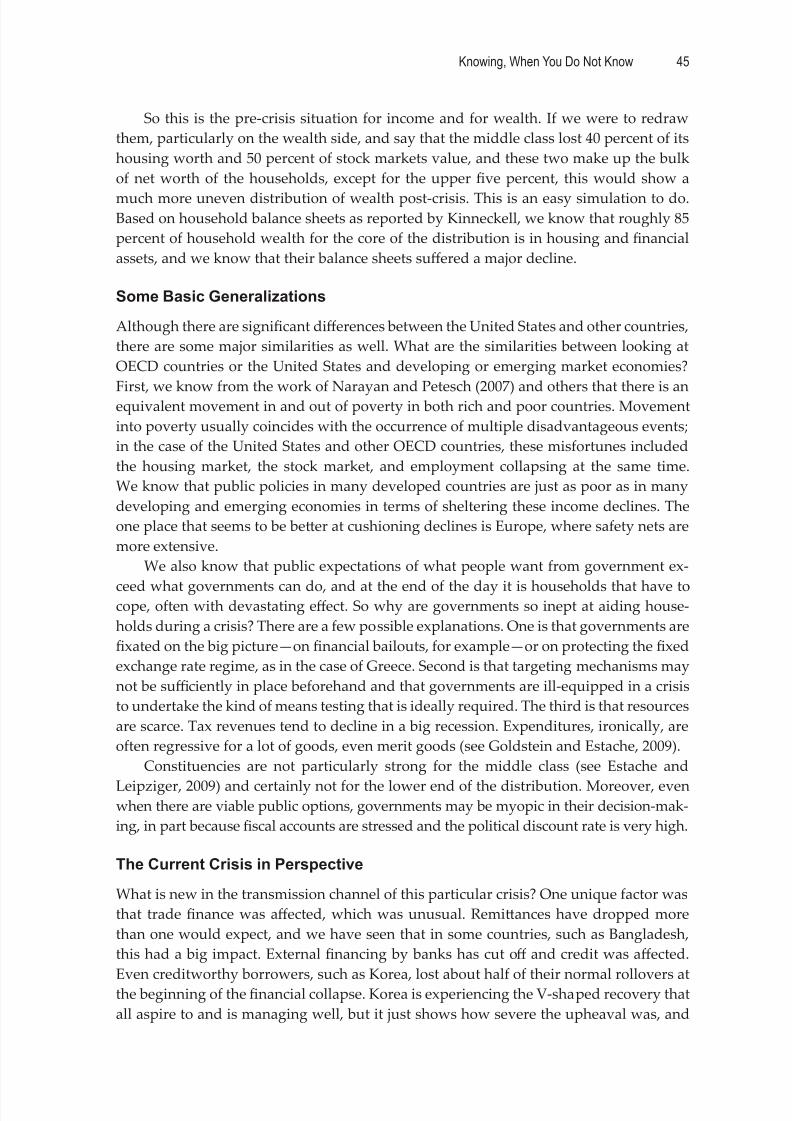
8/3/2019 Knowing When You Do Not Know
http://slidepdf.com/reader/full/knowing-when-you-do-not-know 59/76
Knowing, When You Do Not Know 45
So this is the pre-crisis situation for income and for wealth. If we were to redraw
them, particularly on the wealth side, and say that the middle class lost 40 percent of its
housing worth and 50 percent of stock markets value, and these two make up the bulk
of net worth of the households, except for the upper five percent, this would show a
much more uneven distribution of wealth post-crisis. This is an easy simulation to do.Based on household balance sheets as reported by Kinneckell, we know that roughly 85
percent of household wealth for the core of the distribution is in housing and financial
assets, and we know that their balance sheets suff ered a major decline.
Some Basic Generalizations
Although there are significant diff erences between the United States and other countries,
there are some major similarities as well. What are the similarities between looking at
OECD countries or the United States and developing or emerging market economies?
First, we know from the work of Narayan and Petesch (2007) and others that there is anequivalent movement in and out of poverty in both rich and poor countries. Movement
into poverty usually coincides with the occurrence of multiple disadvantageous events;
in the case of the United States and other OECD countries, these misfortunes included
the housing market, the stock market, and employment collapsing at the same time.
We know that public policies in many developed countries are just as poor as in many
developing and emerging economies in terms of sheltering these income declines. The
one place that seems to be beer at cushioning declines is Europe, where safety nets are
more extensive.
We also know that public expectations of what people want from government ex-
ceed what governments can do, and at the end of the day it is households that have tocope, often with devastating eff ect. So why are governments so inept at aiding house-
holds during a crisis? There are a few possible explanations. One is that governments are
fixated on the big picture—on financial bailouts, for example—or on protecting the fixed
exchange rate regime, as in the case of Greece. Second is that targeting mechanisms may
not be suffi ciently in place beforehand and that governments are ill-equipped in a crisis
to undertake the kind of means testing that is ideally required. The third is that resources
are scarce. Tax revenues tend to decline in a big recession. Expenditures, ironically, are
often regressive for a lot of goods, even merit goods (see Goldstein and Estache, 2009).
Constituencies are not particularly strong for the middle class (see Estache and
Leipziger, 2009) and certainly not for the lower end of the distribution. Moreover, evenwhen there are viable public options, governments may be myopic in their decision-mak-
ing, in part because fiscal accounts are stressed and the political discount rate is very high.
The Current Crisis in Perspective
What is new in the transmission channel of this particular crisis? One unique factor was
that trade finance was aff ected, which was unusual. Remiances have dropped more
than one would expect, and we have seen that in some countries, such as Bangladesh,
this had a big impact. External financing by banks has cut off and credit was aff ected.
Even creditworthy borrowers, such as Korea, lost about half of their normal rollovers atthe beginning of the financial collapse. Korea is experiencing the V-shaped recovery that
all aspire to and is managing well, but it just shows how severe the upheaval was, and
8/3/2019 Knowing When You Do Not Know
http://slidepdf.com/reader/full/knowing-when-you-do-not-know 60/76
World Bank Study46
how dramatically capital flows dried up. This had serious potential consequences for
firms, and in many emerging economies, public sector banks had to come to the rescue
of firms who could not access their normal international sources of credit.
If this happens at the aggregate level, what happens at the household level? That is
the focus of Chapter 1. It seems to me that the regional diff erences do occur with respectto what expenditures get cut first, whether it’s consumption or educations or health. But
household coping mechanisms involve reduced spending, and the primary develop-
ment issue is to trace the long-lasting impact of these coping mechanisms and also their
infra-familial paern.
Of course, the level of development maers. Normally, one might say that female
labor force participation can be a buff er, and we have seen in previous crises in Argen-
tina and other places where labor force participation rates for women suddenly rose. The
trouble is in a globalized downturn like the one recently experienced, it’s not a question
of joining labor force; it’s a question of who gets sacked first!
Household decisions on health and education obviously can have long-term eff ects
if they are not mitigated, and assistance is often faulty, particularly in a synchronized,
global downturn where fiscal resources are scarce and where the focus on the narrowly-
defined poor may not be the right policy. In this respect, Ravi Kanbur, who has wrien
on this, is correct (Kanbur, 2010). I think the leaky bucket analogy is more relevant in
a large, systemic crisis than it is normally—beer to imperfectly target than not to act,
especially given the linkages between earnings, consumption, and employment.
Results of Quick Post Crisis Surveys
We can learn quite a bit from the quick response surveys conducted by the Eastern Eu-rope and Central Asia (ECA) Region of the World Bank. In Turkey, for example, most of
the response to lower incomes is borne on the food side, where substitution or reduction
of foods seems to be the most immediate coping mechanism (Figure 3.3). The peck-
ing order in terms of what gets cut seems to be food and then health services and then
education, with the adjustments being predictably sharpest for the poorest. Additional
insights can be gleaned from the labor market in Turkey, where most of the job losses are
in the informal sector, more urban than rural (World Bank, 2010a).
Figure 3.3: Household coping strategies in Turkey (survey responses)
Source: World Bank, 2010a.
7365
6153
5048
43313030
2521
10
766
0 10 20 30 40 50 60 70 80
Substituted to cheaper food itemsSubstituted to cheaper non-food items
Decreased the use of entertainment servicesDecreased food consumption
Decreased social outings with friendsStopped buying some non-food items
Increased production of food for own consumptionIncreased the use of public transportation or walking
Reduced the use of information services (newspaper, internet)Reduced sports activities
Reduced visits to the doctor for preventative medical controlReduced the use of health services
Dropped out of courses studying language, computers, etc.
Sent a member of the hhd to find seasonal employmentTransferred children from private to public schoolWithdrew/postponed admission to school, college, or kindergarten
Percent of households
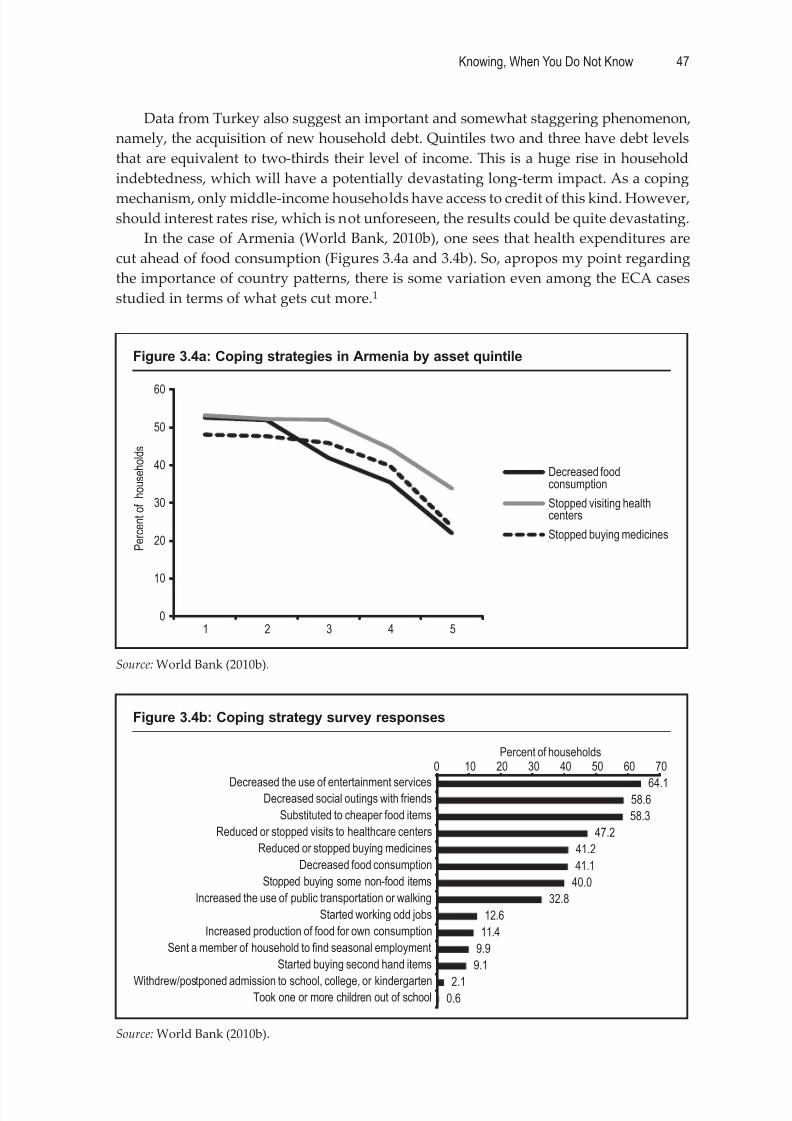
8/3/2019 Knowing When You Do Not Know
http://slidepdf.com/reader/full/knowing-when-you-do-not-know 61/76
Knowing, When You Do Not Know 47
Data from Turkey also suggest an important and somewhat staggering phenomenon,
namely, the acquisition of new household debt. Quintiles two and three have debt levels
that are equivalent to two-thirds their level of income. This is a huge rise in household
indebtedness, which will have a potentially devastating long-term impact. As a coping
mechanism, only middle-income households have access to credit of this kind. However,should interest rates rise, which is not unforeseen, the results could be quite devastating.
In the case of Armenia (World Bank, 2010b), one sees that health expenditures are
cut ahead of food consumption (Figures 3.4a and 3.4b). So, apropos my point regarding
the importance of country paerns, there is some variation even among the ECA cases
studied in terms of what gets cut more.1
Figure 3.4a: Coping strategies in Armenia by asset quintile
Source: World Bank (2010b).
0
10
20
30
40
50
60
1 2 3 4 5
P e r c e n t o f h o u s e h o l d s
Decreased foodconsumption
Stopped visiting healthcenters
Stopped buying medicines
Figure 3.4b: Coping strategy survey responses
Source: World Bank (2010b).
64.158.6
58.3
47.2
41.2
41.1
40.0
32.8
12.6
11.4
9.9
9.1
2.10.6
0 10 20 30 40 50 60 70
Decreased the use of entertainment servicesDecreased social outings with friends
Substituted to cheaper food items
Reduced or stopped visits to healthcare centers
Reduced or stopped buying medicines
Decreased food consumption
Stopped buying some non-food items
Increased the use of public transportation or walking
Started working odd jobs
Increased production of food for own consumption
Sent a member of household to find seasonal employment
Started buying second hand items
Withdrew/postponed admission to school, college, or kindergartenTook one or more children out of school
Percent of households
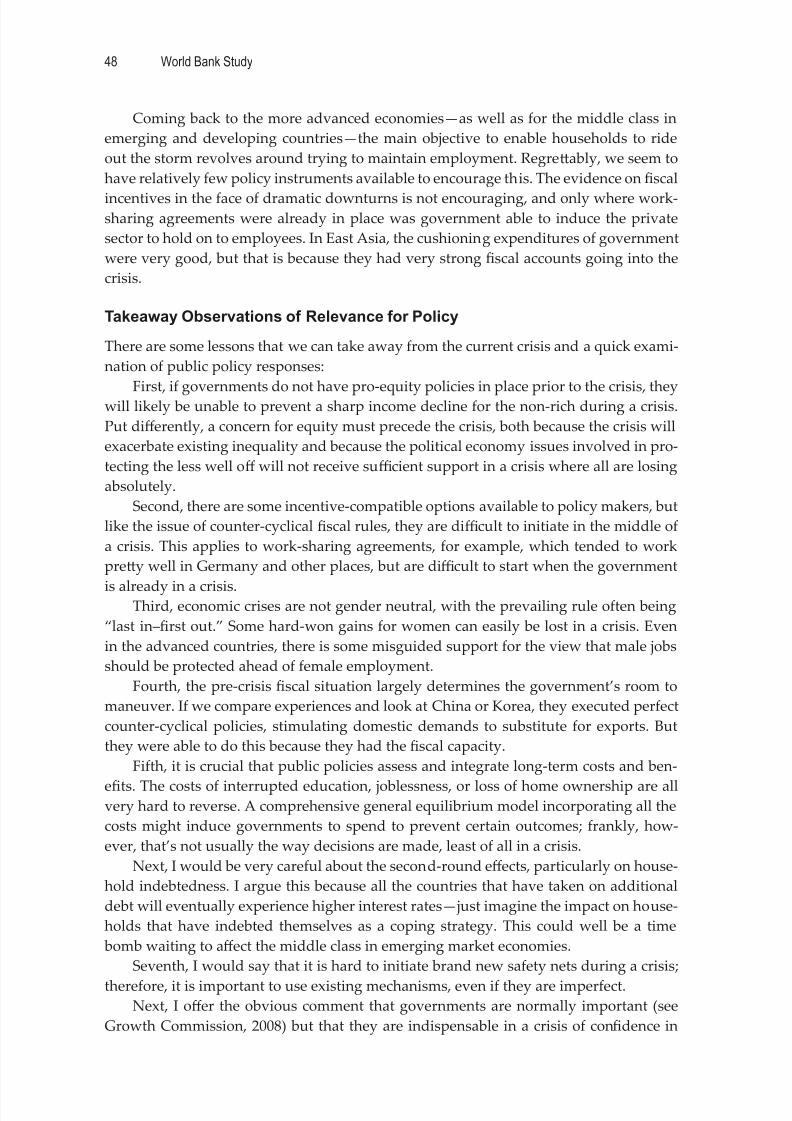
8/3/2019 Knowing When You Do Not Know
http://slidepdf.com/reader/full/knowing-when-you-do-not-know 62/76
World Bank Study48
Coming back to the more advanced economies—as well as for the middle class in
emerging and developing countries—the main objective to enable households to ride
out the storm revolves around trying to maintain employment. Regreably, we seem to
have relatively few policy instruments available to encourage this. The evidence onfiscal
incentives in the face of dramatic downturns is not encouraging, and only where work-sharing agreements were already in place was government able to induce the private
sector to hold on to employees. In East Asia, the cushioning expenditures of government
were very good, but that is because they had very strong fiscal accounts going into the
crisis.
Takeaway Observations of Relevance for Policy
There are some lessons that we can take away from the current crisis and a quick exami-
nation of public policy responses:
First, if governments do not have pro-equity policies in place prior to the crisis, theywill likely be unable to prevent a sharp income decline for the non-rich during a crisis.
Put diff erently, a concern for equity must precede the crisis, both because the crisis will
exacerbate existing inequality and because the political economy issues involved in pro-
tecting the less well off will not receive suffi cient support in a crisis where all are losing
absolutely.
Second, there are some incentive-compatible options available to policy makers, but
like the issue of counter-cyclical fiscal rules, they are diffi cult to initiate in the middle of
a crisis. This applies to work-sharing agreements, for example, which tended to work
prey well in Germany and other places, but are diffi cult to start when the government
is already in a crisis.Third, economic crises are not gender neutral, with the prevailing rule often being
“last in–first out.” Some hard-won gains for women can easily be lost in a crisis. Even
in the advanced countries, there is some misguided support for the view that male jobs
should be protected ahead of female employment.
Fourth, the pre-crisis fiscal situation largely determines the government’s room to
maneuver. If we compare experiences and look at China or Korea, they executed perfect
counter-cyclical policies, stimulating domestic demands to substitute for exports. But
they were able to do this because they had the fiscal capacity.
Fifth, it is crucial that public policies assess and integrate long-term costs and ben-
efits. The costs of interrupted education, joblessness, or loss of home ownership are allvery hard to reverse. A comprehensive general equilibrium model incorporating all the
costs might induce governments to spend to prevent certain outcomes; frankly, how-
ever, that’s not usually the way decisions are made, least of all in a crisis.
Next, I would be very careful about the second-round eff ects, particularly on house-
hold indebtedness. I argue this because all the countries that have taken on additional
debt will eventually experience higher interest rates—just imagine the impact on house-
holds that have indebted themselves as a coping strategy. This could well be a time
bomb waiting to aff ect the middle class in emerging market economies.
Seventh, I would say that it is hard to initiate brand new safety nets during a crisis;
therefore, it is important to use existing mechanisms, even if they are imperfect.Next, I off er the obvious comment that governments are normally important (see
Growth Commission, 2008) but that they are indispensable in a crisis of confidence in
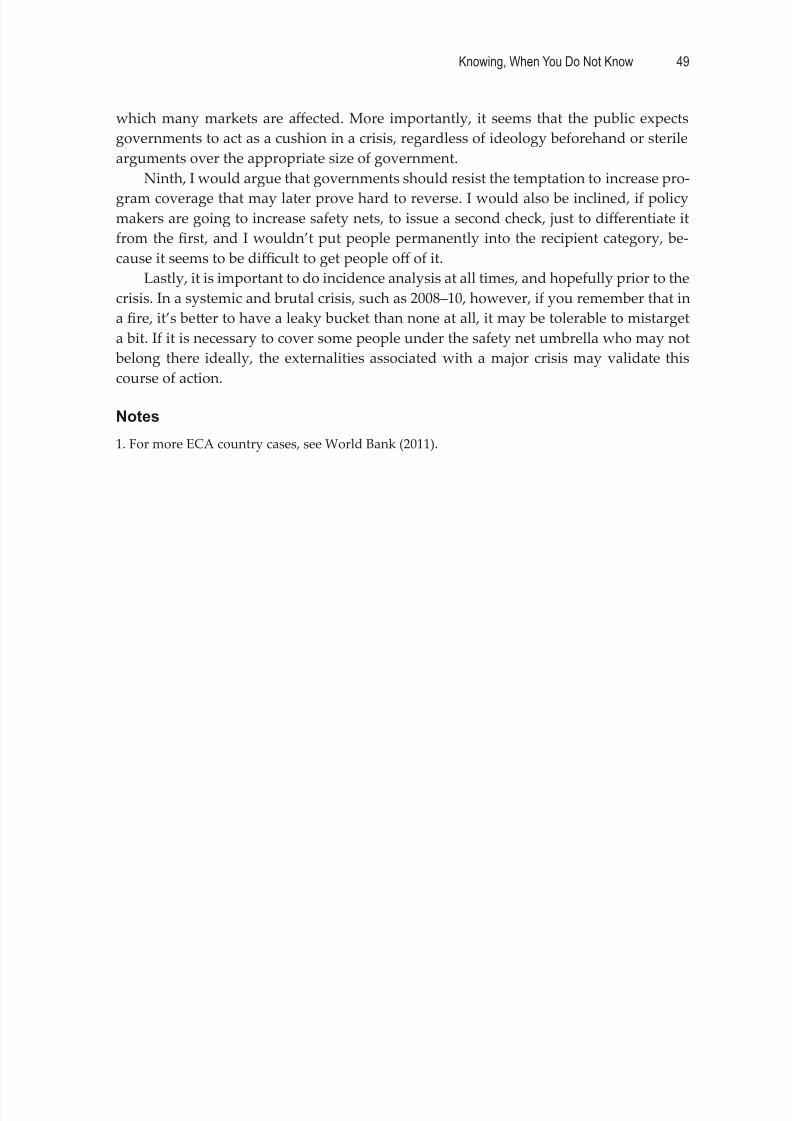
8/3/2019 Knowing When You Do Not Know
http://slidepdf.com/reader/full/knowing-when-you-do-not-know 63/76
Knowing, When You Do Not Know 49
which many markets are aff ected. More importantly, it seems that the public expects
governments to act as a cushion in a crisis, regardless of ideology beforehand or sterile
arguments over the appropriate size of government.
Ninth, I would argue that governments should resist the temptation to increase pro-
gram coverage that may later prove hard to reverse. I would also be inclined, if policymakers are going to increase safety nets, to issue a second check, just to diff erentiate it
from the first, and I wouldn’t put people permanently into the recipient category, be-
cause it seems to be diffi cult to get people off of it.
Lastly, it is important to do incidence analysis at all times, and hopefully prior to the
crisis. In a systemic and brutal crisis, such as 2008–10, however, if you remember that in
a fire, it’s beer to have a leaky bucket than none at all, it may be tolerable to mistarget
a bit. If it is necessary to cover some people under the safety net umbrella who may not
belong there ideally, the externalities associated with a major crisis may validate this
course of action.
Notes
1. For more ECA country cases, see World Bank (2011).
8/3/2019 Knowing When You Do Not Know
http://slidepdf.com/reader/full/knowing-when-you-do-not-know 64/76
50
C H A P T E R 4
Stress Testing for the PovertyImpacts of the Next Crisis
Ravi Kanbur
IntroductionIn a presentation to the World Bank’s Executive Board in July 2009, at the height of the
present global financial crisis, I argued that we have to prepare ourselves for the next
crisis and its impact on the poor, even though we do not know when the next crisis will
strike and what its precise impacts will be (see Kanbur 2009a, Kanbur 2009b, and Kan-
bur 2010). I proposed three stages of systematic preparation at the country level. First, a
program of assessment, which “stress tests” the social protection system against a range
of crises, to identify gaps and weaknesses, analogous to the role that the Financial Sector
Assessment Program plays in stress testing the financial system. Second, a medium-term
program of financing improvements in social protection programs, now viewed as a sys-
tem, to close gaps and address weaknesses. Third, a pre-qualified line of assistance for
social protection, which would be available to a country immediately when previously
agreed upon crisis triggers are breached.
These three steps are somewhat diff erent in nature and require diff erent types of
fora for discussion and debate. The third step has to be formulated in the context of
overall development financing, and indeed a permanent “Crisis Response Window”
was discussed in the context of the IDA16 replenishment. The second step comes close
to “normal business” for donor agencies, although there are issues about the extent to
which funding of precautionary investments, for a crisis sometime in the future, will be
aractive (to donors and recipients) relative to expenditures with immediate impact.
However, both of these steps build upon, and depend upon, the first step: a solid assess-
ment of how the collection of social protection programs as currently constituted would
or would not respond to protect the poor in the face of a range of crises. The set of papers
presented at the World Bank workshop on simulating the impacts of crisis is an excellent
contribution to this eff ort. In this note I will briefly discuss why the eff ort is important,
and then consider some of the specifics of the analysis.
The Need for a Social Protection Assessment Program (SPAP)
The present global financial crisis will pass. But crises are here to stay. By a crisis I mean
a macro-level shock over which the country itself has no control, but which aff ects eco-nomic wellbeing in the country. A crisis worth the label will have a dramatic negative
impact on per capita income. But the precise impact on the paern of incomes and well-
8/3/2019 Knowing When You Do Not Know
http://slidepdf.com/reader/full/knowing-when-you-do-not-know 65/76
Knowing, When You Do Not Know 51
being will depend on the precise origin and nature of the crisis. Developing countries
are likely to face many such sources—natural climatic disasters, sudden emergence and
spread of an infectious disease, unrest in a neighboring country with possible flow of
refugees, collapse of demand in a particular industry (such as tourism as a result of
real or perceived terrorism threats, or sudden shifts in fashion in apparel), or the conse-quences of a global financial crisis. Each of these headings in turn covers many specific
possibilities. For example, the financial crisis of 1997 is recognized to have been quite
diff erent in nature and impact from the crisis that began in 2007–08. Furthermore, for a
given country, particularly a small country, a global crisis can have very diff erent impact
depending on the (unpredictable) reactions of its large neighbors or trading partners.
Each of the diff erent types of crises will have very diff erent types of impact on the
poor in diff erent countries, depending again on the details of economic structure in that
country. Added to the uncertainty of crisis type is uncertainty of crisis timing—timing of
the onset of the crisis, and timing of when it recedes (the laer depending on uncertain
policy responses).
I have argued that these twin uncertainties—of crisis type and crisis timing—should
frame the development of an ex ante strategy for protecting the poor. We should examine
how the current social protection programs, viewed as a system, would respond to the
needs created by crises of diff erent types. We should “stress test” the system to identify
vulnerabilities and gaps in (i) coverage and (ii) flexibility and speed of response. Such
a comprehensive assessment would be a Social Protection Assessment Program (SPAP),
corresponding to the Financial Sector Assessment Program (FSAP). I would now like to
review the workshop presentations with this objective in mind.
An Overview of the Workshop Papers and Presentations
The papers and presentations at the World Bank Workshop on Distributional Impacts of
the Crisis represent an important contribution to our understanding of crises, their im-
pacts on the poor, and how social protection programs can and have responded. Chapter
1 in this volume summarizes the overall approach described there.
The first step is to model the crisis itself and its macro impacts on the economy. This
requires a careful enumeration, elaboration, and discussion of the transmission mecha-
nisms. The exercise has to be country specific, and will involve a fair amount of judg-
ment, for example on assumptions made about near neighbors’ policy responses, which
in turn can influence macro outcomes for the country. From these would come variousmacroeconomic projections—overall and sectoral growth, inflation in general and in its
major components such as food and fuel, exchange rate, international remiances, and
so forth Building on these would come projections of employment and unemployment.
A key method for translating these macro projections to the household level are esti-
mated models of labor force status and Mincerian wage equations, and assumptions that
allocate international and domestic remiances across households.
With the above procedure and a base household survey, one can project the dis-
tributional impact of the crisis being modeled. Poverty calculations can then be done
assuming that the expenditure-to-income ratio stays constant. Impacts across the distri-
bution can be shown using growth incidence curves and other methods. Who is likely to become poor, in terms of household characteristics, can thus be identified.
8/3/2019 Knowing When You Do Not Know
http://slidepdf.com/reader/full/knowing-when-you-do-not-know 66/76
World Bank Study52
The general approach is then applied to a number of countries for scenarios match-
ing the impact of the global financial crisis. The results are intuitive, but interesting and
of relevance for policy. Poverty rises but there is not much of an impact on overall in-
equality. The new poor tend to be diff erent from those who were poor before the crisis—
in other words, the crisis impacts specific sections of the population. And the impacts areparticularly concentrated in the middle of the income distribution.
An Assessment, and What’s Missing
The above is a broad summary of the methodology outlined in Chapter 1. Of course
there is much greater detail in the specific papers, and there is a rich weaving together
of country-specific institutional factors. But the overall approach and method should be
clear. While one can of course have specific comments and criticisms of the individual
country studies, or one or more of the components described above, my overall assess-
ment is that this is an excellent start in the direction of what I have in mind, namelypreparing ourselves for protecting the poor against the next crisis.
The authors of the studies and overall summary are of course themselves aware
of the limitations—the level of disaggregation depends on availability of macro projec-
tions; various structural relationships are assumed to remain unchanged; no factor mo-
bility; share of profits remains constant; and so forth. But moving in this direction would
require a full-fledged general equilibrium model of the economy, the construction and
operation of which would require its own assumptions and make its own data demands.
In my view, for the task at hand this project has struck the right balance between
fine detailed modeling of economic relationships and interactions, and the need to get
to concrete results with the data available. I would like to suggest, however, that eff ortshould go further developing a number of missing elements that are central to providing
a complete picture of impacts on the poor.
There is a strong focus on labor market status and labor income. Other sources of
income are not treated with the same degree of careful aention. This may be accept-
able in economies where labor income is the dominant source of income for the poor,
such as in transition economies of Eastern and Central Europe, but for economies where
small holder agriculture is significant, specific eff ort will have to go into modeling the
farm and non-farm production activities of the household. I would see this as an issue in
the Bangladesh case, for example. It may well be that the financial crisis, which was the
focus of this project, transmits its impacts mainly through labor markets in the manu-facturing sector. But for crises in general, models should have the capacity to build in
transmission mechanisms that aff ect farm incomes and incomes from non-farm artisanal
activities. For example, the impact of climate-driven crises will certainly have this as a
major transmission mechanism.
I would like to use the above to make two further, more general, points. There is a
strategic choice between how general our model should be—whether the base model
should be able to capture a range of diff erent types of crises, or whether the model-
ing itself should be done crisis by crisis. While a final answer to this will have to wait
for the results of trial and error, my initial position is that for a capacity to do ex ante
assessments of crises as a category, we perhaps need a broader range of transmissionmechanisms built in to the modeling, even if we decide to switch some of them off for
8/3/2019 Knowing When You Do Not Know
http://slidepdf.com/reader/full/knowing-when-you-do-not-know 67/76
Knowing, When You Do Not Know 53
specific simulations. In any event, what should be resisted is the notion that the same set
of transmission mechanisms can be translated across crises.
My second point relates to the role of income in this analysis. The sources of house-
hold income are crucial in following through the macro transmission mechanisms down
to the level of poor households. And yet, it might be argued with some justification thatwe give more importance in our household surveys to the expenditure side of informa-
tion gathering. This flows from our natural concern with measuring poverty, and from
the broad consensus that expenditure data are the best for this task. But the impacts of
crises, and indeed of any major macro change on poverty, whether short term or long
term, passes through income. We need to be able to allocate macro-level shifts in income
composition, by sector and by factor, down to the household level. For this we need a de-
tailed account of the sources of household income in our household surveys. I would ar-
gue that this aspect is underemphasized in household income and expenditure surveys,
particularly for agrarian economies. With given survey resources, the balance between
emphasis on the expenditure modules and the income, employment, and activity mod-
ules is a diffi cult one to assess. But the line of work in these papers, and the line of work
that would be needed to get a handle on the impact of crises on the poor, argues for more
weight than is currently given to modules that help to pin down the sources of income.
A central aspect of my proposed “stress testing” of the social protection system,
in the face of diff erent types of crises, is the need to model how individual protection
programs will respond to diff erent impacts of the crisis, transmied through diff erent
mechanisms that are country and crisis-specific. This is done to some extent in the Po-
land study (Habib et al, 2010d) for unemployment insurance, but I would like to argue
that this aspect is not as well developed in this approach as it should be.
What is it that needs to be done? For each country, we first of all need an inven-
tory of the major social protection programs and, very important, their rules of opera-
tion. The most obvious programs for the “employment/unemployment” focus of this
approach are of course unemployment benefit programs, and this is what is done for
example in the Poland study. Thus when the crisis is simulated, and its unemployment
eff ects are projected, the income impacts follow from the wage equations, but the net in-
come impacts—that is to say net of unemployment benefits—need to be simulated based
on the rules of unemployment benefit in that particular country.
But unemployment benefits are only one of a myriad of programs whose rules will,
in principle, aff
ectfl
ows of public resources to households when a crisis hits. Thus, forexample, conditional cash transfer programs have specific rules of eligibility, sometimes
based on assessed household income. If the crisis leads to a dramatic fall in the incomes
of some categories of households, and the eligibility assessment happens soon after the
crisis hits, then these households will start receiving cash transfers. Although the logic
of the program may have lile to do with crisis support—it may instead be to do with
incentivizing behaviors such as keeping children in school, or early health checks—in
its operation it in eff ect becomes crisis support, and needs to be incorporated into the
analysis. If these programs were small then perhaps they could be ignored. But some of
these programs are very large in some countries—Progresa-Oportunidades in Mexico
or the National Rural Employment Guarantee Act in India, for example. And even ifindividual programs are small, if collectively they represent significant injection to poor
8/3/2019 Knowing When You Do Not Know
http://slidepdf.com/reader/full/knowing-when-you-do-not-know 68/76
World Bank Study54
households, then they need to be incorporated systematically into the analysis of the
possible impacts of crises on the poor.
The above perspective requires that household surveys capture flows to households
from social programs, distinguished by program in some detail. This is yet another di-
mension of the importance of having a detailed accounting of the sources of householdincome—market and non-market. The extent of detail available is likely to vary from
country to country. The best is if the actual cash flow from diff erent programs is ac-
counted for. If this is not available, but there is information on whether the household
participates or not, this could be used to develop assumptions on how the total outlay of
the program (which we would get from national level administrative data) could be al-
located across households as a baseline—in the same way that international remiances
were allocated in the current project. In any event, what is important is that we do de-
velop such a baseline where the monetary benefits of major social protection programs
are allocated across households.
There are two further issues that I want to raise on this theme of social protection
programs in crises. First, there are programs that make a contribution in kind, not cash.
Free food, or subsidized food from ration shops, is the leading example, but there are
others such as excusing school fees or paying for school uniforms, and so forth. There
is of course a monetary equivalent of these in-kind transfers, and if these transfers to
households change as program rules dictate when the crisis hits, then they should in
principle be incorporated into the analysis.
The second issue is an important one, but diffi cult to address in practice. Of course,
from the program rules of eligibility we can identify households that would fall into
the program after the crisis hits, or specify the change in benefits of households already
enrolled in the program. But this is the de jure analysis. In reality, whether the program
delivers on the benefits depends on the budgetary allocations made to it. A good ex-
ample of this is an “employment guarantee” scheme. In these programs, employment
is supposedly guaranteed at a given wage (usually the local minimum wage) to all who
turn up to the public works site. Thus, when the transmission mechanisms translate the
crisis into employment losses and sharp wage declines, the number of people show-
ing up at the public works site goes up. But will they be hired? The answer depends of
course on whether the budget will rise pari passu. If it does not, there will be rationing
of employment. For the domestic political economy, this raises the question of whether
such budgetary allocations can indeed be guaranteed. In India, the National Rural Em-ployment Guarantee Act provides a justifiable guarantee, an example of the polity trying
to tie its own hands behind its back. For analysts, however, the above scenario requires
that a judgment has to be made on whether or not budgets will indeed be increased to
convert de jure rules into de facto outcomes. Of course, once the machinery for simula-
tions is set up, we can simulate the impact of diff erent levels of budgetary provisions, if
we are willing to model how the rationing is implemented.
All of the above is in relation to identifying needs, gaps, and vulnerabilities as a
range of crises materializes. But recall that there are two types of uncertainties—un-
certainty of crisis type and uncertainty of crisis timing. The second type of uncertainty
also raises issues for policy. In particular, it requires us to focus not so much on the exante comprehensiveness of the system of social protection programs, but on their flexibility.
And this flexibility has two aspects—rapid response in scaling up programs when the
8/3/2019 Knowing When You Do Not Know
http://slidepdf.com/reader/full/knowing-when-you-do-not-know 69/76
Knowing, When You Do Not Know 55
crisis strikes, and equally rapid scaling down when the crisis passes. In a sense we have
already touched on the first—the question of budgetary resource availability can be re-
lated to the speed with which budgets can be increased. But we have not as yet discussed
flexibility in the other direction, and this requires us to discuss what happens when the
crisis passes—which microsimulation studies do not analyze.To illustrate the issues that arise, let us compare food and fuel subsidies with em-
ployment guarantee schemes. On the scaling up side, the first has relatively easy flexibil-
ity both in technical terms (for example, simply reintroducing pass-through provisions
for global fuel prices into domestic fuel prices) and in terms of political economy (gen-
eralized subsidies will have greater political support than employment schemes, which
benefit only the poorest). When the crisis passes, however, the ranking is reversed. As
employment and wages pick up after the crisis, public works rolls will presumably sim-
ply melt away as workers move to beer opportunities in the rest of the economy. But
once generalized subsidies are increased, it is very diffi cult politically to reduce them—
for the very reason that the constituency that benefits from them is much larger.
The general point I am making is that an assessment of how well a social protection
system does in the face of a crisis is incomplete without an assessment of what is left
behind when the crisis passes. A full assessment will allow us to beer design ex ante
programs that, as a collectivity, are comprehensive and flexible, and flexible moreover
in both directions.
Conclusion
To conclude, I have looked at the current body of microsimulation crisis forecasting
(as exemplified in Chapter 1) through a particular lens—whether it contributes towardspreparing to protect the poor against the next crisis. I believe these studies represent an
excellent step in this direction, and any further work should and indeed will have to
use them as a starting point. But future work will also need to extend and elaborate the
analyses in a number of directions, including diff erent types of crises, sources of market
income, sources of non-market income, and the operation of a full range of social protec-
tion programs when crises hit and when crises recede.
8/3/2019 Knowing When You Do Not Know
http://slidepdf.com/reader/full/knowing-when-you-do-not-know 70/76
56
ReferencesAran, M., M. Azam, M. I. Ajwad, and J. Hentschel (2010). “A Methodology Note on the
Employment and Welfare Impacts of the 2007–08 Financial Crisis.” Draft. World
Bank, Washington, DC.
Banerjee, A., D. Green, J. Green, and R. Pande (2010). “Can Voters be Primed to Choose
Beer Legislators? Evidence from Voter Campaigns in India.” Processed. World
Bank, Washington, DC.
Beach, Ch. (1989). “Dollars and Dreams: A Reduced Middle Class? Alternative Explana-
tions”, Journal of Human Resources 24: 162–193.
Besley, T., and R. Burgess (2002). “The Political Economy of Government Responsive-
ness: Theory and Evidence from India.” Quarterly Journal of Economics 117(4):
1415–1451.
Blackburn, M., and D. Bloom (1987). “Earnings and Income Inequality in the United
States.” Population Development Review 13(4): 575–609.
Bourguignon, F., M. Bussolo, and L. Pereira da Silva (2008). “Introduction: Evaluating
the Impact of Macroeconomic Policies on Poverty and Income Distribution.” In
The Impact of Macroeconomic Policies on Poverty and Income Distribution , eds. Bour-
guinon, F., Bussolo, M. and Pereira da Silva, L. Washington, DC: World Bank.
Bourguignon, F., F. Ferreira, and N. Lustig (2004). The Microeconomics of Income Distribu-
tion Dynamics in East Asia and Latin America. New York: Oxford University Press
for the World Bank.
Bourguignon, F., A. S. Robilliard, and S. Robinson (2005). “Representative versus Real
Households in the Macroeconomic Modeling of Inequality.” In Frontiers in Applied
General Equilibrium Modeling: in honor of Herbert Scarf , eds. Kehoe, T.J., Srinivasan,
T.N. and Whalley, J. Cambridge, UK: Cambridge University Press.
Burkhauser, R., A. Crews, A. Daly, and S. Jenkins (1999). “Testing the Significance of
Income Distribution Changes Over the 1980s Business Cycle: A Cross-national
Comparison.” Journal of Applied Econometrics 14: 253–272.Bussolo, M., J. Lay, D. Medvedev, and D. van der Mensbrugghe (2008). “Trade Options
for Latin America: A Poverty Assessment Using a Top-Down Macro-Micro Mod-
eling Framework.” In The Impact of Macroeconomic Policies on Poverty and Income
Distribution , eds. Bourguinon, F., M. Bussolo, and L. Pereira da Silva. Washington,
DC: World Bank.
Chen, S., and M. Ravallion (2009). “The Impact of the Global Financial Crisis on the
World’s Poorest.” VOXeu note. April 30, 2009. Available at: hp://www.voxeu.
org/index.php?q=node/3520.
Cho, Y., and D. Newhouse (2010). “How Did the Great Recession Aff ect Diff erent Types
of Workers? Evidence from 17 Middle-Income Countries.” Social Protection andLabor team. World Bank, Washington, DC.
8/3/2019 Knowing When You Do Not Know
http://slidepdf.com/reader/full/knowing-when-you-do-not-know 71/76
Knowing, When You Do Not Know 57
Diwan, I. (2001). “Debt as Sweat: Labor, Financial Crisis, and the Globalization of Capi-
tal.” World Bank. Washington, DC. Available at: hp://info.worldbank.org/etools/
docs/voddocs/150/332/diwan.pdf.
Estache, A., and D. Leipziger, eds. (2009). Stuck in the Middle: Is Fiscal Policy Failing the
Middle Class? Washington, DC: Brookings Institution Press.Ferreira, F., P. Leite, L. Pereira da Silva, and P. Picchei (2008). “Can the Distributional
Impacts of Macroeconomic Shocks Be Predicted? A Comparison on Top-Down
Macro-Micro Models with Historical Data for Brazil.” In The Impact of Macroeco-
nomic Policies on Poverty and Income Distribution , eds. Bourguinon, F., M. Bussolo,
and L. Pereira da Silva. Washington, DC: World Bank.
Friedman, J., and J. Levinsohn (2002). “The Distributional Impacts of Indonesia’s Finan-
cial Crisis on Household Welfare: A ‘Rapid Response’ Methodology.” World Bank
Economic Review 16(3): 397–423.
Ganuza, E., S. Morley, S. Robinson, V. Piñeiro, and R. Vos (2006). “Are Export Promotion
and Trade Liberalization Good for Latin America’s Poor? A Comparative Macro-
Micro CGE Analysis.” In Who Gains from Free Trade? Export-led Growth, Income
Distribution and Poverty in Latin America , eds. Vos, R., E. Ganuza, S. Morley and S.
Robinson. Massachuses: Edward Elgar Publishing.
Ganuza, E., R. Paes de Barros, and R. Vos (2002). “Labour Market Adjustment, Poverty
and Inequality during Liberalization.” In Economic Liberalization, Distribution and
Poverty: Latin America in the 1990s , eds. Vos, R., L. Taylor, and R. Paes de Barros.
Massachuses: Edward Elgar Publishing.
Goldstein, M., and A. Estache (2008). “The Scope and Limits of Subsidies.” In Stuck in the
Middle: Is Fiscal Policy Failing the Middle Class? , eds. Estache. A. and D. Leipziger.
Washington, DC: World Bank.
Growth Commission (2008). The Growth Report: Strategies for Sustained Growth and Inclu-
sive Development. Washington, DC: World Bank.
Habib, B., A. Narayan, S. Olivieri, and C. Sanchez-Paramo (2010a). “Assessing Ex Ante
the Poverty and Distributional Impact of the Global Crisis in a Developing Coun-
try: A Microsimulation Approach with Application to Bangladesh.” Policy Re-
search Working Paper 5238. World Bank, Washington, DC.
——— (2010b). “Assessing Poverty and Distributional Impacts of the Global Crisis in the
Philippines: A Microsimulation Approach.” Policy Research Working Paper 5286.
World Bank, Washington, DC.——— (2010c). “The Impact of the Financial Crisis on Poverty and Income Distribu-
tion: Insights from Simulations in Selected Countries.” PREM Economic Premise
7. World Bank, Washington, DC.
——— (2010d). “Employment, Poverty and Distributional Impacts of the Crisis in Po-
land: Brief Overview of Results from Microsimulation Exercises.” World Bank,
Washington, DC.
Halac, M., and S. L. Schmukler (2004). “Distributional Eff ects of Crises: The Financial
Channel.” Economía: Journal of the Latin American and Caribbean Economic Associa-
tion 5(1): 1–51.
Hallward-Driemeier, M., B. Rijkers, and A. Waxman (2010). “Women in Crisis: Firmlevel Evidence on the Labor Market Impacts of the Indonesian Crisis.” Mimeo.
World Bank, Washington, DC.
8/3/2019 Knowing When You Do Not Know
http://slidepdf.com/reader/full/knowing-when-you-do-not-know 72/76
World Bank Study58
Jenkins, S. (1995). “Did the Middle Class Shrink During the 1980s? UK Evidence from
Kernel Density Estimates.” Economics Leers 49: 407–413.
Kanbur, R. (2009a). “The Crisis, Economic Development Thinking, and Protecting the
Poor.” Presentation to the World Bank’s Executive Board, 7 July 2009, Washing-
ton, DC. hp://www.kanbur.aem.cornell.edu/papers/WorldBankBoardPresenta-tion7July09.pdf.
——— (2009b). “Systemic Crises and the Social Protection System: Three Proposals for
World Bank Action.” Presentation to the World Bank’s Poverty Reduction and
Economic Management (PREM) Network, 28 April 2009, Washington, DC. hp://
www.kanbur.aem.cornell.edu/papers/SystemicCrisesAndTheSocialProtection-
System.pdf.
——— (2010a). “Macro Crises and Targeting Transfers to the Poor.” In Globalization and
Growth: Implications for a Post-Crisis World , eds. M. Spence and D. Lepiziger. Wash-
ington, DC: Commission on Growth and Development.
——— (2010b). “Protecting the Poor Against the Next Crisis.” Distinguished Lecture
Series, Egyptian Center for Economic Studies, Cairo, Egypt.
Kannan, P. (2009). “The Lingering Eff ects of Financial Crises.” VoxEU website (19 No-
vember). hp://www.voxeu.org/index.php?q=node/4232.
Kannan, P., A. Sco , and M. Terrones (2009). “From Recession to Recovery: A Long
and Hard Road.” VoxEU website (6 May). hp://www.voxeu.org/index.
php?q=node/3534.
Kennickell, A. (2009). “Ponds and Streams: Wealth and Income in the United States, 1989
to 2007.” Finance and Economics Discussion Series, Federal Reserve Board, Wash-
ington, DC.
Levy, F., and R. Murnane (1992). “U.S. Earnings Levels and Earnings Inequality: A Re-
view of Recent Trends and Proposed Explanations.” Journal of Economic Literature
30(3): 1333–81.
Narayan, D., and P. Petesch, eds. (2007). “Moving out of Poverty: Cross-Disciplinary
Perspectives on Mobility.” World Bank, Washington, DC.
Paci, P., B. Rijkers, and A. Revenga (2009). “Coping with Crisis. Why and How to Protect
Employment and Earnings.” Policy Research Working Paper 5094. World Bank,
Washington, DC.
Paci, P., B. Rijkers, and A. Seinaert (2008). “Crunch Time in the Developing World Too?
Policy Options for Dealing with the Potential Poverty and Distributional Im-pact of the Financial Crisis.” Poverty Reduction Group Policy Brief. World Bank,
Washington, DC.
Pikey, T., and E. Saez (2003). “Income Inequality in the United States: 1913–1998.”
Quarterly Journal of Economics 113(1): 1–39 (updated to 2008, available at: hp://
elsa.berkeley.edu/~saez/).
Ravallion, M. (2009). “The Developing World’s Bulging (But Vulnerable) Middle Class.”
Policy Research Working Paper 4816. World Bank, Washington, DC.
Sabarwal, S., N. Sinha, and M. Buvinic (2010). “How do Women Weather Economic
Shocks. What We Know.” PREM Economic Premise 46. World Bank, Washington,
DC.Spence, M., and D. Leipziger, eds. (2010). Globalization and Growth: Implications for a Post-
Crisis World. Washington, DC: Commission on Growth and Development.
8/3/2019 Knowing When You Do Not Know
http://slidepdf.com/reader/full/knowing-when-you-do-not-know 73/76
Knowing, When You Do Not Know 59
Turk, C., and A. Mason (2009). “Impacts of the Economic Crisis in East Asia: Findings
from Qualitative Monitoring in Five Countries.” In Poverty and Sustainable Devel-
opment in Asia: Impacts and Responses to the Global Economic Crisis, eds. Bauer, A.,
and M. Thant. Manila, the Philippines: Asian Development Bank.
United States Vice President’s Task Force on the Middle Class (2010). Annual Report of theWhite House Task Force on the Middle Class. Washington, DC.
World Bank (2010a). “Household Welfare in the Face of Economic Slowdown: Results
from Five Urban City Centers in Turkey.” Report No. 55062-TR, Human Develop-
ment Network, Eastern Europe and Central Asia Region. World Bank, Washing-
ton, DC.
——— (2010b). “Armenia: The 2008–09 Global Economic Crisis, Policy Responses, and
Household Coping Strategies.” World Bank, Washington, DC.
——— (2010c). “Recent Trends and Forecasts of Poverty in Mexico: A Poverty Note.”
Latin America and the Caribbean Region. Draft. World Bank, Washington, DC.
——— (2011). “The Jobs Crisis. Household and Government Responses to the Great
Recession in Eastern Europe and Central Asia.” World Bank, Washington, DC.
8/3/2019 Knowing When You Do Not Know
http://slidepdf.com/reader/full/knowing-when-you-do-not-know 74/76
ECO-AUDIT Environmental Bene fits Statement
The World Bank is committed to preserving en-
dangered forests and natural resources. The Of-
fice of the Publisher has chosen to print World
Bank Studies and Working Papers on recycled
paper with 30 percent postconsumer fi ber in
accordance with the recommended standards
for paper usage set by the Green Press Initia-
tive, a nonprofit program supporting publish-
ers in using fi ber that is not sourced from en-
dangered forests. For more information, visit
www.greenpressinitiative.org.
In 2010, the printing of
this book on recycled paper
saved the following:
• 11 trees*
• 3 million Btu of total energy
• 1,045 lb. of net greenhouse
gases
• 5,035 gal. of waste water
• 306 lb. of solid waste
* 40 feet in height and 6–8 inches in
diameter

8/3/2019 Knowing When You Do Not Know
http://slidepdf.com/reader/full/knowing-when-you-do-not-know 75/76
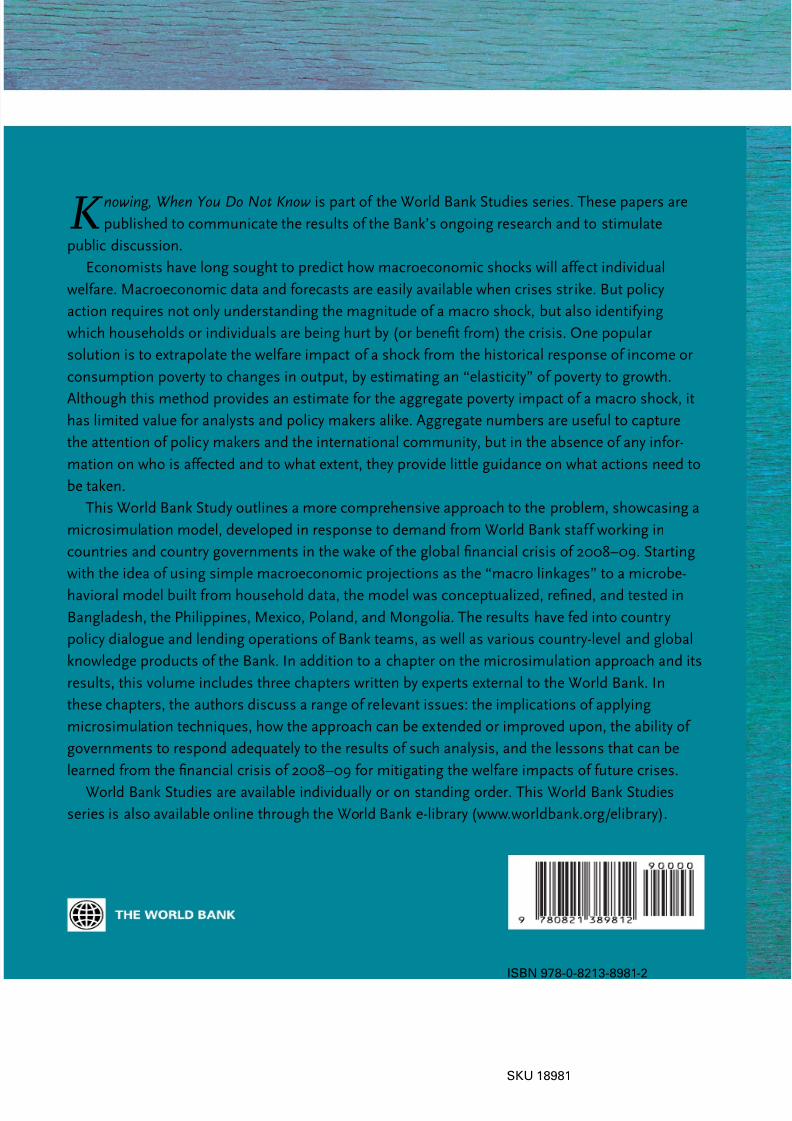
8/3/2019 Knowing When You Do Not Know
http://slidepdf.com/reader/full/knowing-when-you-do-not-know 76/76
K nowing, When You Do Not Know is part of the World Bank Studies series. These papers are
published to communicate the results of the Bank’s ongoing research and to stimulate
public discussion.
Economists have long sought to predict how macroeconomic shocks will affect individual
welfare. Macroeconomic data and forecasts are easily available when crises strike. But policy
action requires not only understanding the magnitude of a macro shock, but also identifying
which households or individuals are being hurt by (or benefit from) the crisis. One popular
solution is to extrapolate the welfare impact of a shock from the historical response of income or
consumption poverty to changes in output, by estimating an “elasticity” of poverty to growth.
Although this method provides an estimate for the aggregate poverty impact of a macro shock, it
has limited value for analysts and policy makers alike. Aggregate numbers are useful to capture
the attention of policy makers and the international community, but in the absence of any infor-
mation on who is affected and to what extent, they provide little guidance on what actions need to
be taken.
This World Bank Study outlines a more comprehensive approach to the problem, showcasing a
microsimulation model, developed in response to demand from World Bank staff working in
countries and country governments in the wake of the global financial crisis of 2008–09. Starting
with the idea of using simple macroeconomic projections as the “macro linkages” to a microbe-
havioral model built from household data, the model was conceptualized, refined, and tested in
Bangladesh, the Philippines, Mexico, Poland, and Mongolia. The results have fed into country
policy dialogue and lending operations of Bank teams, as well as various country-level and global
knowledge products of the Bank. In addition to a chapter on the microsimulation approach and its
results, this volume includes three chapters written by experts external to the World Bank. In
these chapters, the authors discuss a range of relevant issues: the implications of applying
microsimulation techniques, how the approach can be extended or improved upon, the ability of
governments to respond adequately to the results of such analysis, and the lessons that can be
learned from the financial crisis of 2008–09 for mitigating the welfare impacts of future crises.
World Bank Studies are available individually or on standing order. This World Bank Studies
series is also available online through the World Bank e-library (www.worldbank.org/elibrary).