kim$fowler$m.sc.,’mcip’ financial’costsof’ growth
TRANSCRIPT

Financial Costs of Growth for Municipalities
GFOA Conference May 30, 2012 Calgary, AB
Kim Fowler M.Sc., MCIP

Overview
Sustainability integration 4 main risks climate change, infrastructure replacement, aging population, First Nations Sustainability and Triple Bottom Line Accounting vs. Conventional Economic Costing What does climate change, change financially? Canadian municipal infrastructure liability and risk costs Practical case studies Sprawl versus Sustainability why?
May 30, 2012 www.SustainabilityMakesCents.com 2

Sustainability is the quality of a process or state allowing it to be maintained indefinitely. The principles of sustainability integrate three closely interlinked elements the Environment, Economy, and social Equity into a system that can be maintained in a healthy state indefinitely. Elements together often called E3 integration.
Sustainability Defined
May 30, 2012 www.SustainabilityMakesCents.com 3

June 11, 2012 www.SustainabilityMakesCents.com 4

VANOC Sustainability Group*
Only 47% of Canadians & 68% of BC have heard of sustainability 80% of Canadians rate sustainability as a top or high priority national goal 85% agree we need stricter laws and regulations to protect the environment 92% approve of mandatory standards requiring all new buildings and appliances to deliver 50% more energy efficiency within 10 years Most Canadians do not think individual actions will make a difference
* Survey by James Hoggan & Associates

Climate Change

Sustainability & Climate Change
The Canadian Council of Chief Executives stated
that sustainable development is "the most
fundamental challenge facing the world today,
and ... climate change represents the most
pressing and daunting issue" facing business,
government and the public.
May 30, 2012 www.SustainabilityMakesCents.com 7

The evidence shows that ignoring climate change will eventually damage economic growth. Our actions over the coming few decades could create risks of major disruption to economic and social activity, later in this century and in the next, on a scale similar to those associated with the great wars and the economic depression of the first half of the 20th century. And it will be difficult or impossible to reverse these changes. Tackling climate change is the pro-‐growth strategy for the longer term, and it can be done in a way that does not cap the aspirations for growth of rich or poor countries. The earlier effective action is taken, the less costly it will be.
-‐ Oct 30, 2006
Economics of Climate Change Lord Stern Review

DANGER Municipal Infrastructure
FCM, November 2007
Canadian municipalities own and maintain most of the infrastructure.
The infrastructure supports our economy and quality of life.
The majority of the infrastructure was built between 1950 and 1970 and is due for replacement.
The condition of the infrastructure is deteriorating and the cost of maintaining it is increasing.
The infrastructure deficit has increased from $12 billion (1985) to $123 billion (2007) within Canada.
May 30, 2012
www.SustainabilityMakesCents.com 9

Debt Financing & Community Expectations
Several generations raised on debt financing of major social benefits Debt reductions from 1990 have caused social concerns & downloading with 8 cents/$ of tax pie
paid) for them
Current funding
Capital funding gap
Historical expectation
Current service level
May 30, 2012 www.SustainabilityMakesCents.com 10

Infrastructure Deficit/Liability City of Victoria Case Study
$467 million capital infrastructure deficit ($1.74 billion replacement cost) 59% buildings are past their useful life (O & M 50%) Options to make up this deficit are:
Raise property taxes Find new sources of revenue Reduce or eliminate some infrastructure Reduce or eliminate services Seek private capital partnerships
May 30, 2012 www.SustainabilityMakesCents.com 11
Source: http://www.civicinfo.bc.ca/Library/Asset_Management/Presentations/Infrastructure_Review_and_Assessment_Model_Presentation-‐-‐Victoria-‐-‐May_2010.pdf

Water System -‐ Age Profile
0
10,000
20,000
30,000
40,000
50,000
60,000
Prior to1900
1900-1909
1910-1919
1920-1929
1930-1939
1940-1949
1950-1959
1960-1969
1970-1979
1980-1989
1990-1999
2000-2005
Year of Installation
Le
ng
th o
f Pip
e In
sta
lled
(m)
May 30, 2012 www.SustainabilityMakesCents.com 12
Source: http://www.civicinfo.bc.ca/Library/Asset_Management/Presentations/Infrastructure_Review_and_Assessment_Model_Presentation-‐-‐Victoria-‐-‐May_2010.pdf

Storm Drain System -‐ Age Profile
010,00020,00030,00040,00050,00060,00070,000
Priorto
1900
1900-1909
1910-1919
1920-1929
1930-1939
1940-1949
1950-1959
1960-1969
1970-1979
1980-1989
1990-1999
2000-2007
Year of Installation
Le
ng
th o
f P
ipe
In
sta
lled
(m)
May 30, 2012 www.SustainabilityMakesCents.com 13
Source: http://www.civicinfo.bc.ca/Library/Asset_Management/Presentations/Infrastructure_Review_and_Assessment_Model_Presentation-‐-‐Victoria-‐-‐May_2010.pdf

Sewer System -‐ Age Profile
020,00040,00060,00080,000
100,000120,000
Priorto
1900
1900-1909
1910-1919
1920-1929
1930-1939
1940-1949
1950-1959
1960-1969
1970-1979
1980-1989
1990-1999
2000-2007
Year of Installation
Le
ng
th o
f P
ipe
In
sta
lled
(m)
May 30, 2012 www.SustainabilityMakesCents.com 14
Source: http://www.civicinfo.bc.ca/Library/Asset_Management/Presentations/Infrastructure_Review_and_Assessment_Model_Presentation-‐-‐Victoria-‐-‐May_2010.pdf

May 30, 2012 www.SustainabilityMakesCents.com 15
Current Funding Levels Compared to Necessary Levels
0
5
10
15
20
25
Buildings Water Drain Sewer Roads(paving
only)
Total
Fund
ing
(Mill
ions
of D
olla
rs 2
008)
Budgeted Annual FundingRequired Annual Funding
Source: http://www.civicinfo.bc.ca/Library/Asset_Management/Presentations/Infrastructure_Review_and_Assessment_Model_Presentation-‐-‐Victoria-‐-‐May_2010.pdf
May 30, 2012 www.SustainabilityMakesCents.com 16
Source: Top Images from Internet 2008
May 30, 2012 www.SustainabilityMakesCents.com 17

Source: CaGBC

North

www.docksidegreen.ca
North

June 11, 2012 www.SustainabilityMakesCents.com 21

Port Coquitlam Sustainability Initiative
1. Strategic Plan & Official Community Plan 2. Annual departmental business plans 3. Triple Bottom Line Assessment matrix for annual budget requests 4. Sustainability Checklist for RZ and DP applications 5. Green building technology for City buildings 6. Green building & social housing incentive policy + social housing fund 7. Social planning study 8. Green roof regulation 9. Cash-‐in-‐lieu parking variance 10. City land sales project 11. Tree Bylaw 12. Potable water source control program
May 30, 2012 www.SustainabilityMakesCents.com 22

Europe 2020 Strategy Priorities & Targets
1. Smart growth: developing an economy based on knowledge and innovation
2. Sustainable growth: promoting a more resource efficient, greener and more competitive economy
3. Inclusive growth: fostering a high-‐employment economy delivering social and territorial cohesion
75 % of the population aged 20-‐64 should be employed 3% of the EU's GDP should be invested in R&D The "20/20/20" climate/energy targets should be met The share of early school leavers should be under 10% and at least 40% of the younger generation should have a tertiary degree 20 million less people should be at risk of poverty
May 30, 2012 www.SustainabilityMakesCents.com 23

Sustainability Challenges
Cheap plentiful resources (water, electricity, land, oil & gas) Social dream of SFD with white picket fence this is demand Inelastic response to commute times & elastic response to costs will be too late Development charges norm instead of full cost recovery Short term, non-‐integrated fiscal planning cycle 4 new major risks Social service and amenity cost externalities Assumption of continued growth Car dependent infrastructure Provincial planning legislation encourages sprawl over infill
May 30, 2012 www.SustainabilityMakesCents.com 24

Municipal Tools & Techniques
Alberta GFOA Conference May 30, 2012 Calgary, AB
Kim Fowler M.Sc., MCIP
June 11, 2012 www.SustainabilityMakesCents.com 25

Costs of Sprawl
The project of suburbia is the greatest misallocation of resources in the history of the world. America has squandered its wealth in a living arrangement that has no future.
-‐ James Howard Kunstler, The End of Suburbia
June 11, 2012 www.SustainabilityMakesCents.com 26

Benefits of Smart Growth
June 11, 2012 www.SustainabilityMakesCents.com 27

June 11, 2012 www.SustainabilityMakesCents.com 28

June 11, 2012 www.SustainabilityMakesCents.com 29

CMHC Tool for Costing Sustainable Community Planning: User Guide
Allows users to estimate major costs of community development, particularly those that change with different forms of development (e.g., linear infrastructure) and to compare alternative development scenarios. Geared -‐and revenues associated with the residential component of a development. Hard infrastructure, municipal services, private user costs, external costs and green infrastructure alternatives are 4 major categories.
June 11, 2012 www.SustainabilityMakesCents.com 30

Asset Management BC
June 11, 2012 www.SustainabilityMakesCents.com 31

Asset Management Principles
1. 2. Define its quality/level 3. Include O&M within life cycle 4. All infrastructure activities are
interdependent
June 11, 2012 www.SustainabilityMakesCents.com 32

June 11, 2012 www.SustainabilityMakesCents.com 33

Op & Maintenance Significance
June 11, 2012 www.SustainabilityMakesCents.com 34

June 11, 2012 www.SustainabilityMakesCents.com 35

June 11, 2012 www.SustainabilityMakesCents.com 36

Asset Management BC
Model AM Policy State of AM in BC report AM Self Assessment Tool & Road Map Workshops & Regional Presentations Web site, newsletter and partnerships
http://www.bcassetmanagement.ca
June 11, 2012 www.SustainabilityMakesCents.com 37

Lynx Capital Planning & Management System
Infrastructure tool, based on full life cycle & triple bottom line analysis, is international standard compliant and fully scalable Developed in consultation with 4 universities (3 Canadian and 1 UK) Now finding partner municipalities for case studies to populate & web-‐base the tool
May 30, 2012 www.SustainabilityMakesCents.com 38

Key Issues
Addresses NPV issues & promotes renewable energy revenue $345 million wastewater treatment plant in BC -‐ correctly estimated at $1.1 billion in life cycle costs When 7 renewable technologies are included, the net total cost is $108 million in revenue for local government
May 30, 2012 www.SustainabilityMakesCents.com 39

Development Fees & Cost Charges
Full cost accounting and life cycle analysis Cost recovery of development fees &
Robin Hood incentives Complete application policy
June 11, 2012 www.SustainabilityMakesCents.com 40

June 11, 2012 www.SustainabilityMakesCents.com 41

Points Wt
Tot Soc Env Eco
4. Environmental Protection & Enhancement a) Lands
Does not intrude on ALR or designated open lands Protects riparian areas and other designated environmentally sensitive areas Provides for native species habitat restoration/improvement Redevelops environmentally contaminated site
None 0 Poor 1
Good - 2 to 3 Excellent 4
to 5
2
/10
b) Servicing Does not require extension of existing municipal infrastructure (roads, water, sewer)
Located in existing commercial and transportation nodes
None 0 Poor 1
Good - 2 to 3 Excellent 4 to
5
1
/5
c) Construction/Design Provides LEED certification (certified, silver, gold, platinum) or accepted green building
best practices (e.g. Built Green BC, Green Globes, UBC EAP for Housing)
None 0 Certified 2
Silver 3 Gold 4
Platinum - 5
4
/20
5. Social Equity
Contains elements of community pride and local character, such as public art Provides affordable space for needed community services Conducts public consultation, including documenting concerns & providing project visuals
None 0 Poor 1
Good - 2 to 3 Excellent 4 to
5
2
/10
6. Economic Development
a) Employment Provides permanent employment opportunities Increases community opportunities for training, education, entertainment or recreation
None 0 Poor 1
Good - 2 to 3 Excellent 4 to
5
1
/5
b) Diversification and Enhancement Net increase to property tax base Promotes diversification of the local economy via business type and size
Improves opportunities for new and existing businesses, incl. eco-industrial & value-added Developer demonstrates success with similar projects
None 0 Poor 1
Good - 2 to 3 Excellent 4 to
5
1
/5
T RIPL E B O T T O M L IN E SU M M A RY Application Total
/35 ( %)
/35 ( %)
/35 ( %)
/105 ( %)
Social/Environmental/E conomic
Sustainability Checklist page 2

Area Factors CE-R
-N-19
3400
Bloc
k St. A
nne S
treet
CE-R
-N-20
Side
walks
- Mary
Hill
Road
CE-R
-N-21
Loca
l Area
Serv
ices
CP-P
-N-01
Ligh
ts-Ga
tes P
ark B
aseb
all Fi
eld
CS-I-N
-04 D
ocum
ent M
anag
emen
t Sys
tem
CS-I-N
-06 H
uman
Res
ource
Sys
tem
CS-I-N
-07 Fi
nanc
ial R
eport
ing
CS-I-N
-08 B
udge
t Rev
iew
CS-I-N
-09 C
lass t
o Cay
enta
Integ
ration
CS-I-N
-10 Te
mpes
t to C
ayen
ta Int
egrat
ion
A Strategic Plan Alignment
Mobility and Access, Protect Infrastructure, Complete Community, Safety, Customer Service, Strategic Alliances, Financial Stability, Strong Organization
B Financial/Economic Value
Increased revenues, cost savings/avoidance, productivity improvements, minimize risk , increase economic opportunities
Tangible benefits
C Social/Community Value
Improve Ee safety or morale, enhance citizen participation, strengthen neighbourhoods, improve service/image/decision making
Intangible benefits
D Environmental Value
Enhance natural areas/green space, reduce air emissions, encourage environmental stewardship, contribute to regional sustainability
E Risk Organizational change risk , tech risk , etc.
Liklihood of achievment'
Proposal score 0.0 0.0 0.0 0.0 0.0 0.0 0.0 0.0 0.0 0.0
Scoring Rank on a scale of 1 to 10A the greater the alignment the higher the scoreBCD the greater the benefit the higher the scoreE the lower the risk the higher the score
20%
20%
20%
20%
20%
Decision Matrix for 2006 Operating & Capital Budget
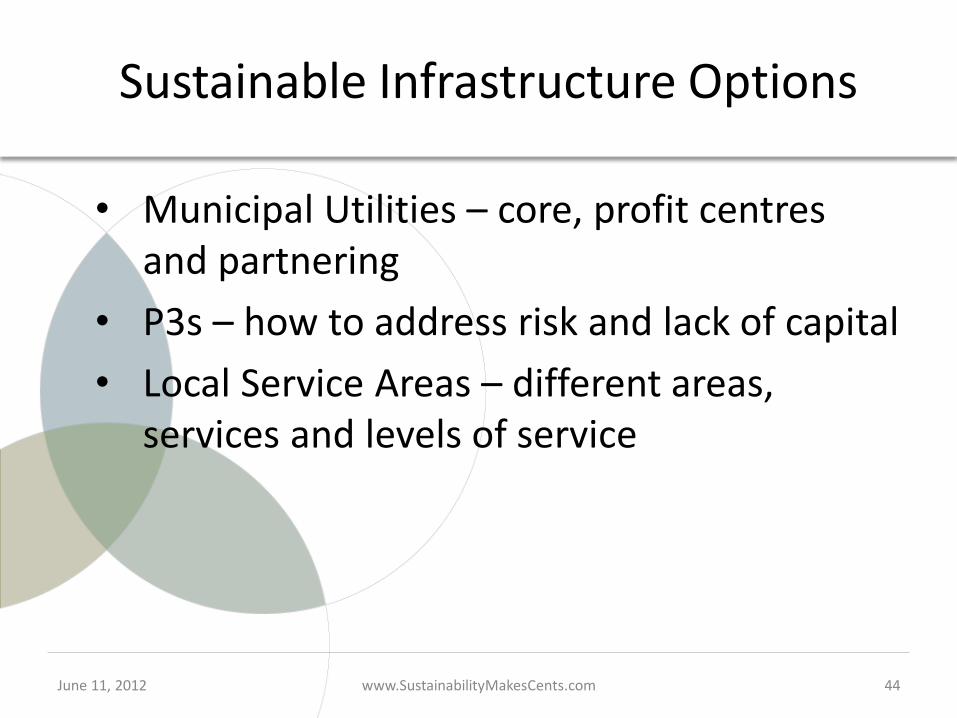
Sustainable Infrastructure Options
Municipal Utilities core, profit centres and partnering P3s how to address risk and lack of capital Local Service Areas different areas, services and levels of service
June 11, 2012 www.SustainabilityMakesCents.com 44

Civic Engagement
Dockside example Municipal finance & AM Kitchen table sustainability Options, timing and frequency The great and the bad messages = trust Lobbying
June 11, 2012 www.SustainabilityMakesCents.com 45

Legal, Political & Administrative Issues
Professional codes of conduct & liability Municipal liability Political will opportunity/innovation Administrative leadership level of service, risk management and accountability
= Legacy
June 11, 2012 www.SustainabilityMakesCents.com 46

June 11, 2012 www.SustainabilityMakesCents.com 47

June 11, 2012 www.SustainabilityMakesCents.com 48

June 11, 2012 www.SustainabilityMakesCents.com 49

June 11, 2012 www.SustainabilityMakesCents.com 50

June 11, 2012 www.SustainabilityMakesCents.com 51
June 11, 2012 www.SustainabilityMakesCents.com 52

June 11, 2012 www.SustainabilityMakesCents.com 53

June 11, 2012 www.SustainabilityMakesCents.com 54

June 11, 2012 www.SustainabilityMakesCents.com 55

June 11, 2012 www.SustainabilityMakesCents.com 56

June 11, 2012 www.SustainabilityMakesCents.com 57
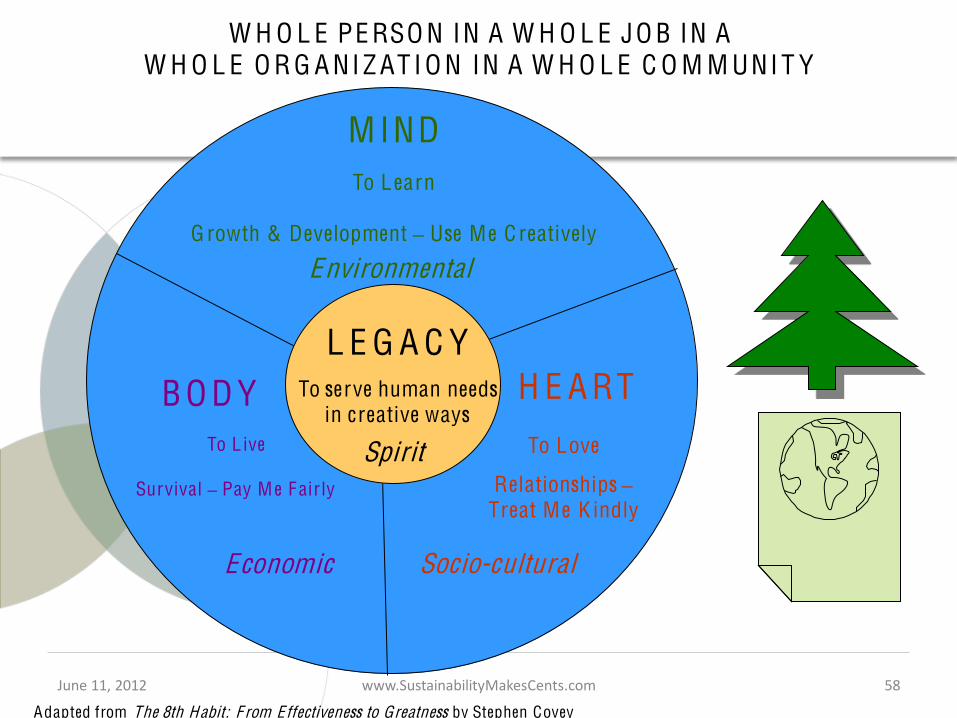
June 11, 2012 www.SustainabilityMakesCents.com 58
M IND
To L earn
G rowth & Development Use Me C reatively
H E A RT
To Love
Relationships Treat Me K indly
B O D Y
To L ive
Survival Pay M e F air ly
L E G A C Y
To serve human needs in creative ways
Adapted from The 8th Habit: F rom Effectiveness to Greatness by Stephen Covey
Spirit
Environmental
Socio-cultural Economic
W H O L E PE RSO N IN A W H O L E JO B IN A W H O L E O R G A NI Z AT I O N IN A W H O L E C O M M UNI T Y

Kim Fowler, M.Sc., MCIP, RPP Sustainability Planning & Integration Specialist
phone: (001*) 250-‐858-‐8905
email: [email protected]
www.SustainabilityMakesCents.com
Discussion