keysight technologiesliterature.cdn.keysight.com/litweb/pdf/5989-4946en.pdf · ·...
TRANSCRIPT

Keysight Technologies X-Series Signal AnalyzersPreselector Tuning for Amplitude Accuracy in Microwave Spectrum Analysis
Application Note

Modern spectrum analyzers operating up to 26.5 GHz have a “low band” and a “high band” signal path, as shown in the simplified block diagram, Figure 1.
The “low band” in the X-Series signal analyzers covers frequencies up to 3.6 GHz. In low band, the signal is up-converted to a high IF (5.1225 GHz), then downconverted to an IF of 322.5 MHz. This double conversion scheme dramatically reduces mixer image responses.
“High band” frequency ranges cannot practically be built with the same block diagram as low band because the first IF amplifier would have to work at a frequency where the amplifier noise and
YIG-tunedpreselector
1st LO
LPF
LOHI
IFout
2nd LO1st IFamp
LOHI
LOHI BPF
Figure 1: Block diagram of low-band/high-band spectrum analyzer front end
Introduction
While modern spectrum analyzers have been evolving to provide ever-better accuracy at RF frequencies, their accuracy at microwave frequencies has not generally been improving. Indeed the requirements placed on the analyzer user to achieve the best accuracy have become harder to realize with modern signals such as wideband digital modulation. Hardware and algorithms in the X-Series signal analyzers help you maintain the best accuracy without requiring a specific kind of input signal or external test signal.Microwave spectrum analyzers use preselectors to improve performance by
distortion would inevitably be higher than users want. The alternative block diagram is a single conversion to the IF frequency as shown in Figure 1. In this block diagram, image responses in the first mixer are spaced by only twice the IF frequency, or about 600 MHz. Such images are unac-ceptable in a general purpose spectrum analyzer. Thus the tunable preselector (band-pass filter) is used to filter out the images.
This filter is built using YIG (yttrium- iron-garnet) technology. Spheres of YIG material act to filter the signal with a passband frequency that is controlled by a magnetic field.
Table of Contents
Introduction ...................................... 2
Low band, high band, and preselection ...................................... 2
Problems with YIG Preselectors ...... 3
Operation of and requirements for preselector centering ................. 5
A new centering capability .............. 6
Using the X-Series preselector centering capability ......................... 7
Summary .......................................... 7
Low Band, High Band, and Preselection
removing unwanted mixer images and responses to local oscillator (LO) harmon-ics. Unfortunately these preselectors have instabilities and must be retuned frequent-ly, and the preselector tuning previously required a signal of near-CW statistics at the frequency of interest. In the X-Series signal analyzers, noise-source tuning removes this difficult-to-satisfy requirement.
2 | Keysight | X-Series Signal Analyzers Preselector Tuning for Amplitude Accuracy in Microwave Spectrum Analysis - Application Note

YIG preselectors usually have a passband width of about 40 to 80 MHz. When used at frequencies up to 26.5 GHz, the required Qs of the resonators are very high. This high Q is accompanied by amplitude and frequency instabilities.
Post-tuning drift is one form of instability. The magnet used to tune the resonant frequency of the YIG spheres heats up or cools down as the selected change of the magnet affects the dimen-sions of the magnet and thus the magnetic field strength, and thus the frequency of the filter tuning.
Mechanical aging of the magnet/sphere structure works in the same way to cause further instabilities.
Also, the relationship between the tuning current and the filter center frequency is not perfectly modeled by any simple algebraic function. Therefore even without tuning instabilities, there are tuning errors. The result is that frequency tuning errors lead to amplitude errors, as demonstrated in Figure 2.
Problems with YIG Preselectors
4 dB
Gain Peak FrequencyFactory calibrationof amplitude ofcentered filter
Midpoint–4 dB frequency
Lower–4 dB frequency
Upper–4 dB frequency
Figure 2A: Typical passband response of a YIG-tuned preselector
Gain
FrequencyA
BD
GE
F
C
Figure 2B: YIG preselector passband response changes
3 | Keysight | X-Series Signal Analyzers Preselector Tuning for Amplitude Accuracy in Microwave Spectrum Analysis - Application Note
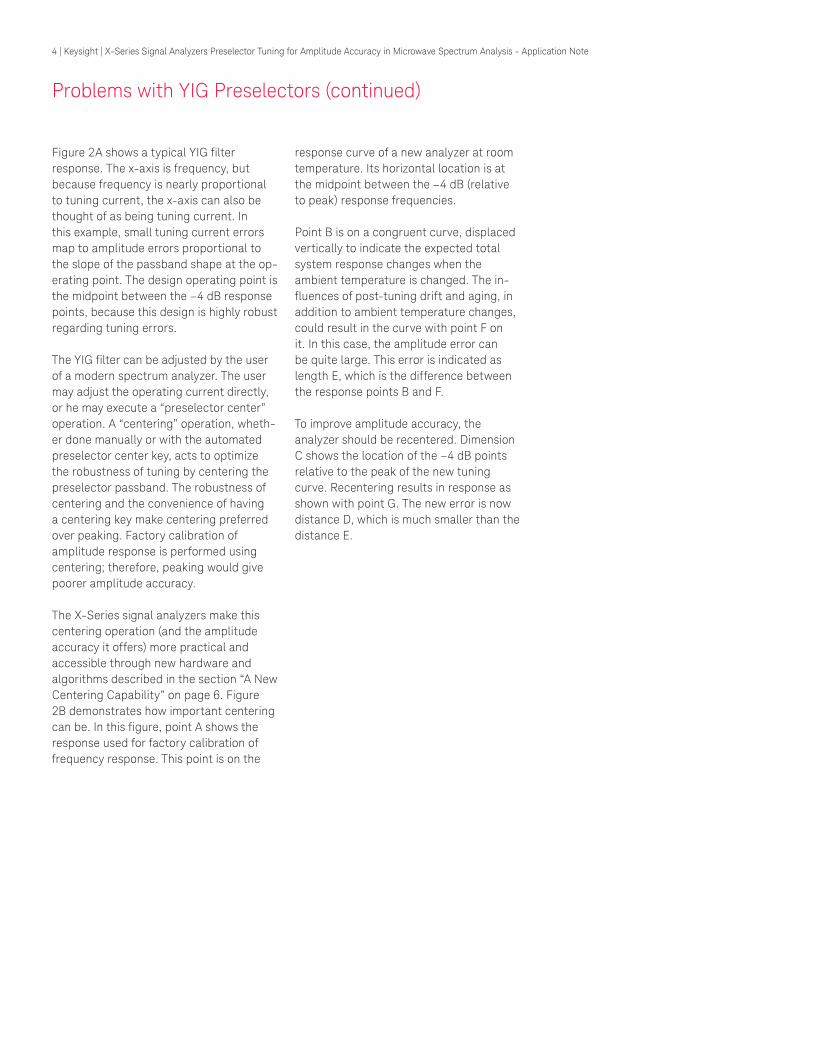
Figure 2A shows a typical YIG filter response. The x-axis is frequency, but because frequency is nearly proportional to tuning current, the x-axis can also be thought of as being tuning current. In this example, small tuning current errors map to amplitude errors proportional to the slope of the passband shape at the op-erating point. The design operating point is the midpoint between the –4 dB response points, because this design is highly robust regarding tuning errors.
The YIG filter can be adjusted by the user of a modern spectrum analyzer. The user may adjust the operating current directly, or he may execute a “preselector center” operation. A “centering” operation, wheth-er done manually or with the automated preselector center key, acts to optimize the robustness of tuning by centering the preselector passband. The robustness of centering and the convenience of having a centering key make centering preferred over peaking. Factory calibration of amplitude response is performed using centering; therefore, peaking would give poorer amplitude accuracy.
The X-Series signal analyzers make this centering operation (and the amplitude accuracy it offers) more practical and accessible through new hardware and algorithms described in the section “A New Centering Capability” on page 6. Figure 2B demonstrates how important centering can be. In this figure, point A shows the response used for factory calibration of frequency response. This point is on the
response curve of a new analyzer at room temperature. Its horizontal location is at the midpoint between the –4 dB (relative to peak) response frequencies.
Point B is on a congruent curve, displaced vertically to indicate the expected total system response changes when the ambient temperature is changed. The in-fluences of post-tuning drift and aging, in addition to ambient temperature changes, could result in the curve with point F on it. In this case, the amplitude error can be quite large. This error is indicated as length E, which is the difference between the response points B and F.
To improve amplitude accuracy, the analyzer should be recentered. Dimension C shows the location of the –4 dB points relative to the peak of the new tuning curve. Recentering results in response as shown with point G. The new error is now distance D, which is much smaller than the distance E.
Problems with YIG Preselectors (continued)
4 | Keysight | X-Series Signal Analyzers Preselector Tuning for Amplitude Accuracy in Microwave Spectrum Analysis - Application Note

Operation of and Requirements for Preselector Centering
The “preselector centering” algorithm measures the filter response in order to optimize the tuning. It assumes a CW-like input signal, and observes the relative response as the tuning current is swept. It searches this relative response curve for the –4 dB points, and centers the tuning between these points.
The input signal is required to have amplitude stability during the duration of the sweeping portion of the centering op-eration. This stability must be well under a decibel so that amplitude variations are not mistakenly treated as passband shape variations. The signal must have minimal frequency modulations as well, for similar reasons. While modulations that are well under 1 MHz in width are acceptable, wideband digital modulations can cause tuning errors. Finally, the signal must have a good signal-to-noise ratio.
These constraints on the input signal can be a problem in practical measurement applications, leading to measurements with significantly reduced amplitude accuracy. Centering cannot occur when measuring low-level harmon-ics, for example. Centering cannot be used to measure spot noise density. It can’t work with increasingly common digital communications signals such as OFDM, W-CDMA, or TDMA formats. It can’t work with most radar signals.
Thus, while spectrum analyzer specifica-tions for amplitude accuracy only apply following a preselector center operation, such operations are often impractical without the additional centering algorithms and hardware built into the X-Series signal analyzers.
5 | Keysight | X-Series Signal Analyzers Preselector Tuning for Amplitude Accuracy in Microwave Spectrum Analysis - Application Note

A New Centering Capability
If the analyzer had a full-range CW signal generator to use for preselector centering, the user would never need to provide a suitable signal. Unfortunately, such a capability isn’t economically feasible; however by employing a broadband noise generator and a new centering algorithm, centering without strict signal require-ments can be accomplished economically. The block diagram for this new approach, used in the X-Series signal analyzers, is shown in Figure 3.
At first glance, you might think that a noise source wouldn’t help tuning. After all, the amount of noise coming out of the filter is nearly independent of the tuning current. But the frequency distribution of that noise does change. The amount of noise that makes it to the IF will vary with the tuning current. See Figure 4.
By analyzing the curve of Figure 4, a preselector centering algorithm can center the passband using just the noise source.
Centering can be invoked at every frequency of interest to the user. But the built-in noise source also allows the factory calibration for the overall tuning curve to be implemented in the analyzer and be rerun at will, instead of only on a return to a fully equipped facility. Thus, the effects of aging and (to a much lower level of significance) ambient temperature changes can be removed by running the “characterize preselector” operation occasionally. With a well-characterized preselector, centering is rarely even need-ed. Not needing to re-center is even more convenient than a centering operation that doesn’t require CW-like signals.
Noisesource
LO
HI
Operate BPF
Align
1st LO
Figure 3: A noise source is added to the block diagram
Noise
leve
l dB
analyzer noise
noise source filtered
total noise
tuning current
Figure 4: The noise in the IF depends on the analyzer noise floor and the filter tuning
6 | Keysight | X-Series Signal Analyzers Preselector Tuning for Amplitude Accuracy in Microwave Spectrum Analysis - Application Note

Using the X-Series Preselector Centering Capability
Preselector centering should be manu-ally invoked whenever you want the best (specified) amplitude accuracy for signals in the X-Series' high band, or frequencies above 3.6 GHz.
Traditional centering operations require a signal at the frequency of interest, with a level that is within about 30 dB of the analyzer reference level. The analyzer marker is placed on this signal to identify it and the centering algorithm is invoked by a “Presel Center” softkey on the menu associated with the Amplitude hardkey. An alternative, for non-CW signals, is the “Presel Adjust” operation (and softkey of the same name), where the preselector is manually adjusted without the use of the automatic centering algorithm. This adjustment is normally made by “peaking” the amplitude response and, as described above, is not as robust of a technique for achieving the best amplitude accuracy.
Centering operations are virtually identical for the X-Series signal analyzers, except that no external signals are required, and there is no need for switching input signals or for disconnecting/reconnecting cables to the source being measured.
The frequency of interest is typically the analyzer’s center frequency, and so it is usually not necessary to activate the marker and move it to the signal of interest. Simply press the Amplitude hardkey followed by the “Presel Center” softkey.
The manual “Presel Adjust” function is also available in the X-Series signal analyzers and operates as it would with other spectrum analyzers, but without the need to supply a signal during adjustment.
Note that the preselector is in the signal path (and adjustments are useful) only if the analyzer is operating at frequencies over approximately 3.6 GHz. The prese-lector centering and adjustment softkeys are “ghosted’ and inactive if the analyzer is measuring lower frequencies.
Summary
With the addition of a noise source and a new tuning algorithm, the Keysight X-Series signal analyzers can meet their respective microwave amplitude accuracy specifications in the measurement of all signal types, not just high amplitude near-ly-CW signals. For example, in measuring a 40 MHz wide digitally modulated signal at a frequency of 6 GHz, the measurement accuracy without effective preselector centering is not specified and might be worse than –10 dB, while proper centering improves the figure to the warranted ±1.5 dB.
7 | Keysight | X-Series Signal Analyzers Preselector Tuning for Amplitude Accuracy in Microwave Spectrum Analysis - Application Note

This document was formerly known as application note 1586.
08 | Keysight | Preselector Tuning for Amplitude Accuracy in Microwave Spectrum Analysis - Application Note8 | Keysight | X-Series Signal Analyzers Preselector Tuning for Amplitude Accuracy in Microwave Spectrum Analysis - Application Note
This information is subject to change without notice.© Keysight Technologies, 2009 - 2017Published in USA, December 5, 20175989-4946ENwww.keysight.com